Embed Size (px)
Citation preview

OVERVIEW
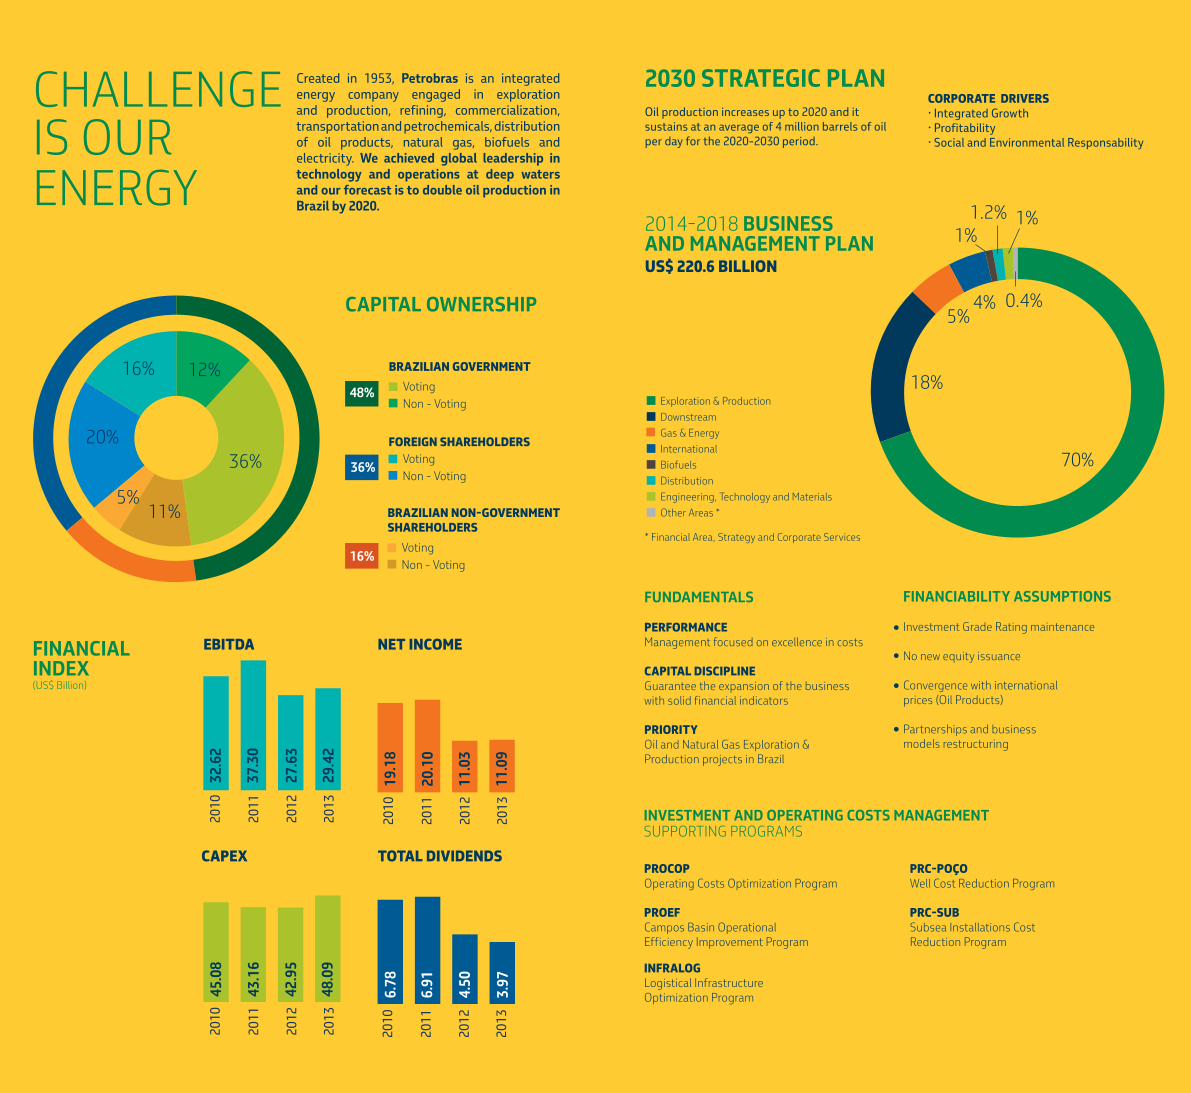
ChallEngE Is OuR EnERgy
36%
16%
5%
12%
20%
11%
Created in 1953, Petrobras is an integrated energy company engaged in exploration and production, refining, commercialization, transportation and petrochemicals, distribution of oil products, natural gas, biofuels and electricity. We achieved global leadership in technology and operations at deep waters and our forecast is to double oil production in Brazil by 2020.
Brazilian non-Government ShareholderS
Votingnon - Voting
16%
foreiGn ShareholderS Votingnon - Voting
36%
Brazilian Government
Votingnon - Voting
48%
2010
2011
2012
2013
32.6
2
37.3
0
27.6
3
29.4
2
eBitda net income
19.1
8
20.1
0
11.0
3
11.0
9
2010
2011
2012
2013
45.0
8
43.1
6
42.9
5
48.0
9
capex
2010
2011
2012
2013
6.78
6.91
4.50
3.97
total dividendS
2010
2011
2012
2013
Financialindex(us$ Billion)
caPital OWnershiP
1%1.2% 1%
0.4%
18%
5%4%
70%
2030 strategic Plan Oil production increases up to 2020 and it sustains at an average of 4 million barrels of oil per day for the 2020-2030 period.
corporate driverS• Integrated Growth• Profitability• Social and Environmental Responsability
2014-2018 Business and ManageMent PlanUS$ 220.6 billion
Exploration & Production
Downstream
gas & Energy
International
Biofuels
Distribution
Engineering, Technology and Materials
Other areas *
FundaMentals
performance Management focused on excellence in costs
capital diScipline guarantee the expansion of the business with solid financial indicators
priority Oil and natural gas Exploration & Production projects in Brazil
FinanciaBility assuMPtiOns
Investment grade Rating maintenance
no new equity issuance
Convergence with international prices (Oil Products)
Partnerships and business models restructuring
procopOperating Costs Optimization Program
proefCampos Basin Operational Efficiency Improvement Program
investMent and OPerating cOsts ManageMent suPPORTIng PROgRaMs
prc-poçoWell Cost Reduction Program
prc-SuBsubsea Installations Cost Reduction Program
infraloG logistical Infrastructure Optimization Program
* Financial area, strategy and Corporate services

exPlOratiOn & PrOductiOn
In 2013, oil and natural gas production was 2,320 thousand barrels of oil equivalent per day (boed), down 1% from 2012. The Campos Basin Operational Efficiency Increase Program contributed with 63 thousand barrels of oil per day (bpd) in additional oil production in 2013. The forecast for 2014 is a 7.5% increase in our oil production in Brazil.
pre-SaltTotal oil production from pre-salt areas rose 79% to 301,600 bpd in 2013, with successive records. accumulated production surpassed 290 million boe in only six years of production.
a record output of 412 thousand bpd was set on February 27, 2014. In the same month, the first well to produce using the innovative Buoyancy supported Risers (BsR) technology, on FPsO Cidade de são Paulo, started-up producing an impressive 36 thousand bpd.
exPlOratOry success and reserves increase in Brazil
Exploratory success Index: 75% (100% in Pre-salt)Reserve Replacement Index : 131% (above 100% for the 22nd consecutive year)Reserve/ Production Ratio (R/P) = 20 yearshighlights for Pre-salt and new exploratory frontiers discoveries (sergipe-alagoas and Potiguar).
Oil, ngl and natural gas PrOductiOn curve in Brazil
2013 2014 2015 2016 2017 2018 2019 2020
2.32
3.9
1.93
3.2
4.2
5.2
2014 growth:7.5% ± 1 p.p.
28 new platforms will start-up operation in the 2014-2018 period
Oil, NGL and Natural Gas Production (million boe)Oil and NGL Production (million bpd)
Proven reserves - sPe criteria (SOcIEty OF PEtrOlEum EngInEErS) (Billion Boe)
2003
2005
2007
2009
2011
2013
12.60
13.23
13.92
14.17
15.71
15.97
Platforms that will start-UP in 2014
production unit
p-58
p-62
p-61
fpSo cidade de ilhabela
fpSo cidade de mangaratiba
1St oil
1st quarter
2st quarter
2st quarter
3st quarter
4st quarter
capacity
180 kbpd
180 kbpd
P-63 will process the production of P-61
150 kbpd
150 kbpd
location
Pre-salt/ Post-salt
Post-salt
Post-salt
Pre-salt
Pre-salt
bASin
Campos
Campos
Campos
Santos
Santos
dOWnstreaM
Due to increased operational efficiency of refining facilities and greater use of logistical assets, in 2013 we processed 2,074 thousand bpd of oil and ngl (natural gas liquid), and produced 2,124 thousand bpd of oil products (6% more than in 2012).
Diesel and gasoline production record was set in august, with a daily average of 893,000 bpd and 515 thousand bpd, respectively. On January, 2014 gasoline s-50 was launched in Brazil. It has a maximum sulfur content of 50 parts per
new projectS
Abreu e lima refinery (1st phase) 2014 115 kbpd
Abreu e lima refinery (2nd phase) 2015 115 kbpd
comperj (1st phase) 2016 165 kbpd
Premium I (1st phase) 2018 300 kbpd
Premium II 2019 300 kbpd
unit tOtal caPacity
million and complies with changes to product specification. One of the main benefits of the new fuel is lower vehicular emissions of pollutants.
We sold 2,383 thousand bpd of oil products in the brazilian market, up 4% from 2012. Highlights were diesel (+5%), gasoline (+4%), and fuel oil (+17%). Oil exports fell 43% from 2012 to 207 thousand bpd and imports rose 17% to 404 thousand bpd.
therewith, our trade balance reported a deficit of us$ 16.2 billion.
start-UP

transPOrtatiOnOur subsidiary Transpetro operates 48 terminals, 53 ships, 7,517 km of oil pipelines and 7,152 km of gas pipelines. In 2013, 59.4 million tons of oil and oil products were transported and averaged 69.8 million m3/day were moved (up 15% from previous year’s average). under the Fleet Modernization and Expansion Program (Promef), three ships have been delivered in 2013.
BiOFuelsOur subsidiary Petrobras Biocombustível owns three plants and two others through partnership in Brazil. In 2013, total biodiesel production capacity rose from 765,000 m³/year to 821,000 m³/year.
We have an interest in nine ethanol plants through controlled companies. at the end of the 2013/2014 harvest, we achieved an ethanol output of 1.06 million m³ and 1.58 million tons of sugar.
internatiOnalWe are present in more than 20 countries. Our operations abroad focus on latin america, africa and the us and prioritize upstream. Investments abroad in 2013 were R$ 5.1 billion, 90% on upstream. Our output abroad was 128,500 barrels of oil per day and 15.5 million m³/day of natural gas, totaling 219,500 barrels of oil equivalent per day.
research & develOPMentThe leopoldo américo Miguez de Mello Research and Development Center (Cenpes), in Rio de Janeiro, coordinates the investments in Research & Development, that totaled R$ 2.4 billion in 2013, in partnerships with some universities and institutes, besides suppliers and other operating companies. some of the most important achievements were the development of new materials, design of systems to more accurately evaluate exploratory risk, lower well construction time and real time production monitoring.
gOvernance and sOcial and envirOnMental resPOnsiBilityWe are a public company and comply with stock market rules and capital market regulators in Brazil, the us, spain and argentina, where our shares are listed. We pursue management strategies and tools that are consistent with best corporate governance practices and have been listed in the Dow Jones sustainability Index World for eight years in a row.
In line with safety standards of our operations, most of our units in Brazil are IsO 14001 (environmental management) and Ohsas 18001 (occupational health and safety) certified. In 2013, investments on health, safety, and environment totaled R$ 5.7 billion.
Investments on social, environmental and sports projects were R$ 519.5 million. We also launched the Petrobras social and Environmental Program, which allocates R$ 1.5 billion for these areas from 2014 to 2018, and was based on un global Compact guidelines and IsO 26000 principles.
gas & energynatural gas supply in 2013 rose 15% compared to the previous year to 85.9 million m³/day. Brazil’s gas pipeline network totals 9,190 km and the volume of natural gas sold averaged 62.5 million m³/day, up 14% from 2012. We have an interest in 21 natural gas distribution companies whose combined sales were 33.2 million m3/day, or 53% of Brazil’s market.
We have three fertilizer plants in Brazil and, in 2013, we sold 1.06 million tons of urea and 189,000 tons of ammonia. We generated an average of 3,983 megawatts through 18 own and leased thermal power plants for the Brazilian national grid, up 48% from the previous year.
distriButiOn
Our subsidiary Petrobras Distribuidora sells and distributes oil products and biofuels. In 2013, it sold 53.7 million m³, up 4.5% from 2012. It is a leader in the Brazilian market, with a 37.5% market share and a network of 7,710 service stations. Its expenditures last year totaled R$ 1.03 billion, net operating revenue was R$ 86.6 billion and net income was a record R$ 1.8 billion.

P-61
P-55
Cidade de São Paulo
SS-88 TAD
P-58
P-62
Cidade de Itajaí
P-63
Cidade de Paraty
nine new platforms were completed in 2013.adding 1 million barrels of production capacity per day