Embed Size (px)
Citation preview
novagold.com
NYSE-MKT, TSX: NG | January 2015
2014 year-end financials & project update
Conference Call Attendees
2
▶ Introduction
Mélanie Hennessy (Vice President Corporate Communications)
▶ Corporate Update
Greg Lang (President & Chief Executive Officer)
▶ Fourth Quarter Financials & 2015 Budget
David Ottewell (Vice President & Chief Financial Officer)
▶ Closing Remarks
Greg Lang (President & Chief Executive Officer)
▶ Question & Answer Session
Greg Lang & David Ottewell
Cautionary Statements
REGARDING FORWARD-LOOKING STATEMENTS
This presentation includes certain “forward-looking statements” within the meaning of applicable securities laws, including the United States Private Securities Litigation Reform Act of 1995. All
statements, other than statements of historical fact, included herein including, without limitation, statements relating to Donlin Gold’s future operating or financial performance, are forward-
looking statements. Forward-looking statements are frequently, but not always, identified by words such as “plans”, “expects”, “anticipates”, “believes”, “intends”, “estimates”, “potential”,
“possible” and similar expressions, or statements that events, conditions or results “will”, “may”, “could”, or “should” occur or be achieved. These forward-looking statements are set forth in the
slides pertaining to the implementation of the Donlin Gold second updated Feasibility Study and pertaining to the implementation of the Galore Creek Pre-Feasibility Study, the factors that may
influence future gold price performance, and the potential future value of gold, and may include statements regarding perceived merit of properties; exploration results and budgets; mineral
reserves and resource estimates; work programs; capital expenditures; timelines; strategic plans; completion of transactions; market price of precious or base metals; or other statements that
are not statements of fact. Forward-looking statements involve various risks and uncertainties. There can be no assurance that such statements will prove to be accurate, and actual results and
future events could differ materially from those anticipated in such statements. Important factors that could cause actual results to differ materially from our expectations include the
uncertainties involving the need for additional financing to explore and develop properties and availability of financing in the debt and capital markets; uncertainties involved in the interpretation
of drilling results and geological tests and the estimation of reserves and resources; the need for continued cooperation between NOVAGOLD and Barrick Gold in the exploration and
development of the Donlin Gold property; the need for continued cooperation between NOVAGOLD and Teck Resources Ltd. in the exploration and development of the Galore Creek property;
the need for cooperation of government agencies and native groups in the development and operation of properties; the need to obtain permits and governmental approvals; risks of
construction and mining projects such as accidents, equipment breakdowns, bad weather, non-compliance with environmental and permit requirements, unanticipated variation in geological
structures, ore grades or recovery rates; unexpected cost increases; fluctuations in metal prices and currency exchange rates; and other risks and uncertainties disclosed in reports and
documents filed by NOVAGOLD with applicable securities regulatory authorities from time to time. The forward-looking statements made herein reflect our beliefs, opinions and projections on
the date the statements are made. Except as required by law, we assume no obligation to update the forward-looking statements of beliefs, opinions, projections, or other factors, should they
change.
REGARDING SCIENTIFIC AND TECHNICAL INFORMATION
Unless otherwise indicated, all reserve and resource estimates included in this presentation have been prepared in accordance with Canadian National Instrument 43-101 Standards of
Disclosure for Mineral Projects (“NI 43-101”) and the Canadian Institute of Mining, Metallurgy and Petroleum Definition Standards for Mineral Resources and Mineral Reserves (“CIM Definition
Standards”). Canadian standards, including NI 43-101, differ significantly from the requirements of the United States Securities and Exchange Commission (“SEC”), and reserve and resource
information in this presentation may not be comparable to similar information disclosed by U.S. companies. In particular, and without limiting the generality of the foregoing, the term “resource”
does not equate to the term “‘reserves”. Under U.S. standards, mineralization may not be classified as a “reserve” unless the determination has been made that the mineralization could be
economically and legally produced or extracted at the time the reserve determination is made. At this time, both of Donlin Gold and Galore Creek projects are without known reserves, as
defined under SEC Industry Guide 7. The SEC’s disclosure standards normally do not permit the inclusion of information concerning “measured mineral resources”, “indicated mineral
resources” or “inferred mineral resources” or other descriptions of the amount of mineralization in mineral deposits that do not constitute “reserves” by U.S. standards in documents filed with the
SEC. U.S. investors should also understand that “inferred mineral resources” have a great amount of uncertainty as to their existence and great uncertainty as to their economic and legal
feasibility. It cannot be assumed that all or any part of an “inferred mineral resource” will ever be upgraded to a higher category. Under Canadian rules, estimated “inferred mineral resources”
may not form the basis of feasibility or pre-feasibility studies except in rare cases. Investors are cautioned not to assume that all or any part of an “inferred mineral resource” exists or is
economically or legally mineable. Disclosure of “contained ounces” in a resource is permitted disclosure under Canadian regulations; however, the SEC normally only permits issuers to report
mineralization that does not constitute “reserves” by SEC standards as in-place tonnage and grade without reference to unit measures. The requirements of NI 43-101 for identification of
“reserves” are also not the same as those of the SEC, and reserves reported in compliance with NI 43-101 may not qualify as “reserves” under SEC standards. Accordingly, information
concerning mineral deposits set forth herein may not be comparable to information made public by companies that report in accordance with United States standards.
3 All dollar amounts quoted in this report are in U.S. currency unless otherwise noted.
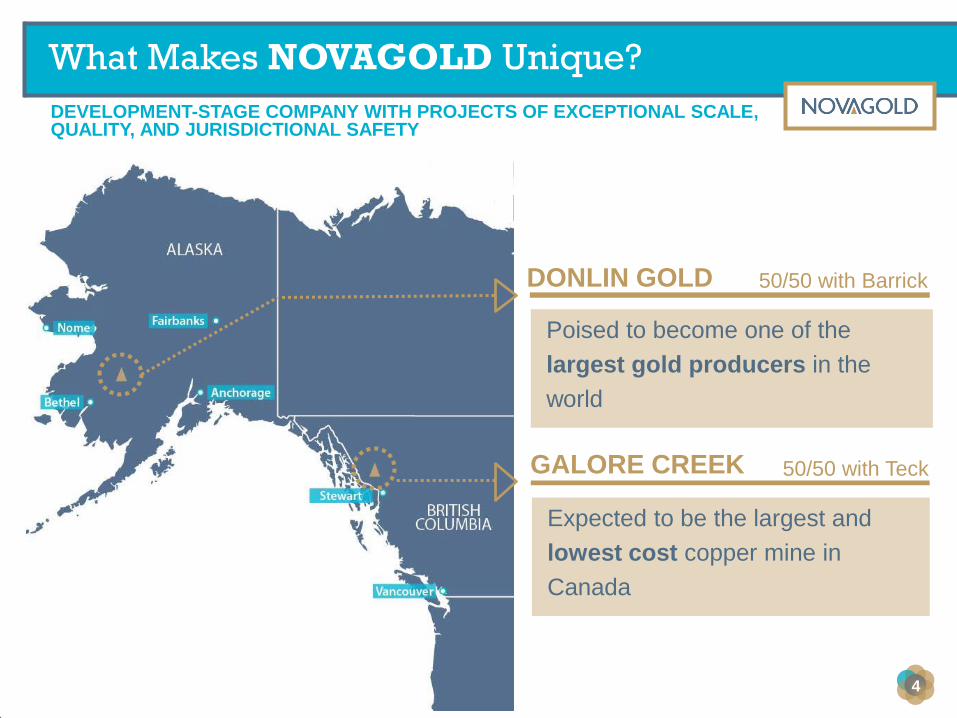
DEVELOPMENT-STAGE COMPANY WITH PROJECTS OF EXCEPTIONAL SCALE, QUALITY, AND JURISDICTIONAL SAFETY
What Makes NOVAGOLD Unique?
DONLIN GOLD
GALORE CREEK
4
Poised to become one of the
largest gold producers in the
world
Expected to be the largest and
lowest cost copper mine in
Canada
50/50 with Barrick
50/50 with Teck
PROGRESS MADE ON ALL FRONTS
2014 Achievements
▶ Significantly advanced permitting of Donlin Gold:
• Development of alternatives for the EIS completed by the Corps, the lead permitting agency
• The Corps also finalized initial chapters of the Donlin Gold draft EIS
• Donlin Gold made submissions of information requested by the Corps for the draft EIS
• Worked with permitting agencies on other major permit applications (i.e. air quality, water
discharge and usage, gas pipeline, wetlands, rights-of-way, and dam safety)
▶ Built upon extensive local outreach efforts in Alaska:
• Informational village meetings in the Yukon-Kuskokwim region where Donlin Gold is located
• Funded youth educational programs, resources and camps
• Sponsored, participated and volunteered in various state-wide and local events
5
PROGRESS MADE ON ALL FRONTS
2014 Achievements
▶ Formed and strengthened partnerships
• Secured extension of the Donlin Gold Surface Use Agreement with The Kuskokwim
Corporation (TKC)
• Partnered with the National Fish and Wildlife Foundation (NFWF) to protect, conserve and
restore Alaska’s fish and wildlife
▶ Maintained a strong financial position to execute on all fronts:
• Total spending was 14% lower than budget in 2014
• $165 million in cash and term deposits
6
ALL ACCOMPLISHED WHILE SAFEGUARDING
OUR CASH POSITION

2014 Project Activity
▶ Donlin Gold
o Activities continue to focused on the draft EIS and permits
o Continued community engagements and development initiatives
o Project funding (NG 50% share)
• Q4-2014: $2.8 million
• FY-2014: $13.9 million
• FY-2015: $12.6 million
▶ Galore Creek
o Technical studies with Teck, focusing on mine planning and project design
o Project funding (NG 50% share)
• Q4-2014: $0.2 million
• FY-2014: $2.1 million
• FY-2015: $1.6 million
7
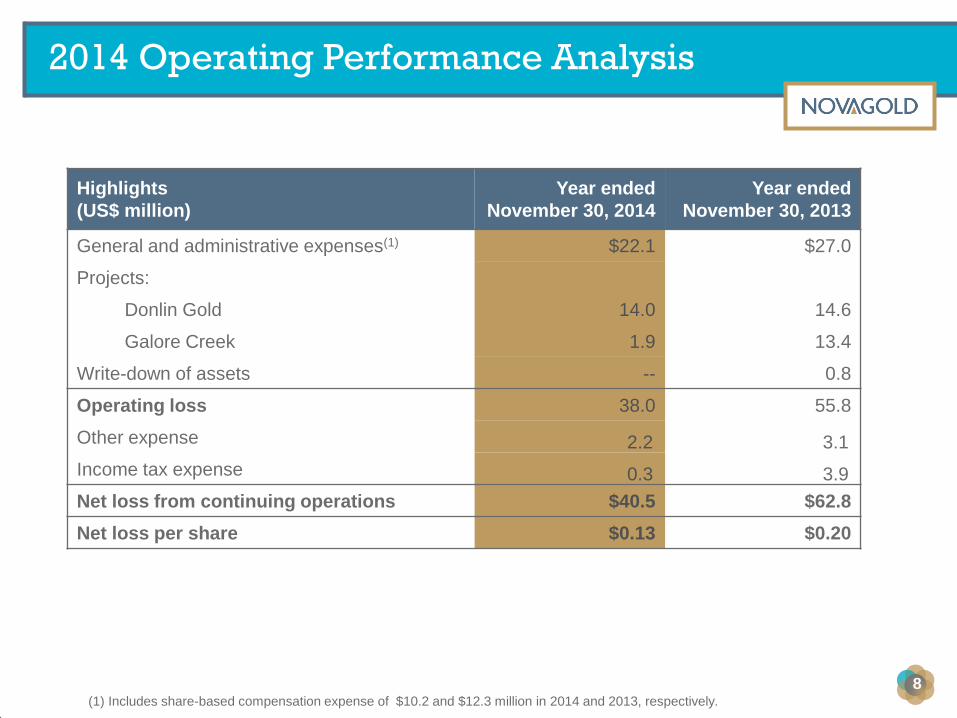
2014 Operating Performance Analysis
8
Highlights
(US$ million)
Year ended
November 30, 2014
Year ended
November 30, 2013
General and administrative expenses(1) $22.1 $27.0
Projects:
Donlin Gold 14.0 14.6
Galore Creek 1.9 13.4
Write-down of assets -- 0.8
Operating loss 38.0 55.8
Other expense 2.2 3.1
Income tax expense 0.3 3.9
Net loss from continuing operations $40.5 $62.8
Net loss per share $0.13 $0.20
(1) Includes share-based compensation expense of $10.2 and $12.3 million in 2014 and 2013, respectively.
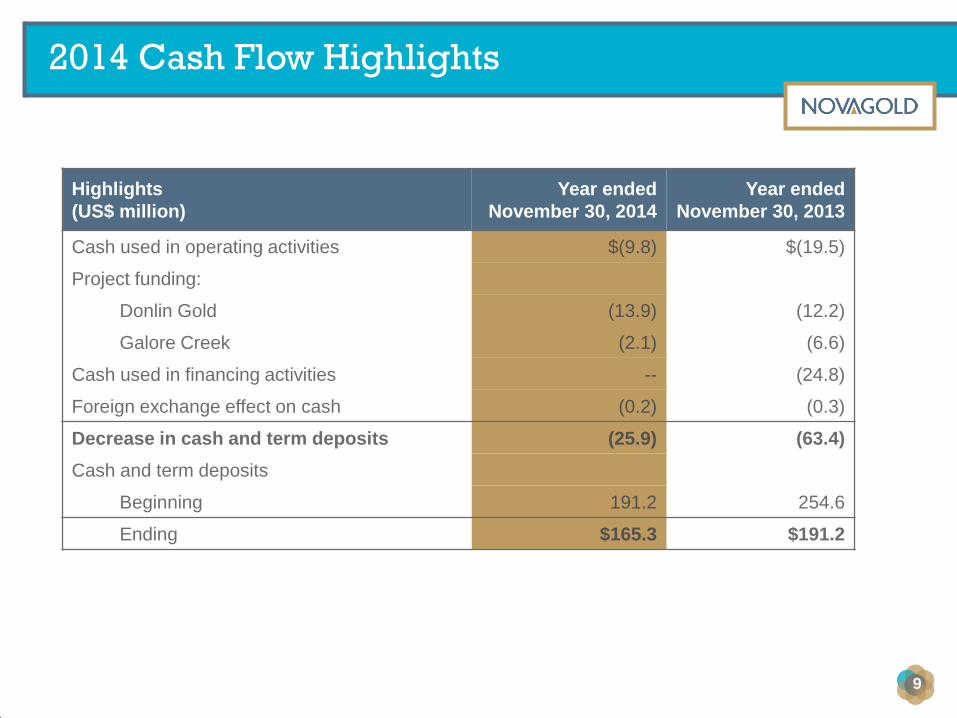
2014 Cash Flow Highlights
9
Highlights
(US$ million)
Year ended
November 30, 2014
Year ended
November 30, 2013
Cash used in operating activities $(9.8) $(19.5)
Project funding:
Donlin Gold (13.9) (12.2)
Galore Creek (2.1) (6.6)
Cash used in financing activities -- (24.8)
Foreign exchange effect on cash (0.2) (0.3)
Decrease in cash and term deposits (25.9) (63.4)
Cash and term deposits
Beginning 191.2 254.6
Ending $165.3 $191.2
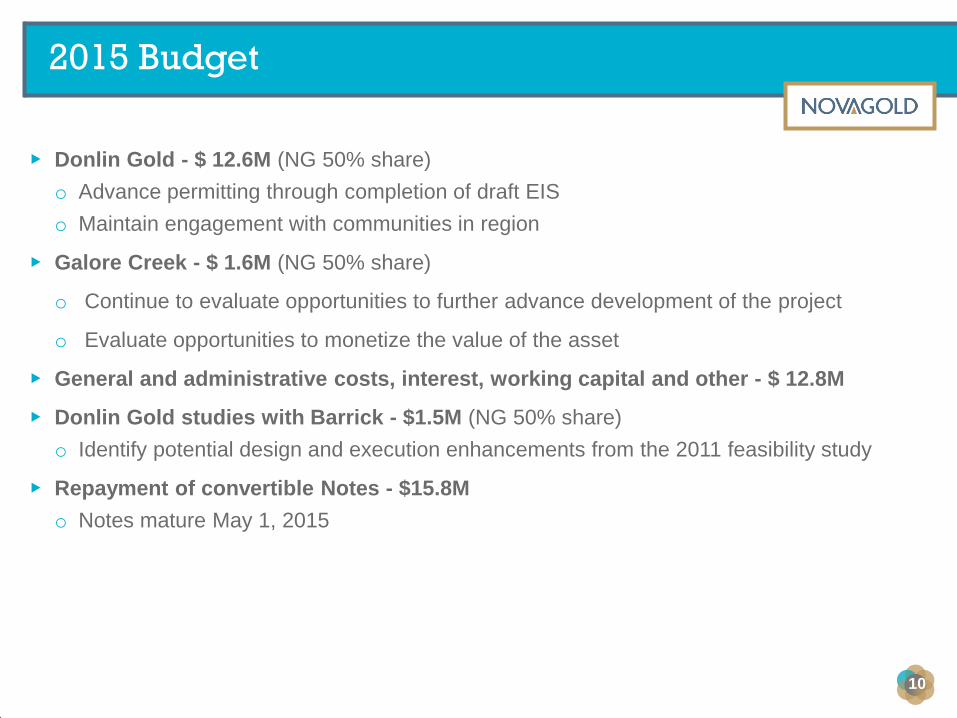
2015 Budget
▶ Donlin Gold - $ 12.6M (NG 50% share)
o Advance permitting through completion of draft EIS
o Maintain engagement with communities in region
▶ Galore Creek - $ 1.6M (NG 50% share)
o Continue to evaluate opportunities to further advance development of the project
o Evaluate opportunities to monetize the value of the asset
▶ General and administrative costs, interest, working capital and other - $ 12.8M
▶ Donlin Gold studies with Barrick - $1.5M (NG 50% share)
o Identify potential design and execution enhancements from the 2011 feasibility study
▶ Repayment of convertible Notes - $15.8M
o Notes mature May 1, 2015
10

2014 millions
Total spending $26
Cash and term deposits1 $165
2015
Budget2
Donlin Gold $13
Galore Creek $2
G&A, interest & Donlin Gold joint studies $14
Repayment of outstanding convertible
notes3 $16
Anticipated year-end cash position $120
Clear Focus and Strong Funding to Execute on all Fronts
11 1) Includes US$ 95.0 million in term deposits as of November 30, 2014.
2) 2015 anticipated budget expenditure disclosed on January 28, 2015
3) The Notes mature on May 1, 2015.
2014 TOTAL SPEND 14% LESS THAN BUDGET

AMONG THE WORLD’S MOST SIGNIFICANT AND HIGHEST-GRADE GOLD DEPOSITS
Donlin Gold: A Large High-Grade Gold Project
12
Notes:
1) Shown on 100% project basis, of which NOVAGOLD holds a 50% interest
2) Measured and indicated resources inclusive of proven and probable reserves.
See “Cautionary Note Concerning Reserve & Resource Estimates” and “Reserve & Resource
Base” with footnotes in the appendix.
RESERVES1
34 million oz Proven & Probable
Grade: 2.1 g/t
RESOURCES1,2
39 million oz Measured & Indicated
Grade: 2.2 g/t
6 million oz Inferred
Grade: 2.0 g/t
(inclusive of P&P reserves)
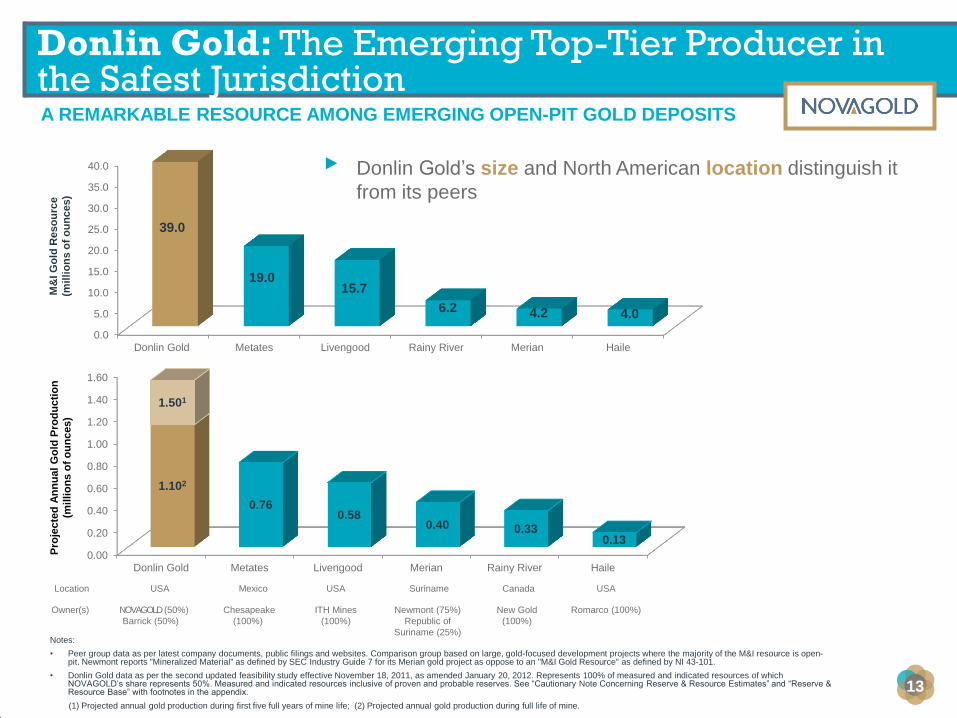
Donlin Gold: The Emerging Top-Tier Producer in the Safest Jurisdiction
0.00
0.20
0.40
0.60
0.80
1.00
1.20
1.40
1.60
Donlin Gold Metates Livengood Merian Rainy River Haile
1.102
0.76 0.58
0.40 0.33 0.13
1.501
Location USA Mexico USA Suriname Canada USA
Owner(s) NOVAGOLD (50%)
Barrick (50%)
Chesapeake
(100%)
ITH Mines
(100%)
Newmont (75%)
Republic of
Suriname (25%)
New Gold
(100%)
Romarco (100%)
Pro
jecte
d A
nn
ua
l G
old
Pro
du
cti
on
(mil
lio
ns
of
ou
nc
es)
A REMARKABLE RESOURCE AMONG EMERGING OPEN-PIT GOLD DEPOSITS
13
Notes:
• Peer group data as per latest company documents, public filings and websites. Comparison group based on large, gold-focused development projects where the majority of the M&I resource is open-pit. Newmont reports "Mineralized Material" as defined by SEC Industry Guide 7 for its Merian gold project as oppose to an "M&I Gold Resource" as defined by NI 43-101.
• Donlin Gold data as per the second updated feasibility study effective November 18, 2011, as amended January 20, 2012. Represents 100% of measured and indicated resources of which NOVAGOLD’s share represents 50%. Measured and indicated resources inclusive of proven and probable reserves. See “Cautionary Note Concerning Reserve & Resource Estimates” and “Reserve & Resource Base” with footnotes in the appendix.
(1) Projected annual gold production during first five full years of mine life; (2) Projected annual gold production during full life of mine.
0.0
5.0
10.0
15.0
20.0
25.0
30.0
35.0
40.0
Donlin Gold Metates Livengood Rainy River Merian Haile
39.0
19.0 15.7
6.2 4.2 4.0
M&
I G
old
Reso
urc
e
(mil
lio
ns
of
ou
nc
es)
▸ Donlin Gold’s size and North American location distinguish it
from its peers
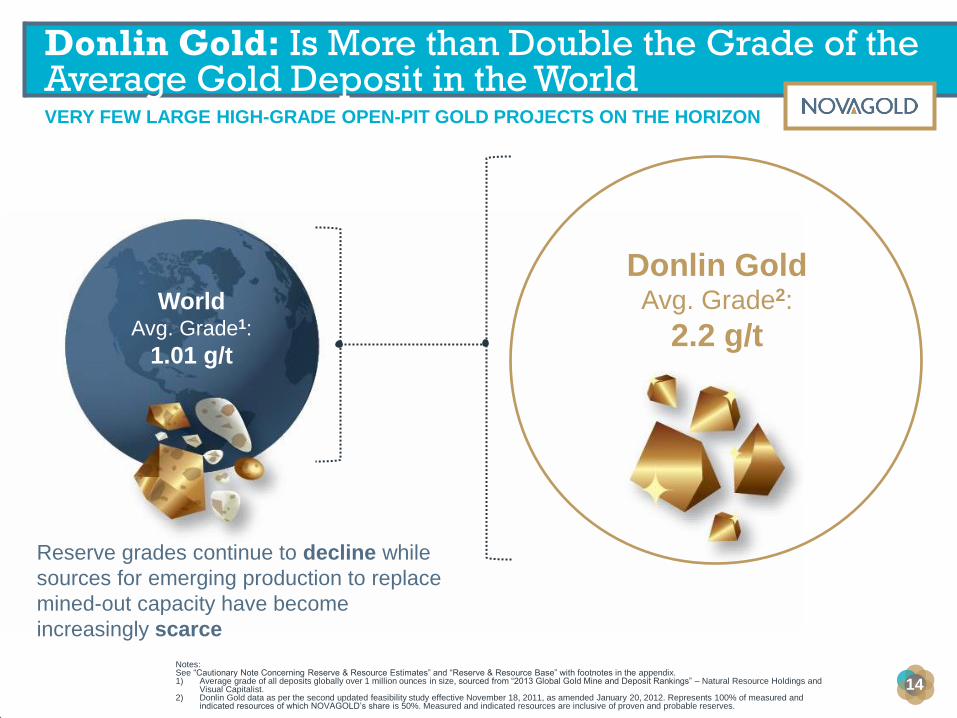
VERY FEW LARGE HIGH-GRADE OPEN-PIT GOLD PROJECTS ON THE HORIZON
Donlin Gold: Is More than Double the Grade of the Average Gold Deposit in the World
14
Notes: See “Cautionary Note Concerning Reserve & Resource Estimates” and “Reserve & Resource Base” with footnotes in the appendix. 1) Average grade of all deposits globally over 1 million ounces in size, sourced from “2013 Global Gold Mine and Deposit Rankings” – Natural Resource Holdings and
Visual Capitalist. 2) Donlin Gold data as per the second updated feasibility study effective November 18, 2011, as amended January 20, 2012. Represents 100% of measured and
indicated resources of which NOVAGOLD’s share is 50%. Measured and indicated resources are inclusive of proven and probable reserves.
World Avg. Grade1:
1.01 g/t
Donlin Gold Avg. Grade2:
2.2 g/t
Reserve grades continue to decline while
sources for emerging production to replace
mined-out capacity have become
increasingly scarce
0.00
0.50
1.00
1.50
2.00
2.50
Donlin Gold Haile Merian Rainy River Livengood Metates
2.24
1.77
1.22 1.09
0.61 0.50
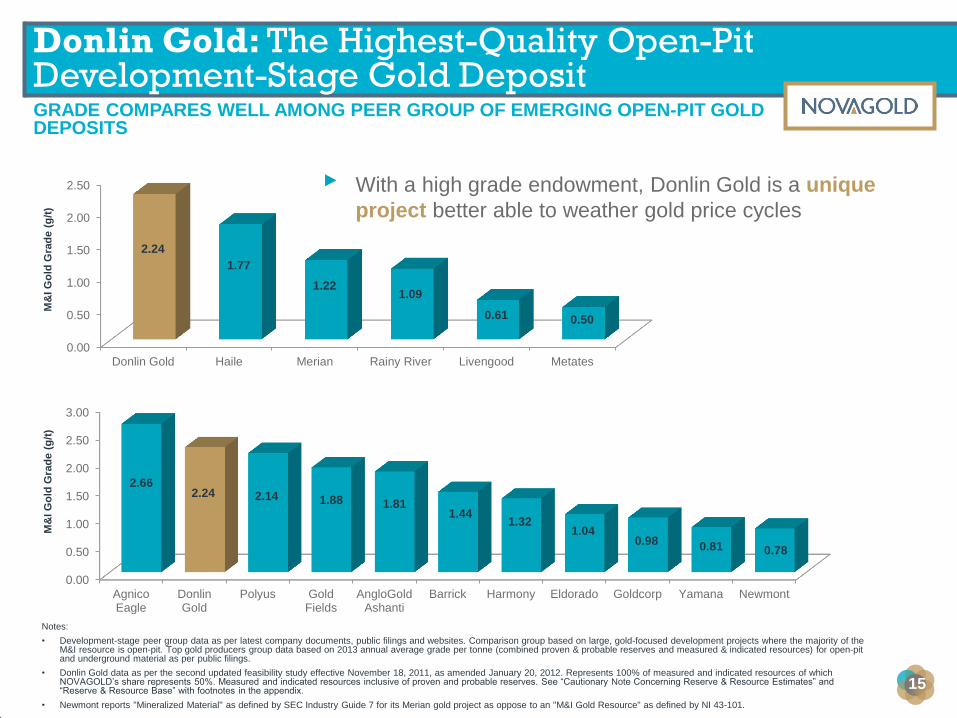
GRADE COMPARES WELL AMONG PEER GROUP OF EMERGING OPEN-PIT GOLD DEPOSITS
Donlin Gold: The Highest-Quality Open-Pit Development-Stage Gold Deposit
15
▸ With a high grade endowment, Donlin Gold is a unique
project better able to weather gold price cycles
M&
I G
old
Gra
de
(g
/t)
Notes:
• Development-stage peer group data as per latest company documents, public filings and websites. Comparison group based on large, gold-focused development projects where the majority of the M&I resource is open-pit. Top gold producers group data based on 2013 annual average grade per tonne (combined proven & probable reserves and measured & indicated resources) for open-pit and underground material as per public filings.
• Donlin Gold data as per the second updated feasibility study effective November 18, 2011, as amended January 20, 2012. Represents 100% of measured and indicated resources of which NOVAGOLD’s share represents 50%. Measured and indicated resources inclusive of proven and probable reserves. See “Cautionary Note Concerning Reserve & Resource Estimates” and “Reserve & Resource Base” with footnotes in the appendix.
• Newmont reports "Mineralized Material" as defined by SEC Industry Guide 7 for its Merian gold project as oppose to an "M&I Gold Resource" as defined by NI 43-101.
0.00
0.50
1.00
1.50
2.00
2.50
3.00
AgnicoEagle
DonlinGold
Polyus GoldFields
AngloGoldAshanti
Barrick Harmony Eldorado Goldcorp Yamana Newmont
2.66 2.24 2.14 1.88 1.81
1.44 1.32
1.04 0.98 0.81 0.78
M&
I G
old
Gra
de
(g
/t)
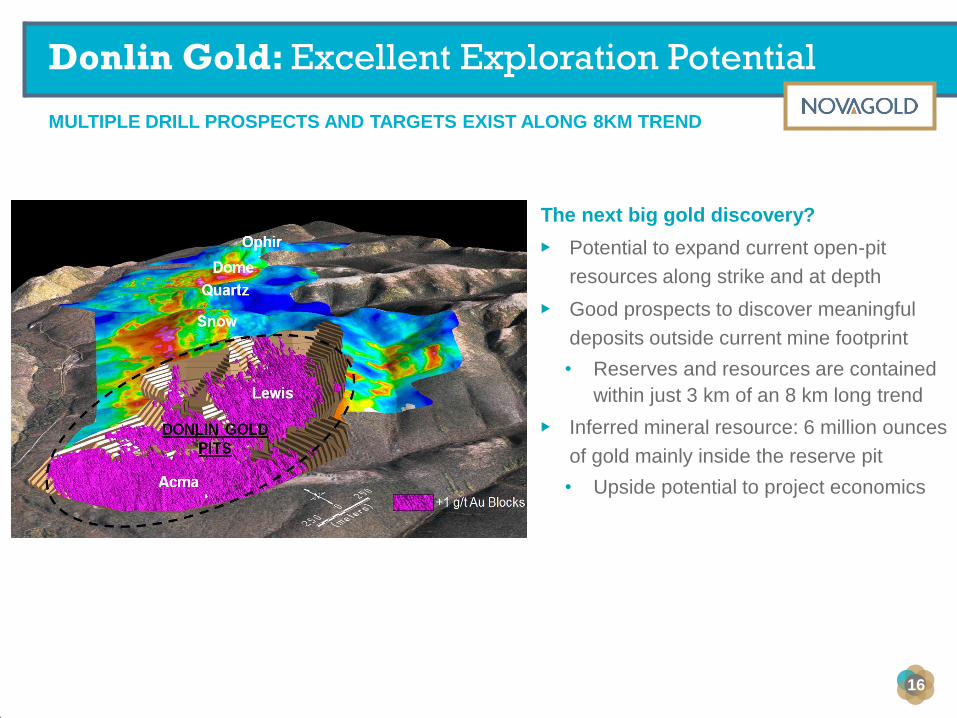
MULTIPLE DRILL PROSPECTS AND TARGETS EXIST ALONG 8KM TREND
Donlin Gold: Excellent Exploration Potential
16
The next big gold discovery?
▶ Potential to expand current open-pit
resources along strike and at depth
▶ Good prospects to discover meaningful
deposits outside current mine footprint
• Reserves and resources are contained
within just 3 km of an 8 km long trend
▶ Inferred mineral resource: 6 million ounces
of gold mainly inside the reserve pit
• Upside potential to project economics

0
5,000
10,000
15,000
20,000
25,000
30,000
$1,200 $1,300 $1,500 $1,700 $2,000 $2,500
6.2B
8.2B
11.6B
14.6B
19.2B
27.0B
NP
V (
US
$ i
n m
illi
on
s)
Gold Price (US$)
NPV INCREASES ~20X WITH ~2X INCREASE IN GOLD PRICE
Donlin Gold: Has Exceptional Leverage to Gold
▶ Project has a positive
return that increases
substantially with higher
gold prices
▶ Good payback at a
broad range of gold
prices
▶ Significant exploration
upside on the
mineralized trend
▶ Long mine life offers high
likelihood of enjoying one
or more cyclical bull
markets over the period
of the mine’s operation
17 Notes:
Donlin Gold estimates as per the second updated feasibility study effective November 18, 2011, as amended January 20, 2012 . All dollar figures are in USD and reflect after-tax net present value (at a 0% and 5% discount
rates) of the Donlin Gold project as of 1/1/2014. At a 5% discount rate, the net present value is: $547 m @ $1,200 gold; $1,465m @ $1,300 gold; $3,147m @ $1,500 gold; $4,581 m @ $1,700 gold; $6,722 m @ $2,000 gold;
and $10,243 m @ $2,500 gold. Project development costs prior to 1/1/2014 are treated as sunk costs.
27year mine life
NPV at 0% NPV at 5%
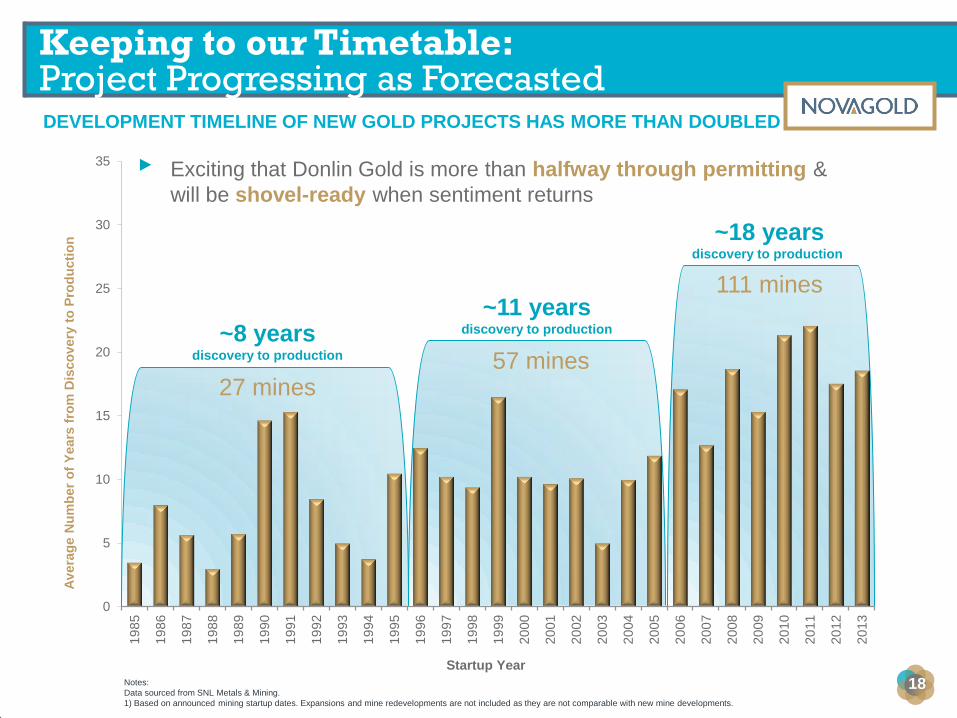
DEVELOPMENT TIMELINE OF NEW GOLD PROJECTS HAS MORE THAN DOUBLED
Keeping to our Timetable: Project Progressing as Forecasted
18 Notes:
Data sourced from SNL Metals & Mining.
1) Based on announced mining startup dates. Expansions and mine redevelopments are not included as they are not comparable with new mine developments.
27 mines
~8 years discovery to production 57 mines
111 mines ~11 years
discovery to production
~18 years discovery to production
0
5
10
15
20
25
30
35
19
85
19
86
19
87
19
88
19
89
19
90
19
91
19
92
19
93
19
94
19
95
19
96
19
97
19
98
19
99
20
00
20
01
20
02
20
03
20
04
20
05
20
06
20
07
20
08
20
09
20
10
20
11
20
12
20
13
Av
era
ge N
um
ber
of
Years
fro
m D
isco
very
to
Pro
du
cti
on
Startup Year
▸ Exciting that Donlin Gold is more than halfway through permitting &
will be shovel-ready when sentiment returns
Donlin Gold: Partnerships & Activities
19
COLLABORATING WITH OUR PARTNER TO MAXIMIZE PROJECT RETURN
Barrick and NOVAGOLD are jointly committed to working together to create
shareholder value from Donlin Gold’s unique optionality
▶ Project activities continue to progress as planned
▶ After further de-risking, we are encouraged by Donlin Gold’s prospects
▶ Focused on advancing Donlin Gold through permitting to a record of decision
▶ Working together on evaluating development alternatives
▶ Neither partner has a build at any gold price mentality
“Both companies are happy to take a sober and constructive view. We don't want
to subsidize the world's consumption of gold by squandering the treasures that
Mother Nature has given us and we're happy to wait for the higher gold prices that
will make the project's economics sing.” – Thomas S. Kaplan,
Chairman of NOVAGOLD
RETAINING THE GREATEST VALUE WHILE ENSURING CAPITAL EFFICIENCY
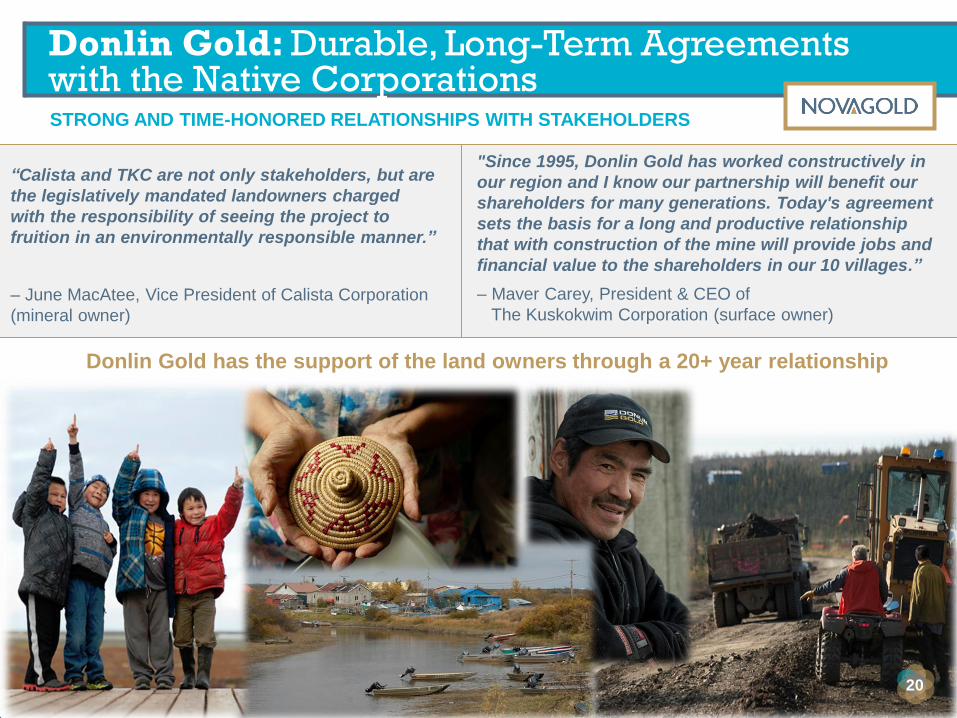
STRONG AND TIME-HONORED RELATIONSHIPS WITH STAKEHOLDERS
20
Donlin Gold: Durable, Long-Term Agreements with the Native Corporations
Donlin Gold has the support of the land owners through a 20+ year relationship
“Calista and TKC are not only stakeholders, but are
the legislatively mandated landowners charged
with the responsibility of seeing the project to
fruition in an environmentally responsible manner.”
– June MacAtee, Vice President of Calista Corporation
(mineral owner)
"Since 1995, Donlin Gold has worked constructively in
our region and I know our partnership will benefit our
shareholders for many generations. Today's agreement
sets the basis for a long and productive relationship
that with construction of the mine will provide jobs and
financial value to the shareholders in our 10 villages.”
– Maver Carey, President & CEO of
The Kuskokwim Corporation (surface owner)
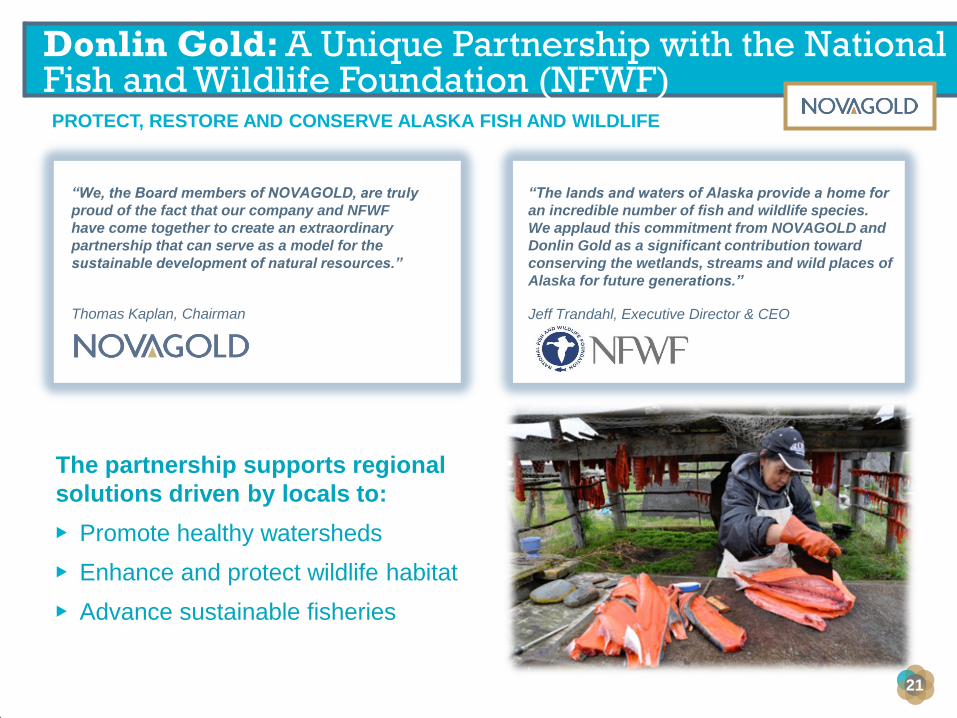
PROTECT, RESTORE AND CONSERVE ALASKA FISH AND WILDLIFE
Donlin Gold: A Unique Partnership with the National Fish and Wildlife Foundation (NFWF)
“We, the Board members of NOVAGOLD, are truly
proud of the fact that our company and NFWF
have come together to create an extraordinary
partnership that can serve as a model for the
sustainable development of natural resources.”
Thomas Kaplan, Chairman
“The lands and waters of Alaska provide a home for
an incredible number of fish and wildlife species.
We applaud this commitment from NOVAGOLD and
Donlin Gold as a significant contribution toward
conserving the wetlands, streams and wild places of
Alaska for future generations.”
Jeff Trandahl, Executive Director & CEO
The partnership supports regional
solutions driven by locals to:
▶ Promote healthy watersheds
▶ Enhance and protect wildlife habitat
▶ Advance sustainable fisheries
21

Donlin Gold: The Project Permitting is On Track
22
16 years 4 27+ years
EX
PL
OR
AT
ION
&
EN
VIR
ON
ME
NTA
L
ST
UD
IES
PE
RM
ITT
ING
EN
GIN
EE
RIN
G &
CO
NS
TR
UC
TIO
N
OP
ER
AT
ION
WE ARE HERE
HALF WAY THROUGH PERMITTING
1.5Moz/year first five full years1
1.1Moz/year life of mine1
4
Notes: 1) Donlin Gold data as per the second updated feasibility study. Projected average annual production represents 100% of which NOVAGOLD’s share represents 50%.
DEVELOPMENT TIMELINE – ADVANCING TOWARD A CONSTRUCTION DECISION
Federal and State agencies are working
cooperatively, with day-to-day support
from Donlin Gold, to efficiently move the
project through the EIS and permitting
processes.
Major permit applications are well underway • Air quality
• Water discharge and usage*
• Pipeline plan of development*
• Wetlands*
• Dam safety*
* applications submitted and in agency review
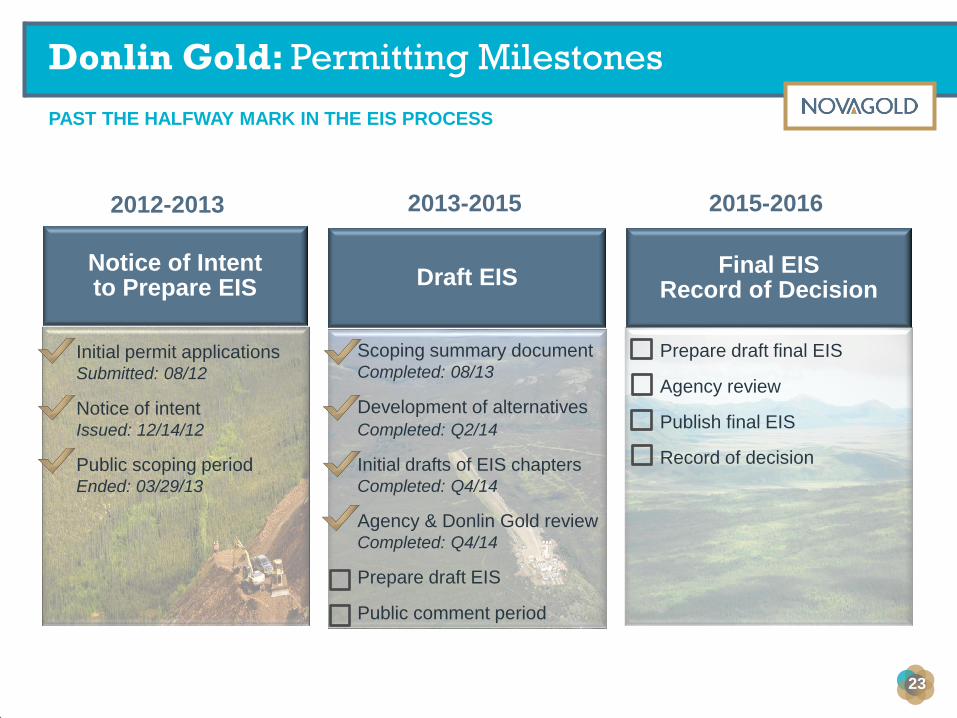
Notice of Intent to Prepare EIS
Draft EIS
Final EIS Record of Decision
23
Initial permit applications Submitted: 08/12
Notice of intent Issued: 12/14/12
Public scoping period Ended: 03/29/13
Scoping summary document Completed: 08/13
Development of alternatives
Completed: Q2/14
Initial drafts of EIS chapters Completed: Q4/14
Agency & Donlin Gold review Completed: Q4/14
Prepare draft EIS
Public comment period
Prepare draft final EIS
Agency review
Publish final EIS
Record of decision
PAST THE HALFWAY MARK IN THE EIS PROCESS
Donlin Gold: Permitting Milestones
2012-2013 2013-2015 2015-2016
COLLABORATING WITH OUR PARTNER TO MAXIMIZE PROJECT RETURN
Donlin Gold: Optimization Studies
▶ Optimization studies underway to evaluate opportunities to reduce initial owner
capital
• Third-party financing or owner/operator prospects (≈$1.0B potential reductions
i.e. gas pipeline, port facilities, oxygen plant, mining fleet)
• Conducting technical studies ($3.0M) with experts from both companies and
independent consultants to identify potential design and execution
enhancements from FSU2
Potential benefits:
▶ Lower initial owner capital required to build
▶ Opportunity to implement lessons learned from past/current experience in building
and operating assets such as Pueblo Viejo
▶ Opportunity to expand with future cash-flow generation
▶ When sentiment returns in the gold sector, the market will seek out projects with
leverage and growth
• Donlin Gold will be one of the few projects shovel-ready
24
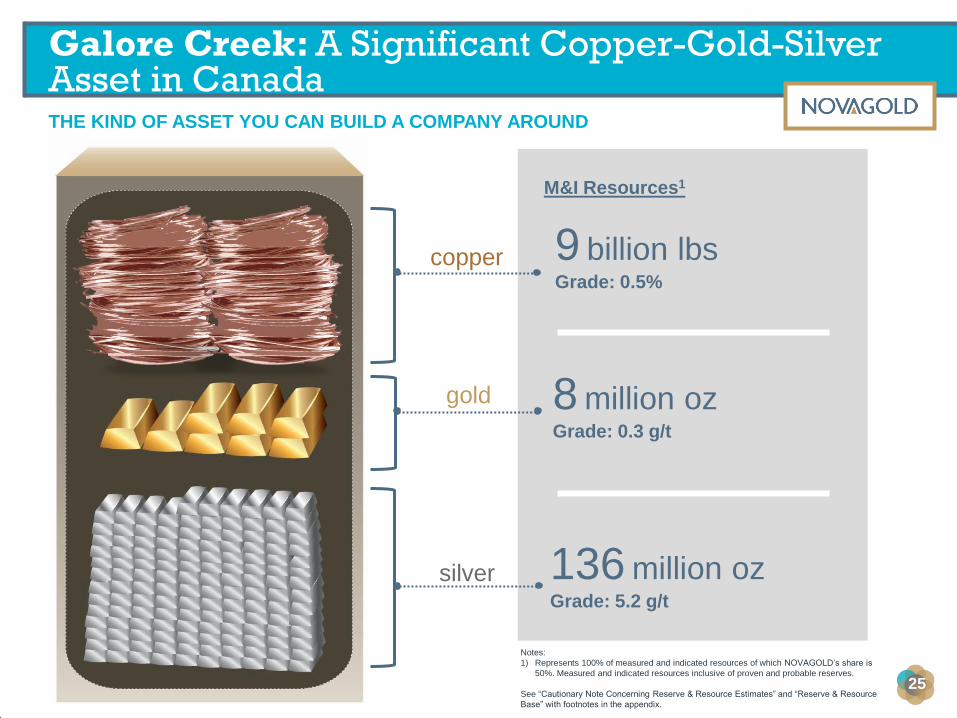
THE KIND OF ASSET YOU CAN BUILD A COMPANY AROUND
Galore Creek: A Significant Copper-Gold-Silver Asset in Canada
25
Notes:
1) Represents 100% of measured and indicated resources of which NOVAGOLD’s share is
50%. Measured and indicated resources inclusive of proven and probable reserves.
See “Cautionary Note Concerning Reserve & Resource Estimates” and “Reserve & Resource
Base” with footnotes in the appendix.
9 billion lbs Grade: 0.5%
8 million oz Grade: 0.3 g/t
136 million oz Grade: 5.2 g/t
copper
gold
silver
M&I Resources1
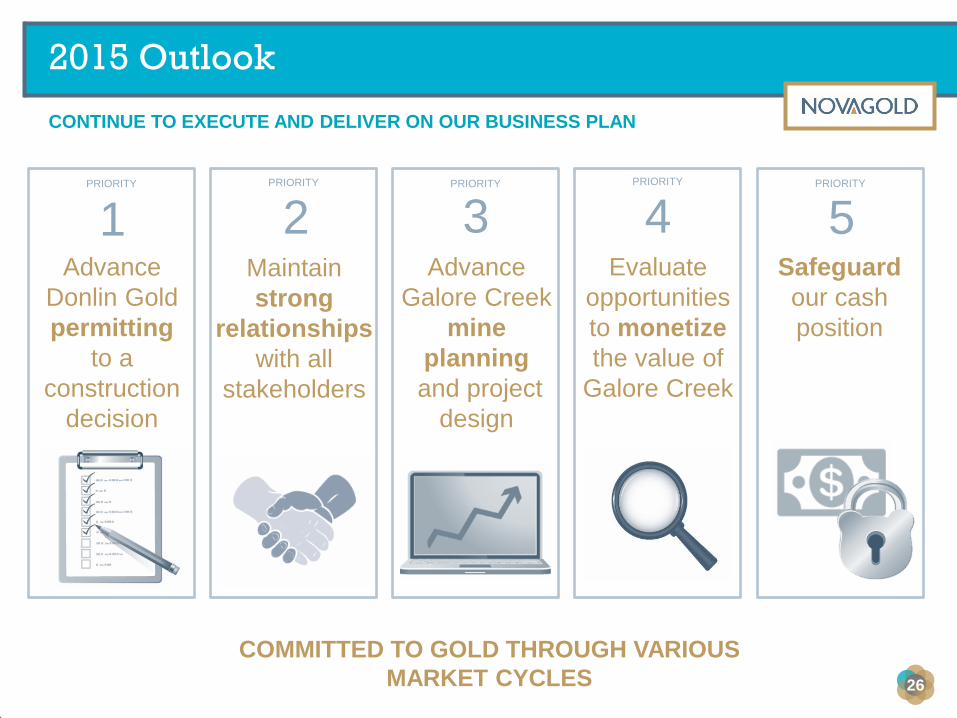
CONTINUE TO EXECUTE AND DELIVER ON OUR BUSINESS PLAN
2015 Outlook
1 2 3 4 5 PRIORITY PRIORITY PRIORITY PRIORITY PRIORITY
Advance
Donlin Gold
permitting
to a
construction
decision
Advance
Galore Creek
mine
planning
and project
design
Evaluate
opportunities
to monetize
the value of
Galore Creek
Safeguard
our cash
position
Maintain
strong
relationships
with all
stakeholders
COMMITTED TO GOLD THROUGH VARIOUS
MARKET CYCLES 26
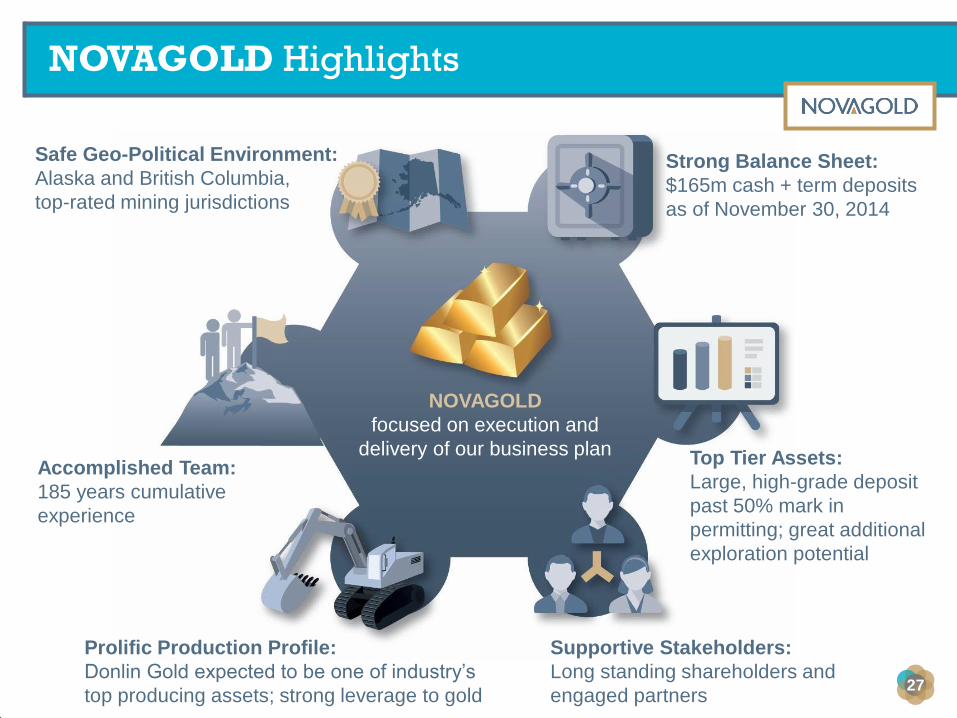
NOVAGOLD
focused on execution and
delivery of our business plan
NOVAGOLD Highlights
27
Safe Geo-Political Environment:
Alaska and British Columbia,
top-rated mining jurisdictions
Accomplished Team:
185 years cumulative
experience
Prolific Production Profile:
Donlin Gold expected to be one of industry’s
top producing assets; strong leverage to gold
Supportive Stakeholders:
Long standing shareholders and
engaged partners
Strong Balance Sheet:
$165m cash + term deposits
as of November 30, 2014
Top Tier Assets:
Large, high-grade deposit
past 50% mark in
permitting; great additional
exploration potential
novagold.com
Appendix
COPPER
Tonnage
Mt
Grade*
%Cu
Metal content
Mlbs
NOVAGOLD share**
Mlbs
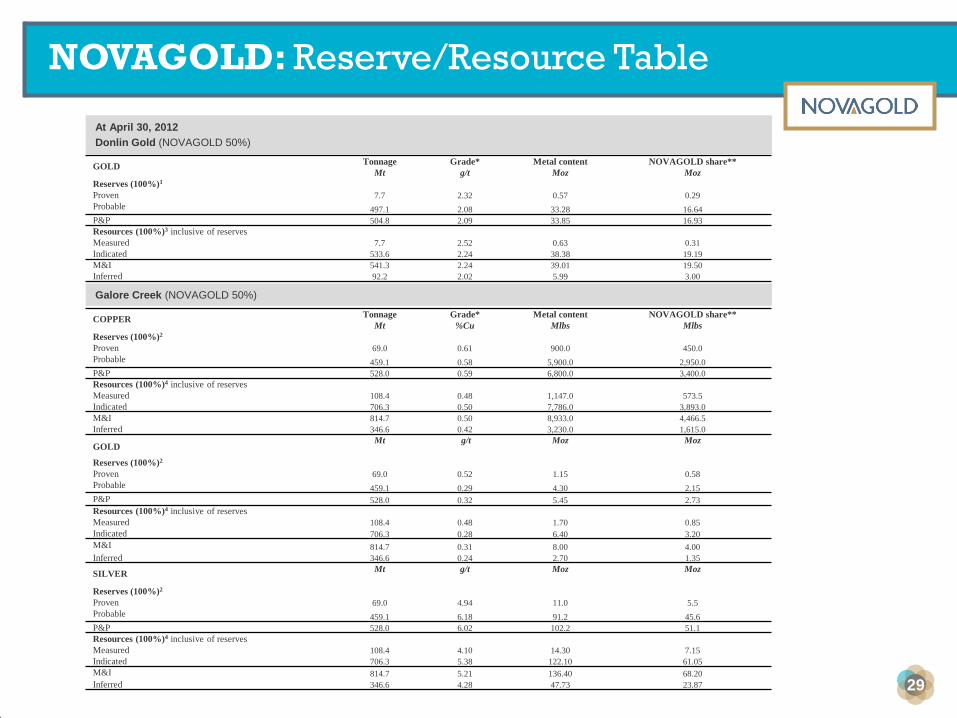
Reserves (100%)2
Proven 69.0 0.61 900.0 450.0
Probable 459.1 0.58 5,900.0 2,950.0
P&P 528.0 0.59 6,800.0 3,400.0
Resources (100%)4 inclusive of reserves
Measured 108.4 0.48 1,147.0 573.5
Indicated 706.3 0.50 7,786.0 3,893.0
M&I 814.7 0.50 8,933.0 4,466.5
Inferred 346.6 0.42 3,230.0 1,615.0
GOLD Mt
g/t
Moz
Moz
Reserves (100%)2
Proven 69.0 0.52 1.15 0.58
Probable 459.1 0.29 4.30 2.15
P&P 528.0 0.32 5.45 2.73
Resources (100%)4 inclusive of reserves
Measured 108.4 0.48 1.70 0.85
Indicated 706.3 0.28 6.40 3.20
M&I 814.7 0.31 8.00 4.00
Inferred 346.6 0.24 2.70 1.35
SILVER
Mt
g/t
Moz
Moz
Reserves (100%)2
Proven 69.0 4.94 11.0 5.5
Probable 459.1 6.18 91.2 45.6
P&P 528.0 6.02 102.2 51.1
Resources (100%)4 inclusive of reserves
Measured 108.4 4.10 14.30 7.15
Indicated 706.3 5.38 122.10 61.05
M&I 814.7 5.21 136.40 68.20
Inferred 346.6 4.28 47.73 23.87
At April 30, 2012
Donlin Gold (NOVAGOLD 50%)
Galore Creek (NOVAGOLD 50%)
GOLD
Tonnage
Mt
Grade*
g/t
Metal content
Moz
NOVAGOLD share**
Moz
Reserves (100%)1
Proven 7.7 2.32 0.57 0.29
Probable 497.1 2.08 33.28 16.64
P&P 504.8 2.09 33.85 16.93
Resources (100%)3 inclusive of reserves
Measured 7.7 2.52 0.63 0.31
Indicated 533.6 2.24 38.38 19.19
M&I 541.3 2.24 39.01 19.50
Inferred 92.2 2.02 5.99 3.00
NOVAGOLD: Reserve/Resource Table
29
NOVAGOLD: Reserve/Resource Table (con’t)
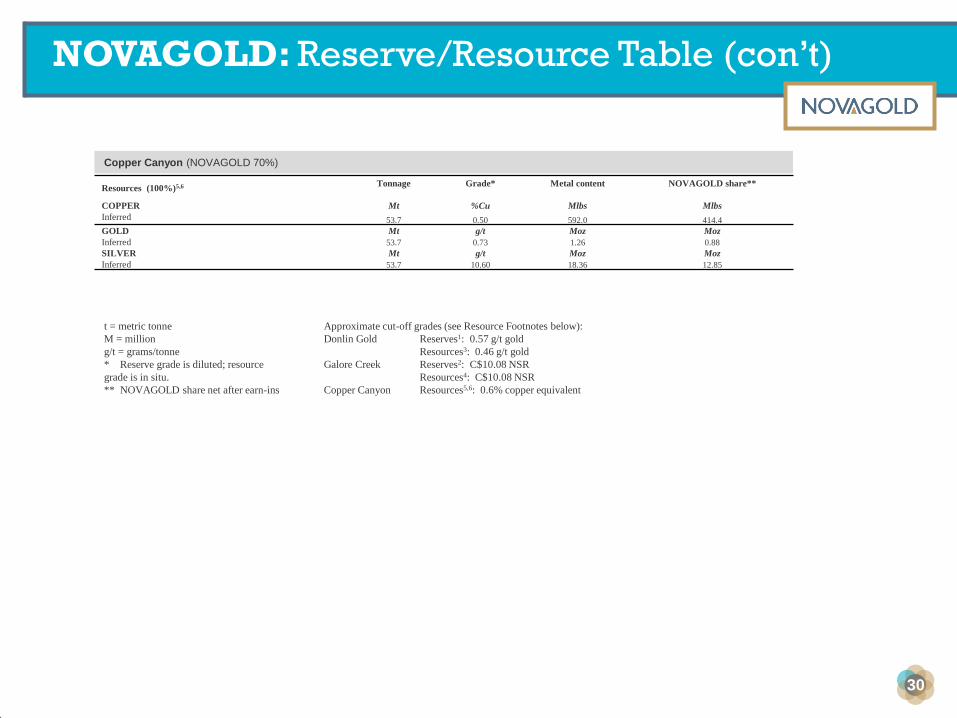
Resources (100%)5,6
Tonnage
Grade*
Metal content
NOVAGOLD share**
COPPER Mt %Cu Mlbs Mlbs
Inferred 53.7 0.50 592.0 414.4
GOLD Mt g/t Moz Moz
Inferred 53.7 0.73 1.26 0.88
SILVER Mt g/t Moz Moz
Inferred 53.7 10.60 18.36 12.85
Copper Canyon (NOVAGOLD 70%)
t = metric tonne
M = million
g/t = grams/tonne
* Reserve grade is diluted; resource
grade is in situ.
** NOVAGOLD share net after earn-ins
Approximate cut-off grades (see Resource Footnotes below):
Donlin Gold Reserves1: 0.57 g/t gold
Resources3: 0.46 g/t gold
Galore Creek Reserves2: C$10.08 NSR
Resources4: C$10.08 NSR
Copper Canyon Resources5,6: 0.6% copper equivalent
30
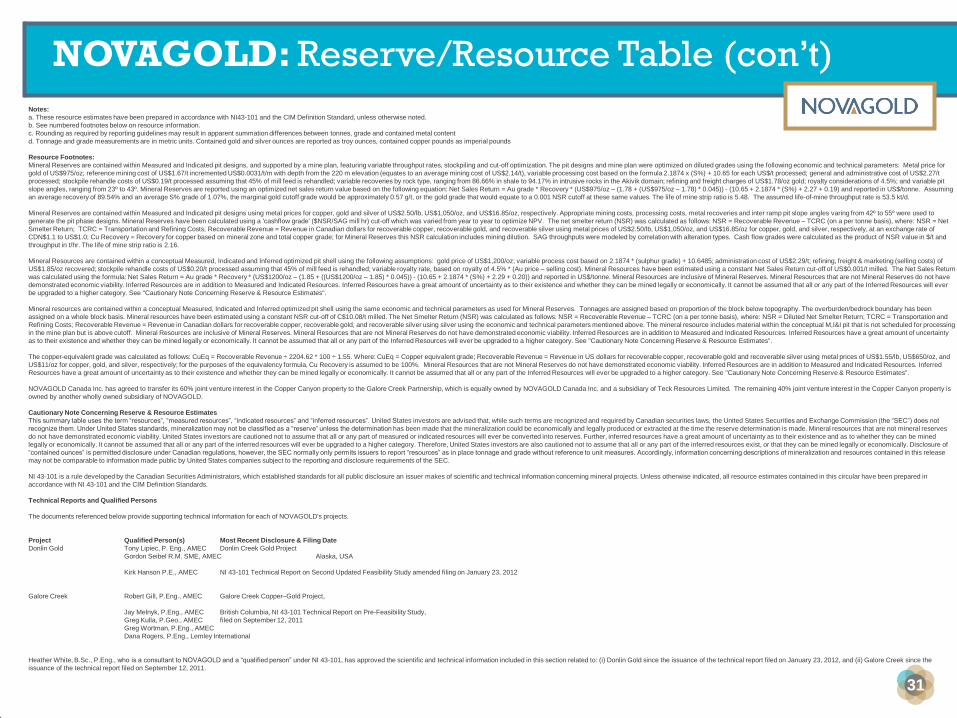
Notes:
a. These resource estimates have been prepared in accordance with NI43-101 and the CIM Definition Standard, unless otherwise noted.
b. See numbered footnotes below on resource information.
c. Rounding as required by reporting guidelines may result in apparent summation differences between tonnes, grade and contained metal content
d. Tonnage and grade measurements are in metric units. Contained gold and silver ounces are reported as troy ounces, contained copper pounds as imperial pounds
Resource Footnotes:
Mineral Reserves are contained within Measured and Indicated pit designs, and supported by a mine plan, featuring variable throughput rates, stockpiling and cut-off optimization. The pit designs and mine plan were optimized on diluted grades using the following economic and technical parameters: Metal price for
gold of US$975/oz; reference mining cost of US$1.67/t incremented US$0.0031/t/m with depth from the 220 m elevation (equates to an average mining cost of US$2.14/t), variable processing cost based on the formula 2.1874 x (S%) + 10.65 for each US$/t processed; general and administrative cost of US$2.27/t
processed; stockpile rehandle costs of US$0.19/t processed assuming that 45% of mill feed is rehandled; variable recoveries by rock type, ranging from 86.66% in shale to 94.17% in intrusive rocks in the Akivik domain; refining and freight charges of US$1.78/oz gold; royalty considerations of 4.5%; and variable pit
slope angles, ranging from 23º to 43º. Mineral Reserves are reported using an optimized net sales return value based on the following equation: Net Sales Return = Au grade * Recovery * (US$975/oz – (1.78 + (US$975/oz – 1.78) * 0.045)) - (10.65 + 2.1874 * (S%) + 2.27 + 0.19) and reported in US$/tonne. Assuming
an average recovery of 89.54% and an average S% grade of 1.07%, the marginal gold cutoff grade would be approximately 0.57 g/t, or the gold grade that would equate to a 0.001 NSR cutoff at these same values. The life of mine strip ratio is 5.48. The assumed life-of-mine throughput rate is 53.5 kt/d.
Mineral Reserves are contained within Measured and Indicated pit designs using metal prices for copper, gold and silver of US$2.50/lb, US$1,050/oz, and US$16.85/oz, respectively. Appropriate mining costs, processing costs, metal recoveries and inter ramp pit slope angles varing from 42º to 55º were used to
generate the pit phase designs. Mineral Reserves have been calculated using a 'cashflow grade' ($NSR/SAG mill hr) cut-off which was varied from year to year to optimize NPV. The net smelter return (NSR) was calculated as follows: NSR = Recoverable Revenue – TCRC (on a per tonne basis), where: NSR = Net
Smelter Return; TCRC = Transportation and Refining Costs; Recoverable Revenue = Revenue in Canadian dollars for recoverable copper, recoverable gold, and recoverable silver using metal prices of US$2.50/lb, US$1,050/oz, and US$16.85/oz for copper, gold, and silver, respectively, at an exchange rate of
CDN$1.1 to US$1.0; Cu Recovery = Recovery for copper based on mineral zone and total copper grade; for Mineral Reserves this NSR calculation includes mining dilution. SAG throughputs were modeled by correlation with alteration types. Cash flow grades were calculated as the product of NSR value in $/t and
throughput in t/hr. The life of mine strip ratio is 2.16.
Mineral Resources are contained within a conceptual Measured, Indicated and Inferred optimized pit shell using the following assumptions: gold price of US$1,200/oz; variable process cost based on 2.1874 * (sulphur grade) + 10.6485; administration cost of US$2.29/t; refining, freight & marketing (selling costs) of
US$1.85/oz recovered; stockpile rehandle costs of US$0.20/t processed assuming that 45% of mill feed is rehandled; variable royalty rate, based on royalty of 4.5% * (Au price – selling cost). Mineral Resources have been estimated using a constant Net Sales Return cut-off of US$0.001/t milled. The Net Sales Return
was calculated using the formula: Net Sales Return = Au grade * Recovery * (US$1200/oz – (1.85 + ((US$1200/oz – 1.85) * 0.045)) - (10.65 + 2.1874 * (S%) + 2.29 + 0.20)) and reported in US$/tonne. Mineral Resources are inclusive of Mineral Reserves. Mineral Resources that are not Mineral Reserves do not have
demonstrated economic viability. Inferred Resources are in addition to Measured and Indicated Resources. Inferred Resources have a great amount of uncertainty as to their existence and whether they can be mined legally or economically. It cannot be assumed that all or any part of the Inferred Resources will ever
be upgraded to a higher category. See "Cautionary Note Concerning Reserve & Resource Estimates".
Mineral resources are contained within a conceptual Measured, Indicated and Inferred optimized pit shell using the same economic and technical parameters as used for Mineral Reserves. Tonnages are assigned based on proportion of the block below topography. The overburden/bedrock boundary has been
assigned on a whole block basis. Mineral resources have been estimated using a constant NSR cut-off of C$10.08/t milled. The Net Smelter Return (NSR) was calculated as follows: NSR = Recoverable Revenue – TCRC (on a per tonne basis), where: NSR = Diluted Net Smelter Return; TCRC = Transportation and
Refining Costs; Recoverable Revenue = Revenue in Canadian dollars for recoverable copper, recoverable gold, and recoverable silver using silver using the economic and technical parameters mentioned above. The mineral resource includes material within the conceptual M,I&I pit that is not scheduled for processing
in the mine plan but is above cutoff. Mineral Resources are inclusive of Mineral Reserves. Mineral Resources that are not Mineral Reserves do not have demonstrated economic viability. Inferred Resources are in addition to Measured and Indicated Resources. Inferred Resources have a great amount of uncertainty
as to their existence and whether they can be mined legally or economically. It cannot be assumed that all or any part of the Inferred Resources will ever be upgraded to a higher category. See "Cautionary Note Concerning Reserve & Resource Estimates".
The copper-equivalent grade was calculated as follows: CuEq = Recoverable Revenue ÷ 2204.62 * 100 ÷ 1.55. Where: CuEq = Copper equivalent grade; Recoverable Revenue = Revenue in US dollars for recoverable copper, recoverable gold and recoverable silver using metal prices of US$1.55/lb, US$650/oz, and
US$11/oz for copper, gold, and silver, respectively; for the purposes of the equivalency formula, Cu Recovery is assumed to be 100%. Mineral Resources that are not Mineral Reserves do not have demonstrated economic viability. Inferred Resources are in addition to Measured and Indicated Resources. Inferred
Resources have a great amount of uncertainty as to their existence and whether they can be mined legally or economically. It cannot be assumed that all or any part of the Inferred Resources will ever be upgraded to a higher category. See "Cautionary Note Concerning Reserve & Resource Estimates".
NOVAGOLD Canada Inc. has agreed to transfer its 60% joint venture interest in the Copper Canyon property to the Galore Creek Partnership, which is equally owned by NOVAGOLD Canada Inc. and a subsidiary of Teck Resources Limited. The remaining 40% joint venture interest in the Copper Canyon property is
owned by another wholly owned subsidiary of NOVAGOLD.
Cautionary Note Concerning Reserve & Resource Estimates
This summary table uses the term “resources”, “measured resources”, “indicated resources” and “inferred resources”. United States investors are advised that, while such terms are recognized and required by Canadian securities laws, the United States Securities and Exchange Commission (the “SEC”) does not
recognize them. Under United States standards, mineralization may not be classified as a “reserve” unless the determination has been made that the mineralization could be economically and legally produced or extracted at the time the reserve determination is made. Mineral resources that are not mineral reserves
do not have demonstrated economic viability. United States investors are cautioned not to assume that all or any part of measured or indicated resources will ever be converted into reserves. Further, inferred resources have a great amount of uncertainty as to their existence and as to whether they can be mined
legally or economically. It cannot be assumed that all or any part of the inferred resources will ever be upgraded to a higher category. Therefore, United States investors are also cautioned not to assume that all or any part of the inferred resources exist, or that they can be mined legally or economically. Disclosure of
“contained ounces” is permitted disclosure under Canadian regulations, however, the SEC normally only permits issuers to report “resources” as in place tonnage and grade without reference to unit measures. Accordingly, information concerning descriptions of mineralization and resources contained in this release
may not be comparable to information made public by United States companies subject to the reporting and disclosure requirements of the SEC.
NI 43-101 is a rule developed by the Canadian Securities Administrators, which established standards for all public disclosure an issuer makes of scientific and technical information concerning mineral projects. Unless otherwise indicated, all resource estimates contained in this circular have been prepared in
accordance with NI 43-101 and the CIM Definition Standards.
Technical Reports and Qualified Persons
The documents referenced below provide supporting technical information for each of NOVAGOLD's projects.
Project Qualified Person(s) Most Recent Disclosure & Filing Date
Donlin Gold Tony Lipiec, P. Eng., AMEC Donlin Creek Gold Project
Gordon Seibel R.M. SME, AMEC Alaska, USA
Kirk Hanson P.E., AMEC NI 43-101 Technical Report on Second Updated Feasibility Study amended filing on January 23, 2012
Galore Creek Robert Gill, P.Eng., AMEC Galore Creek Copper–Gold Project,
Jay Melnyk, P.Eng., AMEC British Columbia, NI 43-101 Technical Report on Pre-Feasibility Study,
Greg Kulla, P.Geo., AMEC filed on September 12, 2011
Greg Wortman, P.Eng., AMEC
Dana Rogers, P.Eng., Lemley International
Heather White, B.Sc., P.Eng., who is a consultant to NOVAGOLD and a “qualified person” under NI 43-101, has approved the scientific and technical information included in this section related to: (i) Donlin Gold since the issuance of the technical report filed on January 23, 2012, and (ii) Galore Creek since the
issuance of the technical report filed on September 12, 2011.
NOVAGOLD: Reserve/Resource Table (con’t)
31
32
NOVAGOLD RESOURCES INC.
Suite 720 – 789 West Pender Street
Vancouver, BC
Canada V6C 1H2
T 604 669 6227 TF 1 866 669 6227 F 604 669 6272
www.novagold.com
Mélanie Hennessey
VP, Corporate Communications
Erin O’Toole
Analyst, Investor Relations
Contact Us