Embed Size (px)
Citation preview
0
INVESTOR PRESENTATION
March 2015
1
Forward Looking
STATEMENTS Certain information included in this presentation constitutes ‘forward-looking statements’ within the meaning of the ‘safe
harbor’ provisions of the United States Private Securities Litigation Reform Act of 1995 and Canadian securities laws. The words ‘expect’, ‘believe’, ‘will’, ‘intend’, ‘estimate’, ‘forecast’, and similar expressions identify forward-looking statements. Such statements include, without limitation, any information as to our future exploration, financial or operating performance, including: the Company's forward looking production guidance, projected capital expenditures, operating cost estimates, project timelines, mining and milling rates, the methods by which ore will be extracted, projected grades, mill recoveries, and other statements that express management's expectations or estimates of future performance. Forward-looking statements are necessarily based upon a number of factors and assumptions that, while considered reasonable by management, are inherently subject to significant business, economic and competitive uncertainties and contingencies. The factors and assumptions contained in this presentation, which may prove to be incorrect, include, but are not limited to: metal prices assumptions, Canadian and U.S. dollar exchange rate assumptions, that there will be no significant disruptions affecting operations, that prices for key mining and construction supplies, including labour and transportation costs, will remain consistent with the Company's expectations, that the Company's current estimates of mineral reserves and resources are accurate, and that there are no material delays in the timing of ongoing development projects. The forward-looking statements are not guarantees of future performance. The Company cautions the reader that such forward-looking statements involve known and unknown risks that may cause the actual results to be materially different from those expressed or implied by the forward-looking statements. Such risks include, but are not limited to: the
possibility that metal prices, foreign exchange rates or operating costs may differ from management's expectations, uncertainty of mineral reserves and resources, inherent risks associated with mining and processing, the risk that the Lac des Iles mine may not perform as planned and that the Offset Zone and other properties may not be successfully developed, and uncertainty of the ability of the Company to obtain financing for future exploration and development. For more details on the factors, assumptions and risks see the Company's most recent Form 40-F/Annual Information Form on file with the U.S. Securities and Exchange Commission and Canadian provincial securities regulatory authorities. The Company disclaims any obligation to update or revise any forward-looking statements, whether as a result of new information, events or otherwise, except as expressly required by law. Readers are cautioned not to put undue reliance on these forward-looking statements.
All dollar amounts are in Canadian currency unless otherwise stated, all references to production refer to payable
production, and all reference to tonnes refer to metric tonnes.
U.S. investors are encouraged to refer to the “Cautionary Note to U.S. Investors Concerning Estimates of Measured, Indicated and Inferred Resources” in the appendix.
2
Growing
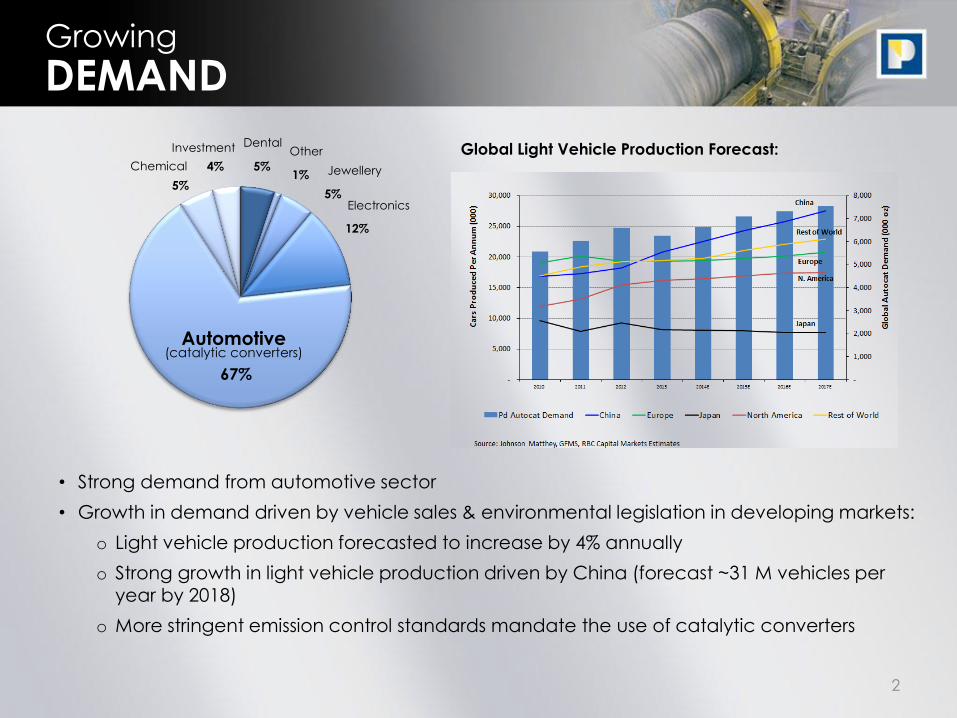
• Strong demand from automotive sector
• Growth in demand driven by vehicle sales & environmental legislation in developing markets:
o Light vehicle production forecasted to increase by 4% annually
o Strong growth in light vehicle production driven by China (forecast ~31 M vehicles per year by 2018)
o More stringent emission control standards mandate the use of catalytic converters
DEMAND
Automotive (catalytic converters)
67%
Electronics
12%
5%
Dental
1%
Other
5%
Jewellery
5%
Chemical 4%
Investment Global Light Vehicle Production Forecast:
3
Constrained
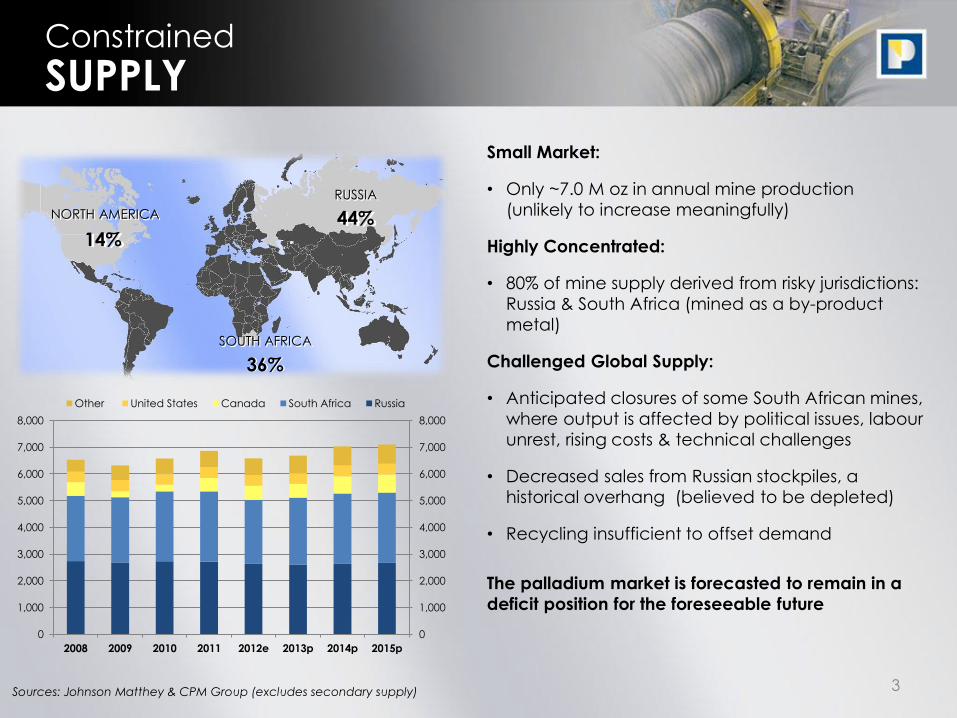
Small Market:
• Only ~7.0 M oz in annual mine production
(unlikely to increase meaningfully)
Highly Concentrated:
• 80% of mine supply derived from risky jurisdictions:
Russia & South Africa (mined as a by-product
metal)
Challenged Global Supply:
• Anticipated closures of some South African mines,
where output is affected by political issues, labour
unrest, rising costs & technical challenges
• Decreased sales from Russian stockpiles, a
historical overhang (believed to be depleted)
• Recycling insufficient to offset demand
The palladium market is forecasted to remain in a
deficit position for the foreseeable future
SUPPLY
0
1,000
2,000
3,000
4,000
5,000
6,000
7,000
8,000
0
1,000
2,000
3,000
4,000
5,000
6,000
7,000
8,000
2008 2009 2010 2011 2012e 2013p 2014p 2015p
Other United States Canada South Africa Russia
NORTH AMERICA
RUSSIA
SOUTH AFRICA
36%
14% 44%
Sources: Johnson Matthey & CPM Group (excludes secondary supply)
4
NAP’s Investment
Attractive PGM Investment Jurisdiction NAP operates in a stable political landscape, with low geopolitical risk and moderate cost
inflation compared to peers in South Africa and Russia
Significant Development & Exploration Upside
Excess mill and production shaft capacity, existing infrastructure & permits, gives NAP the potential
to convert exploration success into production and cash flow on an accelerated timeline
• Growth Strategy to Increase Production & Lower Cash Costs NAP’s mine offers production growth with a decreasing cash cost profile and expanding
operating margins
Strong Senior Management Team with Track Record of Operational Success Operational improvements at LDI implemented in 2013 and 2014. Continuing in 2015 with goal of
achieving expanded production and lower costs
PROPOSITION
5
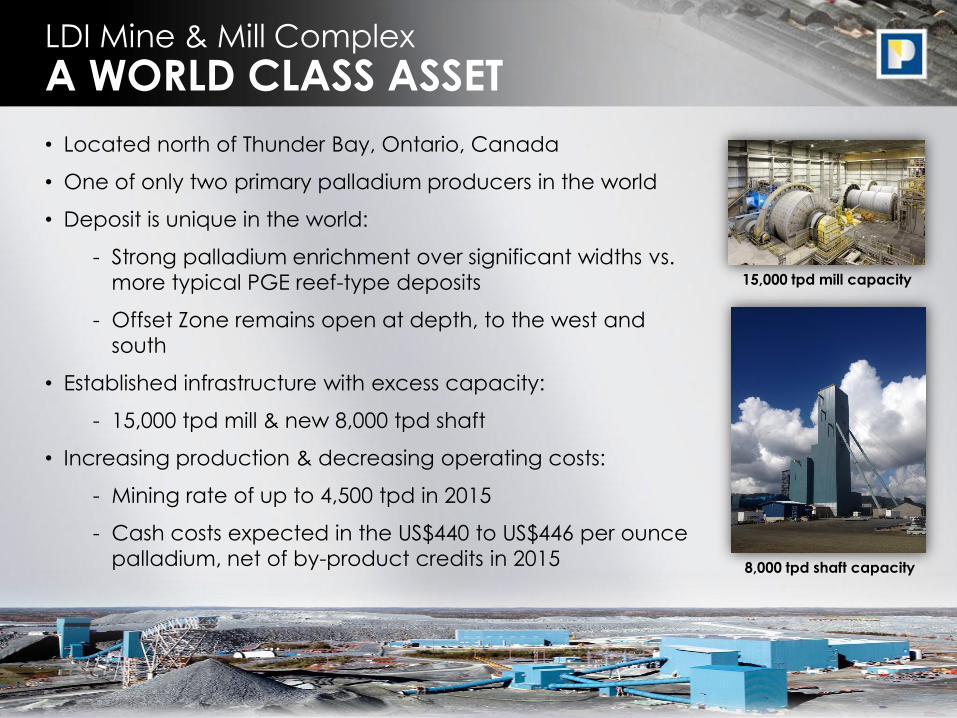
• Located north of Thunder Bay, Ontario, Canada
• One of only two primary palladium producers in the world
• Deposit is unique in the world:
- Strong palladium enrichment over significant widths vs.
more typical PGE reef-type deposits
- Offset Zone remains open at depth, to the west and
south
• Established infrastructure with excess capacity:
- 15,000 tpd mill & new 8,000 tpd shaft
• Increasing production & decreasing operating costs:
- Mining rate of up to 4,500 tpd in 2015
- Cash costs expected in the US$440 to US$446 per ounce
palladium, net of by-product credits in 2015
LDI Mine & Mill Complex
A WORLD CLASS ASSET
15,000 tpd mill capacity
8,000 tpd shaft capacity
6
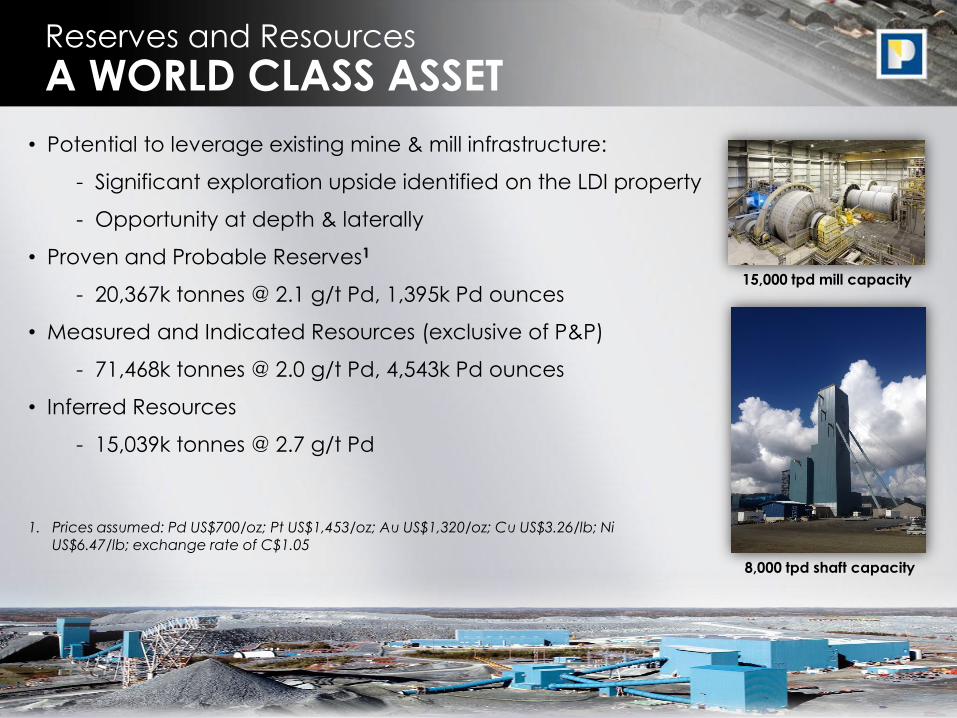
• Potential to leverage existing mine & mill infrastructure:
- Significant exploration upside identified on the LDI property
- Opportunity at depth & laterally
• Proven and Probable Reserves1
- 20,367k tonnes @ 2.1 g/t Pd, 1,395k Pd ounces
• Measured and Indicated Resources (exclusive of P&P)
- 71,468k tonnes @ 2.0 g/t Pd, 4,543k Pd ounces
• Inferred Resources
- 15,039k tonnes @ 2.7 g/t Pd
Reserves and Resources
A WORLD CLASS ASSET
15,000 tpd mill capacity
8,000 tpd shaft capacity
1. Prices assumed: Pd US$700/oz; Pt US$1,453/oz; Au US$1,320/oz; Cu US$3.26/lb; Ni
US$6.47/lb; exchange rate of C$1.05
7
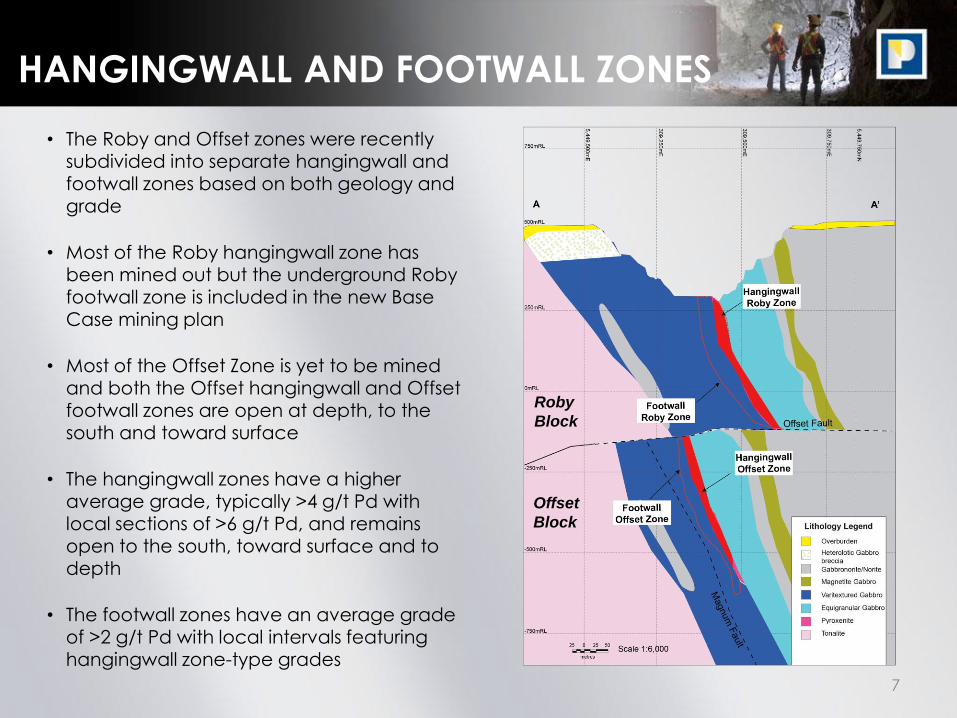
HANGINGWALL AND FOOTWALL ZONES
• The Roby and Offset zones were recently subdivided into separate hangingwall and footwall zones based on both geology and
grade
• Most of the Roby hangingwall zone has been mined out but the underground Roby footwall zone is included in the new Base Case mining plan
• Most of the Offset Zone is yet to be mined and both the Offset hangingwall and Offset footwall zones are open at depth, to the south and toward surface
• The hangingwall zones have a higher average grade, typically >4 g/t Pd with local sections of >6 g/t Pd, and remains open to the south, toward surface and to depth
• The footwall zones have an average grade of >2 g/t Pd with local intervals featuring hangingwall zone-type grades
Roby
Block
Offset
Block
8
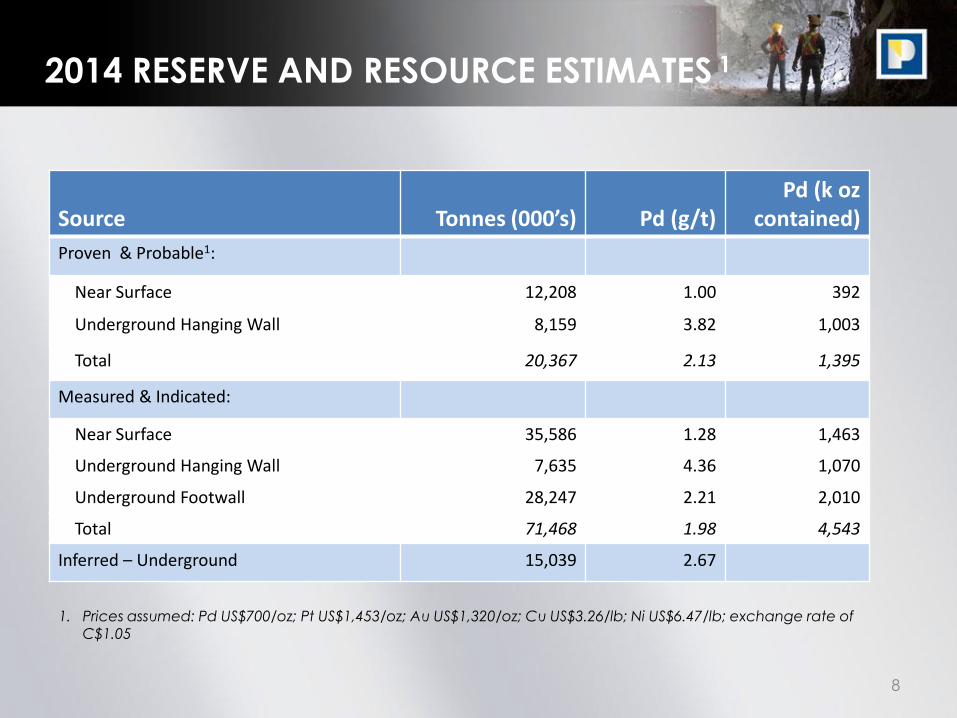
2014 RESERVE AND RESOURCE ESTIMATES 1
Source
Tonnes (000’s)
Pd (g/t)
Pd (k oz contained)
Proven & Probable1:
Near Surface 12,208 1.00 392
Underground Hanging Wall 8,159 3.82 1,003
Total 20,367 2.13 1,395
Measured & Indicated:
Near Surface 35,586 1.28 1,463
Underground Hanging Wall 7,635 4.36 1,070
Underground Footwall 28,247 2.21 2,010
Total 71,468 1.98 4,543
Inferred – Underground 15,039 2.67
1. Prices assumed: Pd US$700/oz; Pt US$1,453/oz; Au US$1,320/oz; Cu US$3.26/lb; Ni US$6.47/lb; exchange rate of C$1.05
9
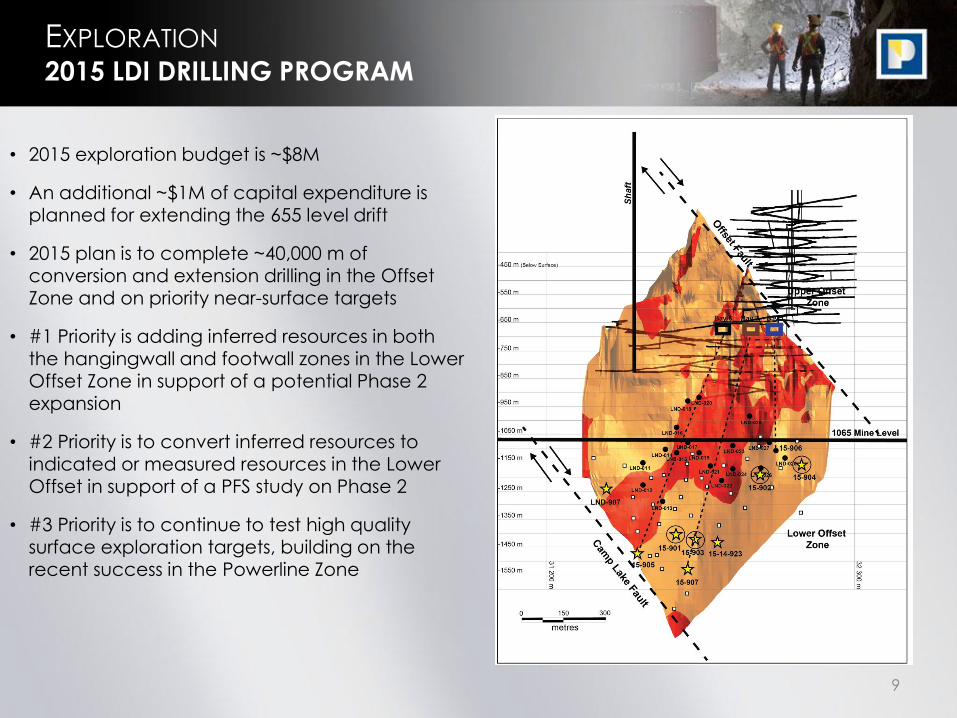
EXPLORATION 2015 LDI DRILLING PROGRAM
• 2015 exploration budget is ~$8M
• An additional ~$1M of capital expenditure is planned for extending the 655 level drift
• 2015 plan is to complete ~40,000 m of conversion and extension drilling in the Offset Zone and on priority near-surface targets
• #1 Priority is adding inferred resources in both the hangingwall and footwall zones in the Lower Offset Zone in support of a potential Phase 2 expansion
• #2 Priority is to convert inferred resources to indicated or measured resources in the Lower Offset in support of a PFS study on Phase 2
• #3 Priority is to continue to test high quality surface exploration targets, building on the recent success in the Powerline Zone
10
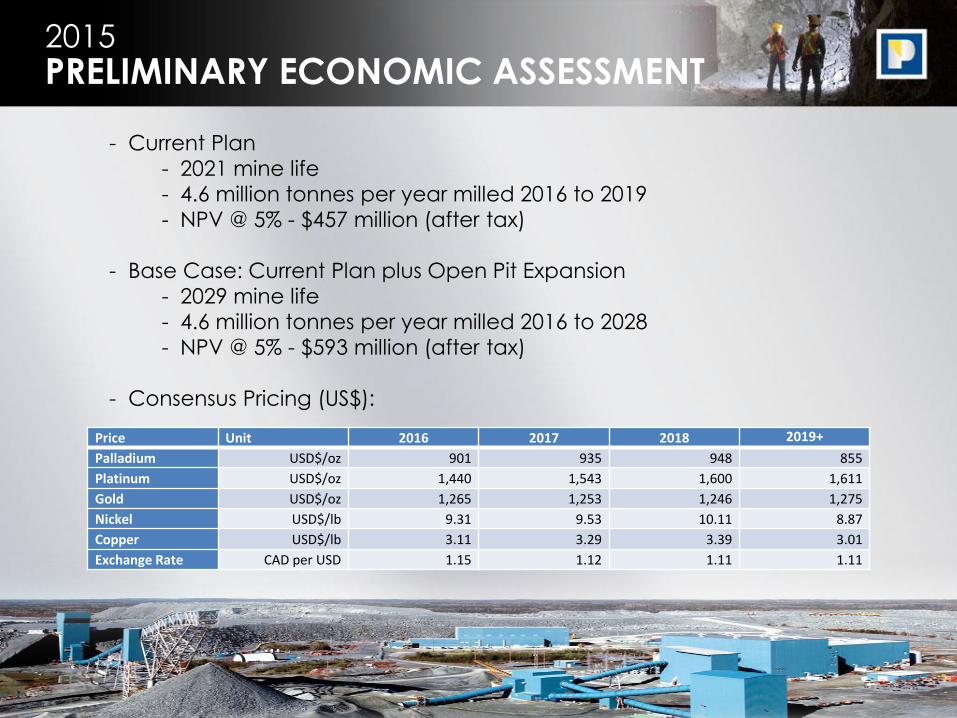
2015
- Current Plan
- 2021 mine life
- 4.6 million tonnes per year milled 2016 to 2019
- NPV @ 5% - $457 million (after tax)
- Base Case: Current Plan plus Open Pit Expansion
- 2029 mine life
- 4.6 million tonnes per year milled 2016 to 2028
- NPV @ 5% - $593 million (after tax)
- Consensus Pricing (US$):
PRELIMINARY ECONOMIC ASSESSMENT
Price Unit 2016 2017 2018 2019+
Palladium USD$/oz 901 935 948 855
Platinum USD$/oz 1,440 1,543 1,600 1,611
Gold USD$/oz 1,265 1,253 1,246 1,275
Nickel USD$/lb 9.31 9.53 10.11 8.87
Copper USD$/lb 3.11 3.29 3.39 3.01
Exchange Rate CAD per USD 1.15 1.12 1.11 1.11
11
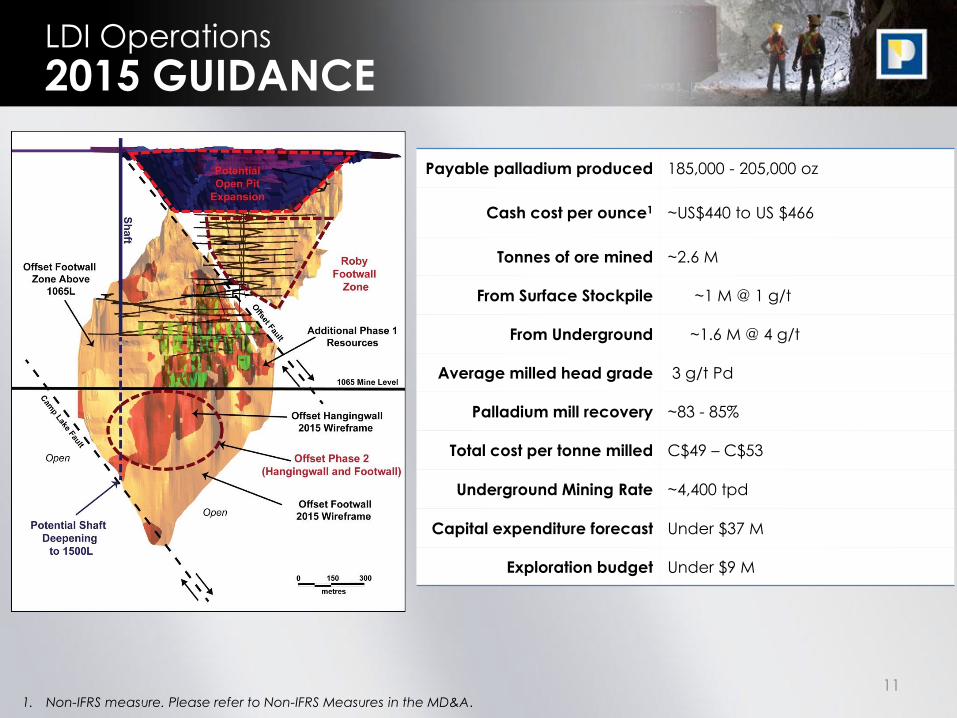
Payable palladium produced 185,000 - 205,000 oz
Cash cost per ounce1 ~US$440 to US $466
Tonnes of ore mined ~2.6 M
From Surface Stockpile ~1 M @ 1 g/t
From Underground ~1.6 M @ 4 g/t
Average milled head grade 3 g/t Pd
Palladium mill recovery ~83 - 85%
Total cost per tonne milled C$49 – C$53
Underground Mining Rate ~4,400 tpd
Capital expenditure forecast Under $37 M
Exploration budget Under $9 M
LDI Operations
2015 GUIDANCE
1. Non-IFRS measure. Please refer to Non-IFRS Measures in the MD&A.
12
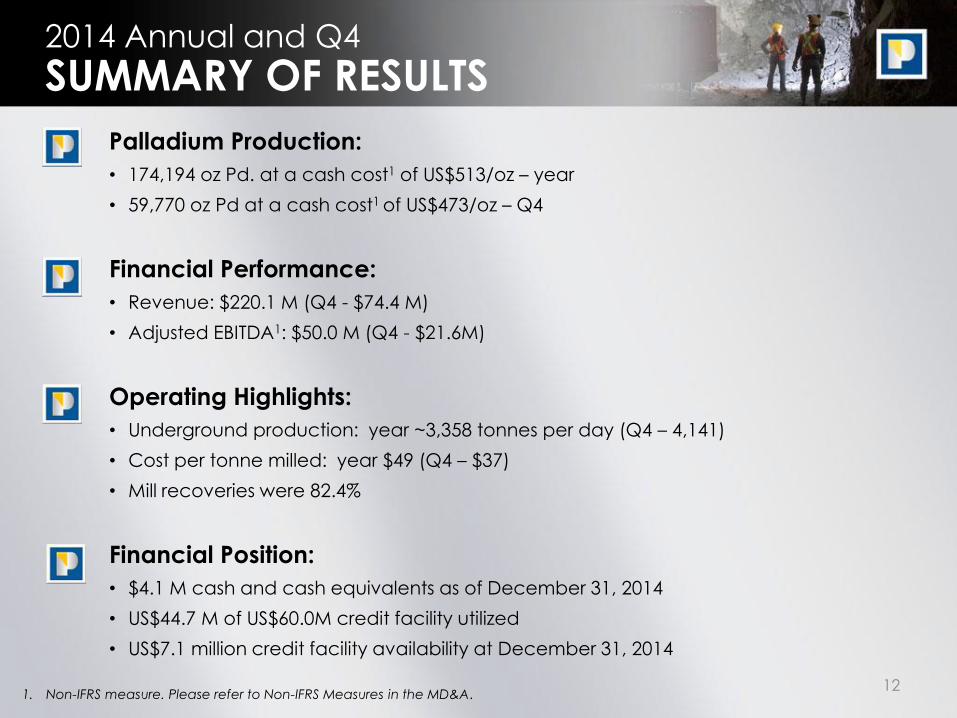
2014 Annual and Q4
Palladium Production:
• 174,194 oz Pd. at a cash cost1 of US$513/oz – year
• 59,770 oz Pd at a cash cost1 of US$473/oz – Q4
Financial Performance:
• Revenue: $220.1 M (Q4 - $74.4 M)
• Adjusted EBITDA1: $50.0 M (Q4 - $21.6M)
Operating Highlights:
• Underground production: year ~3,358 tonnes per day (Q4 – 4,141)
• Cost per tonne milled: year $49 (Q4 – $37)
• Mill recoveries were 82.4%
Financial Position:
• $4.1 M cash and cash equivalents as of December 31, 2014
• US$44.7 M of US$60.0M credit facility utilized
• US$7.1 million credit facility availability at December 31, 2014
SUMMARY OF RESULTS
1. Non-IFRS measure. Please refer to Non-IFRS Measures in the MD&A.
13
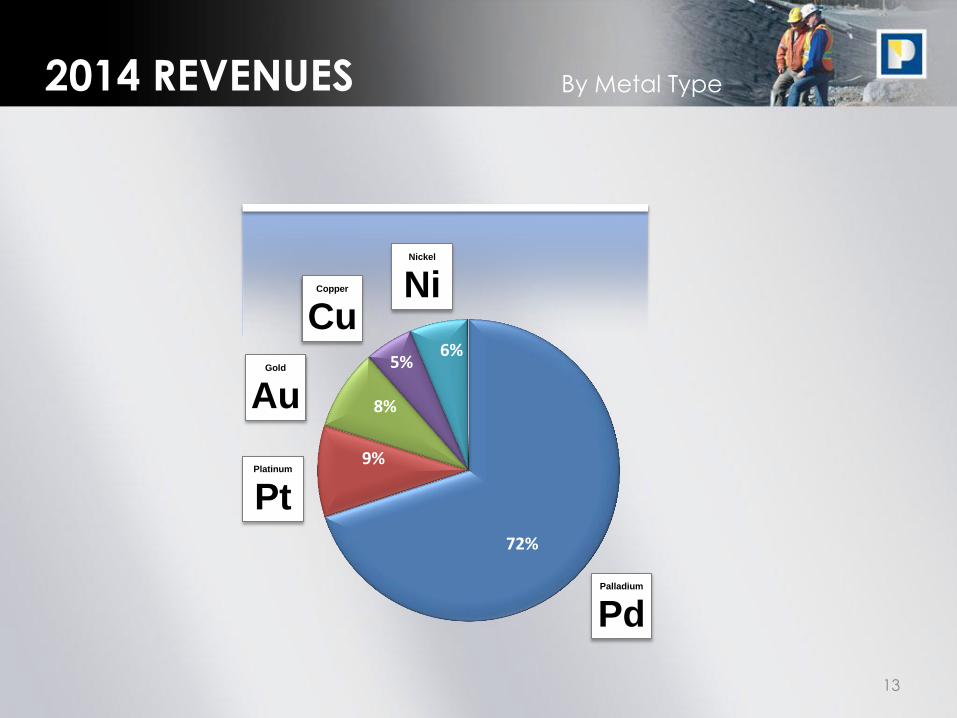
By Metal Type 2014 REVENUES
72%
9%
8%
5% 6%
Pd Palladium
Pt Platinum
Au Gold
Cu Copper Ni
Nickel
14
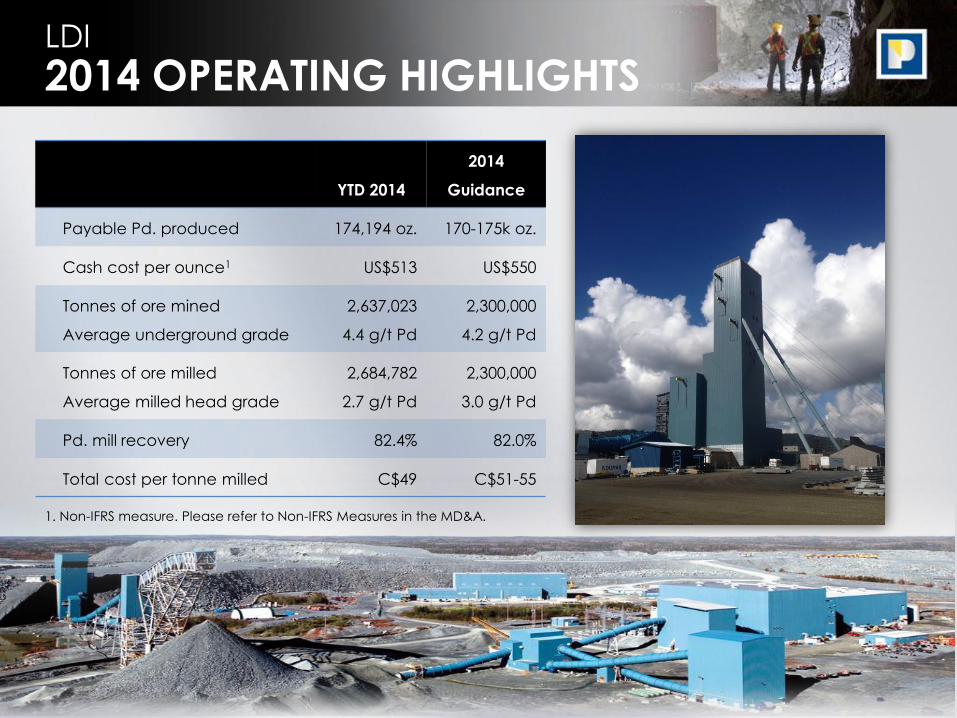
LDI
2014 OPERATING HIGHLIGHTS
YTD 2014
2014
Guidance
Payable Pd. produced 174,194 oz. 170-175k oz.
Cash cost per ounce1 US$513 US$550
Tonnes of ore mined
Average underground grade
2,637,023
4.4 g/t Pd
2,300,000
4.2 g/t Pd
Tonnes of ore milled
Average milled head grade
2,684,782
2.7 g/t Pd
2,300,000
3.0 g/t Pd
Pd. mill recovery 82.4% 82.0%
Total cost per tonne milled C$49 C$51-55
7
1. Non-IFRS measure. Please refer to Non-IFRS Measures in the MD&A.
15
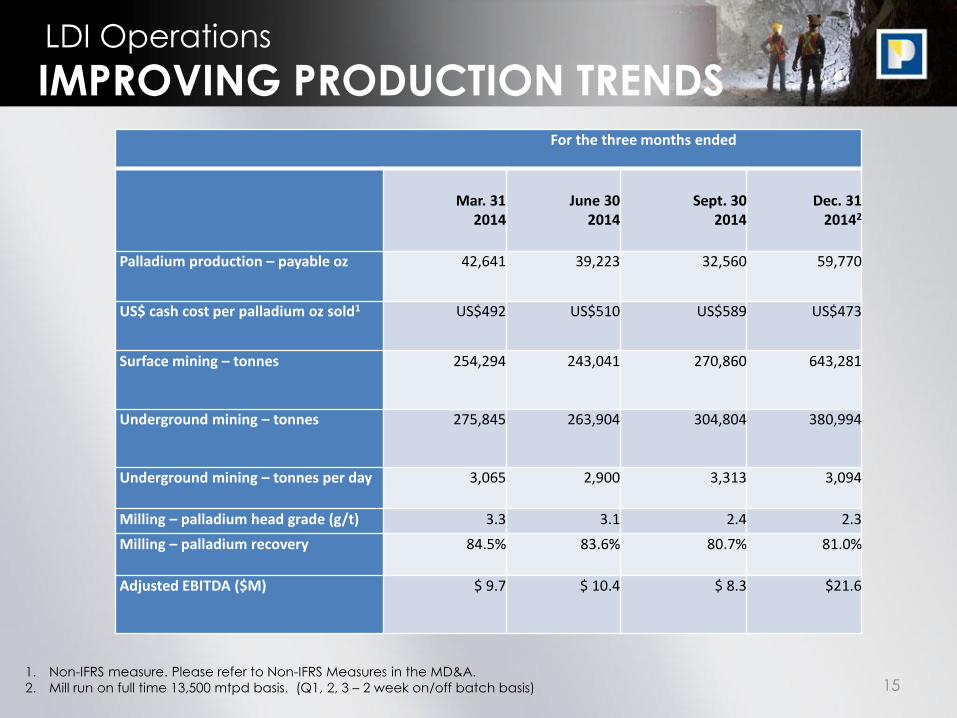
LDI Operations
IMPROVING PRODUCTION TRENDS
1. Non-IFRS measure. Please refer to Non-IFRS Measures in the MD&A.
2. Mill run on full time 13,500 mtpd basis. (Q1, 2, 3 – 2 week on/off batch basis)
For the three months ended
Mar. 31 2014
June 30 2014
Sept. 30 2014
Dec. 31 20142
Palladium production – payable oz 42,641 39,223 32,560 59,770
US$ cash cost per palladium oz sold1 US$492 US$510 US$589 US$473
Surface mining – tonnes 254,294 243,041 270,860 643,281
Underground mining – tonnes 275,845 263,904 304,804 380,994
Underground mining – tonnes per day 3,065 2,900 3,313 3,094
Milling – palladium head grade (g/t) 3.3 3.1 2.4 2.3
Milling – palladium recovery 84.5% 83.6% 80.7% 81.0%
Adjusted EBITDA ($M) $ 9.7 $ 10.4 $ 8.3 $21.6
16
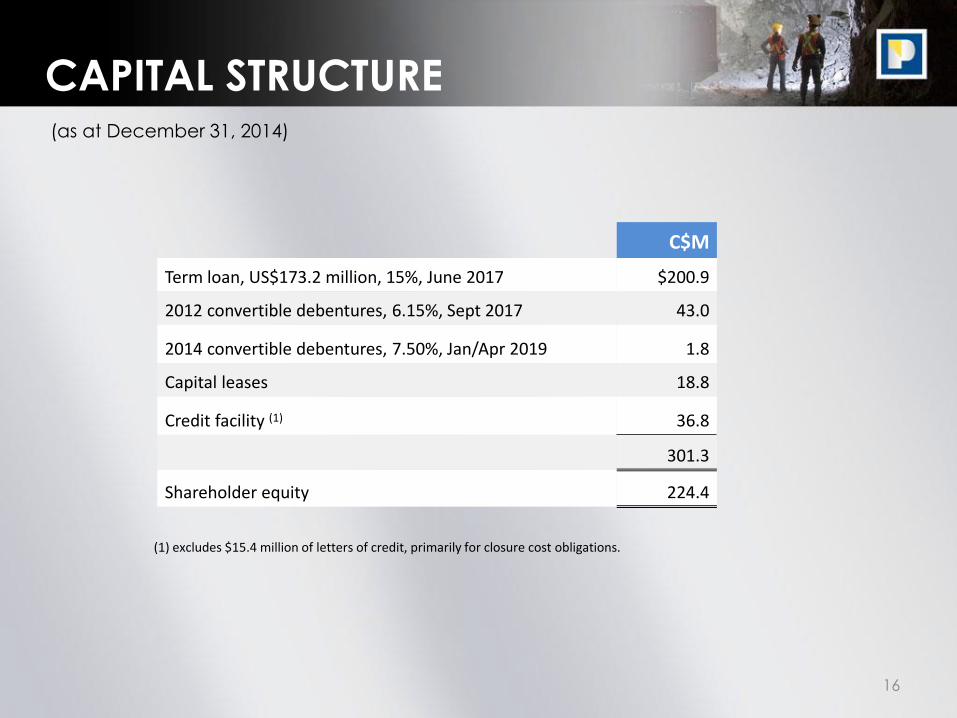
(as at December 31, 2014)
CAPITAL STRUCTURE
(1) excludes $15.4 million of letters of credit, primarily for closure cost obligations.
C$M
Term loan, US$173.2 million, 15%, June 2017 $200.9
2012 convertible debentures, 6.15%, Sept 2017 43.0
2014 convertible debentures, 7.50%, Jan/Apr 2019 1.8
Capital leases 18.8
Credit facility (1) 36.8
301.3
Shareholder equity 224.4
17
Full-time 8,400 mtpd trial mill run in effect for 2015 intent to
increase to 13,500 mtpd in 2016
Long-term tailings management facility solution being
implemented in 2015 and 2016. Sufficient capacity to 2030
Strategy to improve equipment fleet productivity and availability
Installation of second flash floatation cell to maintain higher recoveries at higher tonnage mill run
LDI INITIATIVES
18
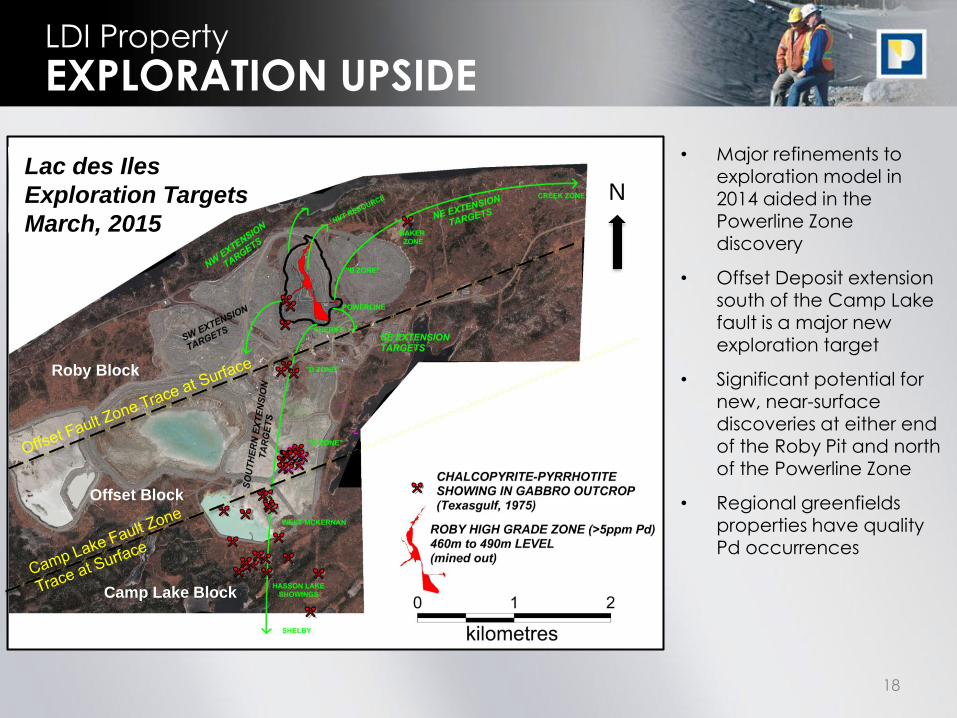
LDI Property
EXPLORATION UPSIDE
• Major refinements to
exploration model in 2014 aided in the Powerline Zone discovery
• Offset Deposit extension south of the Camp Lake
fault is a major new exploration target
• Significant potential for new, near-surface discoveries at either end of the Roby Pit and north
of the Powerline Zone
• Regional greenfields properties have quality Pd occurrences
N N Lac des Iles
Exploration Targets
March, 2015
Roby Block
Offset Block
Camp Lake Block
19
Appendices &
FURTHER INFORMATION
20
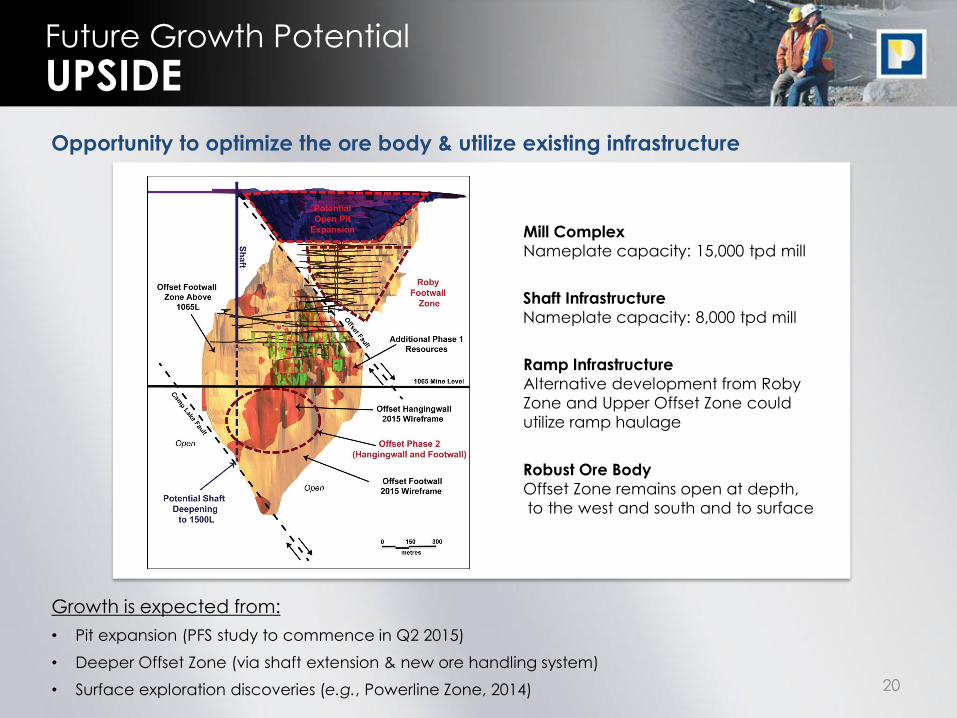
Future Growth Potential
UPSIDE
Mill Complex
Nameplate capacity: 15,000 tpd mill
Shaft Infrastructure
Nameplate capacity: 8,000 tpd mill
Robust Ore Body
Offset Zone remains open at depth,
to the west and south and to surface
Opportunity to optimize the ore body & utilize existing infrastructure
Growth is expected from:
• Pit expansion (PFS study to commence in Q2 2015)
• Deeper Offset Zone (via shaft extension & new ore handling system)
• Surface exploration discoveries (e.g., Powerline Zone, 2014)
Ramp Infrastructure
Alternative development from Roby
Zone and Upper Offset Zone could
utilize ramp haulage
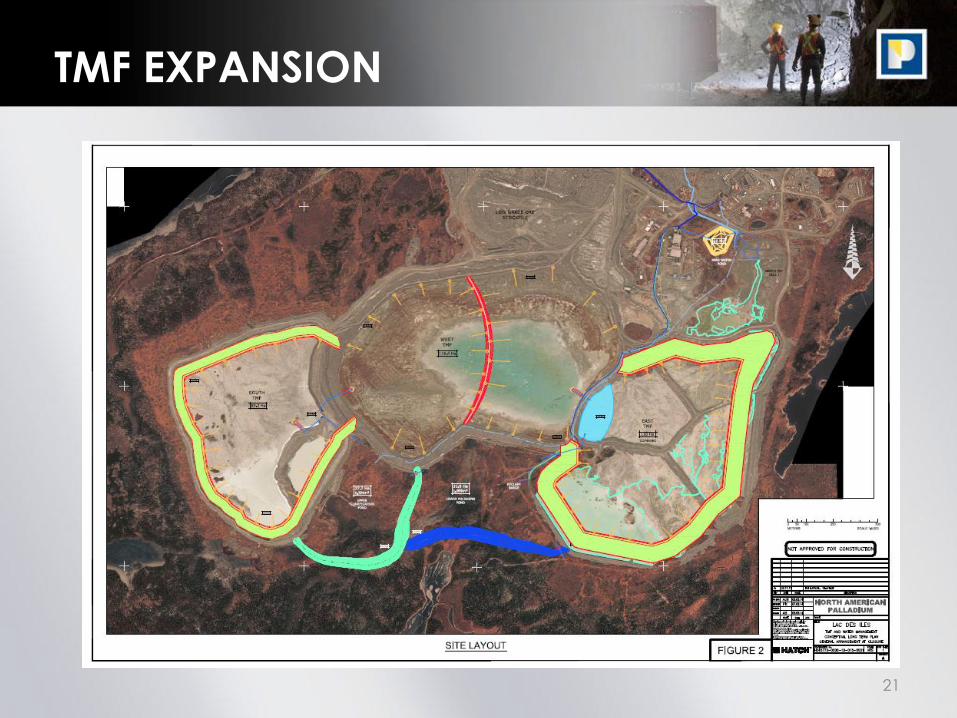
21
TMF EXPANSION
22
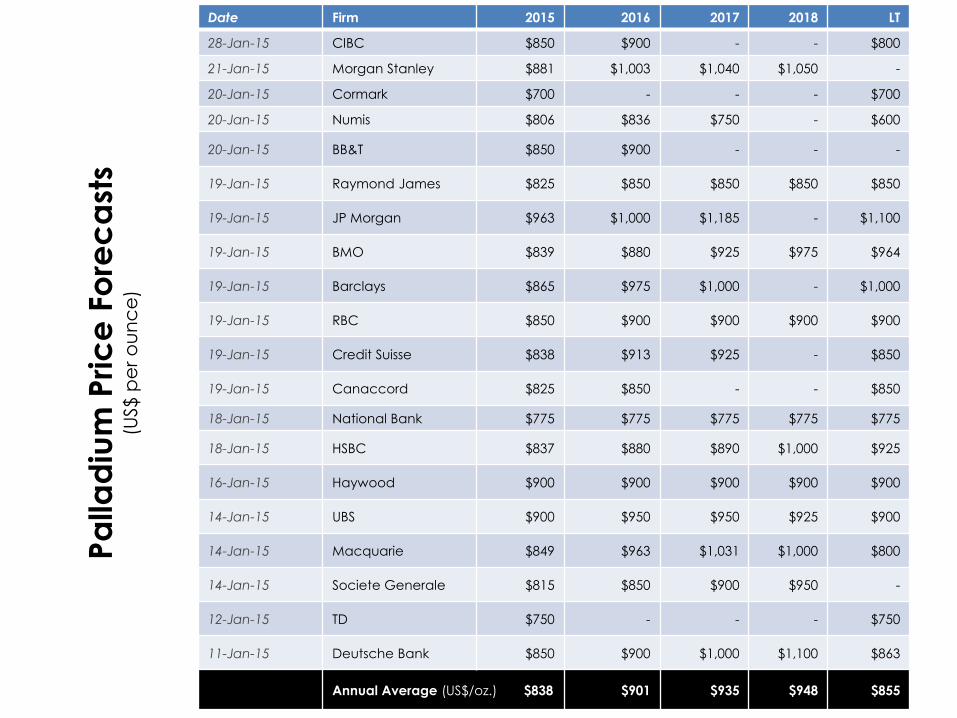
Date Firm 2015 2016 2017 2018 LT
28-Jan-15 CIBC $850 $900 - - $800
21-Jan-15 Morgan Stanley $881 $1,003 $1,040 $1,050 -
20-Jan-15 Cormark $700 - - - $700
20-Jan-15 Numis $806 $836 $750 - $600
20-Jan-15 BB&T $850 $900 - - -
19-Jan-15 Raymond James $825 $850 $850 $850 $850
19-Jan-15 JP Morgan $963 $1,000 $1,185 - $1,100
19-Jan-15 BMO $839 $880 $925 $975 $964
19-Jan-15 Barclays $865 $975 $1,000 - $1,000
19-Jan-15 RBC $850 $900 $900 $900 $900
19-Jan-15 Credit Suisse $838 $913 $925 - $850
19-Jan-15 Canaccord $825 $850 - - $850
18-Jan-15 National Bank $775 $775 $775 $775 $775
18-Jan-15 HSBC $837 $880 $890 $1,000 $925
16-Jan-15 Haywood $900 $900 $900 $900 $900
14-Jan-15 UBS $900 $950 $950 $925 $900
14-Jan-15 Macquarie $849 $963 $1,031 $1,000 $800
14-Jan-15 Societe Generale $815 $850 $900 $950 -
12-Jan-15 TD $750 - - - $750
11-Jan-15 Deutsche Bank $850 $900 $1,000 $1,100 $863
Annual Average (US$/oz.) $838 $901 $935 $948 $855
Pa
llad
ium
Pric
e F
ore
ca
sts
(US$
pe
r o
un
ce
)
23
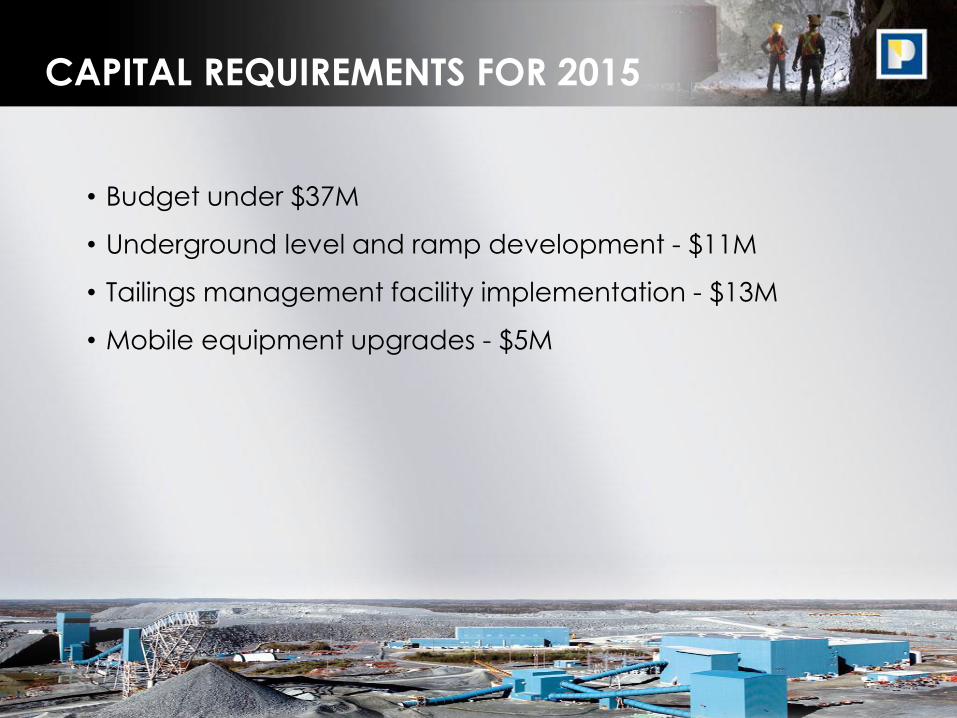
CAPITAL REQUIREMENTS FOR 2015
• Budget under $37M
• Underground level and ramp development - $11M
• Tailings management facility implementation - $13M
• Mobile equipment upgrades - $5M
24
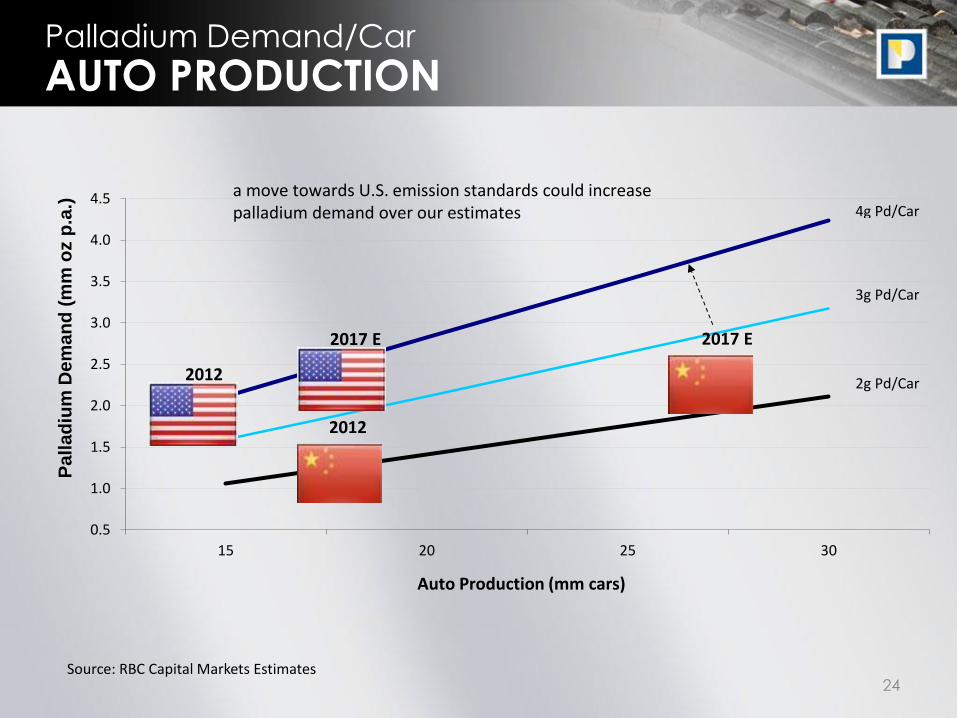
Palladium Demand/Car
AUTO PRODUCTION
0.5
1.0
1.5
2.0
2.5
3.0
3.5
4.0
4.5
15 20 25 30
Pa
lla
diu
m D
em
an
d (
mm
oz p
.a.)
Auto Production (mm cars)
2g Pd/Car
3g Pd/Car
4g Pd/Car
2012
2012
2017 E 2017 E
a move towards U.S. emission standards could increase palladium demand over our estimates
Source: RBC Capital Markets Estimates
25
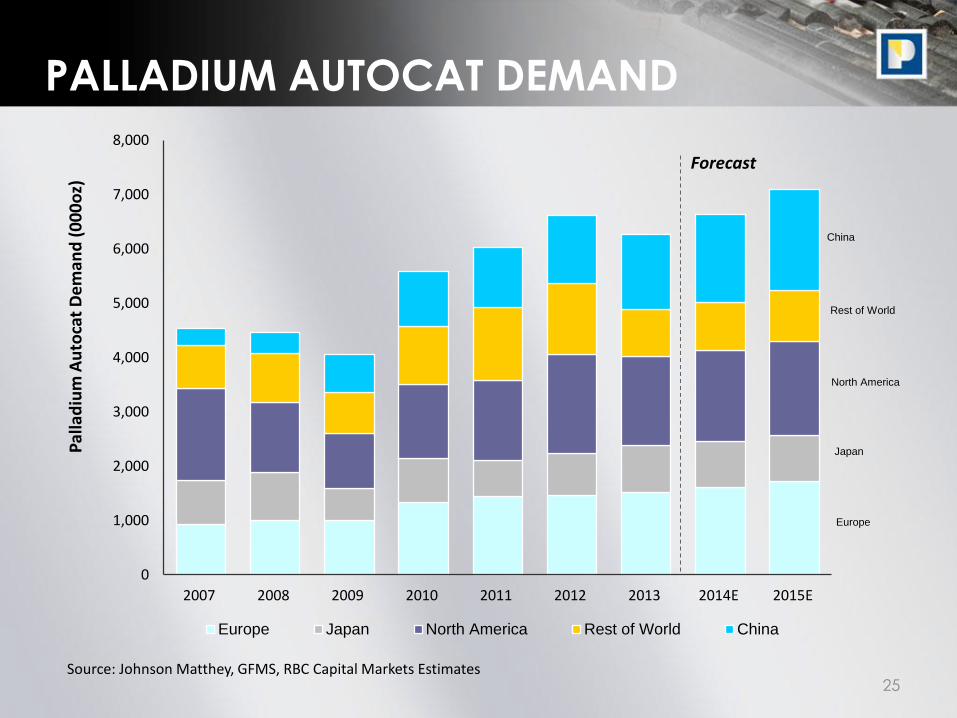
PALLADIUM AUTOCAT DEMAND
Europe
Japan
North America
Rest of World
China
0
1,000
2,000
3,000
4,000
5,000
6,000
7,000
8,000
2007 2008 2009 2010 2011 2012 2013 2014E 2015E
Pal
lad
ium
Au
toca
t D
em
and
(0
00
oz)
Europe Japan North America Rest of World China
Forecast
Source: Johnson Matthey, GFMS, RBC Capital Markets Estimates
26
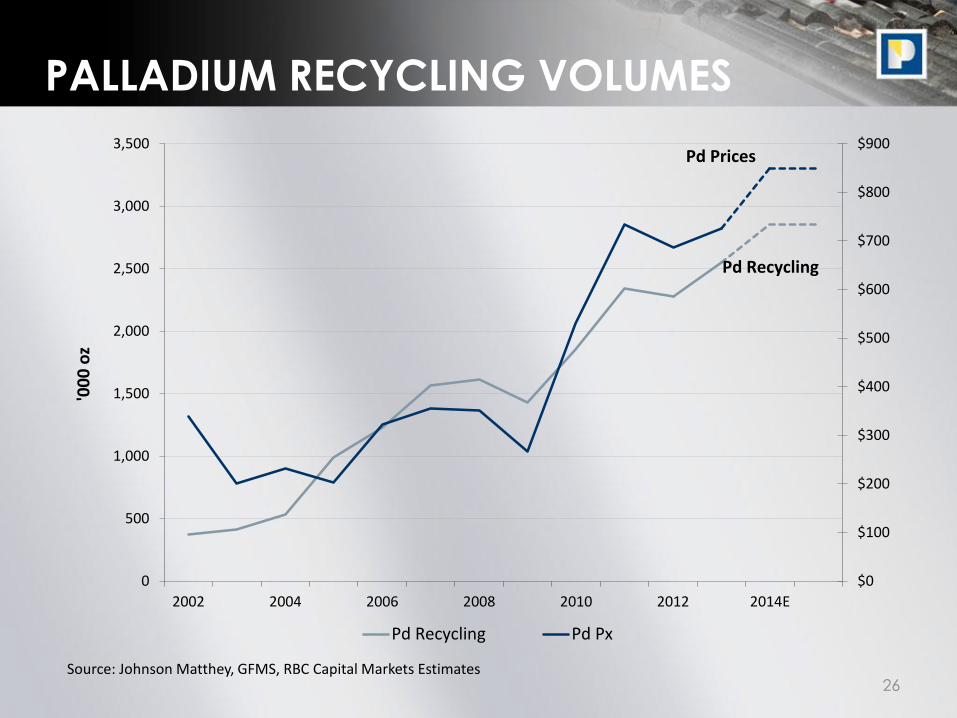
PALLADIUM RECYCLING VOLUMES
$0
$100
$200
$300
$400
$500
$600
$700
$800
$900
0
500
1,000
1,500
2,000
2,500
3,000
3,500
2002 2004 2006 2008 2010 2012 2014E
'00
0 o
z
Pd Recycling Pd Px
Pd Recycling
Pd Prices
Source: Johnson Matthey, GFMS, RBC Capital Markets Estimates
27
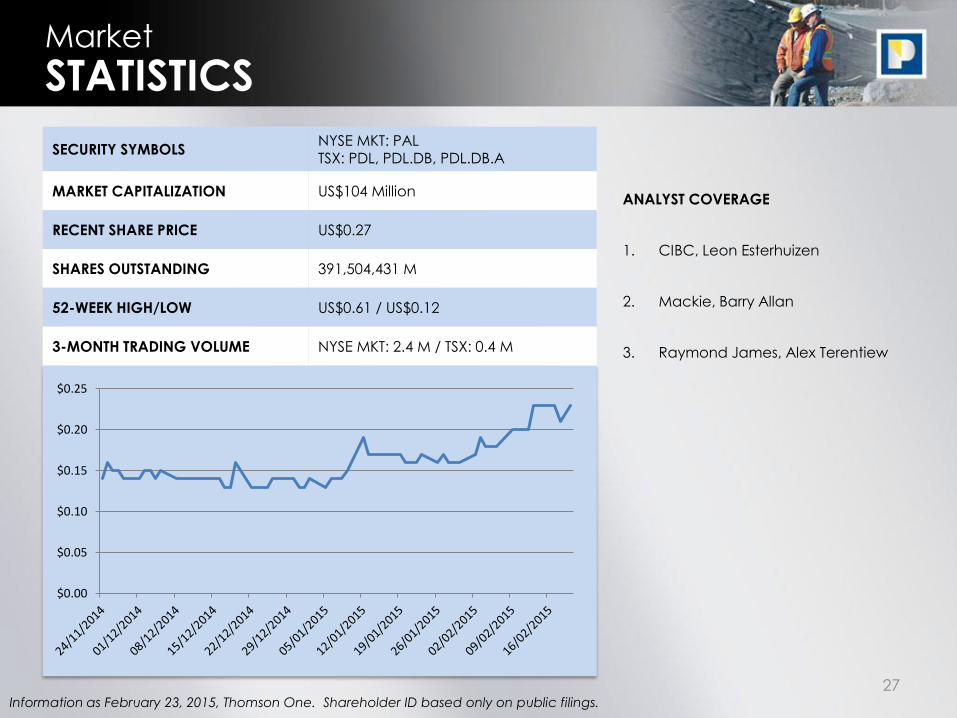
Market
STATISTICS
Information as February 23, 2015, Thomson One. Shareholder ID based only on public filings.
SECURITY SYMBOLS NYSE MKT: PAL TSX: PDL, PDL.DB, PDL.DB.A
MARKET CAPITALIZATION US$104 Million
RECENT SHARE PRICE US$0.27
SHARES OUTSTANDING 391,504,431 M
52-WEEK HIGH/LOW US$0.61 / US$0.12
3-MONTH TRADING VOLUME NYSE MKT: 2.4 M / TSX: 0.4 M
ANALYST COVERAGE
1. CIBC, Leon Esterhuizen
2. Mackie, Barry Allan
3. Raymond James, Alex Terentiew
$0.00
$0.05
$0.10
$0.15
$0.20
$0.25
28
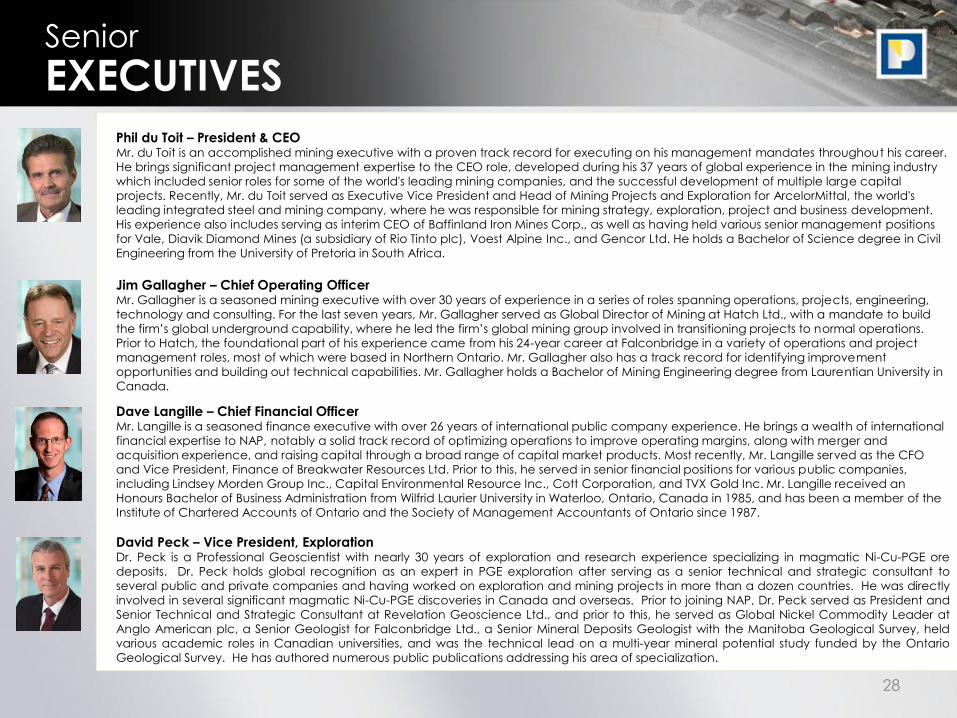
Senior
EXECUTIVES
Phil du Toit – President & CEO Mr. du Toit is an accomplished mining executive with a proven track record for executing on his management mandates throughout his career.
He brings significant project management expertise to the CEO role, developed during his 37 years of global experience in the mining industry
which included senior roles for some of the world's leading mining companies, and the successful development of multiple large capital
projects. Recently, Mr. du Toit served as Executive Vice President and Head of Mining Projects and Exploration for ArcelorMittal, the world's
leading integrated steel and mining company, where he was responsible for mining strategy, exploration, project and business development.
His experience also includes serving as interim CEO of Baffinland Iron Mines Corp., as well as having held various senior management positions
for Vale, Diavik Diamond Mines (a subsidiary of Rio Tinto plc), Voest Alpine Inc., and Gencor Ltd. He holds a Bachelor of Science degree in Civil
Engineering from the University of Pretoria in South Africa.
Dave Langille – Chief Financial Officer Mr. Langille is a seasoned finance executive with over 26 years of international public company experience. He brings a wealth of international
financial expertise to NAP, notably a solid track record of optimizing operations to improve operating margins, along with merger and
acquisition experience, and raising capital through a broad range of capital market products. Most recently, Mr. Langille served as the CFO
and Vice President, Finance of Breakwater Resources Ltd. Prior to this, he served in senior financial positions for various public companies,
including Lindsey Morden Group Inc., Capital Environmental Resource Inc., Cott Corporation, and TVX Gold Inc. Mr. Langille received an
Honours Bachelor of Business Administration from Wilfrid Laurier University in Waterloo, Ontario, Canada in 1985, and has been a member of the
Institute of Chartered Accounts of Ontario and the Society of Management Accountants of Ontario since 1987.
David Peck – Vice President, Exploration Dr. Peck is a Professional Geoscientist with nearly 30 years of exploration and research experience specializing in magmatic Ni-Cu-PGE ore
deposits. Dr. Peck holds global recognition as an expert in PGE exploration after serving as a senior technical and strategic consultant to
several public and private companies and having worked on exploration and mining projects in more than a dozen countries. He was directly
involved in several significant magmatic Ni-Cu-PGE discoveries in Canada and overseas. Prior to joining NAP, Dr. Peck served as President and
Senior Technical and Strategic Consultant at Revelation Geoscience Ltd., and prior to this, he served as Global Nickel Commodity Leader at
Anglo American plc, a Senior Geologist for Falconbridge Ltd., a Senior Mineral Deposits Geologist with the Manitoba Geological Survey, held
various academic roles in Canadian universities, and was the technical lead on a multi-year mineral potential study funded by the Ontario
Geological Survey. He has authored numerous public publications addressing his area of specialization.
Jim Gallagher – Chief Operating Officer Mr. Gallagher is a seasoned mining executive with over 30 years of experience in a series of roles spanning operations, projects, engineering,
technology and consulting. For the last seven years, Mr. Gallagher served as Global Director of Mining at Hatch Ltd., with a mandate to build the firm’s global underground capability, where he led the firm’s global mining group involved in transitioning projects to normal operations.
Prior to Hatch, the foundational part of his experience came from his 24-year career at Falconbridge in a variety of operations and project
management roles, most of which were based in Northern Ontario. Mr. Gallagher also has a track record for identifying improvement
opportunities and building out technical capabilities. Mr. Gallagher holds a Bachelor of Mining Engineering degree from Laurentian University in
Canada.
29
Cautionary Note to U.S. Investors Concerning
• Mineral reserves and mineral resources have been calculated in accordance with National Instrument
43-101 as required by Canadian securities regulatory authorities. For United States reporting purposes,
Industry Guide 7, (under the Securities and Exchange Act of 1934), as interpreted by Staff of the Securities
Exchange Commission (SEC), applies different standards in order to classify mineralization as a reserve. In
addition, while the terms “measured”, “indicated” and “inferred” mineral resources are required pursuant
to National Instrument 43-101, the U.S. Securities and Exchange Commission does not recognize such
terms. Canadian standards differ significantly from the requirements of the SEC, and mineral resource
information contained herein is not comparable to similar information regarding mineral reserves
disclosed in accordance with the requirements of the U.S. Securities and Exchange Commission. U.S.
investors should understand that “inferred” mineral resources have a great amount of uncertainty as to
their existence and great uncertainty as to their economic and legal feasibility. In addition, U.S. investors
are cautioned not to assume that any part or all of NAP's mineral resources constitute or will be
converted into reserves. For a more detailed description of the key assumptions, parameters and
methods used in calculating NAP’s mineral reserves and mineral resources, see NAP’s most recent Annual
Information Form/Form 40-F on file with Canadian provincial securities regulatory authorities and the SEC.
• Please refer to North American Palladium’s most current Annual Information Form and applicable
technical reports available on www.sedar.com, www.sec.gov and www.nap.com for further information.
MINERAL RESERVES AND MINERAL RESOURCE
30
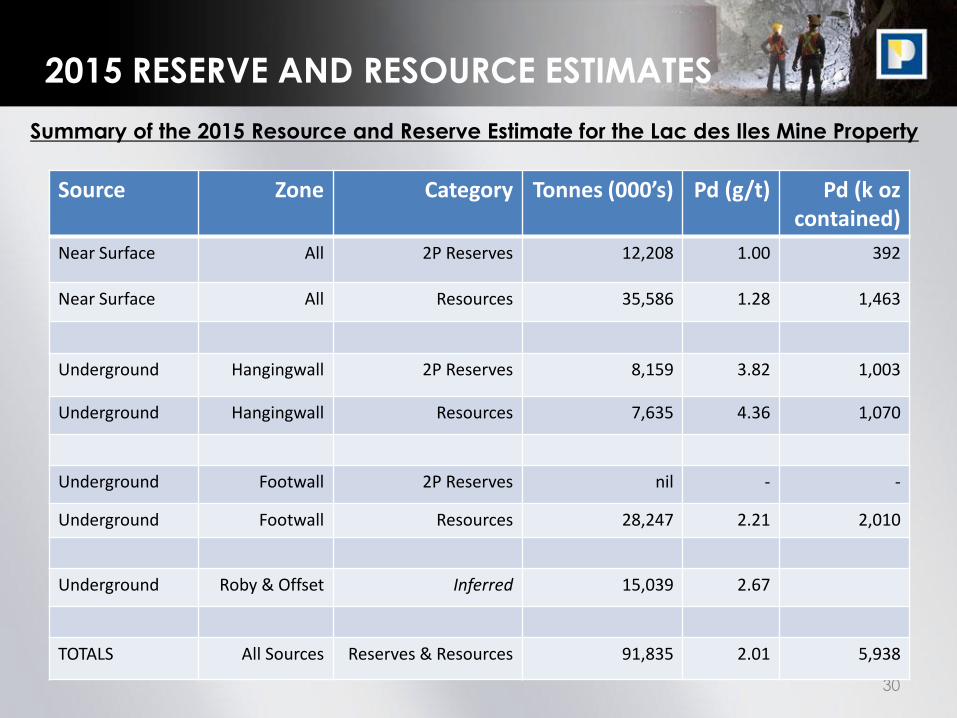
2015 RESERVE AND RESOURCE ESTIMATES
Summary of the 2015 Resource and Reserve Estimate for the Lac des Iles Mine Property
Source Zone Category Tonnes (000’s) Pd (g/t) Pd (k oz contained)
Near Surface All 2P Reserves 12,208 1.00 392
Near Surface All Resources 35,586 1.28 1,463
Underground Hangingwall 2P Reserves 8,159 3.82 1,003
Underground Hangingwall Resources 7,635 4.36 1,070
Underground Footwall 2P Reserves nil - -
Underground Footwall Resources 28,247 2.21 2,010
Underground Roby & Offset Inferred 15,039 2.67
TOTALS All Sources Reserves & Resources 91,835 2.01 5,938
31
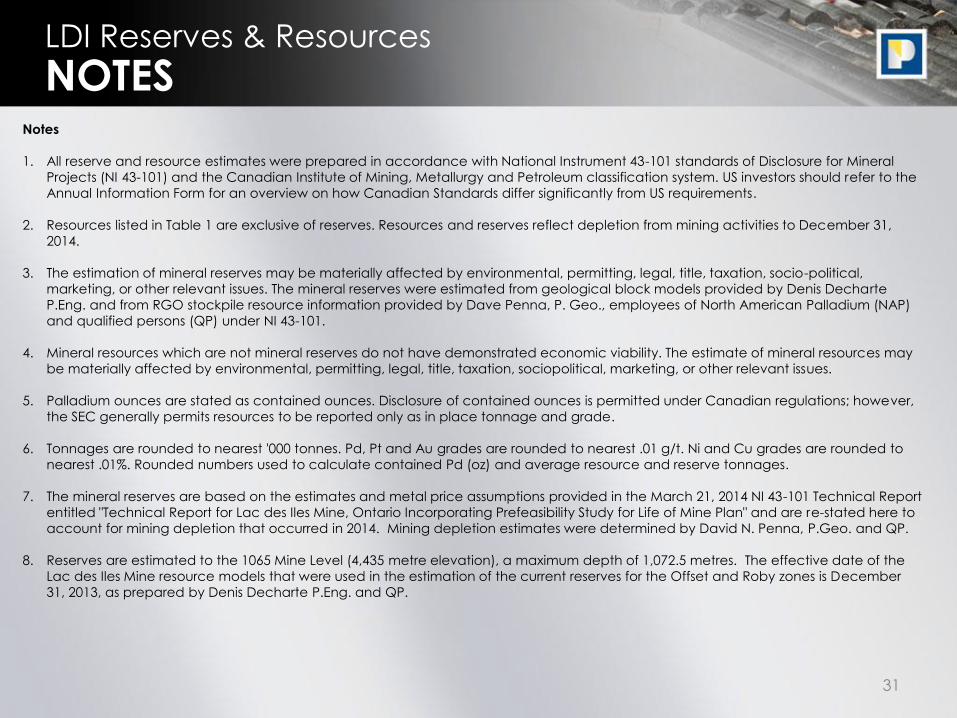
LDI Reserves & Resources
Notes
1. All reserve and resource estimates were prepared in accordance with National Instrument 43-101 standards of Disclosure for Mineral
Projects (NI 43-101) and the Canadian Institute of Mining, Metallurgy and Petroleum classification system. US investors should refer to the
Annual Information Form for an overview on how Canadian Standards differ significantly from US requirements.
2. Resources listed in Table 1 are exclusive of reserves. Resources and reserves reflect depletion from mining activities to December 31,
2014.
3. The estimation of mineral reserves may be materially affected by environmental, permitting, legal, title, taxation, socio-political,
marketing, or other relevant issues. The mineral reserves were estimated from geological block models provided by Denis Decharte
P.Eng. and from RGO stockpile resource information provided by Dave Penna, P. Geo., employees of North American Palladium (NAP)
and qualified persons (QP) under NI 43-101.
4. Mineral resources which are not mineral reserves do not have demonstrated economic viability. The estimate of mineral resources may
be materially affected by environmental, permitting, legal, title, taxation, sociopolitical, marketing, or other relevant issues.
5. Palladium ounces are stated as contained ounces. Disclosure of contained ounces is permitted under Canadian regulations; however,
the SEC generally permits resources to be reported only as in place tonnage and grade.
6. Tonnages are rounded to nearest '000 tonnes. Pd, Pt and Au grades are rounded to nearest .01 g/t. Ni and Cu grades are rounded to
nearest .01%. Rounded numbers used to calculate contained Pd (oz) and average resource and reserve tonnages.
7. The mineral reserves are based on the estimates and metal price assumptions provided in the March 21, 2014 NI 43-101 Technical Report
entitled "Technical Report for Lac des Iles Mine, Ontario Incorporating Prefeasibility Study for Life of Mine Plan" and are re-stated here to
account for mining depletion that occurred in 2014. Mining depletion estimates were determined by David N. Penna, P.Geo. and QP.
8. Reserves are estimated to the 1065 Mine Level (4,435 metre elevation), a maximum depth of 1,072.5 metres. The effective date of the
Lac des Iles Mine resource models that were used in the estimation of the current reserves for the Offset and Roby zones is December
31, 2013, as prepared by Denis Decharte P.Eng. and QP.
NOTES
32
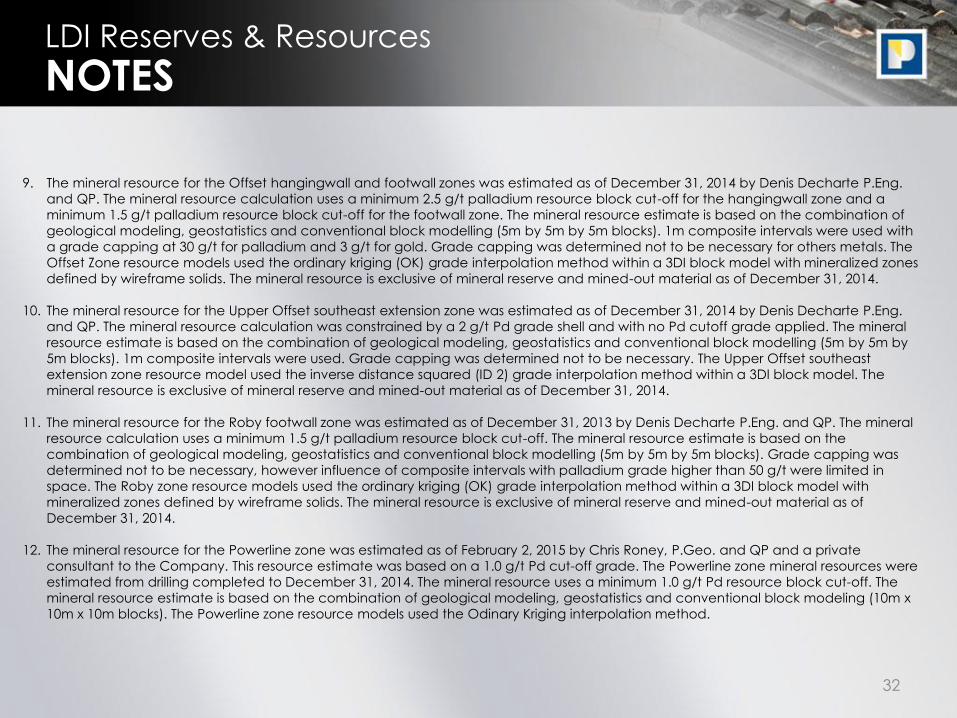
LDI Reserves & Resources
9. The mineral resource for the Offset hangingwall and footwall zones was estimated as of December 31, 2014 by Denis Decharte P.Eng.
and QP. The mineral resource calculation uses a minimum 2.5 g/t palladium resource block cut-off for the hangingwall zone and a
minimum 1.5 g/t palladium resource block cut-off for the footwall zone. The mineral resource estimate is based on the combination of
geological modeling, geostatistics and conventional block modelling (5m by 5m by 5m blocks). 1m composite intervals were used with
a grade capping at 30 g/t for palladium and 3 g/t for gold. Grade capping was determined not to be necessary for others metals. The
Offset Zone resource models used the ordinary kriging (OK) grade interpolation method within a 3DI block model with mineralized zones
defined by wireframe solids. The mineral resource is exclusive of mineral reserve and mined-out material as of December 31, 2014.
10. The mineral resource for the Upper Offset southeast extension zone was estimated as of December 31, 2014 by Denis Decharte P.Eng.
and QP. The mineral resource calculation was constrained by a 2 g/t Pd grade shell and with no Pd cutoff grade applied. The mineral
resource estimate is based on the combination of geological modeling, geostatistics and conventional block modelling (5m by 5m by
5m blocks). 1m composite intervals were used. Grade capping was determined not to be necessary. The Upper Offset southeast
extension zone resource model used the inverse distance squared (ID 2) grade interpolation method within a 3DI block model. The
mineral resource is exclusive of mineral reserve and mined-out material as of December 31, 2014.
11. The mineral resource for the Roby footwall zone was estimated as of December 31, 2013 by Denis Decharte P.Eng. and QP. The mineral
resource calculation uses a minimum 1.5 g/t palladium resource block cut-off. The mineral resource estimate is based on the
combination of geological modeling, geostatistics and conventional block modelling (5m by 5m by 5m blocks). Grade capping was
determined not to be necessary, however influence of composite intervals with palladium grade higher than 50 g/t were limited in
space. The Roby zone resource models used the ordinary kriging (OK) grade interpolation method within a 3DI block model with
mineralized zones defined by wireframe solids. The mineral resource is exclusive of mineral reserve and mined-out material as of
December 31, 2014.
12. The mineral resource for the Powerline zone was estimated as of February 2, 2015 by Chris Roney, P.Geo. and QP and a private
consultant to the Company. This resource estimate was based on a 1.0 g/t Pd cut-off grade. The Powerline zone mineral resources were
estimated from drilling completed to December 31, 2014. The mineral resource uses a minimum 1.0 g/t Pd resource block cut-off. The
mineral resource estimate is based on the combination of geological modeling, geostatistics and conventional block modeling (10m x
10m x 10m blocks). The Powerline zone resource models used the Odinary Kriging interpolation method.
NOTES
33
LDI Reserves & Resources
13. The mineral resources for the Sheriff Zone are based on estimates originally provided in the Company’s September 5, 2013 press release
and adjusted to account for the overlap with the preliminary resource estimates for the Powerline Zone.
14. The mineral resource for the North VT Rim zone was estimated as at December 31, 2013 by Chris Roney, P.Geo. and QP. This resource
estimate was based on a 1.0 g/t Pd cut-off grade. The North VT Rim zone mineral resources were estimated from drilling completed to
April 15, 2013. The mineral resource uses a minimum 1.0 g/t Pd resource block cut-off. The mineral resource estimate is based on the
combination of geological modeling, geostatistics and conventional block modeling (5m x 5m x 5m blocks). The North VT Rim resource
models used the inverse distance squared (ID 2) grade interpolation method.
15. Mineral resource estimates for the low-grade stockpile (RGO) shown in the Company's March 21, 2013 statement of mineral reserves
and mineral resources were converted to proven mineral reserves, under the direction of David N. Penna, P.Geo. and QP.
NOTES
34
Shareholder
INFORMATION
North American Palladium’s vision is to become a low cost, mid-tier precious metals company operating in
mining friendly jurisdictions. NAP is an established precious metals producer that has been operating its Lac des
Iles mine (LDI) located in Ontario, Canada since 1993. LDI is one of only two primary producers of palladium in
the world, and is currently completing a major expansion to increase production and reduce cash costs per
ounce.
Royal Bank Plaza, South Tower 200 Bay St., Suite 2350
Toronto, ON M5J 2J2
NYSE MKT– PAL TSX – PDL, PDL.DB, PDL.DB.A
www.nap.com
Investor Relations & Corporate Communications [email protected]
416-360-7374
Corporate Office:
Security Symbols:
Website:
Investor Relations: