Embed Size (px)
Citation preview

Stock Focus McMillan Shakespeare (MMS)
1
COME AND JOIN THE JOY RIDE
RECOMMENDATION : POSITIVE MMS adds to its 5-year EPS compound annual growth rate of 31.8% with 19.8% EPS growth in 1H12. We continue to like MMS given its: (i) attractive EBIT margins (25%) and ROE (40%); (ii) specialist product offer, scale and low capital intensity; (iii) annuity style income from core salary packaging service; (iv) high cash
conversion (>100%) and (iv) organic growth options. 1H12
reported good volume growth and flat margins. The key upside driver was Remuneration Services segment (EBIT up 11% hoh) whilst Asset Management was only slightly up 3% hoh. We maintain our Positive recommendation and upgrade our blended valuation from $10.40 to $11.27 (up 8.4%).
WHAT SURPRISED?
Remuneration Services’ strong EBIT growth of 10.8% in 1H12.
Asset Management remaining flat.
WHAT’S CHANGED?
FY12e EPS from 70.8c to 70.4c; FY13e EPS from 78.1c to 78.8c; FY14e from 83.6c to 88.7c.
WHAT NOW?
Growth options in place: (i) increased cross-sell to be driven by new BDMs; (ii) new broker and vendor finance program; (iii) potential
outsourcing of NSW public hospital salary packaging by the new Government.
Upside margin risk in 2H12 given (i) stronger 2H historically; and (ii) MMS refinanced its $180m Asset Management debt facility at a lower rate post the 1H12 half end.
Positive outlook commentary: “Good pipeline of new business and ongoing strengthening of our distribution and sales capabilities, we are
well placed to maintain our momentum into the second half”.
Trading Data
Last Price $9.30
12 month range $7.06 - $10.60
Market Cap $657m
Free Float $440m (67%)
Avg. Daily Volume 0.1m
Avg. Daily Value $0.8m
12 month return (historical) 4.1%
Acquisition of Inter-Leasing Australia in May
2010 diluted Group returns but these have
returned to very healthy levels.
Mix shift to lower margin Asset Management
division somewhat masks underlying
productivity gains in the Salary Packaging
business.
Earnings Forecasts
Yr to June 09A 10A 11A 12E 13E 14E
EBITDA ($m) 29.5 59.0 131.3 143.8 161.2 177.7
Rep NPAT ($m) 20.5 45.0 43.5 50.8 58.4 66.4
Adj NPAT ($m) 20.5 27.9 43.5 50.8 58.4 66.4
EPS (¢) 30.4 41.3 61.2 70.4 78.8 88.7
EPS Gth (%) 19.3 36.0 48.3 15.1 11.9 12.5
PER (x) 30.6 22.5 15.2 13.2 11.8 10.5
PEG Ratio (x) 0.3 0.3 0.5 0.5
DPS (¢) 19.0 24.0 38.0 42.0 47.0 53.0
Yield (%) 2.0 2.6 4.1 4.5 5.1 5.7
Franking (%) 100% 100% 100% 100% 100% 100%
ROE (%) 36% 31% 38% 32% 31% 31%
EV/EBITDA (x) 21.3 13.3 5.9 5.1 4.4 3.8
Net Debt/EBITDA (x) (1.0) 2.1 0.9 0.5 0.3 0.1
Int. Cover (x) (22.0) (189.0) 60.4 (281.0) (59.5) (37.4)
Valuation (blended) $11.27
George Gabriel, CFA [email protected]
February 23, 2012 +61 3 9631 9853

2
1H12 RESULT ANALYSIS
1. Divisional Profit & Loss
Remuneration Services (RS) Overview
RS provides salary packaging administration and motor vehicle novated leases (but not financing). Salary packaging services include remuneration policy design, administration and processing (including
payment), taxation recording and reporting (compliance) and handling of employee enquiries and servicing. Novated leasing is a specialised form of salary packaging. The lease is a three way agreement between an
employee, an employer and the finance provider. The employee leases a vehicle but their employer takes on the employee’s obligations and pays the monthly lease rentals out of the employee’s pre-tax salary.
RS’ revenue models include an administration fee (typically paid fortnightly out of payroll), additional fees for
value-added services (such as providing meal cards) and earning interest on client funds held for payouts. Remuneration Services 1H12 performance
Positive momentum maintained, with 1H12 EBIT up 10.8% on 2H11. Flat EBIT margins at 40.9%. Volumes. Strong volumes growth, with 1H12 revenue up 10.7% vs 2H11. No material contract losses
during the half. Positive outlook. “Business maintaining significant momentum on the back of excellent service
delivery, improving distribution, increased cross-sell and new business”.
Strong organic growth, with 94 new contracts and 11 cross sales mostly of novated leases to employees of Asset Management clients.
Asset Management (AM) Overview
AM provides financing and management services for motor vehicles, commercial vehicles and equipment. There are three revenue streams, with the general objective of evenly splitting total revenue between all three:
Procurement and in-life services (commission, rebates, maintenance and tyre margins);
Finance (brokerage and interest margin); and Management fees and disposals (ie. residual value sales in the used car market).
Asset Management 1H12 performance
Positive momentum maintained, with 1H12 EBIT up 2.5% on 2H11. Flat EBIT margins at 12.8%. We expect some margin pressure given AM is more competitive than
the RS segment in which MMS operates. Volumes. Reasonable volume growth of 3% vs 1H12.

3
Assets under finance increased 8.6% from $220m to $239m. However, underlying growth was better as some vehicle deliveries were delayed due to the Japanese earthquake and Thai floods.
Residual values remained sound and produced “pleasing” resale results. (EAP’s base case allows for margin compression as residual values decline).
2. Cash Flow/Balance Sheet
Cash conversion – Gross operating cash flow at 114% of EBITDA (ie. a negative working capital business), in line
with 2H11. Capex – Increased from $44.5m in 2H11 to $57.9m in 2H12 reflecting increased investment to fund asset growth.
Free cash flow – After maintenance and growth capex (including fleet capex) of $57.9m, FCF declined to $5.7m. We expect this to increase in 2H12F as capex subsides.
Net Debt – Net debt declined from $114.5m to $112.1m with gearing (net debt/net debt + equity) down to 45% from 50% in 2H11. MMS extended its Asset Management credit lines out to 2015 on better credit terms.
EARNINGS REVISIONS
Our FY13 and FY14 EPS forecasts +1% and +6%.
Our blended valuation increases 8.4% to $11.27.
EARNINGS REVISIONS
Metric PBT ($m) EPS (¢) DPS (¢)
Yr to June Old New % Chg Old New % Chg Old New % Chg
2011A 62.2 61.2 38.0
2012E 73.0 72.6 (0%) 70.8 70.4 (0%) 42.0 42.0 0%
2013E 82.7 83.4 1% 78.1 78.8 1% 46.0 47.0 2%
2014E 89.5 94.9 6% 83.6 88.7 6% 50.0 53.0 6%
Blended Valuation $10.40 $11.27 8%
Source: Company data, Evans & Partners Research estimates
4
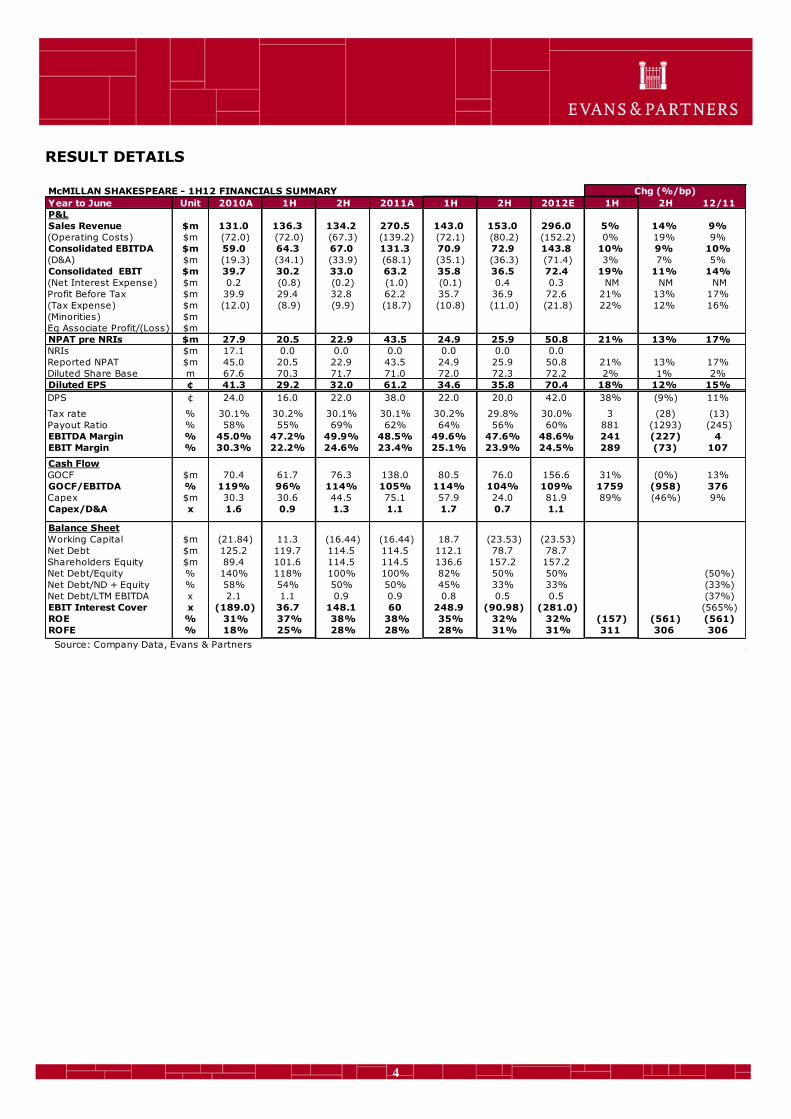
RESULT DETAILS
McMILLAN SHAKESPEARE - 1H12 FINANCIALS SUMMARY Chg (%/bp)
Year to June Unit 2010A 1H 2H 2011A 1H 2H 2012E 1H 2H 12/11
P&L
Sales Revenue $m 131.0 136.3 134.2 270.5 143.0 153.0 296.0 5% 14% 9%
(Operating Costs) $m (72.0) (72.0) (67.3) (139.2) (72.1) (80.2) (152.2) 0% 19% 9%
Consolidated EBITDA $m 59.0 64.3 67.0 131.3 70.9 72.9 143.8 10% 9% 10%
(D&A) $m (19.3) (34.1) (33.9) (68.1) (35.1) (36.3) (71.4) 3% 7% 5%
Consolidated EBIT $m 39.7 30.2 33.0 63.2 35.8 36.5 72.4 19% 11% 14%
(Net Interest Expense) $m 0.2 (0.8) (0.2) (1.0) (0.1) 0.4 0.3 NM NM NM
Profit Before Tax $m 39.9 29.4 32.8 62.2 35.7 36.9 72.6 21% 13% 17%
(Tax Expense) $m (12.0) (8.9) (9.9) (18.7) (10.8) (11.0) (21.8) 22% 12% 16%
(Minorities) $m
Eq Associate Profit/(Loss) $m
NPAT pre NRIs $m 27.9 20.5 22.9 43.5 24.9 25.9 50.8 21% 13% 17%
NRIs $m 17.1 0.0 0.0 0.0 0.0 0.0 0.0
Reported NPAT $m 45.0 20.5 22.9 43.5 24.9 25.9 50.8 21% 13% 17%
Diluted Share Base m 67.6 70.3 71.7 71.0 72.0 72.3 72.2 2% 1% 2%
Diluted EPS ¢ 41.3 29.2 32.0 61.2 34.6 35.8 70.4 18% 12% 15%
DPS ¢ 24.0 16.0 22.0 38.0 22.0 20.0 42.0 38% (9%) 11%
Tax rate % 30.1% 30.2% 30.1% 30.1% 30.2% 29.8% 30.0% 3 (28) (13)
Payout Ratio % 58% 55% 69% 62% 64% 56% 60% 881 (1293) (245)
EBITDA Margin % 45.0% 47.2% 49.9% 48.5% 49.6% 47.6% 48.6% 241 (227) 4
EBIT Margin % 30.3% 22.2% 24.6% 23.4% 25.1% 23.9% 24.5% 289 (73) 107
Cash Flow
GOCF $m 70.4 61.7 76.3 138.0 80.5 76.0 156.6 31% (0%) 13%
GOCF/EBITDA % 119% 96% 114% 105% 114% 104% 109% 1759 (958) 376
Capex $m 30.3 30.6 44.5 75.1 57.9 24.0 81.9 89% (46%) 9%
Capex/D&A x 1.6 0.9 1.3 1.1 1.7 0.7 1.1
Balance Sheet
Working Capital $m (21.84) 11.3 (16.44) (16.44) 18.7 (23.53) (23.53)
Net Debt $m 125.2 119.7 114.5 114.5 112.1 78.7 78.7
Shareholders Equity $m 89.4 101.6 114.5 114.5 136.6 157.2 157.2
Net Debt/Equity % 140% 118% 100% 100% 82% 50% 50% (50%)
Net Debt/ND + Equity % 58% 54% 50% 50% 45% 33% 33% (33%)
Net Debt/LTM EBITDA x 2.1 1.1 0.9 0.9 0.8 0.5 0.5 (37%)
EBIT Interest Cover x (189.0) 36.7 148.1 60 248.9 (90.98) (281.0) (565%)
ROE % 31% 37% 38% 38% 35% 32% 32% (157) (561) (561)
ROFE % 18% 25% 28% 28% 28% 31% 31% 311 306 306
Source: Company Data, Evans & Partners

5
FINANCIAL SUMMARY
McMillan Shakespeare MMS
As at: 23/02/2012 Recommendation: Positive Share Price $9.30
Year end June 2011A 2012E 2013E 2014E
INCOME STATEMENT
Sales Revenue $m 271 296 329 362 Consolidated EBITDA $m 131 144 161 178 D&A $m (68) (71) (79) (85) Consolidated EBIT $m 63 72 82 92 Net Interest $m (1) 0 1 2 Tax Expense $m (19) (22) (25) (28) Associates/Minorities $m 0 0 0 0
Adj NPAT $m 43 51 58 66
NRIs $m Reported NPAT $m 43 51 58 66
Shares on Issue (end period) m 68 73 75 75 EFPOWA m 71 72 74 75
EPS ¢ 61.2 70.4 78.8 88.7
DPS ¢ 38.0 42.0 47.0 53.0 Franking % 100% 100% 100% 100%
GROWTH/PROFITABILITY RATIOS
Sales Growth % 106.5% 9.4% 11.3% 9.8% EBITDA Growth % 122.5% 9.5% 12.1% 10.3% EBIT Growth % 59.3% 14.4% 13.3% 12.7%
EPS Growth % 48.3% 15.1% 11.9% 12.5%
EBITDA/Sales % 48.5% 48.6% 48.9% 49.1% EBIT/Sales % 23.4% 24.5% 24.9% 25.6% EBIT Interest Cover x 60.4 (281.0) (59.5) (37.4) Tax Rate % 30.1% 30.0% 30.0% 30.0%
ROE % 38.0% 32.3% 31.0% 30.8% ROFE % 28.5% 31.1% 35.0% 39.0%
CASH FLOW
EBITDA $m 131 144 161 178 Change in Working Capital $m (5) 7 3 3 Other $m 12 6 6 0
Gross Operating Cash Flow $m 138 157 169 180
Net Interest Paid $m (12) (10) (9) (8) Tax Paid $m (21) (22) (25) (28)
Net Operating Cash Flow $m 105 125 136 144
Maintenance Capex $m (75) (82) (90) (98)
Free Cash Flow $m 30 43 46 46
Dividends Paid $m (20) (30) (30) (37) Expansionary Capex $m 0 0 0 0 Acquisitions $m 0 0 0 0 Asset Sales $m 0 0 0 0 Dividends Received $m 0 0 0 0 Shares Issues/Buybacks $m 2 22 8 0 Other $m 0 0 0 0
Increase in Net Cash/(Debt) $m 11 36 24 8
GOCF/EBITDA % 105% 109% 105% 101% Total Capex/Sales % 27.8% 27.7% 27.2% 27.0% Total Capex/Depreciation x 1.1 1.1 1.1 1.1
Year end June 2011A 2012E 2013E 2014E
VALUATION METRICS PER x 15.2 13.2 11.8 10.5 P/EG (2YR) x 0.5 0.5 Dividend Yield % 4.1% 4.5% 5.1% 5.7% EV/EBITDA x 5.9 5.1 4.4 3.8 EV/EBIT x 12.2 10.2 8.6 7.4 P/FCF x 21.9 15.2 14.2 14.3 P/BV x 578.0 432.9 369.5 323.4
BALANCE SHEET
Assets Cash $m 15 38 38 38 Working Capital $m 23 21 23 25 PP&E $m 219 231 242 255 Intangibles $m 40 39 38 38 Investments $m 0 0 0 0 Other $m 3 3 3 3
Total Assets $m 301 331 344 358
Liabilities Debt $m 127 113 79 60 Working Capital $m 40 41 57 64 Other $m 16 16 16 16
Total Liabilities $m 186 174 155 143 Equity $m 115 157 189 215 Capital Employed $m 229 236 233 241
Net Debt/(Cash) $m 114 79 44 25 Net Debt/Equity % 99.9% 50.0% 23.5% 11.7%
Net Debt/Debt+Equity % 50.0% 33.4% 19.0% 10.5%
Net Debt/EBITDA x 0.9 0.5 0.3 0.1 Working Capital/Sales % (6.2%) (6.8%) (10.3%) (10.7%) D&A/PP&E % 31.0% 31.0% 32.7% 33.4%
DCF VALUATION $m $/share
Risk Free Rate 6.5% Equity Value 924 $13.57 Market Risk Premium 6.0% (Net Debt)/Cash (90) ($1.33) Beta 1.25 Franking Credits $1.55
WACC 10.8% DCF Valuation $12.59
Remuneration Services $m 112 130 147 162 Asset Management $m 159 166 182 200 Corporate $m
Group Revenue $m 271 296 329 362
Remuneration Services $m 45 53 59 65 Asset Management $m 19 21 23 28 Corporate $m (1) (1) (1) (1)
Group EBIT $m 63 72 82 92
Remuneration Services % 40.5% 40.5% 40.3% 40.1% Asset Management % 12.2% 12.4% 12.9% 14.3% Corporate %
Group EBIT/Sales % 23.4% 24.5% 24.9% 25.6%
DIVISIONAL SUMMARY
21%
26%
31%
36%
41%
46%
51%
2010 2011 2012 2013 2014
Margin Trends
EBITDA/Sales EBIT/Sales
-320
-250
-180
-110
-40
30
100
5%
15%
25%
35%
45%
55%
65%
2010 2011 2012 2013 2014
Gearing & Interest Cover
Net Debt/Net Debt+Equity (%) EBIT Interest Cover (x)
11%
16%
21%
26%
31%
36%
41%
2010 2011 2012 2013 2014
Return Trends
ROE ROA ROFE - Reported

6
RESEARCH RECOMMENDATION DEFINITIONS Positive Stock is expected to outperform the S&P/ASX 200 over the coming 24 months
Neutral Stock expected to perform in line with the S&P/ASX 200 over the coming 24 months Negative Stock is expected to underperform the S&P/ASX 200 over the coming 24 months Speculative Stock has limited history from which to derive a fundamental investment view or its prospects
are highly dependent on event risk, eg. Successful exploration, scientific breakthrough, high commodity prices, regulatory change, etc.
Suspended Stock is temporarily suspended due to compliance with applicable regulatory and/or Evans &
Partners policies in circumstances where Evans & Partners is acting in an advisory capacity. Not Rated Stock is not included in our investment research universe. Research Criteria Definitions
Recommendations are primarily determined with reference to how a stock ranks relative to the S&P/ASX 200 on the following criteria: Valuation Rolling 12 month prospective multiples (composite of Price-to-Earnings Ratio, Dividend
Yield and EV/EBITDA), or long-term NPV for resource stocks.
Earnings Outlook Forecast 2 year EPS growth. Earnings Momentum Percentage change in the current consensus EPS estimate for the stock (rolling 1 year
forward basis) over the consensus EPS estimate for the stock 3 months ago. Shareholder Returns Composite of forecast ROE (rolling 1 year forward basis) and the percentage change in
ROE over 2 years.
Debt Servicing Capacity Rolling 12 month EBIT Interest Cover ratio. Cyclical Risk Qualitative assessment of the 2 year outlook for a stock/industry’s profit cycle. Industry Quality Qualitative assessment of an industry’s growth/returns potential and company specific
management capability.
Financial Transparency If we don’t understand it, we won’t recommend it. For stocks where Evans & Partners does not generate its own forecasts, Bloomberg consensus data is used.
Analysts can introduce other factors when determining their recommendation, with any material factors stated in the written research where appropriate.

7
GENERAL RESEARCH DISCLAIMER, WARNING & DISCLOSURES
This document is provided by Evans and Partners ABN 85 125 338 785, holder of AFSL 318075.
The information is general advice only and does not take into consideration an investor’s objectives, financial situation or needs. Before acting on
the advice, investors should consider the appropriateness of the advice, having regard to the investor’s objectives, financia l situation and needs. If
the advice relates to a financial product that is the subject of a Product Disclosure Statement (e.g. unlisted managed funds) investors should obtain
the PDS and consider it before making any decision about whether to acquire the product.
The material contained in this document is for information purposes only and does not constitute an offer, solicitation or recommendation with respect to the purchase or sale of securities. It should not be regarded by recipients as a substitute for the exercise of their own judgment.
Investors should be aware that past performance is not an infallible indicator of future performance and future returns are not guaranteed.
Any opinions and/or recommendations expressed in this material are subject to change without notice and Evans and Partners is not under any
obligation to update or keep current the information contained herein. References made to third parties are based on information believed to be
reliable but are not guaranteed as being accurate.
This document is provided to the recipient only and is not to be distributed to third parties without the prior consent of Evans and Partners.
EVANS AND PARTNERS DISCLOSURE OF INTERESTS
Evans and Partners and its respective officers and associates may have an interest in the securities or derivatives of any entities referred to in this
material.
Evans and Partners does, and seeks to do, business with companies that are the subject of its research reports.
EVANS AND PARTNERS CORPORATE RELATIONSHIP DISCLOSURE
AFI: Evans and Partners have arranged, managed or co-managed a public offering of the company or its affiliates in the past 12 months. AYUHA: Evans and Partners have arranged, managed or co-managed a public offering of the company or its affiliates in the past 12 months.
BHP: A director of Evans and Partners Pty Ltd Advisory Board is a director of BHP Billiton Ltd.
BSL: A director of Evans and Partners Pty Ltd Advisory Board is a director of BlueScope Steel Ltd.
BOQ, BOQPA, BOQPC: A director of Evans and Partners Pty Ltd Advisory Board is a director of Bank of Queensland.
CBA: Evans and Partners managed or co-managed a public offering of securities of the company or its affiliates in the past 12 months.
CBAHA: Evans and Partners managed or co-managed a public offering of securities of the company or its affiliates in the past 12 months.
HHY: Evans and Partners have been appointed by the Issuer as Broker to an on-market buy-back. Accordingly, Evans and Partners are unable to
give Sellers advice in respect of a sale of this security.
LLC: A director of Evans and Partners Pty Ltd Advisory Board is a director of Lend Lease Corporation Ltd. MQG: MQCPA: A director of Evans and Partners Pty Ltd Advisory Board is a director of Macquarie Group Ltd.
ORG: A director of Evans and Partners Pty Ltd Advisory Board is a director of Origin Energy Ltd.
PPC: Evans and Partners managed or co-managed a public offering of securities of the company or its affiliates in the past 12 months.
OOH: Evans and Partners have arranged, managed or co-managed a public offering of the company or its affiliates in the past 12 months.
SAR: Evans and Partners managed or co-managed a public offering of securities of the company or its affiliates in the past 12 months.
TOX: Evans and Partners managed or co-managed a public offering of securities of the company or its affiliates in the past 12 months.
RESEARCH ANALYST CERTIFICATION
I, George Gabriel, CFA, hereby certify that all the views expressed in this report accurately reflect my personal views about the subject investment theme &/or company securities. I also certify that no part of my compensation was, is, or will be, directly or indirectly, related to the specific
recommendations or views expressed in this report.
RESEARCH ANALYST DISCLOSURE OF INTEREST
I, George Gabriel, CFA, &/or entities in which I have a pecuniary interest, have an exposure to the following securities &/or managed products: TGA.
DISCLAIMER
Except for any liability which cannot be excluded, Evans & Partners, its directors, employees & agents accept no liability or responsibility whatsoever
for any loss or damage of any kind, direct or indirect, arising out of the use of all or any part of this material. All information is correct at the time
of publication; additional information may be available upon request.