Embed Size (px)
Citation preview

MANAGEMENT’S DISCUSSION AND ANALYSIS
For the years ended December 31, 2015 and 2014
Dated March 9, 2016

This page intentionally left blank.
Management’s Discussion and Analysis
For the Years Ended December 31, 2015 and 2014 (tabular amounts expressed in thousands of United States dollars, except where otherwise noted)
1
This Management’s Discussion & Analysis (“MD&A”) of Tahoe Resources Inc. (“Tahoe”) and its
subsidiaries (together referred to as the “Company”) has been prepared to enable a reader to assess
material changes in financial condition and results of operations as at and for the years ended
December 31, 2015 and 2014. The following discussion of performance, financial condition and future
prospects should be read in conjunction with the audited consolidated financial statements for the
years ended December 31, 2015 and 2014 (“consolidated financial statements”), prepared in
accordance with International Financial Reporting Standards as issued by the International Accounting
Standards Board (“IFRS”). The information provided herein supplements, but does not form part of, the
consolidated financial statements and includes financial and operational information from the
Company’s wholly owned subsidiaries. This MD&A contains forward-looking information that is subject to
risk factors set out in the cautionary note herein. This discussion covers the three months ended
December 31, 2015 and 2014 (also referred to as “Q4 2015”, “Q4 2014”) and the twelve months ended
December 31, 2015 and 2014 (also referred to as “2015” and “2014”) and the subsequent period up to
the date of this MD&A. Dollar amounts are stated in millions of United States dollars (“USD”), the
Company’s functional currency, unless otherwise indicated. Tabular amounts are presented in
thousands of USD, except where otherwise noted. Information for this MD&A is prepared as at March 9,
2016.
BUSINESS OVERVIEW
Tahoe is a Canadian public mine operating, mineral exploration and development company whose
common shares are listed on the Toronto Stock Exchange (“TSX”) and the Bolsa de Valores de Lima
(“BVL”) in Peru under the symbol “THO” and on the New York Stock Exchange (“NYSE”) under the
symbol “TAHO”. Tahoe is a reporting issuer in each of the provinces and territories of Canada.
Additional information relating to the Company, including a copy of this MD&A, may be obtained or
viewed from the System for Electronic Document Analysis and Retrieval (“SEDAR”) at www.sedar.com,
on the Electronic Data Gathering, Analysis, and Retrieval system (“EDGAR”) at www.sec.gov, and on
the Company’s website at www.tahoeresources.com.
Tahoe was incorporated under the Business Corporations Act (British Columbia) on November 10, 2009.
The Company’s principal business activities are to profitably operate the Escobal mine, a silver mining
operation located in southeastern Guatemala, the La Arena mine, a gold mining operation located in
northwestern Peru and to develop the Shahuindo gold mine, located in northwestern Peru. Additional
business objectives are the acquisition, exploration, development and operation of mineral properties
for the mining of precious metals in the Americas.
At the date of this MD&A, the Company’s commercial operations include the Escobal mine, which
contains high-grade silver, gold, lead, and zinc mineralization, and the La Arena mine, which contains a
gold oxide deposit. Operating the Escobal and La Arena mines as profitable operations will require that
Tahoe consistently meet production targets and effectively manage costs.
Management’s Discussion and Analysis
For the Years Ended December 31, 2015 and 2014 (tabular amounts expressed in thousands of United States dollars, except where otherwise noted)
2
2015 HIGHLIGHTS
ANNUAL CONSOLIDATED OPERATIONAL AND FINANCIAL INFORMATION(1)(2)
The Escobal mine mill throughput totaled 1.51 million tonnes and averaged 4,133 tonnes per day
(“tpd”) compared to mill throughput of 1.25 million tonnes at an average of 3,413 tpd for 2014.
At La Arena, 9.3 million tonnes of ore were mined at a strip ratio of 1.85 during 2015 and ore
placed on the leach pads totaled 9.7 million tonnes.
The Escobal mine produced metal concentrates containing 20.4 million ounces of silver, 11,742
ounces of gold, 10,153 tonnes of lead and 14,810 tonnes of zinc compared to 20.3 million ounces
of silver, 10,893 ounces of gold, 10,359 tonnes of lead and 13,394 tonnes of zinc for 2014. La
Arena produced 174,073 gold ounces in doré during 2015.
Sales consisted of 20.2 million ounces of silver, 183,661 ounces of gold, 9,768 tonnes of lead and
13,297 tonnes of zinc resulting in revenues of $519.7 million for 2015 compared to 18.2 million
ounces of silver, 8,361 ounces of gold, 9,131 tonnes of lead and 10,652 tonnes of zinc resulting in
revenues of $350.3 million for 2014.
Mine operating earnings totaled $186.2 million, compared to $158.8 million for 2014.
Consolidated adjusted net earnings(3) for 2015 were $98.9 million resulting in both basic and
diluted consolidated adjusted earnings per share of $0.48.
Loss from operations for 2015 was $79.6 million, compared to earnings from operations of $123.3
million for 2014 as a result of a $220.0 million pre-tax impairment taken on mineral interests during
Q4 2015, primarily due to the sustained decrease in metals prices. See “Cash Flow, Liquidity,
Capital Resources and Other Information – Asset Valuation”.
Loss and total comprehensive loss for 2015 was $71.9 million resulting in both basic and diluted
losses per share of $0.35, primarily as a result of the $153.4 million after tax impairment. This
compares to 2014 earnings and total comprehensive income of $90.8 million resulting in a basic
and diluted earnings per share of $0.62 and $0.61, respectively.
Cash flow provided by operating activities before changes in working capital(1) for 2015 was
$226.3 million, or $1.09 per share compared to $173.2 million or $1.18 per share for 2014.
Total cash costs net of by-product credits(3) were $6.16 per silver ounce produced and $551 per
gold ounce produced compared to $6.37 and $nil for 2014. Total cash costs net of by-product
credits for both silver and gold were below 2015 guidance of $6.35 - $8.25 per ounce of silver
and $625 - $650 per ounce of gold.
All-in sustaining costs net of by-product credits(3) were $9.11 per silver ounce produced and $733
per gold ounce produced compared to $9.15 and $nil for 2014. All-in sustaining costs net of by-
product credits for both silver and gold were below 2015 guidance of $9.75 - $11.50 per ounce
of silver and $900 - $950 per ounce of gold.
The Company declared and paid dividends of $49.7 million to shareholders during 2015
compared to $3.0 million during 2014.
(1) Comparative 2014 numbers exclude operational and financial information from Rio Alto Mining Limited (“Rio Alto”). (2) 2015 numbers include operational and financial information from the gold segment beginning April 1, 2015, the date of
acquisition of Rio Alto. (3) Refer to the “Non-GAAP Financial Measures” section of this MD&A.

Management’s Discussion and Analysis
For the Years Ended December 31, 2015 and 2014 (tabular amounts expressed in thousands of United States dollars, except where otherwise noted)
3
BUSINESS COMBINATION WITH RIO ALTO
On April 1, 2015, the Company completed the Plan of Arrangement (“Arrangement”) with Rio Alto
resulting in a business combination of the two companies. Pursuant to the Arrangement and effective
upon closing, Rio Alto has become a wholly-owned subsidiary of Tahoe, and all of the issued and
outstanding common shares of Rio Alto (each a “Rio Alto Share”) were transferred to Tahoe in
consideration for the issuance by Tahoe of 0.227 of a common share of Tahoe (each whole common
share a “Tahoe Share”) and the payment of CAD$0.001 in cash for each Rio Alto Share.
In connection with the closing of the Arrangement, Tahoe issued an aggregate of 75,991,381 Tahoe
Shares to the former shareholders of Rio Alto. On closing of the Arrangement, Tahoe had 223,726,156
common shares issued and outstanding, with former Rio Alto shareholders holding approximately 34%
on an undiluted basis. Tahoe authorized the issuance of up to an additional 3,374,449 Tahoe Shares
issuable upon the exercise of the stock options held by the former option holders of Rio Alto and an
additional 2,011,244 Tahoe Shares issuable upon the exercise of Rio Alto warrants. Subsequent to the
closing of the Arrangement and prior to the expiration date of April 12, 2015, all outstanding warrants
were exercised and 2,011,244 Tahoe Shares were issued for total proceeds of CAD$21.2 million.
Total consideration paid was based on the April 1, 2015 price of Tahoe Shares on the TSX of CAD$14.21
and a CAD to USD foreign exchange rate of 0.7929 and is comprised of the following:
Number of Shares
Issued
Number of Shares
Issuable Fair Value
Tahoe Shares 75,991,381 - $ 856,198
Options(1) - 3,374,449 11,536
Cash - - 272
Total consideration 75,991,381 3,374,449 $ 868,006
(1) The fair values of the Options were determined using the Black-Scholes option pricing model. The inputs and input
ranges, where applicable, used in the measurement of the fair value (CAD) of the Options are as follows: Share price $ 14.21
Exercise price $ 6.13 – 23.13
Expected volatility 42.36% – 54.99%
Expected life (years) 0.08 – 4.55
Expected dividend yield 1.69%
Risk-free interest rate 0.49% – 0.57%
Fair value $ 0.49 – 7.98
This acquisition has been accounted for as a business combination with Tahoe as the acquirer.
Transaction costs incurred by the Company relating to the acquisition were recognized in Q2 2015,
upon closing of the Arrangement.
As at the date of MD&A, allocation of the purchase price has been finalized. Management determined
the fair values of identifiable assets and liabilities, measured the associated deferred income tax assets
and liabilities, and determined the value of goodwill.

Management’s Discussion and Analysis
For the Years Ended December 31, 2015 and 2014 (tabular amounts expressed in thousands of United States dollars, except where otherwise noted)
4
A final allocation of the purchase price is as follows:
Net assets acquired
Cash and cash equivalents $ 61,713
Other current and non-current assets 75,774
Mineral interests(2) 1,011,269
Goodwill(1)(2) 57,468
Current liabilities (94,592)
Warrant liability(3) (5,837)
Reclamation and closure cost obligations (20,099)
Other non-current liabilities and deferred gain on sale leaseback (19,573)
Deferred income tax liabilities(2) (198,117)
$ 868,006
(1) Goodwill of $57.5 million was recognized as a result of the deferred tax liability recognized on the excess of the fair value of
the acquired assets over their corresponding tax bases. The total amount of goodwill that is expected to be deductible for
tax purposes is $nil. (2) As a result of the finalization of the purchase price allocation, the fair value attributed to other current and non-current assets,
mineral interests and reclamation and closure cost obligations decreased by $2.7 million, $8.7 million and $1.7 million,
respectively, while goodwill, deferred income tax liabilities and other non-current liabilities and deferred gain on sale
leaseback increased by $12.4 million, $2.4 million and $0.3 million, respectively, since June 30, 2015. These adjustments did not
have a material impact on the Company’s net loss for the year. (3) The fair value of the warrant liability was determined using the Black-Scholes option pricing model. The inputs and input
ranges, where applicable that were used in the measurement of the fair value (CAD) of the warrant liability are as follows:
Share price $ 14.21
Exercise price $ 10.55
Expected volatility 46.60%
Expected life (years) 0.03
Expected dividend yield 1.69%
Risk-free interest rate 0.49%
Fair value $ 3.66
The principal mining properties acquired are the 100% owned La Arena gold mine and the 100% owned
Shahuindo gold project, an advanced-stage, oxide deposit, both of which are located in northwestern
Peru.
The acquisition supports the Company’s growth strategy by adding an already operating high quality,
high margin asset which, along with the Shahuindo project, will increase the sustainable production
level, contribute to cash flow and diversify the Company’s operations in metals and geographic
locations.
For additional details, see the news releases dated February 9, 2015, February 25, 2015 and April 1, 2015
available at www.sedar.com or on the Company’s website at www.tahoeresources.com.
GUATEMALAN MINING ROYALTY
In late 2015, Guatemala’s Constitutional Court ruled that the 10 percent mining royalty that Congress
passed in a budget bill in late 2014 was unconstitutional, that the original one percent royalty
mandated under the 1996 Mining Law (the “Mining Law”) was still in force and that Congress did not
have authority to displace the Mining Law royalty with the budget bill legislation.
The Company had been accruing a 10 percent net smelter return (“NSR”) royalty since January 1, 2015.
The actual cash payment of 2015 royalties was not due and payable until January of 2016. After the
ruling was published in December 2015, the Company adjusted the royalty accrual to reflect a one
Management’s Discussion and Analysis
For the Years Ended December 31, 2015 and 2014 (tabular amounts expressed in thousands of United States dollars, except where otherwise noted)
5
percent mandatory royalty under the Mining Law. Additionally, in accordance with signed agreements,
the Company accrued a voluntary royalty of four percent on finalized sales above $16/oz silver.
For additional details, see the news releases dated November 12, 2015, available at www.sedar.com or
on the Company’s website at www.tahoeresources.com.
RECENT DEVELOPMENTS
BUSINESS COMBINATION WITH LAKE SHORE GOLD CORP.
On February 8, 2016, the Company entered into a definitive agreement (the “Arrangement
Agreement”) with Lake Shore Gold Corp. (“Lake Shore Gold”) whereby Tahoe will acquire all issued and
outstanding common shares of Lake Shore Gold (the “Transaction”). Under the terms of the
Arrangement Agreement, each issued and outstanding common share of Lake Shore Gold will be
exchanged for 0.1467 of a Tahoe common share (the “Exchange Ratio”). Upon closing of the
Arrangement, existing Tahoe and Lake Shore Gold shareholders will own approximately 73% and 27% of
the combined company, respectively, on a fully diluted in-the-money basis.
Based on the closing price of the Company’s common shares on the TSX of CAD$11.66 on February 5,
2016, the offer implies consideration of CAD$1.71 per Lake Shore Gold common share which represents
a premium of 14.8% to the closing price of Lake Shore Gold common shares of CAD$1.49 on the TSX on
February 5, 2016 and a premium of 25.7% based on the volume weighted average prices of each
respective company on the TSX for the 20-day period ending on February 5, 2016. The implied equity
value (assuming the conversion of in-the-money convertible debentures) is equal to CAD$945 million.
The boards of directors of each of the Company and Lake Shore Gold have approved the Transaction
and determined that it is in the best interests of their respective shareholders based on a number of
factors, including fairness opinions received from their respective financial advisors.
The completion of the Transaction is subject to the approval by at least 66.67% of the votes cast by
shareholders of Lake Shore Gold at a special meeting scheduled for March 31, 2016. In accordance
with the rules of the TSX, the issuance of Tahoe common shares in connection with the Transaction will
require the approval of a simple majority of the shareholders of Tahoe voting at a meeting of Tahoe
shareholders scheduled for March 31, 2016.
In addition to Lake Shore Gold shareholder and court approvals, the Transaction is subject to applicable
regulatory approvals and the satisfaction of certain other closing conditions customary in transactions
of this nature. If approved, the Transaction is expected to close in early April 2016.
The Arrangement Agreement includes customary deal-protection provisions including non-solicitation
provisions, a right to match competing offers and a CAD$37.8 million termination fee payable to Tahoe
under certain circumstances and a CAD$20 million termination fee payable to Lake Shore Gold under
certain circumstances.
For additional details, relating to the Transaction, see the related documents (including the information
circular for the meeting of Tahoe shareholders, which includes pro forma financial statements) available
at www.sedar.com or on the Company’s website at www.tahoeresources.com.

Management’s Discussion and Analysis
For the Years Ended December 31, 2015 and 2014 (tabular amounts expressed in thousands of United States dollars, except where otherwise noted)
6
SHAHUINDO NI 43-101 TECHNICAL REPORT
On January 25, 2015 the Company issued an updated National Instrument 43-101 Technical Report (the
“Technical Report”) on the Shahuindo gold project. Highlights of the Technical Report include:
Measured and Indicated oxide Mineral Resources of 143.1 million tonnes at an average gold
grade of 0.50 grams per tonne (“g/t”) containing 2.28 million ounces of gold.
Proven and Probable oxide Mineral Reserves of 111.9 million tonnes at an average gold grade of
0.53 g/t containing 1.91 million ounces of gold; representing an 87% increase in Mineral Reserves
compared to the prior Technical Report.
Ten year mine life with average annual gold production (gold in doré) of 78,000 ounces in the
first two years of production and 169,000 ounces in years three through ten. Total gold produced
in doré over the mine life is estimated to be 1.504 million ounces.
After tax net present value at a five percent discount rate of $318.9 million and an internal rate
of return of 40.6% with a payback period of 4.1 years.
Exploration conducted by previous owners and by Tahoe demonstrates considerable potential
to add additional gold ounces to the production profile at Shahuindo and has identified multiple
exploration targets in the district.
Mineral Resources and Mineral Resources are reported using metal prices of $1,200/oz Au and $15/oz
Ag. Mineral Resources are reported within a $1,400/oz Au pit shell at a gold-equivalent (AuEq) cut-off
grade of 0.14 g/t. The financial analysis uses escalating metal prices over the LOM beginning with
$1,100/oz Au in 2016 and increasing in $100/oz increments annually to $1,400/oz Au in 2019 where it
remains constant through the end of the mine life.
For additional details, see Technical Report on the Shahuindo Mine, Cajabamba Peru, available at
www.sedar.com or on the Company’s website at www.tahoeresources.com.

Management’s Discussion and Analysis
For the Years Ended December 31, 2015 and 2014 (tabular amounts expressed in thousands of United States dollars, except where otherwise noted)
7
SELECTED ANNUAL CONSOLIDATED FINANCIAL RESULTS
Selected annual consolidated financial information from continuing operations for the years ended
December 31, 2015 and 2014 is as follows:
2015(2) 2014(1) 2013
Metal Sold
Silver (000’s ozs) 20,210 18,160 -
Gold (ozs) 183,661 8,361 -
Lead (t) 9,768 9,131 -
Zinc (t) 13,297 10,652 -
Realized Price
Silver in concentrate (per oz) $ 15.15 $ 18.13 $ -
Gold in concentrate (per oz) $ 1,100 $ 1,258 $ -
Gold in doré (per oz) $ 1,126 $ - $ -
Lead (per t) $ 1,854 $ 2,053 $ -
Zinc (per t) $ 1,800 $ 2,220 $ -
LBMA/LME Price(3)
Silver (per oz) $ 15.68 $ 19.08 $ -
Gold (per oz) $ 1,160 $ 1,266 $ -
Lead (per t) $ 1,784 $ 2,096 $ -
Zinc (per t) $ 1,928 $ 2,164 $ -
Revenues $ 519,721 $ 350,265 $ -
Adjusted earnings(4) $ 98,910 $ 91,696 -
Adjusted earnings per share(4)
Basic 0.48 0.62 -
Diluted 0.48 0.62 -
(Loss) earnings from operations $ (79,552) $ 123,272 $ (61,181)
(Loss) earnings $ (71,911) $ 90,790 $ (65,597)
(Loss) earnings per common share
Basic $ (0.35) $ 0.62 $ (0.45)
Diluted $ (0.35) $ 0.61 $ (0.45)
Dividends paid $ 49,717 $ 2,953 $ -
Cash flow provided by (used in) operating activities
before changes in working capital $ 226,332 $ 173,230 (51,632)
Cash flow provided by (used in) operating activities $ 166,744 $ 119,322 $ (59,605)
Cash and cash equivalents $ 108,667 $ 80,356 $ 8,838
Total assets $ 2,002,461 $ 975,628 $ 883,333
Total non-current liabilities $ 187,550 $ 5,693 $ 4,214
Costs per silver ounce produced (silver segment)
Total cash costs net of by-product credits(4) $ 6.16 $ 6.37 $ -
All-in sustaining costs per silver ounce net of by-product
credits(4)(5) $ 9.11 $ 9.15 $ -
Costs per gold ounce produced (gold segment)
Total cash costs net of by-product credits(4) $ 551 $ - $ -
All-in sustaining costs per gold ounce net of by-product
credits(4) $ 733 $ - $ -
(1) Comparative 2014 numbers exclude operational and financial information from Rio Alto. (2) 2015 numbers include operational and financial information from the gold segment beginning April 1, 2015, the effective date of acquisition of
Rio Alto. (3) London Bullion Market Association (LBMA)/London Metal Exchange (LME) average closing prices for each quarter presented. (4) Refer to the “Non-GAAP Financial Measures” section of this MD&A. (5) All-in sustaining costs net of by-product credits per silver ounce produced for 2015 exclude the impact of $7.2 million in transaction costs related
to the acquisition of Rio Alto.
Management’s Discussion and Analysis
For the Years Ended December 31, 2015 and 2014 (tabular amounts expressed in thousands of United States dollars, except where otherwise noted)
8
REVIEW OF ANNUAL CONSOLIDATED FINANCIAL RESULTS
Basis of Presentation
The annual results presented in this section and the quarterly results presented in the subsequent section
of this MD&A are prepared in accordance with IFRS except as noted. The Company’s significant
accounting policies are outlined within note 3 of the Company’s consolidated financial statements for
the years ended December 31, 2015 and 2014. The Company has chosen to expense all exploration
and evaluation costs except those costs associated with mineral property acquisition, surface rights
purchases, major equipment, buildings, and accrued reclamation, all of which are capitalized.
2015 vs. 2014
The Company generated a loss of $71.9 million for 2015 compared to earnings of $90.8 million for 2014
as a result of the following factors (comparative 2014 data excludes Rio Alto):
Revenues
During 2015, the Company sold in concentrate 20.2 million silver ounces and 9,793 gold ounces at
realized prices of $15.15 and $1,100 per ounce, respectively, compared to 18.2 million silver ounces,
8,361 gold ounces at realized prices of $18.13 and $1,258 per ounce, respectively during 2014. During
2015, the Company sold 173,868 ounces of gold in doré at an average realized price of $1,126 per
ounce. There were no doré sales prior to the acquisition of Rio Alto in Q2 2015.
During 2015, the Company sold in concentrate 9,768 tonnes of lead and 13,297 tonnes of zinc at
realized prices of $1,854 and $1,800 per tonne, respectively, compared to 9,131 tonnes of lead and
10,652 tonnes of zinc at realized prices of $2,053 and $2,220 per tonne, respectively, during 2014.
Although silver in concentrate sales increased by approximately 10% during 2015 when compared to
2014 and gold sales increased due to the acquisition of Rio Alto, this was offset by a decrease of
approximately 17% in realized silver metal prices resulting in revenues of $519.7 million, net of treatment
and refining charges for 2015, compared to $350.3 million in revenues for 2014. This resulted in an
increase in revenues of approximately $169.4 million or 48%.
The Company’s concentrate revenue and trade receivables include provisionally priced metal sales
which are marked to market at the end of each reporting period based on the expected forward price
for the quotational period stipulated in the contract (or an approximation thereof). Provisionally priced
metal at December 31, 2015 includes 4.7 million silver ounces and 3,184 gold ounces at $13.78 and
$1,060 per ounce, respectively and 3,058 tonnes of lead and 4,037 tonnes of zinc at $1,802 and $1,604
per tonne, respectively.
Operating costs
Production costs
Production costs, which comprise the full cost of operations less royalties, depreciation and
depletion, form a component of total operating costs and were $241.7 million for 2015 compared to
$127.3 million during 2014. The increase is primarily due to the inclusion of production costs at the La
Arena mine, acquired in Q2 2015.

Management’s Discussion and Analysis
For the Years Ended December 31, 2015 and 2014 (tabular amounts expressed in thousands of United States dollars, except where otherwise noted)
9
Royalties
During 2015 royalty expense was $13.2 million compared to $20.8 million in 2014. This is primarily due
to the decrease in silver revenues during 2015. Royalties paid in Peru are calculated using a form of
operating profit and are therefore accounted for as an income tax. Refer to the “2015 Highlights”
section for additional detail on the decision of the Guatemalan Constitutional Court striking down
the 10% royalty regime.
Depreciation and depletion
During 2015, depreciation and depletion was $78.6 million compared to $43.3 million in 2014. This
increase of $35.3 million is primarily due to the inclusion of $11.7 million of depreciation and
depletion relating to the fair value adjustment of the La Arena mine, acquired in Q2 2015 in addition
to $19.4 million being attributable to the regular depreciation and depletion at the La Arena mine.
The remaining increase is due to increased production and changes in inventory.
Other operating expenses
Exploration expenses
Exploration expenses were $6.5 million for 2015 compared to $3.6 million in 2014. This increase is
primarily due to the inclusion of exploration expenses relating to certain Peruvian exploration targets.
General and administrative expenses
General and administrative expenses were $39.3 million for 2015 compared to $32.0 million for 2014.
This $7.3 million increase relates primarily to the inclusion of $7.2 million in transaction costs and $3.3
million in salaries and benefits relating to the acquisition of Rio Alto and a $1.1 million increase in
professional and consulting fees. These increases were offset by a $3.2 million decrease in
administrative and other expense.
Impairment
The Company recorded a total after-tax impairment charge of $153.4 million, comprising $69.0
million and $84.4 million for La Arena and Shahuindo, respectively (pre-tax impairment of $220.0
million, comprising $99.0 million and $121.0 million for La Arena and Shahuindo, respectively). The
impairment is a result of the Company’s annual asset impairment testing. Using a long-term gold
price of $1,200/oz and a discount rate of 7%, the impairment charge was primarily driven by a
decrease of approximately $100/oz in gold price from the date of acquisition. Refer to the “Cash
Flow, Liquidity, Capital Resources and Other Information - Asset Valuation” section for additional
details.
Other expense
Interest Expense
Interest expense for 2015 was $1.7 million ($3.6 million interest expense net of $1.9 million in interest
income) compared to $5.6 million in 2014. The decrease is due to the repayment of the original $50
million credit facility during Q2 2015 and the repayment of the additional $25 million drawn on the
credit facility prior to Q1 2015. This was partially offset by the interest incurred on the $35 million loan
which was acquired as part of the Rio Alto transaction.

Management’s Discussion and Analysis
For the Years Ended December 31, 2015 and 2014 (tabular amounts expressed in thousands of United States dollars, except where otherwise noted)
10
Net foreign exchange loss
A foreign exchange loss of $4.5 million was recognized during 2015 compared to $0.9 million during
2014. The variation in foreign exchange compared to the prior year period is the result of fluctuations
in the CAD, Guatemalan quetzal and Peruvian sol exchange rates.
Total assets
Total assets were $2,002.5 million at December 31, 2015 compared to $975.6 million at December 31,
2014 which represents an increase of $1,026.9 million during 2015 primarily due to the inclusion of assets
relating to the acquisition of Rio Alto. This increase is further broken out into increases in cash and cash
equivalents of $28.3 million, trade and other receivables of $35.5 million, inventories of $29.5 million,
other current and long-term assets of $29.9 million, mineral interests and plant and equipment of $845.8
million and goodwill of $57.5 million.
Total non-current liabilities
Total non-current liabilities were $187.6 million at December 31, 2015 compared to $5.7 million at
December 31, 2014 which represents an increase of $181.9 million primarily due to the inclusion of non-
current liabilities relating to the acquisition of Rio Alto. This increase is further broken out into increases in
deferred tax liabilities of $134.6 million, reclamation provisions of $36.0 million, non-current lease
obligations of $7.7 million and other non-current liabilities of $3.5 million.

Management’s Discussion and Analysis
For the Years Ended December 31, 2015 and 2014 (tabular amounts expressed in thousands of United States dollars, except where otherwise noted)
11
SELECTED QUARTERLY CONSOLIDATED FINANCIAL RESULTS
Selected quarterly consolidated financial information from continuing operations for the most recent
eight quarters is as follows:
Q4
2015
Q3
2015
Q2
2015
Q1
2015(1)
Q4
2014(1)
Q3
2014(1)
Q2
2014(1)
Q1
2014(1)
Metal Sold
Silver (000’s ozs) 6,244 5,492 3,840 4,640 4,073 5,102 4,805 4,180
Gold (ozs) 59,766 59,814 61,734 2,173 1,567 2,240 2,142 2,412
Lead (t) 3,396 2,557 1,602 2,210 1,818 2,257 2,670 2,386
Zinc (t) 4,542 2,753 2,507 3,495 3,068 2,265 3,066 2,253
Realized Price
Silver in
concentrate
(per oz) $ 14.10 $ 14.33 $ 15.29 $ 17.16 $ 14.99 $ 16.87 $ 20.82 $ 20.20
Gold in
concentrate
(per oz) $ 1,045 $ 1,104 $ 1,089 $ 1,204 $ 1,198 $ 1,158 $ 1,383 $ 1,349
Gold in doré
(per oz) 1,089 1,106 1,182 - - - - -
Lead (per t) $ 1,804 $ 1,764 $ 2,330 $ 1,763 $ 1,754 $ 2,140 $ 2,200 $ 1,990
Zinc (per t) $ 1,549 $ 1,653 $ 2,127 $ 2,023 $ 2,112 $ 2,532 $ 2,245 $ 1,973
LBMA/LME Price(2)
Silver (per oz) $ 14.77 $ 14.91 $ 16.41 $ 16.71 $ 16.50 $ 19.74 $ 19.62 $ 20.48
Gold (per oz) $ 1,105 $ 1,124 $ 1,193 $ 1,219 $ 1,201 $ 1,283 $ 1,288 $ 1,292
Lead (per t) $ 1,681 $ 1,712 $ 1,947 $ 1,807 $ 2,000 $ 2,183 $ 2,095 $ 2,106
Zinc (per t) $ 1,612 $ 1,844 $ 2,195 $ 2,023 $ 2,235 $ 2,311 $ 2,073 $ 2,029
Revenues $ 154,891 $ 145,736 $ 133,812 $ 85,282 $ 65,396 $ 90,279 $ 104,717 $ 89,873
Adjusted earnings $ 51,005 $ 18,610 $ (2,428) $ 31,722 $ 10,092 $ 20,650 $ 35,979 $ 24,975
Adjusted earnings per
Common Share
Basic $ 0.22 $ 0.08 $ (0.01) $ 0.21 $ 0.07 $ 0.14 $ 0.24 $ 0.17
Diluted $ 0.22 $ 0.08 $ (0.01) $ 0.21 $ 0.07 $ 0.14 $ 0.24 $ 0.17
(Loss) earnings from
operations $ (146,973) $ 26,118 $ 2,615 $ 38,688 $ 15,829 $ 28,754 $ 45,198 $ 33,491
(Loss) earnings $ (107,717) $ 13,255 $ (9,339) $ 31,890 $ 9,836 $ 20,036 $ 36,107 $ 24,811
(Loss) earnings per
Common Share
Basic $ (0.47) $ 0.06 $ (0.04) $ 0.22 $ 0.07 $ 0.13 $ 0.25 $ 0.17
Diluted $ (0.47) $ 0.06 $ (0.04) $ 0.22 $ 0.07 $ 0.13 $ 0.24 $ 0.17
Dividends paid $ 13,640 $ 13,627 $ 13,589 $ 8,862 $ 2,953 $ - $ - $ -
Cash flow provided by
operating activities
before changes in
working capital $ 96,786 $ 52,962 $ 28,027 $ 48,893 $ 27,548 $ 42,083 $ 58,859 $ 44,740
Cash flow provided by
operating activities $ 54,161 $ 52,690 $ 34,450 $ 25,774 $ 17,773 $ 62,321 $ 17,679 $ 21,549
Cash and cash
equivalents $ 108,667 $ 110,553 $ 112,222 $ 85,951 $ 80,356 $ 78,897 $ 51,506 $ 39,867
Total assets $ 2,002,461 $ 2,205,269 $ 2,176,837 $ 997,462 $ 975,628 $ 963,267 $ 963,089 $ 930,309
Total non-current
liabilities $ 187,550 $ 255,626 $ 243,402 $ 5,331 $ 5,693 $ 5,099 $ 4,915 $ 4,701
Costs per silver/gold
ounce produced
Total cash costs
net of by-product
credits(3)(4) $ 2.23/541 $ 6.75/548 $ 9.27/540 $ 7.10 $ 6.26 $ 7.02 $ 5.65 $ 9.14
All-in sustaining
costs per ounce
net of by-product
credits(3)(5) $ 4.85/774 $ 9.72/729 $ 12.87/664 $ 9.78 $ 9.09 $ 9.62 $ 8.04 $ 10.25 (1) Comparative Q1 2015 and prior quarter numbers exclude operational and financial information from the gold segment. (2) London Bullion Market Association (LBMA)/London Metal Exchange (LME) average closing prices for each quarter presented. (3) Refer to the “Non-GAAP Financial Measures” section of this MD&A.

Management’s Discussion and Analysis
For the Years Ended December 31, 2015 and 2014 (tabular amounts expressed in thousands of United States dollars, except where otherwise noted)
12
(4) Total cash costs net of by-product credits per silver ounce produced for Q2 2015 include $7.2 million in royalty expense from 2014 sales that
settled in 2015 at the increased royalty rate of 10%. This resulted in a negative per ounce impact of $1.60 per ounce. This impact was offset
during Q4 2015 as a result of a $16.2 million reversal of the increased 10% royalty regime resulting in a positive impact of $2.94 per ounce. (5) All-in sustaining costs net of by-product credits per silver ounce produced for Q2 2015, Q3 2015 and Q4 2015 exclude the impact of $5.7 million,
$0.2 million, and $1.3 million, respectively, in transaction costs related to the acquisition of Rio Alto.
REVIEW OF QUARTERLY CONSOLIDATED FINANCIAL RESULTS
Variances in results by quarter reflect overall corporate activity and factors that do not necessarily recur
each quarter, including operating results, timing of concentrate and doré sales, fluctuations in the
amount of finished goods, construction costs, stock based compensation, royalty payments, interest
income on fluctuating cash balances, foreign exchange gains (losses) and exploration drill programs.
Q4 2015 vs. Q4 2014
The Company generated a loss of $107.7 million for Q4 2015 compared to earnings of $9.8 million for Q4
2014 as a result of the following factors (comparative 2014 data excludes Rio Alto):
Revenues
During Q4 2015, the Company sold in concentrate 6.2 million silver ounces, 3,347 gold ounces at
realized prices of $14.10 and $1,045 per ounce, respectively, compared to 4.1 million silver ounces, 1,567
gold ounces at realized prices of $14.99 and $1,198 per ounce, respectively during Q4 2014. During Q4
2015, the Company sold 56,419 ounces of gold in doré at an average realized price of $1,089 per
ounce. There were no doré sales prior to the acquisition of Rio Alto during Q2 2015.
During Q4 2015, the Company sold in concentrate 3,396 tonnes of lead and 4,542 tonnes of zinc at
realized prices of $1,804 and $1,549 per tonne, respectively, compared to 1,818 tonnes of lead and
3,068 tonnes of zinc at realized prices of $1,754 and $2,112 per tonne, respectively, during Q4 2014.
Concentrate sales increased by approximately 51% during Q4 2015 when compared to Q4 2014 but
were offset by a decrease in realized metal prices of approximately 6%. The inclusion of doré sales from
the Peruvian assets resulted in revenues of $154.9 million, net of treatment and refining charges for Q4
2015, compared to $65.4 million in revenues for Q4 2014. This is an increase in metal revenues of
approximately $89.5 million or 137%.
Operating costs
Production costs
Production costs, which comprise the full cost of operations less royalties, depreciation and
depletion, form a component of total operating costs and were $66.7 million for Q4 2015 compared
to $29.5 million during Q4 2014. The increase is primarily due to the inclusion of production costs at
the La Arena mine, acquired in Q2 2015.
Royalties
During Q4 2015, royalty expense was $(16.2) million due to the reversal of royalties previously
accrued as a result of the repeal of the increased royalty regime. This compares to a royalty
expense of $4.0 million in Q4 2014. Royalties paid in Peru are calculated using a form of operating
profit and are therefore accounted for as an income tax. Refer to the “2015 Highlights” section for
additional detail on the decision of the Guatemalan Constitutional Court striking down the 10%
royalty regime.

Management’s Discussion and Analysis
For the Years Ended December 31, 2015 and 2014 (tabular amounts expressed in thousands of United States dollars, except where otherwise noted)
13
Impairment
The Company recorded a total after-tax impairment charge of $153.4 million, comprising $69.0
million and $84.4 million for La Arena and Shahuindo, respectively (pre-tax impairment of $220.0
million, comprising $99.0 million and $121.0 million for La Arena and Shahuindo, respectively). The
impairment is a result of the Company’s annual asset impairment testing. Using a long-term gold
price of $1,200/oz and a discount rate of 7%, the impairment charge was primarily driven by a
decrease of approximately $100/oz in gold price from the date of acquisition. Refer to the “Cash
Flow, Liquidity, Capital Resources and Other Information - Asset Valuation” section for additional
details.
Depreciation and depletion
During Q4 2015, depreciation and depletion was $23.1 million compared to $9.6 million in Q4 2014.
This increase of $13.5 million is primarily due to the inclusion of $4.6 million of depletion and
depreciation relating to the fair value of the La Arena mine, acquired in Q2 2015, with the
difference being the result of increased production offset by changes in inventory.
Other operating expenses
Exploration expenses
Exploration expenses were consistent at $0.6 million for Q4 2015 compared to $0.6 million in Q4 2014.
General and administrative expenses
General and administrative expenses were $7.7 million for Q4 2015 compared to $5.9 million for Q4
2014. This $1.8 million increase relates primarily to the inclusion of $0.7 million of share-based
payments and a $1.1 million increase in administrative and other expenses.
Other expense
Interest Expense
Interest expense for Q4 2015 was $0.8 million compared to $0.9 million in Q4 2014. The slight
decrease is due to the repayment of the original $50 million credit facility during Q2 2015 and the
repayment of the additional $25 million drawn on the credit facility prior to Q1 2015. This was partially
offset by the interest incurred on the $35 million loan which was acquired as part of the Rio Alto
transaction.
Net foreign exchange loss
A foreign exchange loss of $4.2 million was recognized during Q4 2015 compared to a loss of $0.3
million recognized during Q4 2014. The variation in foreign exchange compared to the prior year
period is the result of fluctuations in the CAD, Guatemalan quetzal and Peruvian sol exchange rates.

Management’s Discussion and Analysis
For the Years Ended December 31, 2015 and 2014 (tabular amounts expressed in thousands of United States dollars, except where otherwise noted)
14
Q4 2015 vs. Q3 2015
The Company generated a loss of $107.7 million for Q4 2015 compared to earnings of $13.3 million for
Q3 2015 as a result of the following factors:
Revenues
During Q4 2015, the Company sold in concentrate 6.2 million silver ounces, 3,347 gold ounces at
realized prices of $14.10 and $1,045 per ounce, respectively, compared to 5.5 million silver ounces, 2,761
gold ounces at realized prices of $14.33 and $1,104 per ounce, respectively during Q3 2015. During Q4
2015, the Company sold 56,419 ounces of gold in doré at an average realized price of $1,089 per
ounce compared to 57,053 ounces of gold in doré at an average realized price of $1,106 per ounce
during Q3 2015.
During Q4 2015, the Company sold in concentrate 3,396 tonnes of lead and 4,542 tonnes of zinc at
realized prices of $1,804 and $1,549 per tonne, respectively, compared to 2,557 tonnes of lead and
2,753 tonnes of zinc at realized prices of $1,764 and $1,653 per tonne, respectively, during Q3 2015.
Concentrate sales increased by approximately 22% during Q4 2015 when compared to Q3 2015 but
were offset by a decrease in realized metal prices of approximately 2%. The inclusion of doré sales from
the acquisition of Rio Alto during Q2 2015 resulted in revenues of $154.9 million, net of treatment and
refining charges for Q4 2015, compared to $145.7 million in revenues for Q3 2015. This is an increase of
approximately $9.2 million or 6%.
Operating costs
Production costs
Production costs, which comprise the full cost of operations less royalties, depreciation and
depletion, form a component of total operating costs and were $66.7 million for Q4 2015 compared
to $72.5 million during Q3 2015. The decrease is primarily due to a decrease in production in both
gold and silver when compared to Q3 2015.
Royalties
During Q4 2015 royalty expense to Guatemalan government agencies was $(16.2) million due to the
reversal of royalties previously accrued as a result of the repeal of the increased royalty regime. This
compares to a royalty expense of $8.3 million in Q3 2015. Royalties paid in Peru are calculated using
a form of operating profit and are therefore accounted for as an income tax. Refer to the “2015
Highlights” section for additional detail on the decision of the Guatemalan Constitutional Court
striking down the 10% royalty regime.
Depreciation and depletion
During Q4 2015, depreciation and depletion was $23.1 million compared to $24.8 million in Q3 2015.
This decrease of $1.7 million is primarily due to the decrease in produced metal over Q3 2015 of
approximately 0.3 million ounces of silver in concentrate and approximately 1,100 ounces of gold in
concentrate and doré.

Management’s Discussion and Analysis
For the Years Ended December 31, 2015 and 2014 (tabular amounts expressed in thousands of United States dollars, except where otherwise noted)
15
Other operating expenses
Exploration expenses
Exploration expenses were $0.6 million for Q4 2015 compared to $3.3 million in Q3 2015 as a result of
decreased drilling during the quarter.
General and administrative expenses
General and administrative expenses were $7.7 million for Q4 2015 compared to $10.7 million for Q3
2015. This $3.0 million decrease relates primarily to a $3.9 million decrease in salaries and benefits
and a $0.2 million decrease in consulting and professional fees. These decreases were offset by a
$1.1 million increase in administrative and other expense.
Impairment
The Company recorded a total after-tax impairment charge of $153.4 million, comprising $69.0
million and $84.4 million for La Arena and Shahuindo, respectively (pre-tax impairment of $220.0
million, comprising $99.0 million and $121.0 million for La Arena and Shahuindo, respectively). The
impairment is a result of the Company’s annual asset impairment testing. Using a long-term gold
price of $1,200/oz and a discount rate of 7%, the impairment charge was primarily driven by a
decrease of approximately $100/oz in gold price from the date of acquisition. Refer to the “Cash
Flow, Liquidity, Capital Resources and Other Information - Asset Valuation” section for additional
details.
Other expense
Interest Expense
Interest expense for Q4 2015 was $0.8 million compared to $0.6 million in Q3 2015. The increase is
due to the standby fees incurred on the revolving facility for a full quarter compared to a partial
quarter in Q3 2015.
Net foreign exchange loss
A foreign exchange loss of $4.2 million was recognized during Q4 2015 compared to $1.1 million
during Q3 2015. The variation in foreign exchange compared to the prior year period is the result of
fluctuations in the CAD, Guatemalan Quetzal and Peruvian sol exchange rates.
Management’s Discussion and Analysis
For the Years Ended December 31, 2015 and 2014 (tabular amounts expressed in thousands of United States dollars, except where otherwise noted)
16
SELECTED OPERATIONAL RESULTS
Q4 2015 AND Q4 2014
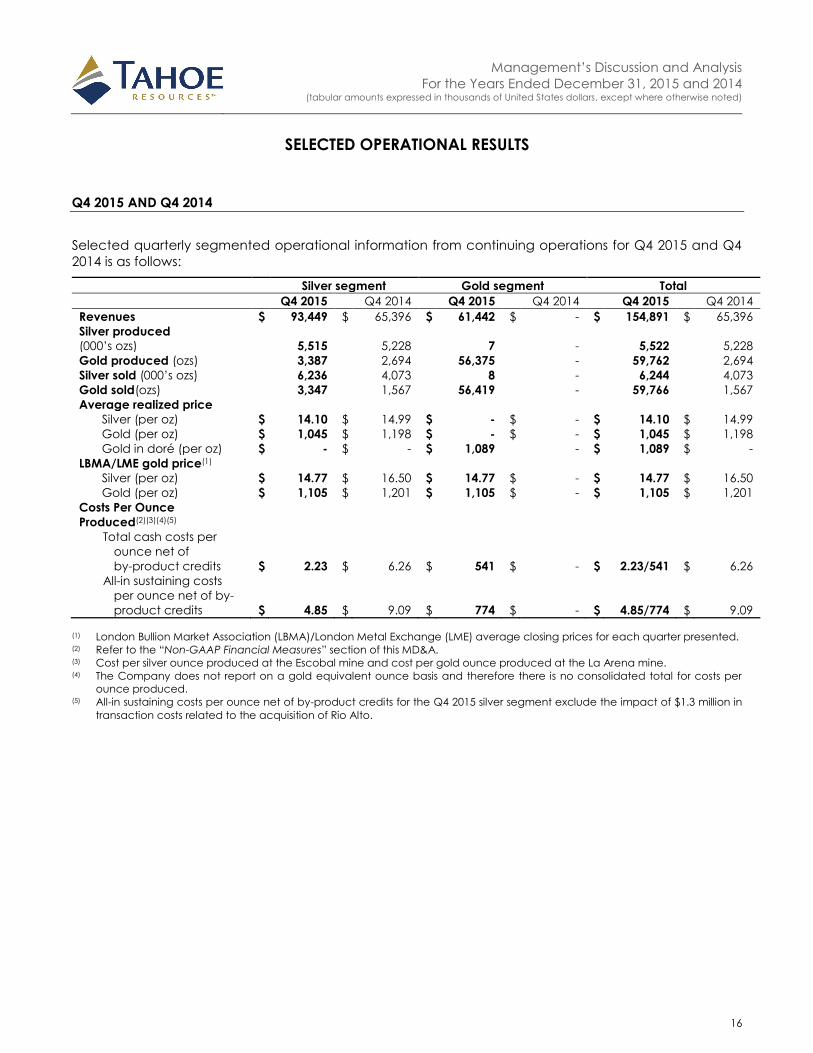
Selected quarterly segmented operational information from continuing operations for Q4 2015 and Q4
2014 is as follows:
Silver segment Gold segment Total
Q4 2015 Q4 2014 Q4 2015 Q4 2014 Q4 2015 Q4 2014
Revenues $ 93,449 $ 65,396 $ 61,442 $ - $ 154,891 $ 65,396
Silver produced
(000’s ozs) 5,515 5,228 7 - 5,522 5,228
Gold produced (ozs) 3,387 2,694 56,375 - 59,762 2,694
Silver sold (000’s ozs) 6,236 4,073 8 - 6,244 4,073
Gold sold(ozs) 3,347 1,567 56,419 - 59,766 1,567
Average realized price
Silver (per oz) $ 14.10 $ 14.99 $ - $ - $ 14.10 $ 14.99
Gold (per oz) $ 1,045 $ 1,198 $ - $ - $ 1,045 $ 1,198
Gold in doré (per oz) $ - $ - $ 1,089 - $ 1,089 $ -
LBMA/LME gold price(1)
Silver (per oz) $ 14.77 $ 16.50 $ 14.77 $ - $ 14.77 $ 16.50
Gold (per oz) $ 1,105 $ 1,201 $ 1,105 $ - $ 1,105 $ 1,201
Costs Per Ounce
Produced(2)(3)(4)(5)
Total cash costs per
ounce net of
by-product credits $ 2.23 $ 6.26 $ 541 $ - $ 2.23/541 $ 6.26
All-in sustaining costs
per ounce net of by-
product credits $ 4.85 $ 9.09 $ 774 $ - $ 4.85/774 $ 9.09
(1) London Bullion Market Association (LBMA)/London Metal Exchange (LME) average closing prices for each quarter presented. (2) Refer to the “Non-GAAP Financial Measures” section of this MD&A. (3) Cost per silver ounce produced at the Escobal mine and cost per gold ounce produced at the La Arena mine. (4) The Company does not report on a gold equivalent ounce basis and therefore there is no consolidated total for costs per
ounce produced. (5) All-in sustaining costs per ounce net of by-product credits for the Q4 2015 silver segment exclude the impact of $1.3 million in
transaction costs related to the acquisition of Rio Alto.

Management’s Discussion and Analysis
For the Years Ended December 31, 2015 and 2014 (tabular amounts expressed in thousands of United States dollars, except where otherwise noted)
17
2015 AND 2014
Selected annual consolidated operational information from continuing operations for 2015 and 2014 is
as follows:
Silver segment Gold segment Total
2015 2014(1) 2015(1) 2014 2015(1) 2014
Revenues $ 323,916 $ 350,265 $ 195,805 $ - $ 519,721 $ 350,265
Silver produced
(000’s ozs)
20,402 20,302 20 - 20,422 20,302
Gold produced (ozs) 11,742 10,893 174,073 - 185,815 10,893
Silver sold (000’s ozs) 20,190 18,160 20 - 20,210 18,160
Gold sold(ozs) 9,793 8,361 173,868 - 183,661 8,361
Average realized price
Silver (per oz) $ 15.15 $ 18.13 $ - $ - $ 15.15 $ 18.13
Gold (per oz) $ 1,100 $ 1,258 $ - $ - $ 1,100 $ 1,258
Gold in doré (per oz) $ - $ - $ 1,126 $ - $ 1,126 $ -
LBMA/LME gold price(2)
Silver (per oz) $ 15.68 $ 19.08 $ 15.68 $ - $ 15.68 $ 19.08
Gold (per oz) $ 1,160 $ 1,266 $ 1,160 $ - $ 1,160 $ 1,266
Costs Per Ounce
Produced(3)(4)(5)(6)
Total cash costs per
ounce net of
by-product credits $ 6.16 $ 6.37 $ 551 $ - $ 6.16/551 $ 6.37
All-in sustaining costs
per ounce net of by-
product credits $ 9.11 $ 9.15 $ 733 $ - $ 9.11/733 $ 9.15
(1) 2015 information for the gold segment include operational and financial information beginning April 1, 2015, the date of
acquisition of Rio Alto. (2) London Bullion Market Association (LBMA)/London Metal Exchange (LME) average closing prices for each quarter presented. (3) Refer to the “Non-GAAP Financial Measures” section of this MD&A. (4) Cost per silver ounce produced at the Escobal mine and cost per gold ounce produced at the La Arena mine. (5) The Company does not report on a gold equivalent ounce basis and therefore there is no consolidated total for costs per
ounce produced. (6) All-in sustaining costs per ounce net of by-product credits for the 2015 silver segment exclude the impact of $7.2 million in
transaction costs related to the acquisition of Rio Alto.

Management’s Discussion and Analysis
For the Years Ended December 31, 2015 and 2014 (tabular amounts expressed in thousands of United States dollars, except where otherwise noted)
18
MINE OPERATIONS
Silver segment (Escobal mine)
Q4 2015 Q4 2014 2015 2014
Tonnes Milled 374,006 319,632 1,508,421 1,245,730
Average Tonnes Milled (tpd) 4,065 3,474 4,133 3,413
Average Metal Grades
Silver (g/t) 522 585 487 585
Gold (g/t) 0.44 0.42 0.39 0.42
Lead 0.94% 0.84% 0.77% 0.93%
Zinc 1.54% 1.52% 1.27% 1.43%
Average Metal Recovery(1)
Silver 87.9% 87.0% 86.3% 86.7%
Gold 64.0% 62.8% 62.8% 64.0%
Lead 87.7% 89.0% 87.5% 89.0%
Zinc 76.8% 77.7% 77.4% 75.2%
Recovered Metal(2)
Silver Ounces 5,515,383 5,227,504 20,402,290 20,301,675
Gold Ounces 3,387 2,694 11,742 10,893
Lead Tonnes 3,075 2,389 10,153 10,359
Zinc Tonnes 4,412 3,773 14,810 13,394
Payable Metal(3)
Silver Ounces 5,184,843 4,940,363 19,272,529 19,250,104
Gold Ounces 2,996 2,399 10,568 9,882
Lead Tonnes 2,890 2,246 9,566 9,761
Zinc Tonnes 3,706 3,168 12,474 11,239
Costs Per Ounce Silver Produced(4)
Total cash costs per ounce before
by-product credits $ 5.26 $ 8.47 $ 8.75 $ 8.97
Total cash costs per ounce net of
by-product credits $ 2.23 $ 6.26 $ 6.16 $ 6.37
Total production costs per ounce
net of by-product credits $ 4.38 $ 8.10 $ 8.49 $ 8.50
All-in sustaining costs per ounce
net of by-product credits(5) $ 4.85 $ 9.09 $ 9.11 $ 9.15
Capital Expenditures(6) $ 8,820 $ 15,183 $ 34,728 $ 41,235
(1) Percent silver and gold recovered into lead and zinc concentrates; percent lead recovered into lead concentrate; percent
zinc recovered into zinc concentrate. (2) Silver and gold contained in lead and zinc concentrates; lead contained in lead concentrate; zinc contained in zinc
concentrate. (3) Payable metal calculated using average NSR payable values. (4) Non-GAAP financial measures are described in the “Non-GAAP Financial Measures” section of this MD&A.
(6) (5) All-in sustaining costs per ounce net of by-product credits for the silver segment exclude the impact of $1.3 million and $7.2
million for Q4 2015 and 2015, respectively, in transaction costs related to the acquisition of Rio Alto.
(6) Capital expenditures include project and sustaining capital.

Management’s Discussion and Analysis
For the Years Ended December 31, 2015 and 2014 (tabular amounts expressed in thousands of United States dollars, except where otherwise noted)
19
Escobal operational highlights include:
Average mill throughput of 4,065 tpd, with an average silver head grade of 522 g/t for Q4 2015
compared to average mill throughput of 3,474 tpd with an average silver head grade of 585 g/t
for Q4 2014. Average mill throughput of 4,133 tpd, with an average silver head grade of 487 g/t
for 2015 compared to average mill throughput of 3,413 tpd with an average silver head grade
of 585 g/t for 2014.
Produced metal concentrates containing 5.5 million ounces of silver, 3,387 ounces of gold, 3,075
tonnes of lead and 4,412 tonnes of zinc for Q4 2015, compared to 5.2 million ounces of silver,
2,694 ounces of gold, 2,389 tonnes of lead and 3,773 tonnes of zinc for Q4 2014. Produced metal
concentrates containing 20.4 million ounces of silver, 11,742 ounces of gold, 10,153 tonnes of
lead and 14,810 tonnes of zinc for 2015, compared to 20.3 million ounces of silver, 10,893 ounces
of gold, 10,359 tonnes of lead and 13,394 tonnes of zinc for 2014.
Average silver recovery to concentrates of 87.9% and 86.3% for Q4 2015 and 2015 compared to
87.0% and 86.7% for Q3 2014 and 2014.
Produced 7,026 tonnes of lead concentrates containing an average silver grade of 22,795 g/t
for Q4 2015 compared to 5,956 tonnes of lead concentrates containing an average silver grade
of 25,943 g/t for Q4 2014. Produced 23,761 tonnes of lead concentrates containing an average
silver grade of 25,241 g/t for 2015 compared to 23,744 tonnes of lead concentrates containing
an average silver grade of 25,477 g/t for 2014.
During Q4 2015, 8,389 dry metric tonnes (“dmt”) of lead concentrate and 9,921 dmt of zinc concentrate
containing approximately 6.4 million payable ounces of silver were shipped and sold to third party
smelters compared to 4,726 dmt of lead concentrate and 6,436 dmt of zinc concentrate containing
approximately 4.1 million payable ounces of silver shipped and sold during Q4 2014.
During 2015, 25,064 dmt of lead concentrate and 29,737 dmt of zinc concentrate containing
approximately 20.4 million payable ounces of silver were shipped and sold to third party smelters
compared to 22,123 dmt of lead concentrate and 23,361 dmt of zinc concentrate containing
approximately 18.2 million payable ounces of silver shipped and sold during 2014.
Q4 2015 concentrate sales generated $93.4 million in revenues at mine operating costs of $29.5 million
resulting in mine operating earnings of $63.9 million. Concentrate sales for Q4 2014 generated $65.4
million in revenues at operating costs of $43.1 million resulting in mine operating earnings of $22.3 million.
2015 concentrate sales generated $323.9 million in revenues at mine operating costs of $190.9 million
resulting in mine operating earnings of $133.0 million. Concentrate sales for 2014 generated $350.3
million in revenues at operating costs of $191.5 million resulting in mine operating earnings of $158.8
million.
Total cash costs per ounce of silver produced in concentrate, net of by-product credits, for Q4 2015 and
2015 were $2.23 and $6.16, respectively, compared to $6.26 and $6.37, for Q4 2014 and 2014,
respectively. Both Q4 2015 and 2015 cash costs are below the updated 2015 guidance range provided
in the news release dated April 13, 2015 of $6.35 to $8.25 per ounce. This and other non-GAAP costs per
ounce calculations are described in the “Non-GAAP Financial Measures” section of this MD&A.
Updated 2016 guidance can be found in the “2016 Operations Outlook” section of this MD&A.
Underground Development and Production
Underground development continues to advance in support of the life-of-mine production schedule.
Development of the East Zone ramp system continued in the fourth quarter; the East Zone hosts

Management’s Discussion and Analysis
For the Years Ended December 31, 2015 and 2014 (tabular amounts expressed in thousands of United States dollars, except where otherwise noted)
20
approximately 40% of the Escobal mine reserves. Stope development in the East Zone continued in the
fourth quarter with stope production expected in early 2016.
During Q4 2015, the Escobal mine delivered approximately 345,000 tonnes of ore to the surface, mined
from primary and secondary transverse longhole stopes on multiple production sublevels.
Mill Performance
Mill operations averaged 4,065 tpd and 4,133 tpd for Q4 2015 and 2015, respectively. Mill expansion
activities to support the expanded 4,500 tpd production rate have been completed.
The mill processed a total of 374,006 tonnes and 1,508,421 tonnes during Q4 2015 and 2015 with
average silver recoveries of 87.9% and 86.3%, respectively. Concentrate production in Q4 2015 totaled
7,026 tonnes of lead concentrate and 8,267 tonnes of zinc concentrate containing 5.5 million ounces of
silver.
Capital Projects
Construction of the paste backfill plant was completed in the third quarter. The Company decided to
defer the final commissioning and start-up of the plant to the first quarter of 2016 to insure no negative
impact to 2015 production goals. As at March 9, 2016, the plant is commissioned and running as
intended. The Company anticipates significant annual cost reductions due to the operation of the new
plant.
Management’s Discussion and Analysis
For the Years Ended December 31, 2015 and 2014 (tabular amounts expressed in thousands of United States dollars, except where otherwise noted)
21
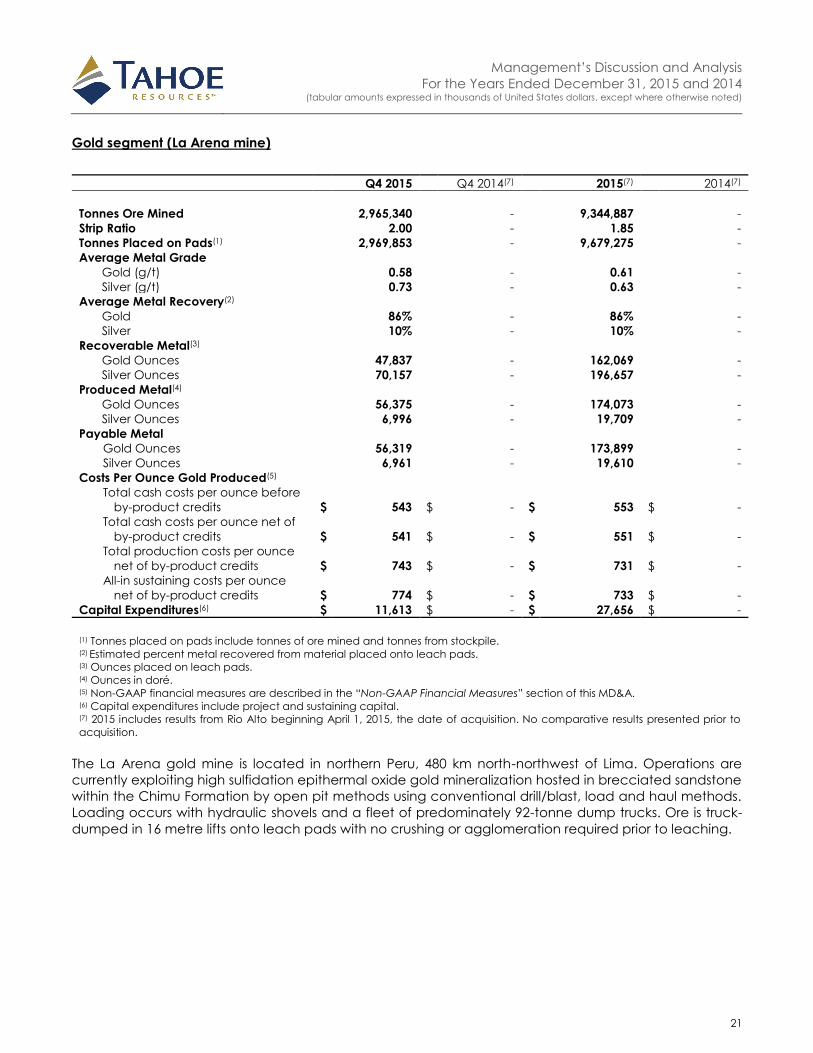
Gold segment (La Arena mine)
Q4 2015 Q4 2014(7) 2015(7) 2014(7)
Tonnes Ore Mined 2,965,340 - 9,344,887 -
Strip Ratio 2.00 - 1.85 -
Tonnes Placed on Pads(1) 2,969,853 - 9,679,275 -
Average Metal Grade
Gold (g/t) 0.58 - 0.61 -
Silver (g/t) 0.73 - 0.63 -
Average Metal Recovery(2)
Gold 86% - 86% -
Silver 10% - 10% -
Recoverable Metal(3)
Gold Ounces 47,837 - 162,069 -
Silver Ounces 70,157 - 196,657 -
Produced Metal(4)
Gold Ounces 56,375 - 174,073 -
Silver Ounces 6,996 - 19,709 -
Payable Metal
Gold Ounces 56,319 - 173,899 -
Silver Ounces 6,961 - 19,610 -
Costs Per Ounce Gold Produced(5)
Total cash costs per ounce before
by-product credits $ 543 $ - $ 553 $ -
Total cash costs per ounce net of
by-product credits $ 541 $ - $ 551 $ -
Total production costs per ounce
net of by-product credits $ 743 $ - $ 731 $ -
All-in sustaining costs per ounce
net of by-product credits $ 774 $ - $ 733 $ -
Capital Expenditures(6) $ 11,613 $ - $ 27,656 $ -
(1) Tonnes placed on pads include tonnes of ore mined and tonnes from stockpile. (2) Estimated percent metal recovered from material placed onto leach pads.
(3) Ounces placed on leach pads. (4) Ounces in doré. (5) Non-GAAP financial measures are described in the “Non-GAAP Financial Measures” section of this MD&A. (6) Capital expenditures include project and sustaining capital. (7) 2015 includes results from Rio Alto beginning April 1, 2015, the date of acquisition. No comparative results presented prior to
acquisition.
The La Arena gold mine is located in northern Peru, 480 km north-northwest of Lima. Operations are
currently exploiting high sulfidation epithermal oxide gold mineralization hosted in brecciated sandstone
within the Chimu Formation by open pit methods using conventional drill/blast, load and haul methods.
Loading occurs with hydraulic shovels and a fleet of predominately 92-tonne dump trucks. Ore is truck-
dumped in 16 metre lifts onto leach pads with no crushing or agglomeration required prior to leaching.
Management’s Discussion and Analysis
For the Years Ended December 31, 2015 and 2014 (tabular amounts expressed in thousands of United States dollars, except where otherwise noted)
22
La Arena operational highlights include:
There were 2,965,340 and 9,344,887 tonnes of ore mined in the Q4 2015 and 2015, respectively;
A total of 5,929,988 and 17,250,575 tonnes of waste was mined for a strip ratio of 2.00 and 1.85
during Q4 2015 and 2015, respectively;
There were 2,969,853 and 9,679,275 tonnes of ore placed on the pad during Q4 2015 and 2015,
respectively;
The average gold grade of ore placed on the pad was 0.58 g/t and 0.61 g/t during Q4 2015 and
2015, respectively;
There were 47,837 and 162,069 gold ounces placed on the pad during Q4 2015 and 2015,
respectively; and
There were 56,375 and 174,073 gold ounces produced and 56,419 and 173,868 gold ounces sold
during Q4 2015 and 2015, respectively.
Q4 2015 gold sales generated $61.4 million in revenues at mine operating costs of $44.0 million resulting
in mine operating earnings of $17.4 million.
2015 gold sales generated $195.8 million in revenues at mine operating costs of $142.6 million resulting in
mine operating earnings of $53.2 million.
Total cash costs per ounce of gold produced, net of by-product credits, for Q4 2015 and 2015 were
$541 and $551, respectively. Q4 2015 and 2015 cash costs are below the updated guidance range
provided in the news release dated April 13, 2015 of $625 to $650 per gold ounce. This and other non-
GAAP costs per ounce calculations are described in the “Non-GAAP Financial Measures” section of this
MD&A. Updated 2016 guidance can be found in the “2016 Operations Outlook” section of this MD&A.
Pit Development and Production
Ore and waste continue to be mined from the third and fourth cut back of the Calaorco Pit. Waste
rock from the pit is being used in construction of Leach Pad 4A3 and in the base of the waste dump
foundation.
Adsorption, Desorption and Refining Process Plant
The adsorption, desorption and refining (“ADR”) process plant performed well over the period with an
average of 12 hectares (“Ha”) under irrigation throughout Q4 2015. Pregnant solution was collected in
the pregnant leach solution (“PLS”) pond and pumped to the adsorption circuit at an average rate of
34m3 per day.
Capital Projects
Sustaining capital projects during Q4 2015 included planned extensions to the leach pad and the waste
dump. These projects remain on schedule to meet the production targets for the first half of 2016.
Management’s Discussion and Analysis
For the Years Ended December 31, 2015 and 2014 (tabular amounts expressed in thousands of United States dollars, except where otherwise noted)
23
PROJECTS
Gold segment (Shahuindo)
The Shahuindo gold project is located in a prolific gold producing belt in northern Peru, 30km north of La
Arena. It is designed as an open-pit, heap leach mine. Construction is on schedule with commercial
production expected to commence in Q2 2016. Mine and plant commissioning activities in late Q4 2015
produced 581 ounces of gold in doré which were included in finished goods inventory at December 31,
2015.
All principle components were completed for the 10,000 tpd capacity plant. Construction work is
continuing on the preparation for the installation of expansion absorption circuits, carbon regeneration
plant and other ancillary site facilities.
EXPLORATION
Silver segment (Guatemala)
All identified mineral resources for the Escobal project are located on the Escobal exploitation
concession. Combined with the Juan Bosco exploration concession, these two concessions comprise
the project area.
Exploration drilling continued at the Escobal project throughout Q4 2015, with four surface exploration
holes completed for a total of 1,461 metres. Throughout 2015 exploration drilling tested extensions of the
Escobal vein as well as a number of satellite targets within the project area. 2015 exploration drilling now
totals 20 holes for 9,650 metres. Mineralization in the project area now defined over a 3,000 metre strike
length and 2,000 metre vertical range.
Exploration continues to identify and define mineralized targets. In addition to the Escobal vein, twelve
veins have been identified throughout the region. These prospective areas continue to be evaluated.
However, a number of these veins occur on concessions that have not yet been granted. Given the
prior administration’s proposed moratorium on new licenses, regional exploration efforts outside of our
two approved licenses were temporarily suspended in 2015.
Guatemala exploration expenditures totaled $0.3 million and $1.9 million for Q4 2015 and 2015,
respectively.
Gold segment (Peru)
Exploration activity in Peru during 2015 included drilling of the La Arena porphyry (sulfide project), deep
extension drilling of La Arena feeder structures and step-out drilling at the Shahuindo project. In
addition, exploration activities were carried out in other high priority regional targets surrounding the La
Arena and Shahuindo resource areas.
No exploration drilling was completed at La Arena during Q4 2015. Drilling earlier in the year comprised
three holes totaling 3,694 metres to expand the geologic model at the copper-gold porphyry
immediately east of the La Arena gold resource. Results of this program are under review and will be
incorporated into a new geologic model and project scoping study planned for 2016. In addition, three
holes for 2,354 metres were drilled earlier in the year to explore deep "Tilsa" feeder structures below the
La Arena oxide gold resource.

Management’s Discussion and Analysis
For the Years Ended December 31, 2015 and 2014 (tabular amounts expressed in thousands of United States dollars, except where otherwise noted)
24
Exploration at Shahuindo focused on step-out drilling to define the margins of the current resource and
identify new zones peripheral to the current pit, with a total of 29 holes for 3,847 metres completed
during Q4 2015. A total of 136 exploration holes for 26,352 metres have been drilled at Shahuindo during
2015.
Peru exploration expenditures totaled $0.3 million and $5.8 million during Q4 2015 and 2015,
respectively.
DEBT FACILITIES
On January 2, 2014, the Company expanded its existing $50 million credit facility (the “facility”) and
drew an additional $25 million to ensure adequate working capital through continued ramp-up of the
Escobal mine and to provide working capital for general corporate purposes. The $25 million bore
interest at a rate per annum of the USD London Interbank Offered Rate (“LIBOR”) plus 7.25%.
In July 2014, the Company amended the facility agreement and extended the maturity date of the
original $50 million to June 3, 2015. All other terms remained per the original agreement.
On September 3, 2014, the Company repaid the $25 million expanded portion of the facility with funds
generated from mining operations. The original $50 million was repaid as scheduled from current cash
balances and operating cash flows on June 3, 2015.
As part of the acquisition of Rio Alto during Q2 2015, the Company acquired debt in the form of a $35
million credit facility agreement (the “loan”). The loan had an original one-year term, maturing June 16,
2015 and bore interest at 30-day LIBOR plus 2.60%. The funds were used for general working capital
purposes. As security for this loan, the Company granted a charge over the shares of its subsidiary
Empresa de Energia Yamobamba S.A.C. and the rights of collection of future cash flows derived from
metal sales. Upon maturity, the loan was extended an additional nine months to March 16, 2016. All
other terms remained per the original contract.
On August 10, 2015, the Company signed a credit agreement with a syndicate of international banks
for a revolving credit facility (the “Revolving Facility”) for an aggregate amount of $150 million. The
Revolving Facility bears interest on a sliding scale of LIBOR plus 2.25% to 3.25% or a base rate plus 1.25%
to 2.25% which is determined based on the Company’s consolidated net leverage ratio.
Transaction costs totaling $1.4 million were capitalized and are being amortized over the term of the
Revolving Facility. For 2015, $0.2 million has been amortized.
Standby fees for the undrawn portion of the facility are also on a similar sliding scale basis of between
0.56% and 0.81% and were $0.2 million and $0.3 million for Q4 2015 and 2015, respectively. The term for
the Revolving Facility is 3 years. Proceeds drawn may be used for general corporate purposes.
As at December 31, 2015 and March 9, 2016, the Company had not drawn on the Revolving Facility.
The Company is currently in compliance with all covenants associated with the Revolving Facility.
LEASE OBLIGATION
As part of the acquisition of Rio Alto on April 1, 2015, the Company acquired a lease obligation in the
form of a sale-leaseback agreement entered into on January 29, 2015 for the La Ramada substation
(“La Ramada”) in Peru. La Ramada was sold for $20.7 million in exchange for cash and a deferred gain
on sale of $0.6 million was recognized and is being amortized over the term of the sale-leaseback.
Subsequent to the sale of La Ramada but on the same date, a leaseback transaction was entered into
in the amount of $20.7 million for a term of three years with quarterly instalments of interest and principal

Management’s Discussion and Analysis
For the Years Ended December 31, 2015 and 2014 (tabular amounts expressed in thousands of United States dollars, except where otherwise noted)
25
at an effective interest rate of 6.95% and $1.2 million in principal on the lease was immediately repaid.
On April 1, 2015, the lease obligation had a fair value of $19.3 million. The agreement is a finance lease
and a corresponding asset has been recognized within mineral interests.
At December 31, 2015, the Company had total lease obligations of $13.9 million (December 31, 2014:
$nil).
2016 OPERATIONS OUTLOOK
The Company provided guidance regarding expected 2016 production and unit costs in the news
release dated January 14, 2016 available at www.sedar.com or on the Company’s website at
www.tahoeresources.com.
2016 Guidance (1)(2)(3)(6)
18 to 21 million ounces of silver contained in concentrates from the Escobal mine; 200 to 250 thousand ounces of gold in doré from the La Arena and Shahuindo mines;
Cash costs per ounce(1)(5) range as outlined in the following table:
Silver Gold
Total cash costs per ounce before by-product credits $ 9.86 to $ 11.50 $ 700 to $ 750
By-product per ounce credit for gold, lead and zinc(4) (2.36) to (3.00) - to -
Total cash costs per ounce net of by-product credits $ 7.50 to $ 8.50 $ 700 to $ 750
All-in sustaining costs per ounce $ 10.00 to $ 11.00 $ 950 to $ 1,050
(1) See “Cautionary Statement on Forward-Looking Information” and “Non-GAAP Financial Measures” in the press release dated January 14,
2016 available at www.sedar.com. (2) Assumes the following metals prices: $1,300/oz gold; $2,094/tonne lead; $2,094/tonne zinc. (3) Assumes payable by-product metal production: 8,462 ozs gold; 8,117 tonnes lead; 10,266 tonnes zinc. (4) By-product credits per ounce of silver: gold $0.52; lead $0.82; zinc $1.02; total $2.36. (5) All per ounce costs are based on silver ounces contained in concentrates (silver) and gold ounces in doré (gold). (6) 2016 Guidance figures presented are for the silver segment (Escobal mine) and the gold segment (La Arena and Shahuindo mines).
The reconciliation which formed the basis for the ranges in the 2016 Guidance is as follows:
Total cash costs Silver Gold
Production costs $ 175,000 $ 175,000
Add/(subtract)
Treatment and refining charges 32,000 -
Total cash costs before by-product credits(1) $ 207,000 $ 175,000
Less gold credit (11,000) -
Less lead credit (21,500) -
Less zinc credit (17,000) -
Total cash costs net of by-product credits $ 157,500 $ 175,000
Silver ounces produced in concentrate (000’s) 21,000 -
Gold ounces produced in doré (000’s) - 250
Total cash costs per ounce before by-product credits $ 9.86 $ 700
Total cash costs per ounce net of by-product credits $ 7.50 $ 700 (1) Gold, lead and zinc by-product credits are calculated as follows:
Silver
Total Credit Credit per ounce
Gold Ounces $11,000 $0.52
Lead Tonnes $17,000 $0.82
Zinc Tonnes $21,500 $1.02

Management’s Discussion and Analysis
For the Years Ended December 31, 2015 and 2014 (tabular amounts expressed in thousands of United States dollars, except where otherwise noted)
26
All-in sustaining costs Silver Gold
Total cash costs net of by-product credits $ 157,500 $ 175,000
Sustaining capital 32,600 39,000
Exploration 2,000 6,000
Reclamation cost accretion 200 1,600
General and administrative expenses 17,600 16,000
All-in sustaining costs $ 209,900 $ 237,600
Silver ounces produced in concentrate (000’s) 21,000 -
Gold ounces produced in doré (000’s) - 250
All-in sustaining costs per ounce produced
net of by-product credits $ 10.00 $ 950
RISK FACTORS
Tahoe’s ability to generate revenues and achieve a return on shareholders’ investment must be
considered in light of, among other things, the risks of doing business in foreign countries, the
sustainability of operations and the dependence on the Escobal and La Arena mines and the risks
associated with the commissioning and operation of the Shahuindo gold mine. This document should
be read in conjunction with the 2015 Annual Information Form (“2015 AIF”) which includes a risk factor
discussion under the heading “Description of Our Business – Risk Factors Relating to Our Business” and “ –
Risk Factors Relating to Our Shares”, and our short form prospectus dated June 23, 2015 (“Prospectus”)
which includes a risk factor discussion under the heading “Risk Factors”. The 2015 AIF and Prospectus are
available at www.sedar.com or on the Company’s website at www.tahoeresources.com.
RISKS RELATED TO OPERATIONS IN GUATEMALA AND PERU
The Company’s operations are subject to political, economic, social and geographic risks of doing
business in Guatemala and Peru.
Guatemala suffered an armed conflict for 36 years, which was finally resolved through a peace
agreement reached with the country’s internal revolutionary movement in 1996. The last political crisis in
Guatemala occurred in 1983 and constitutional government was not restored until 1985. In the past two
decades, Guatemala has made progress in restructuring its political institutions and establishing
democratic processes. Guatemala suffers from social problems such as a high crime rate, political
corruption and uncertain land tenure for many indigenous people, which could adversely affect the
Escobal mine.
For more than two decades Peru has made progress in restructuring its political institutions and
revitalizing its economy. In previous decades Peru’s history was one of political and economic instability
during which governments intervened in the national economy and social structure, including
periodically imposing various controls, the effects of which were to restrict the ability of both domestic
and foreign companies to freely operate. There is also the risk of political violence and increased social
tension in Peru as a result of the increased civil unrest, crime and labour unrest.
Local opposition to mine development projects occurs in Guatemala and Peru, and such opposition
has at times been violent. Roadblocks by members of local communities, unemployed people and
unions can occur on local, national and provincial routes. Renewed political unrest or a political crisis in
Guatemala or Peru could adversely affect the Company’s business and results of operations. Such
adverse effects could result from local protests or from the efforts of third parties to manipulate local
populations into encroaching on the Company’s land, challenging the boundaries of such land,
impeding access to the Company’s properties through roadblocks or other public protests or attacks
against our assets or personnel.
Management’s Discussion and Analysis
For the Years Ended December 31, 2015 and 2014 (tabular amounts expressed in thousands of United States dollars, except where otherwise noted)
27
As in any jurisdiction, mineral exploration and mining activities in Guatemala or Peru may be affected in
varying degrees by government regulations relating to the mining industry, judicial activity or political
instability. Operations may also be affected in varying degrees by government regulations and laws
with respect to restrictions on production, price controls, export controls, income taxes, royalties,
expropriation of property, environmental legislation and mine safety. The status of Guatemala and Peru
as developing countries may make it more difficult to obtain any required financing for projects.
RISKS RELATED TO THE RIO ALTO ACQUISITION
The integration of the Company and Rio Alto will present challenges to management, including the
integration of systems and personnel of the two companies, implementing uniform standards, controls,
procedures and policies, as applicable, including the integration of Rio Alto’s disclosure controls and
procedures and internal control over financial reporting with our existing procedures and controls.
NON-GAAP FINANCIAL MEASURES
NON-GAAP FINANCIAL MEASURES
The Company has included certain non-GAAP financial measures throughout this document which
include total cash costs, total production costs, all-in sustaining costs per silver and per gold ounce (“all-
in sustaining costs”), adjusted earnings and adjusted earnings per share. These measures are not
defined under IFRS and should not be considered in isolation. The Company’s Escobal mine produces
primarily silver in concentrates with other metals (gold, lead and zinc), produced simultaneously in the
mining process, the value of which represents a small percentage of the Company’s revenue and is
therefore considered “by-product”. The Company’s La Arena mine produces primarily gold with other
metals (primarily silver), produced simultaneously in the mining process, the value of which represents a
small percentage of the Company’s revenue and is therefore considered by-product. The Company
believes these measures will provide investors and analysts with useful information about the Company’s
underlying earnings, cash costs of operations, the impact of by-product credits on the Company’s cost
structure and its ability to generate cash flow, as well as providing a meaningful comparison to other
mining companies. Accordingly, these measures are intended to provide additional information and
should not be substituted for GAAP measures.
Consolidated adjusted earnings (loss) and consolidated adjusted earnings (loss) per share
The Company has adopted the reporting of consolidated adjusted earnings (loss) (“adjusted earnings
(loss)”) and consolidated adjusted earnings (loss) per share (“adjusted earnings (loss) per share”) as a
non-GAAP measure of a precious metals mining company’s operating performance and the ability to
generate cash flow from operations. This measure has no standardized meaning and the Company’s
presentation of adjusted measures are not meant to be substituted for GAAP measures of consolidated
net earnings (loss) or consolidated net earnings (loss) per share and should be read in conjunction with
such GAAP measures. Adjusted earnings (loss) and adjusted earnings (loss) per share are calculated as
net earnings (loss) excluding i) non-cash impairment losses and reversals on mineral interest and other
assets tax, ii) unrealized foreign exchange gains or losses related to the revaluation of deferred income
tax assets and liabilities on non-monetary items, iii) unrealized foreign exchange gains or losses related
to other items, iv) unrealized gains or losses on derivatives, v) non-recurring provisions, vi) gains or losses
on sale of assets and viii) any other non-recurring adjustments and the related tax impact of these
adjustments calculated at the statutory effective rate for the same jurisdiction as the adjustment. Non-
recurring adjustments from unusual events or circumstances are reviewed periodically based on
materiality and the nature of the even or circumstance. The Company calculates adjusted earnings
(loss) and adjusted earnings (loss) per share are prepared on a consolidated basis.
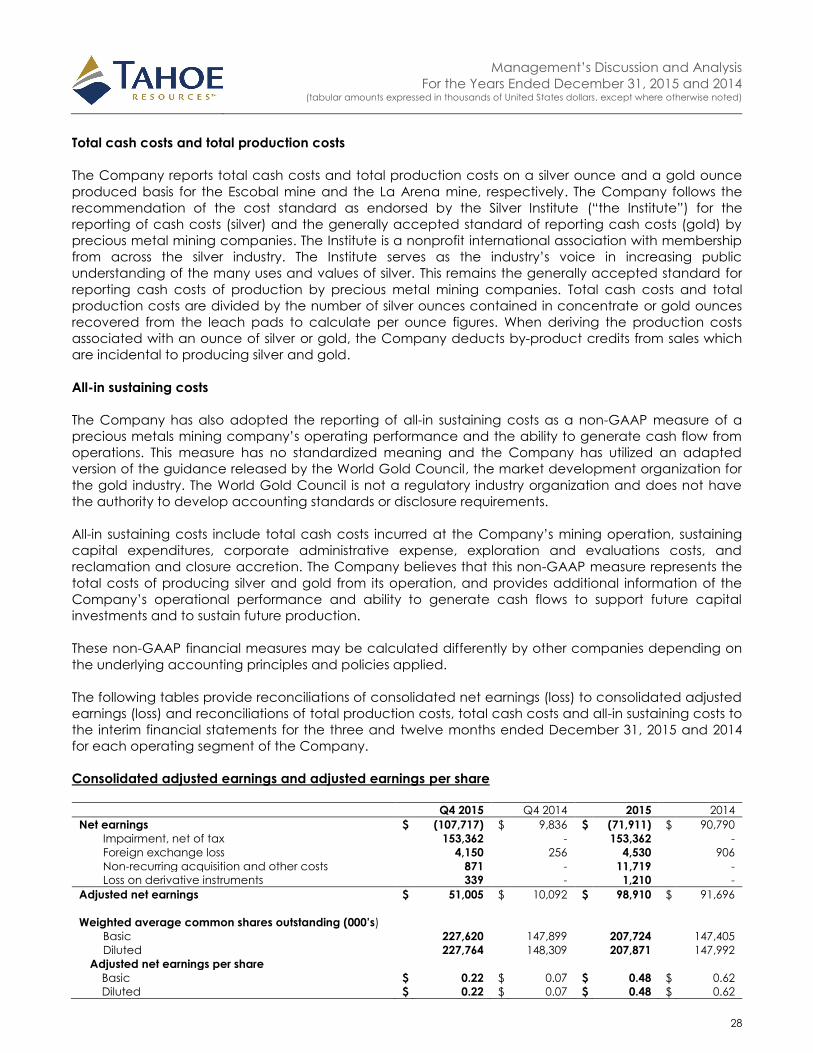
Management’s Discussion and Analysis
For the Years Ended December 31, 2015 and 2014 (tabular amounts expressed in thousands of United States dollars, except where otherwise noted)
28
Total cash costs and total production costs
The Company reports total cash costs and total production costs on a silver ounce and a gold ounce
produced basis for the Escobal mine and the La Arena mine, respectively. The Company follows the
recommendation of the cost standard as endorsed by the Silver Institute (“the Institute”) for the
reporting of cash costs (silver) and the generally accepted standard of reporting cash costs (gold) by
precious metal mining companies. The Institute is a nonprofit international association with membership
from across the silver industry. The Institute serves as the industry’s voice in increasing public
understanding of the many uses and values of silver. This remains the generally accepted standard for
reporting cash costs of production by precious metal mining companies. Total cash costs and total
production costs are divided by the number of silver ounces contained in concentrate or gold ounces
recovered from the leach pads to calculate per ounce figures. When deriving the production costs
associated with an ounce of silver or gold, the Company deducts by-product credits from sales which
are incidental to producing silver and gold.
All-in sustaining costs
The Company has also adopted the reporting of all-in sustaining costs as a non-GAAP measure of a
precious metals mining company’s operating performance and the ability to generate cash flow from
operations. This measure has no standardized meaning and the Company has utilized an adapted
version of the guidance released by the World Gold Council, the market development organization for
the gold industry. The World Gold Council is not a regulatory industry organization and does not have
the authority to develop accounting standards or disclosure requirements.
All-in sustaining costs include total cash costs incurred at the Company’s mining operation, sustaining
capital expenditures, corporate administrative expense, exploration and evaluations costs, and
reclamation and closure accretion. The Company believes that this non-GAAP measure represents the
total costs of producing silver and gold from its operation, and provides additional information of the
Company’s operational performance and ability to generate cash flows to support future capital
investments and to sustain future production.
These non-GAAP financial measures may be calculated differently by other companies depending on
the underlying accounting principles and policies applied.
The following tables provide reconciliations of consolidated net earnings (loss) to consolidated adjusted
earnings (loss) and reconciliations of total production costs, total cash costs and all-in sustaining costs to
the interim financial statements for the three and twelve months ended December 31, 2015 and 2014
for each operating segment of the Company.
Consolidated adjusted earnings and adjusted earnings per share
Q4 2015 Q4 2014 2015 2014
Net earnings $ (107,717) $ 9,836 $ (71,911) $ 90,790
Impairment, net of tax 153,362 - 153,362 -
Foreign exchange loss 4,150 256 4,530 906
Non-recurring acquisition and other costs 871 - 11,719 -
Loss on derivative instruments 339 - 1,210 -
Adjusted net earnings $ 51,005 $ 10,092 $ 98,910 $ 91,696
Weighted average common shares outstanding (000’s)
Basic 227,620 147,899 207,724 147,405
Diluted 227,764 148,309 207,871 147,992
Adjusted net earnings per share
Basic $ 0.22 $ 0.07 $ 0.48 $ 0.62
Diluted $ 0.22 $ 0.07 $ 0.48 $ 0.62
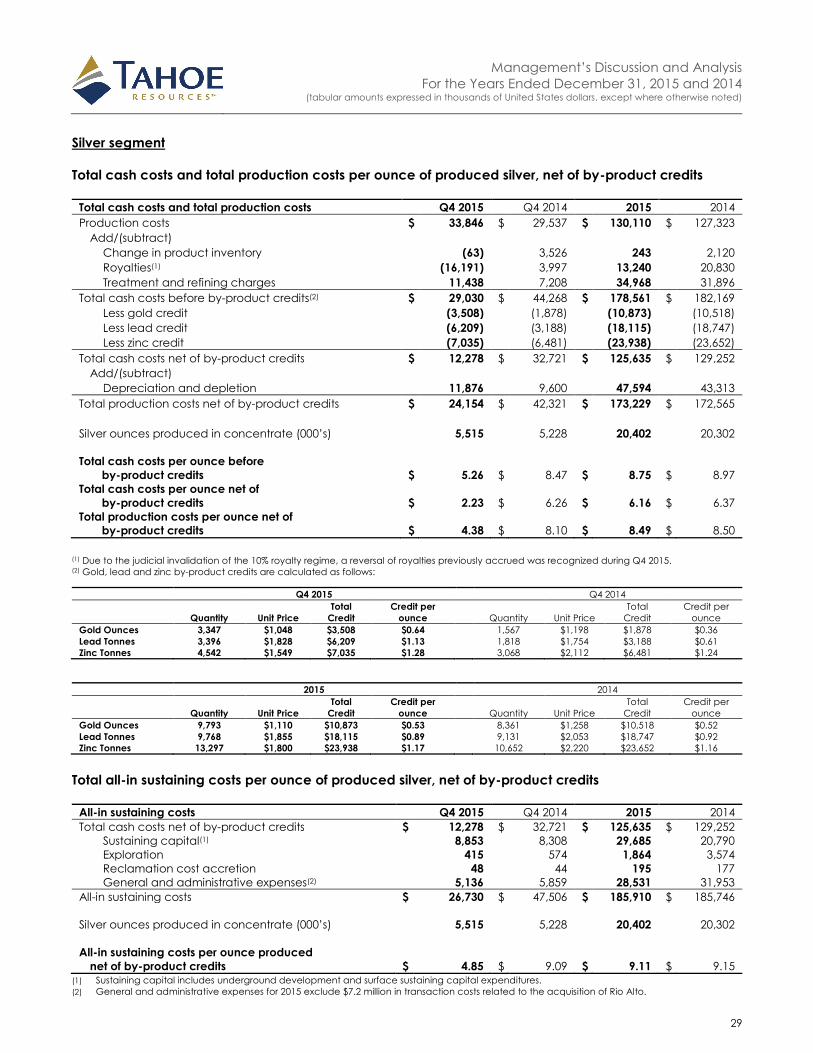
Management’s Discussion and Analysis
For the Years Ended December 31, 2015 and 2014 (tabular amounts expressed in thousands of United States dollars, except where otherwise noted)
29
Silver segment
Total cash costs and total production costs per ounce of produced silver, net of by-product credits
Total cash costs and total production costs Q4 2015 Q4 2014 2015 2014
Production costs $ 33,846 $ 29,537 $ 130,110 $ 127,323
Add/(subtract)
Change in product inventory (63) 3,526 243 2,120
Royalties(1) (16,191) 3,997 13,240 20,830
Treatment and refining charges 11,438 7,208 34,968 31,896
Total cash costs before by-product credits(2) $ 29,030 $ 44,268 $ 178,561 $ 182,169
Less gold credit (3,508) (1,878) (10,873) (10,518)
Less lead credit (6,209) (3,188) (18,115) (18,747)
Less zinc credit (7,035) (6,481) (23,938) (23,652)
Total cash costs net of by-product credits $ 12,278 $ 32,721 $ 125,635 $ 129,252
Add/(subtract)
Depreciation and depletion 11,876 9,600 47,594 43,313
Total production costs net of by-product credits $ 24,154 $ 42,321 $ 173,229 $ 172,565
Silver ounces produced in concentrate (000’s) 5,515 5,228 20,402 20,302
Total cash costs per ounce before
by-product credits $ 5.26 $ 8.47 $ 8.75 $ 8.97
Total cash costs per ounce net of
by-product credits $ 2.23 $ 6.26 $ 6.16 $ 6.37
Total production costs per ounce net of
by-product credits $ 4.38 $ 8.10 $ 8.49 $ 8.50
(1) Due to the judicial invalidation of the 10% royalty regime, a reversal of royalties previously accrued was recognized during Q4 2015. (2) Gold, lead and zinc by-product credits are calculated as follows:
Q4 2015 Q4 2014
Quantity Unit Price
Total
Credit
Credit per
ounce
Quantity Unit Price
Total
Credit
Credit per
ounce
Gold Ounces 3,347 $1,048 $3,508 $0.64 1,567 $1,198 $1,878 $0.36
Lead Tonnes 3,396 $1,828 $6,209 $1.13 1,818 $1,754 $3,188 $0.61
Zinc Tonnes 4,542 $1,549 $7,035 $1.28 3,068 $2,112 $6,481 $1.24
2015 2014
Quantity Unit Price
Total
Credit
Credit per
ounce
Quantity Unit Price
Total
Credit
Credit per
ounce
Gold Ounces 9,793 $1,110 $10,873 $0.53 8,361 $1,258 $10,518 $0.52
Lead Tonnes 9,768 $1,855 $18,115 $0.89 9,131 $2,053 $18,747 $0.92
Zinc Tonnes 13,297 $1,800 $23,938 $1.17 10,652 $2,220 $23,652 $1.16
Total all-in sustaining costs per ounce of produced silver, net of by-product credits
All-in sustaining costs Q4 2015 Q4 2014 2015 2014
Total cash costs net of by-product credits $ 12,278 $ 32,721 $ 125,635 $ 129,252
Sustaining capital(1) 8,853 8,308 29,685 20,790
Exploration 415 574 1,864 3,574
Reclamation cost accretion 48 44 195 177
General and administrative expenses(2) 5,136 5,859 28,531 31,953
All-in sustaining costs $ 26,730 $ 47,506 $ 185,910 $ 185,746
Silver ounces produced in concentrate (000’s) 5,515 5,228 20,402 20,302
All-in sustaining costs per ounce produced
net of by-product credits $ 4.85 $ 9.09 $ 9.11 $ 9.15 (1) Sustaining capital includes underground development and surface sustaining capital expenditures.
(2) General and administrative expenses for 2015 exclude $7.2 million in transaction costs related to the acquisition of Rio Alto.
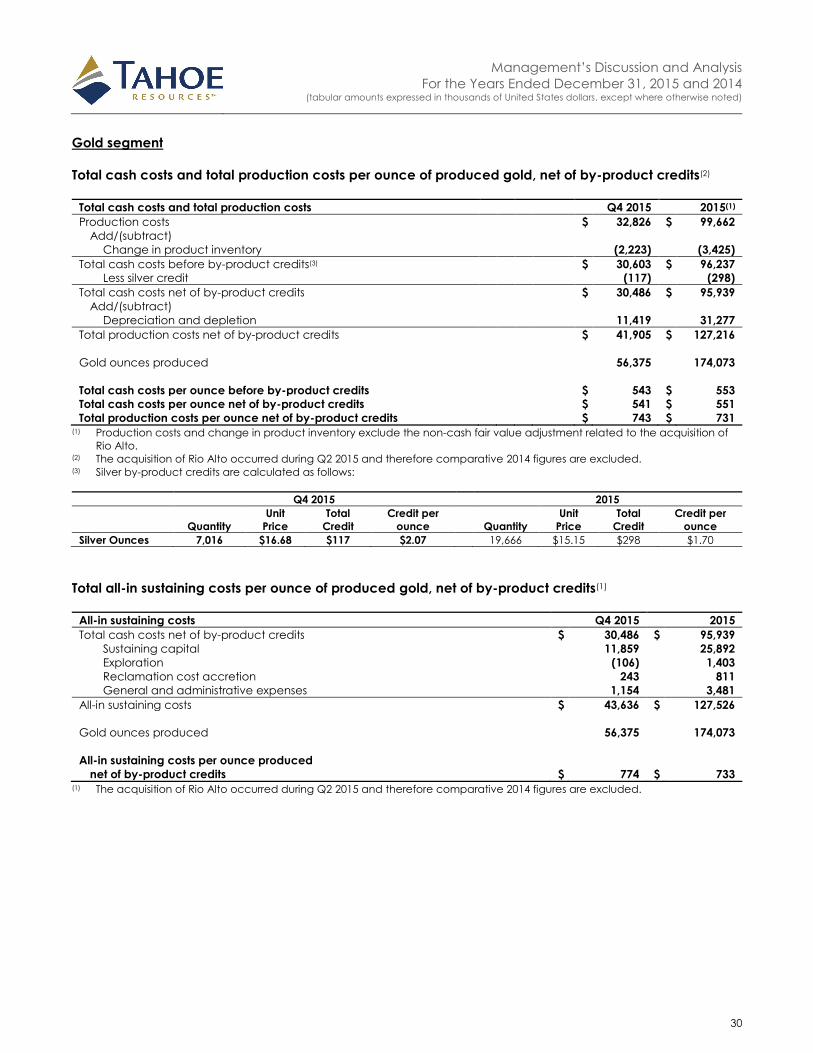
Management’s Discussion and Analysis
For the Years Ended December 31, 2015 and 2014 (tabular amounts expressed in thousands of United States dollars, except where otherwise noted)
30
Gold segment
Total cash costs and total production costs per ounce of produced gold, net of by-product credits(2)
Total cash costs and total production costs Q4 2015 2015(1)
Production costs $ 32,826 $ 99,662
Add/(subtract)
Change in product inventory (2,223) (3,425)
Total cash costs before by-product credits(3) $ 30,603 $ 96,237
Less silver credit (117) (298)
Total cash costs net of by-product credits $ 30,486 $ 95,939
Add/(subtract)
Depreciation and depletion 11,419 31,277
Total production costs net of by-product credits $ 41,905 $ 127,216
Gold ounces produced 56,375 174,073
Total cash costs per ounce before by-product credits $ 543 $ 553
Total cash costs per ounce net of by-product credits $ 541 $ 551
Total production costs per ounce net of by-product credits $ 743 $ 731 (1) Production costs and change in product inventory exclude the non-cash fair value adjustment related to the acquisition of
Rio Alto. (2) The acquisition of Rio Alto occurred during Q2 2015 and therefore comparative 2014 figures are excluded. (3) Silver by-product credits are calculated as follows:
Q4 2015 2015
Quantity
Unit
Price
Total
Credit
Credit per
ounce Quantity
Unit
Price
Total
Credit
Credit per
ounce
Silver Ounces 7,016 $16.68 $117 $2.07 19,666 $15.15 $298 $1.70
Total all-in sustaining costs per ounce of produced gold, net of by-product credits(1)
All-in sustaining costs Q4 2015 2015
Total cash costs net of by-product credits $ 30,486 $ 95,939
Sustaining capital 11,859 25,892
Exploration (106) 1,403
Reclamation cost accretion 243 811
General and administrative expenses 1,154 3,481
All-in sustaining costs $ 43,636 $ 127,526
Gold ounces produced 56,375 174,073
All-in sustaining costs per ounce produced
net of by-product credits $ 774 $ 733 (1) The acquisition of Rio Alto occurred during Q2 2015 and therefore comparative 2014 figures are excluded.

Management’s Discussion and Analysis
For the Years Ended December 31, 2015 and 2014 (tabular amounts expressed in thousands of United States dollars, except where otherwise noted)
31
CASH FLOW, LIQUIDITY, CAPITAL RESOURCES AND OTHER INFORMATION
CASH FLOW
Q4 2015 vs. Q4 2014
Cash provided by operating activities before changes in working capital was $96.8 million for Q4 2015,
compared to $27.5 million for Q4 2014. Net cash provided by operating activities totaled $54.2 million for
Q4 2015, compared to $17.8 million for Q4 2014. The increase in cash from operations was due to the
addition, beginning Q2 2015, of production from the La Arena mine included in the consolidated cash
flows from operating activities.
Investing activities consisted of additions to property, plant, and equipment of $44.5 million during Q4
2015, compared to $12.7 million during Q4 2014.
Financing activities resulted in a cash outflow of $16.0 million during Q4 2015 compared to cash outflows
of $3.6 million during Q4 2014. The Q4 2015 outflow was primarily due to the $13.6 million payment of
dividends, $1.9 million payment of interest and financing fees and $1.5 million in payments on the
finance leases offset by $1.1 million in proceeds from the issuance of common shares on exercise of
share options and warrants. Cash used in financing activities in Q4 2014 consisted primarily of $3.0 million
payment of dividends and $0.9 million payment of interest and financing fees offset by $0.3 million cash
inflows relating to proceeds from the issuance of common shares on the exercise of stock options.
2015 vs. 2014
Cash provided by operating activities before changes in working capital was $226.3 million for 2015,
compared to $173.2 million for 2014. Net cash provided by operating activities totaled $166.7 million for
2015, compared to $119.3 million for 2014. The increase in cash from operations was due to the addition,
beginning Q2 2015, of production from the La Arena mine included in the consolidated cash flows from
operating activities.
Investing activities consisted of additions to property, plant, and equipment of $122.0 million during
2015, compared to $48.8 million during 2014. These additions were offset by $61.7 million in cash
acquired through the Rio Alto acquisition in Q2 2015.
Financing activities resulted in a cash outflow of $81.8 million during 2015 compared to cash inflows of
$1.7 million during 2014. The 2015 outflow was primarily due to the repayment of the loan facility of $50
million in addition to $49.7 million relating to the payment of dividends, $4.8 million in payments on the
finance leases and $5.0 million in interest and financing fees paid offset by $27.7 million in proceeds
from the issuance of common shares on the exercise of stock options. Cash used in financing activities
in 2014 consisted primarily of $4.4 million interest payments on the $25 million expanded credit facility,
$3.0 million payment of dividends and $1.5 million payment of financing fees offset by $10.7 million cash
inflows relating to proceeds from the issuance of common shares on the exercise of stock options. The
$25 million expanded credit facility was drawn and repaid during 2014 and therefore there is no impact
on the financing activities during the period.
LIQUIDITY AND CAPITAL RESOURCES
The Company’s cash and cash equivalents balance at December 31, 2015 was $108.7 million
compared to $80.4 million at December 31, 2014.
The Company had working capital of $77.3 million and non-current liabilities of $187.6 million at
December 31, 2015 of which $134.6 million relates to non-cash deferred tax liabilities. This compares to
working capital of $42.7 million at December 31, 2014 and non-current liabilities of $5.7 million. This
change in the working capital position was due to the sale of concentrate production, collection of

Management’s Discussion and Analysis
For the Years Ended December 31, 2015 and 2014 (tabular amounts expressed in thousands of United States dollars, except where otherwise noted)
32
concentrate sales accounts receivable and buildup of product inventories and the acquisition of Rio
Alto during Q2 2015.
It is the opinion of management, based on the Company’s current liquidity position, continued steady
state operations and sale of concentrate and doré production, that the Company’s liquid assets will be
sufficient to discharge liabilities, and to continue funding operations. The Company may consider
alternative financing arrangements to meet its strategic needs. Refer to the “Debt Facilities” section of
this MD&A for further information.
The Company’s capital consists of the following:
December 31,
2015
December 31,
2014
Equity $ 1,664,031 $ 878,060
Debt 35,000 49,804
Lease obligations 13,862 -
1,712,893 927,864
Less: cash and cash equivalents (108,667) (80,356)
Less: restricted cash (2,500) -
$ 1,601,726 $ 847,508
The Company’s policy is to maintain a strong capital base so as to maintain investor, creditor and
market confidence and to support future development of the business. The Company seeks to maintain
a balance between the higher returns that might be possible with higher levels of borrowing and the
advantages and security afforded by a sound capital position. The capital structure of the Company
consists of common equity, comprising share capital and reserves net of accumulated deficit, and
debt, which includes the credit facility and finance leases.
The Company’s overall capital management strategy remains unchanged from the year ended
December 31, 2014.
Dividends declared and paid during Q4 2015 and 2015 totaled $13.6 million and $49.7 million,
respectively (Q4 2014 and 2014: $3.0 million and $3.0 million, respectively).
COMMITMENTS AND CONTINGENCIES
The Company’s significant undiscounted commitments at December 31, 2015 are as follows:
December 31,
2015
December 31,
2014
1 year 2-5 years 5+ years Total Total
Accounts payable and accrued
liabilities and other current
liabilities $ 99,748 $ - $ - $ 99,748 $ 40,246
Debt 35,000 - - 35,000 51,313
Income tax payable 9,981 - - 9,981 1,825
Lease and contractual
agreements 7,972 1,505 - 9,477 7,783
Commitments to purchase
equipment, services, materials
and supplies 54,771 30,459 - 85,230 19,400
Other non-current liabilities - 5,674 - 5,674 2,164
Reclamation provision 9 1,007 68,385 69,401 10,240
$ 207,481 $ 38,645 $ 68,385 $ 314,511 $ 132,971
Management’s Discussion and Analysis
For the Years Ended December 31, 2015 and 2014 (tabular amounts expressed in thousands of United States dollars, except where otherwise noted)
33
The significant increase over December 31, 2015 relates primarily to the acquisition of Rio Alto during Q2
2015.
OFF-BALANCE SHEET ARRANGEMENTS
The Company currently has no off-balance sheet arrangements.
USE OF FINANCIAL INSTRUMENTS
The principal financial instruments currently affecting the Company’s financial condition are cash and
cash equivalents, restricted cash, provisionally priced accounts receivable, accounts payable and
accrued liabilities, debt, finance leases and a currency swap. The Company’s exposure to credit risk on
its Canadian currency and United States currency deposits is limited by maintaining such cash and term
deposits with major Canadian banks and banks in the United States that have strong credit ratings. A
minimal amount of cash is held by banks in Switzerland, Guatemala and Peru to fund the immediate
needs of subsidiaries in those locations. To minimize risk, the Company’s funds are kept in highly liquid
instruments and on deposit with stable institutions and are redeemable on demand.
Currency Swap
Concurrent with the sale-leaseback agreement discussed in the “Selected Operational Results - Lease
Obligation” section, a cross-currency swap (the “Currency Swap”) was entered into in the amount of
$23.6 million at a fixed exchange rate of 2.96 Peruvian soles to one USD with quarterly instalments of
principal and interest over a 3-year term. The changes in the fair value of the Currency Swap are
recognized in the statement of operations as an unrealized gain or loss. At December 31, 2015, the
Currency Swap had a fair value of $2.7 million and is included in other non-current liabilities. For the
three months and year ended December 31, 2015, a loss of $0.3 million and $1.2 million, respectively,
was recorded in the statement of operations.
ASSET VALUATION
The Company performs impairment testing annually for its goodwill at the end of the third quarter of
each financial year, or when there are indicators of potential impairment. Testing is performed on
mineral interests and other assets, including goodwill, to determine if the recoverable amount (fair value
less costs of disposal (“FVLCD”)) of each cash generating units (“CGU”) is greater than its carrying value.
The Company identified four CGUs: Escobal (silver segment), La Arena oxides (gold segment), La Arena
sulphides (gold segment) and Shahuindo (gold segment) for which it determined a FVLCD using a
discounted cash flow (“DCF”) model.
In determining the pricing assumptions to use in the DCF models, the Company used a combination of
long-term consensus prices and management’s best estimates as follows: Gold price: $1,200/ounce,
silver price - $18.75/ounce, copper price $3.00/lb, Zinc price - $1.04/lb and lead price - $0.96/lb.
Discount rates used were 7.00% for Escobal, La Arena oxides and Shahuindo. A rate of 8.75% was
determined for the La Arena sulphide project. The rate used for Escobal, La Arena oxides and
Shahuindo represents the lower risk associated with an operating mine compared with an exploration or
development project. Using these assumptions among other quantitative and qualitative
considerations, the Company determined that two CGUs were impaired by $220 million (after-tax
amount approximately $153 million) which is included in other operating expenses. The impairment
charge was primarily driven by a decrease of approximately $100/oz in gold price from the date of
acquisition.

Management’s Discussion and Analysis
For the Years Ended December 31, 2015 and 2014 (tabular amounts expressed in thousands of United States dollars, except where otherwise noted)
34
Impairment by CGU at October 1, 2015 is as follows (in millions of USD):
Opening
Carrying
Value Fair Value
Pre-tax
impairment
After-tax
impairment
Ending
Carrying
Value
La Arena oxides 328 229 99 69 229
Shahuindo 468 347 121 84 347
$ 796 $ 576 $ 220 $ 153 $ 576
RELATED PARTIES
Related party transactions
During the year ended December 31, 2015, the Company’s related parties included its subsidiaries,
Goldcorp Inc. (“Goldcorp”) as a significant equity shareholder in the Company’s publicly traded shares,
key management personnel, and Directors.
On June 30, 2015, the closing of a secondary offering of the Tahoe commons shares beneficially held by
Goldcorp resulted in Goldcorp no longer owning any common shares of the Company. Goldcorp was
therefore no longer a related party subsequent to that date.
Transactions with subsidiaries, key management personnel, and Directors were conducted using normal
commercial terms and were considered to be at arm’s length.
Key management personnel compensation
Key management are those personnel having the authority and responsibility for planning, directing,
and controlling the Company. In addition to their salaries, key management personnel, including the
Board of Directors, Officers and senior management, receive bonuses and also participate in the
Company’s Share Option and Share Incentive Plan.
Key management personnel compensation included in general administrative expenses is as follows:
2015 2014
Short-term employee benefits(1) 10,397 6,450
Share-based payments 5,473 4,814
$ 15,870 $ 11,264
(1) Short-term employee benefits include salaries, bonuses and other annual employee benefits paid during the year.
RECLAMATION AND CLOSURE
The Company has an obligation to reclaim its properties. The Company recognizes the present value of
liabilities for reclamation and closure costs in the period in which they are incurred. A corresponding
increase in the carrying amount of the related assets is recorded and amortized over the life of the
asset.
In determining the discount rate to be used in the calculation of the present value of the future
reclamation obligations, the Company combines risk and inflation rates specific to the country in which
the reclamation will take place.
As at December 31, 2015, the Company has estimated the present value of the future reclamation
obligation arising from its activities to be $39.5 million (December 31, 2014: $3.5 million).

Management’s Discussion and Analysis
For the Years Ended December 31, 2015 and 2014 (tabular amounts expressed in thousands of United States dollars, except where otherwise noted)
35
For Escobal, La Arena and Shahuindo, the present value calculation assumes a discount rate of 6.60%,
4.69% and 5.08%, respectively (December 31, 2014: 5.77% for Escobal), an inflation rate of 2.39%, 2.72%
and 2.72%, respectively (December 31, 2014: 3.42% for Escobal), an undiscounted amount to settle the
obligation of $8.3 million, $43.8 million and $53.4 million, respectively (December 31, 2014: $10.2 million
for Escobal), and the commencement of reclamation activities in 18 years, 6 years and 10 years,
respectively.
OUTSTANDING SHARE DATA
As at March 9, 2016, the Company had 227,442,434 issued and outstanding common shares, 4,027,704
issued and outstanding options and 353,000 issued and outstanding DSAs.
DIVIDENDS
The Company declared and paid dividends of $13.6 million and $49.7 million to shareholders during Q4
2015 and 2015, respectively, and declared and paid dividends of $9.1 million during January and
February 2016. This increase over prior year quarter and prior year dividend payments relates to the
additional shares outstanding as a result of the Rio Alto acquisition effective Q2 2015. At March 9, 2016,
the Company had not yet declared and made payable dividends to shareholders for March 2016.
CHANGES IN ACCOUNTING POLICIES AND STANDARDS
Application of new and revised accounting standards effective January 1, 2015
The Company has evaluated the new and revised IFRS standards and has determined that there is no
material impact on the financial statements upon adoption. Details of these accounting standards are
disclosed in note 4a) of the consolidated financial statements.
Future accounting standards and interpretations
A number of new IFRS standards, and amendments to standards and interpretations, are not yet
effective for 2015, and have not been applied in preparing the financial statements. The Company is
currently evaluating the impact the future accounting standards and interpretations may have on its
consolidated financial statements. Details of these future accounting standards and interpretations are
disclosed in note 4b) of the consolidated financial statements.
CRITICAL ACCOUNTING ESTIMATES
Critical accounting estimates used in the preparation of the consolidated financial statements include
the Company’s review of asset carrying values, the determination of impairment charges of long-lived
assets, determination of mineral resources and valuation of share-based payments and the
determination of amounts accrued for reclamation obligations. The estimates of non-cash
compensation expenses involve considerable judgment and are, or could be, affected by significant
factors that are out of the Company’s control. Actual results could differ from those estimates.
Estimates and underlying assumptions are reviewed on an ongoing basis. Revisions to accounting
estimates are recognized in the period in which the estimates are revised and in future periods affected.

Management’s Discussion and Analysis
For the Years Ended December 31, 2015 and 2014 (tabular amounts expressed in thousands of United States dollars, except where otherwise noted)
36
Judgments
Commercial Production
In order to declare commercial production, a mine must be able to operate at levels intended by
management. Prior to commercial production, costs incurred are capitalized as part of the cost of
placing the asset into service and proceeds from the sale of concentrates and doré are offset
against the costs capitalized. Subsequent to the declaration of commercial production, depletion
of the costs incurred begins. Management considers several criteria in determining when a mine is
operating at levels intended, and is therefore in commercial production.
Functional Currency
The functional currency for each of the Company’s subsidiaries is the currency of the primary
economic environment in which the entity operates. The Company has determined that for each
subsidiary, the functional currency is the United States dollar. When determining the functional
currency, certain judgments may be involved to assess the primary economic environment in which
the subsidiary operates. If there is a change in events or conditions which determined the primary
economic environment, the Company periodically reevaluates the functional currency for each of
its subsidiaries.
Economic recoverability and probability of future economic benefits of exploration, evaluation and
development costs.
The Company makes determinations whether the development and related costs incurred which
have been capitalized are economically recoverable. Management uses several criteria in its
assessments of economic recoverability and probability of future economic benefits including
geological and metallurgical information, economic assessments and existing permits for the life of
mine plan. The estimates contained within these criteria could change over time which could affect
the economic recoverability of capitalized costs.
Estimates
Revenue recognition
As is customary in the industry for concentrate sales, revenue on provisionally priced concentrate
sales is recognized based on relevant forward market prices. At each reporting period, provisionally
priced sales are marked to market based on the estimated forward price for the quotational period
stipulated in the contract. The adjustment to provisionally priced metal sold is recorded as an
adjustment to sales revenue.
Estimated material in the mineral reserves
The carrying amounts of the Company’s depletable mineral interests are depleted upon
commencement of commercial production based on the units of production method over the
estimated life of mine based on proven and probable reserves. Changes to estimates of material
and depletable costs including changes resulting from revisions to the Company’s mine plans can
result in a change to future depletion rates.
Where commercial production has commenced but proven and probable reserves have yet to be
established, the carrying amounts of the Company’s depletable mineral interests are depleted
based on the mineable portion of measured and indicated resources.
Determination of Useful Lives
Plant and equipment other than mineral interests are depreciated using the straight-line method
based on the specific asset’s useful life. Should the actual useful life of the plant or equipment vary

Management’s Discussion and Analysis
For the Years Ended December 31, 2015 and 2014 (tabular amounts expressed in thousands of United States dollars, except where otherwise noted)
37
from the initial estimation, future depreciation charges may change. Should the grouping of these
like assets change, depreciation charges may vary materially in the future.
Impairment charges
At the end of each reporting period, the Company assesses whether any indication of impairment
exists. Where an indicator of impairment exists, an impairment analysis is performed. The impairment
analysis requires the use of estimates and assumptions including among others, long-term
commodity prices, discount rates, length of mine life, future production levels, future operating
costs, future capital expenditures and tax positions taken. The estimates and assumptions are
subject to risk and uncertainty; hence, there is the possibility that changes in circumstances will alter
these projections, which may impact the recoverable amount of the individual assets or CGUs. In
such circumstances, some or all of the carrying value of the assets or CGUs may be further impaired
or the impairment charge reduced with the impact recorded in the consolidated statements of
operations and comprehensive (loss) income.
Reclamation provision and site closure costs
The Company’s accounting policy for the recognition of accrued site closure costs requires
significant estimates and assumptions such as the requirements of the relevant environmental, legal
and regulatory framework, the magnitude of possible disturbance and the timing, extent and costs
of required closure and rehabilitation activity. Changes to these estimates and assumptions may
result in future actual expenditures differing from the amounts currently provided for. The
decommissioning liability is periodically reviewed and updated prospectively based on the
available facts and circumstances.
Income taxes
The Company is periodically required to estimate the tax basis of assets and liabilities. Where
applicable tax laws and regulations are either unclear or subject to varying interpretations, it is
possible that changes in these estimates could occur that materially affect the amounts of deferred
income tax assets and liabilities recorded in the financial statements. Changes in deferred tax assets
and liabilities generally have a direct impact on earnings in the period of changes. Each period, the
Company evaluates the likelihood of whether some portion or all of each deferred tax asset will not
be realized. This evaluation is based on historic and future expected levels of taxable income, the
pattern and timing of reversals of taxable temporary timing differences that give rise to deferred tax
liabilities, and tax planning initiatives. Levels of future taxable income are affected by, among other
things, the market price for saleable metals, production costs, interest rates and foreign currency
exchange rates.
Valuation of inventory
All inventory is valued at the lower of average cost or net realizable value. Management is required
to make various estimates and assumptions to determine the value of stockpiled ore, concentrate
inventories, ore stacked on leach pads and ore in process. The estimates and assumptions include
surveyed quantities of stockpiled ore, in-process volumes, contained metal content, recoverable
metal content, costs to recover saleable metals, payable metal values once processed and the
corresponding metals prices. Changes in these estimates can result in changes to the carrying
amounts of inventories and mine operating costs of future periods.
Deferred stripping costs
In determining whether stripping costs incurred during the production phase of a mineral property
relate to reserves and resources that will be mined in a future period and therefore should be
capitalized, the Company makes estimates of the stripping activity over the life of the component
Management’s Discussion and Analysis
For the Years Ended December 31, 2015 and 2014 (tabular amounts expressed in thousands of United States dollars, except where otherwise noted)
38
of reserves and resources which have been made accessible. Changes in estimated strip ratios can
result in a change to the future capitalization of stripping costs incurred.
As at December 31, 2015 and December 31, 2014, the Company has no capitalized stripping costs
relating to production phase stripping.
Share-based compensation
The Company makes certain estimates and assumptions when calculating the fair value of share-
based compensation granted. The significant estimations and assumptions include expected
volatility, expected life, expected dividend yield and expected risk-free rate of return. Changes in
these assumptions may result in a material change to the expense recorded for the issuance of
share-based compensation.
Business combinations
The information necessary to measure the fair values as at the acquisition date of assets acquired
and liabilities assumed requires management to make certain judgments and estimates about
future events, including but not limited to:
i. Estimates of mineral reserves, mineral resources and exploration potential acquired;
ii. Future operating costs and capital expenditures;
iii. Discount rates to determine fair value of assets acquired; and
iv. Future metal prices and long-term foreign exchange rates.
Changes to the preliminary measurements of assets and liabilities acquired may be retrospectively
adjusted when new information is obtained until the final measurements are determined within one
year of the acquisition date.
Contingencies
Due to the size, complexity and nature of the Company’s operations, various legal and tax matters
arise in the ordinary course of business. The Company accrues for such items when a liability is both
probable and the amount can be reasonably estimated.
There are no matters at December 31, 2015 that are expected to have a material effect on the
consolidated financial statements of the Company.
DISCLOSURE CONTROLS AND PROCEDURES AND
INTERNAL CONTROLS OVER FINANCIAL REPORTING
DISCLOSURE CONTROLS AND PROCEDURES
The Company’s management, including the Executive Chair and Chief Executive Officer (“CEO”) and
the Vice-President and Chief Financial Officer (“CFO”), is responsible for the design of disclosure controls
and procedures and internal controls over financial reporting (“ICFR”). Having assessed the
effectiveness of the Company’s disclosure controls and procedures, the CEO and CFO believe that the
disclosure controls and procedures are effective at a reasonable assurance level as of the end of the
period covered by this report.
INTERNAL CONTROLS OVER FINANCIAL REPORTING
The Company’s management is responsible for establishing and maintaining an adequate system of
internal controls, including ICFR. To design and evaluate its ICFR, the Company used the Internal Control
Management’s Discussion and Analysis
For the Years Ended December 31, 2015 and 2014 (tabular amounts expressed in thousands of United States dollars, except where otherwise noted)
39
– Integrated Framework (2013) published by the Committee of Sponsoring Organizations of the
Treadway Commission (the “2013 COSO Framework”).
The Company’s ICFR include policies and procedures that: (1) pertain to the maintenance of records
and accurately and fairly reflect, in reasonable detail, the transactions related to acquisition,
maintenance and disposition of its assets; (2) provide reasonable assurance that transactions are
recorded as necessary to permit preparation of financial statements in accordance with IFRS, and
receipts are recorded and expenditures are incurred only in accordance with authorization of its
management and directors; and (3) provide reasonable assurance regarding prevention or timely
detection of unauthorized acquisition, use, or disposition of assets that could have a material effect on
its financial statements. Management has concluded that the Company’s ICFR were effective as of
December 31, 2015 and provide reasonable assurance that financial information is recorded,
processed, summarized and reported in a timely manner.
The Company has designed its internal risk management and control systems to provide reasonable
(but not absolute) assurance to ensure compliance with regulatory matters and to safeguard reliability
of the financial reporting and its disclosures.
In accordance with National Instrument 52-109, the design of internal control over financial reporting
excludes the controls, policies and procedures of Rio Alto on the basis that Rio Alto was acquired on
April 1, 2015 and therefore not more than 365 days before the end of the relevant period of December
31, 2015.
Other than the exclusion of Rio Alto described above, management assessed the effectiveness of the
Company’s internal control over financial reporting as of December 31, 2015, based on the criteria set
forth in Internal Control – Integrated Framework (2013) issued by the Committee of Sponsoring
Organizations of the Treadway Commission. Based on this assessment, management concludes that, as
of December 31, 2015, the Company’s internal control over financial reporting was effective.
CAUTIONARY NOTE REGARDING INTERNAL CONTROLS
The Company’s management, including the CEO and the CFO, believe that any disclosure controls
and procedures or internal controls and procedures, no matter how well conceived and operated, can
provide only reasonable, not absolute, assurance that the objectives of the control system are met.
Further, the design of a control system must reflect the fact that there are resource constraints, and the
benefits of controls must be considered relative to their costs. Because of the inherent limitations in all
control systems, they cannot provide absolute assurance that all control issues and instances of fraud, if
any, within the Company have been prevented or detected. These inherent limitations include the
realities that judgments in decision-making can be faulty, and that breakdowns can occur because of
simple error or mistake. Additionally, controls can be circumvented by the individual acts of some
persons, by collusion of two or more people, or by unauthorized override of the control. The design of
any system of control is based in part upon certain assumptions about the likelihood of future events,
and there can be no assurance that any design will succeed in achieving its stated goals under all
potential future conditions. Accordingly, because of the inherent limitations in a cost effective control
system, misstatements due to error or fraud may occur and may not be detected.
TECHNICAL INFORMATION
Charles Muerhoff, Vice President Technical Services and Qualified Person as defined in National
Instrument 43-101 has reviewed and approved the scientific and technical information contained in this
MD&A.

Management’s Discussion and Analysis
For the Years Ended December 31, 2015 and 2014 (tabular amounts expressed in thousands of United States dollars, except where otherwise noted)
40
CAUTIONARY STATEMENT ON FORWARD-LOOKING INFORMATION
This MD&A contains “forward-looking information” within the meaning of applicable Canadian
securities legislation, and “forward-looking statements” within the meaning of the United States Private
Securities Litigation Reform Act of 1995 (collectively referred to as “forward-looking statements”). All
statements, other than statements of historical fact, are forward-looking statements. The words "believe",
"expect", "anticipate", "contemplate", "target", "plan", "intend", "continue", "budget", "estimate", "may",
"will", "schedule" and similar expressions or statements identify forward-looking statements. Forward-
looking statements in this MD&A may include, but are not limited to, statements and/or information
related to: the Company’s liquidity position and sufficiency of cash from operations to fund repayment
of outstanding debt; the expected working capital requirements, the sufficiency of capital resources
and the possibility of considering alternative financing arrangements to meet strategic needs; the
timing for completion of the extensions to the leach pad and waste dump at the La Arena mine; the
expected timing for achieving commercial production at the Shahuindo gold project; the 2016
operations outlook and production guidance, including estimated unit costs per ounce of silver and
gold and estimated capital costs; assessment of future reclamation obligations; exploration and review
of prospective mineral acquisitions; changes in Guatemalan and Peruvian mining laws and regulations;
changes to the Peruvian tax dividend rate; the timing and results of court proceedings; the timing for
the final commissioning and start-up of the paste-backfill plant at the Escobal mine and the expected
annual cost reductions from its operation; and the completion of the business combination with Lake
Shore and the timing therefor.
Forward-looking statements are based on the reasonable assumptions, estimates, analysis and opinions
of management made in light of its experience and its perception of trends, current conditions and
expected developments, as well as other factors that management believes to be relevant and
reasonable in the circumstances at the date that such statements are made, but which may prove to
be incorrect. Management believes that the assumptions and expectations reflected in such forward-
looking statements are reasonable. Assumptions have been made regarding, among other things: the
Company’s ability to carry on exploration and development activities, including construction; the timely
receipt of required approvals, including the approvals required for the business combination with Lake
Shore; the price of silver, gold and other metals; the Company’s ability to operate in a safe, efficient
and effective manner; prices for key mining supplies, including labor costs and consumables, remaining
consistent with the Company’s current expectations; production meeting expectations and being
consistent with estimates; plant, equipment and processes operating as anticipated; there being no
material variations in the current tax and regulatory environment; the exchange rates among the
Canadian dollar, the Guatemalan quetzal, the Peruvian sol and the United States dollar remaining
consistent with current levels; the Company’s ability to obtain financing as and when required and on
reasonable terms; and the successful closing of the business combination with Lake Shore. Readers are
cautioned that the foregoing list is not exhaustive of all factors and assumptions which may have been
used.
Forward-looking statements are subject to known and unknown risks, uncertainties and other factors
that may cause actual results to be materially different from those expressed or implied by such
forward-looking statements. Such risks, uncertainties and other factors include but are not limited to: the
Company’s dependence on the Escobal and La Arena Mines; the fluctuation of the price of silver, gold
and other metals; changes in national and local government legislation, taxation and controls or
regulations; changes and national and local government politics and office holders; social unrest, and
political or economic instability in Guatemala and/or Peru; the availability of additional funding as and
when required; the speculative nature of mineral exploration and development; the timing and ability
to maintain and, where necessary, obtain necessary permits and licenses; the uncertainty in the
estimation of mineral resources and mineral reserves; the uncertainty in geologic, hydrological,
metallurgical and geotechnical studies and opinions; infrastructure risks, including access to water and
power; the impact of inflation; changes in the administration of governmental regulation, policies and
practices; environmental risks and hazards; insured and uninsured risks; land title risks; risks associated

Management’s Discussion and Analysis
For the Years Ended December 31, 2015 and 2014 (tabular amounts expressed in thousands of United States dollars, except where otherwise noted)
41
with illegal mining activities by unauthorized individuals on the Company’s mining or exploration
properties; risks associated with competition; risks associated with currency fluctuations; labor and
employment risks; dependence on key management personnel and executives; the timing and possible
outcome of pending or threatened litigation; the consequences of adverse judicial rulings; the risk of
unanticipated litigation; risks associated with the repatriation of earnings; risks associated with negative
operating cash flow; risks associated with the Company’s hedging policies; risks associated with dilution;
and risks associated with effecting service of process and enforcing judgments. See the Company’s
2015 Annual Information Form under the heading “Description of Our Business – Risk Factors Relating to
Our Business and – Risk Factors Relating to Our Shares” and the Company’s short-form prospectus dated
June 23, 2015 under the heading “Risk Factors”, each of which are “available on www.sedar.com.
Although management has attempted to identify important factors that could cause actual results to
differ materially from those contained in forward-looking statements, there may be other factors that
cause results not to be as anticipated, estimated or intended. There is no assurance that forward-
looking statements will prove to be accurate, as actual results and future events could differ materially
from those anticipated in such forward-looking statements. Accordingly, readers should not place
undue reliance on forward-looking statements. The Company does not undertake to update any
forward-looking statements, except as, and to the extent required by, applicable securities laws.
NOTICE TO READERS IN THE UNITED STATES
Canadian standards, including those under National Instrument 43-101 Standards of Disclosure for
Mineral Projects, differ significantly from the requirements of the Securities and Exchange Commission of
the United States (“SEC”), and mineral resource and mineral reserve information contained or
incorporated by reference in the MD&A may not be comparable to similar information disclosed by U.S.
companies. Under U.S. standards, mineralization may not be classified as a “reserve” unless the
determination has been made that the mineralization could be economically and legally produced or
extracted at the time the reserve determination is made. The SEC’s disclosure standards normally do not
permit the inclusion in documents filed with the SEC of information concerning “measured mineral
resources”, “indicated mineral resources” or “inferred mineral resources” or other descriptions of the
amount of mineralization in mineral deposits that do not constitute “reserves” by U.S. standards. U.S.
investors should also understand that “inferred mineral resources” have a great amount of uncertainty
as to their existence and as to their economic and legal feasibility. It cannot be assumed that all or any
part of an “inferred mineral resource” will ever be upgraded to a higher category. Under Canadian
rules, estimated “inferred mineral resources” may not form the basis of feasibility or pre-feasibility studies
except in rare cases. Investors are cautioned not to assume that all or any part of an “inferred mineral
resource” exists or is economically or legally mineable. Disclosure of “contained ounces” in a mineral
resource estimate is permitted disclosure under Canadian regulations; however, the SEC normally only
permits issuers to report mineralization that does not constitute “reserves” by SEC standards as in place
tonnage and grade without reference to unit measures. The requirements for identification of “reserves”
are also not the same as those of the SEC, and reserves reported by the Company may not qualify as
“reserves” under SEC standards. Accordingly, information concerning mineral deposits set forth herein
may not be comparable with information made public by companies that report in accordance with
U.S. standards.