Embed Size (px)
Citation preview

Results for Q1 Fiscal 2018Earnings Announcement: July 27, 2017
(Quarter Ending June 30, 2017)

1
Risks and Non-GAAP DisclosuresThis presentation contains forward-looking statements, which are based on current expectations and assumptions that are subject to risks and uncertainties and actual results could materially differ. Such information is subject to change and we undertake no obligation to update these forward-looking statements. For a discussion of the risks and uncertainties, see our most recent filings with the Securities and Exchange Commission, including our current, annual and quarterly reports.
Please refer to the appendix section of this presentation for current period reconciliation of the Non-GAAP financial measures to the most directly comparable GAAP measures.
If this presentation references historical non-GAAP financial measures, these measures are located on the “Investor Relations” section of our website, www.flex.com along with the required reconciliation to the most comparable GAAP financial measures.
The following business group acronyms will be used throughout this presentation:
Communications & Enterprise ComputeCloud Data Center, Communications, Networking, Server & Storage.
Consumer Technologies GroupConnected Living, Wearables, Gaming, AR/VR, Mobile Devices, Footwear and Clothing and Supply Chain Solutions for PCs, Tablets, and Printers.
Industrial & Emerging IndustriesSemiconductor & Capital Equipment, Office Solutions, Household Industrial & Lifestyle, Industrial Automation & Kiosks, Energy & Metering, Lighting.
HRS High Reliability SolutionsMedical: Consumer Health, Digital Health, Disposables, Drug Delivery, Diagnostics, Life Sciences & Imaging Equipment.
Automotive: Vehicle Electronics, Connectivity, Clean Technologies.
IEI CEC CTG

2
Q1 FY2018 Income Statement Summary($M, except per share amounts)
Prior Yr Current QtrJuly 01, 2016 June 30, 2017
Net sales $5,877 $6,008
Adjusted operating income 190 178
Adjusted net income 149 128
Adjusted EPS $0.27 $0.24
GAAP income before income taxes 117 146
GAAP net income 106 125
GAAP EPS $0.19 $0.23
» Net sales of $6.0B vs. guidance $5.7-$6.1B» Adjusted operating income of $178M vs. guidance $170-$200M » Adjusted EPS of $0.24 vs. guidance of $0.24-$0.28
Q1 FY2018 Results vs. Guidance

190 197223 205
178
3.2% 3.3% 3.6% 3.5%3.0%
Jun-16 Sep-16 Dec-16 Mar-17 Jun-17
Adj. Operating Margin
Revenue & Adjusted Gross Margin($M)
Adjusted Operating Income ($M)
5,8776,009 6,115
5,8636,008
6.9% 6.9% 7.1% 7.1% 6.8%
Jun-16 Sep-16 Dec-16 Mar-17 Jun-17
Adj. Gross Margin
3
Quarterly Financial Highlights
22%20% 20% 20% 19%
Jun-16 Sep-16 Dec-16 Mar-17 Jun-17
Return on Invested Capital1
(ROIC %)
$0.27 $0.28
$0.34
$0.29
$0.24
Jun-16 Sep-16 Dec-16 Mar-17 Jun-17
Adjusted Earnings Per Share (EPS)
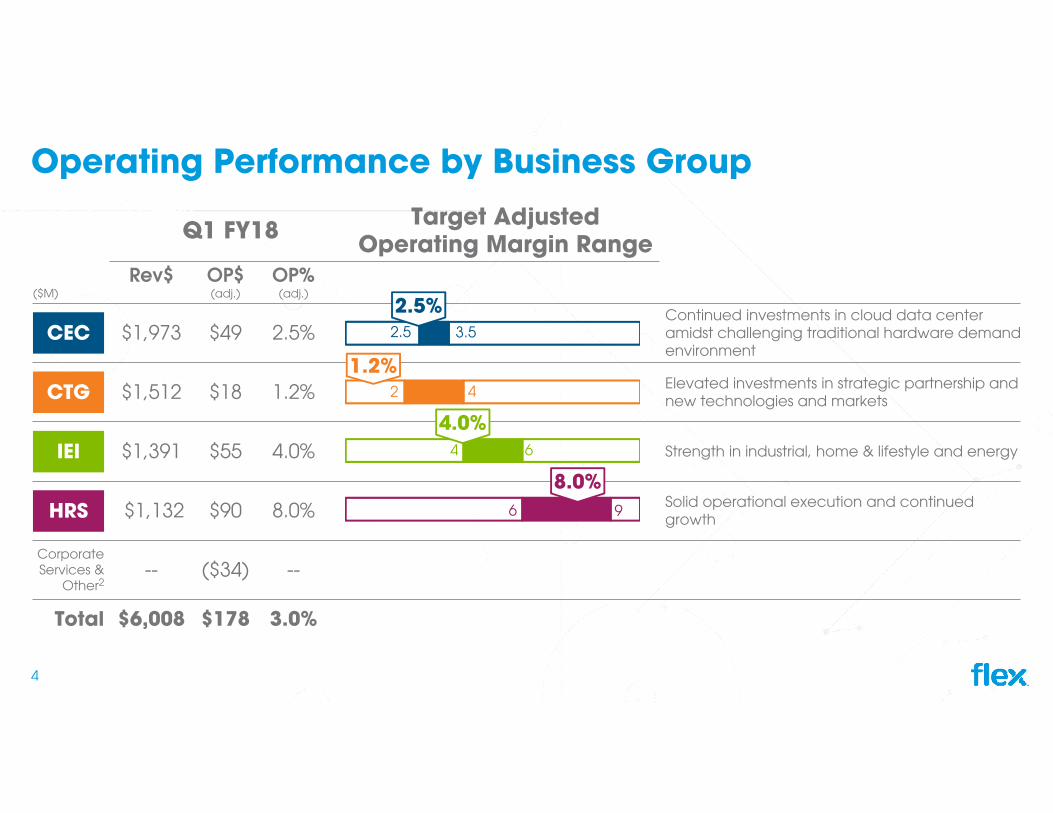
Q1 FY18 Target AdjustedOperating Margin Range
($M)Rev$ OP$
(adj.)OP%
(adj.)
$1,973 $49 2.5%Continued investments in cloud data center amidst challenging traditional hardware demandenvironment
$1,512 $18 1.2% Elevated investments in strategic partnership and new technologies and markets
$1,391 $55 4.0% Strength in industrial, home & lifestyle and energy
$1,132 $90 8.0% Solid operational execution and continued growth
Corporate Services &
Other2-- ($34) --
Total $6,008 $178 3.0%
6
4
2
2.5
9
6
4
3.5
Operating Performance by Business Group
1.2%
2.5%
4.0%
8.0%
4
CEC
CTG
IEI
HRS

5
Other Income Statement Comments
Interest & other expenses, net
Adjusted income tax rate
Reconciliation between GAAP and Adjusted EPS
» Q1 FY18 was $27M» FY18 quarterly outlook $30M - $35M
» Q1 FY18 was 14.9% » Long-term effective tax rate range remains 10% - 15%
» Q1 FY18 aggregate impact on EPS $0.01» Stock based compensation $22M or $0.04 in EPS» Net intangible amortization $18M or $0.03 in EPS» Offset by $36M net gain or $0.07 in EPS primarily from sale of
Wink

6
Strong Cash Flow Generation3-Months
Ended
($M)(Jun 30, 2017)
GAAP net income $125
Depreciation, amortization and other charges 131
Change in working capital and other (118)
Net cash provided by operating activities 138
Purchases of property & equipment, net (119)
Free Cash Flow 19
Payments for share repurchases (74)
Debt repayment, net (8)
Other investing and financing, net (185)
Net change in cash and cash equivalents ($248)
1,796 1,851
1,626 1,611 1,693
7.6% 7.7%6.6%
6.9% 7.0%
Jun-16 Sep-16 Dec-16 Mar-17 Jun-17
% Annualized RevenueNet Working Capital3
($M)

500 503 500
600
CY17 CY18 CY19 CY20 CY21 CY22 CY23 CY24 CY25
56113
700
Balanced Capital Structure
Investment Grade RatedMoody’s | S&P | Fitch
Significant Debt Maturities*($M) Balances as of June 30, 2017
~3.6%Low Avg.
Cost of Debt
$3.3BSolid Liquidity
($1.75B revolver + $1.6B cash)
2.4xStrong Debt/ Adj. EBITDA4
(LTM)
Term Loan
Notes
$2.3BCredit Facility Renewal
Maturity date in 2022($1.75B revolver + $503M loan)
7
*Does not reflect the contractual quarterly amortization payments due prior to maturity.
33%
23%19%
25% Q1 FY18 Revenue
42%
CTGCEC
IEIHRS
8
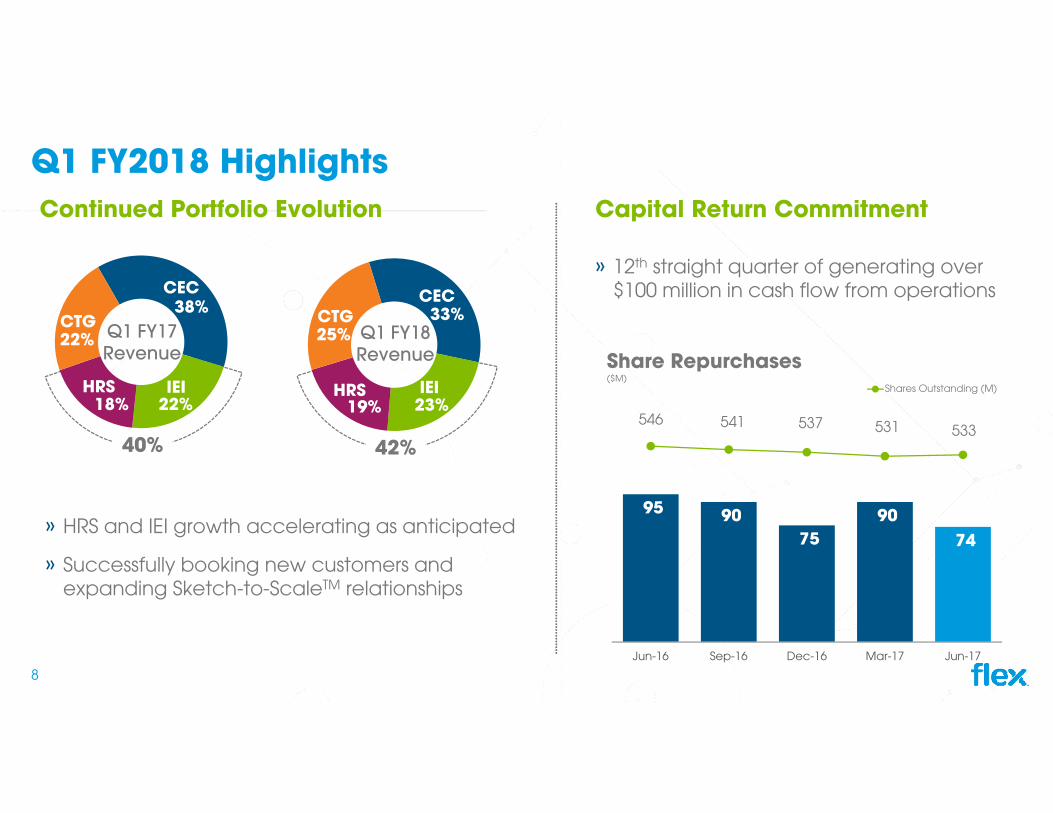
Q1 FY2018 Highlights
95 90 75
90 74
546 541 537 531 533
Jun-16 Sep-16 Dec-16 Mar-17 Jun-17
Shares Outstanding (M)
Share Repurchases($M)
Continued Portfolio Evolution Capital Return Commitment
38%
22%18%
22% Q1 FY17 Revenue
40%
CTG
CEC
IEIHRS
» HRS and IEI growth accelerating as anticipated
» Successfully booking new customers and expanding Sketch-to-ScaleTM relationships
» 12th straight quarter of generating over $100 million in cash flow from operations
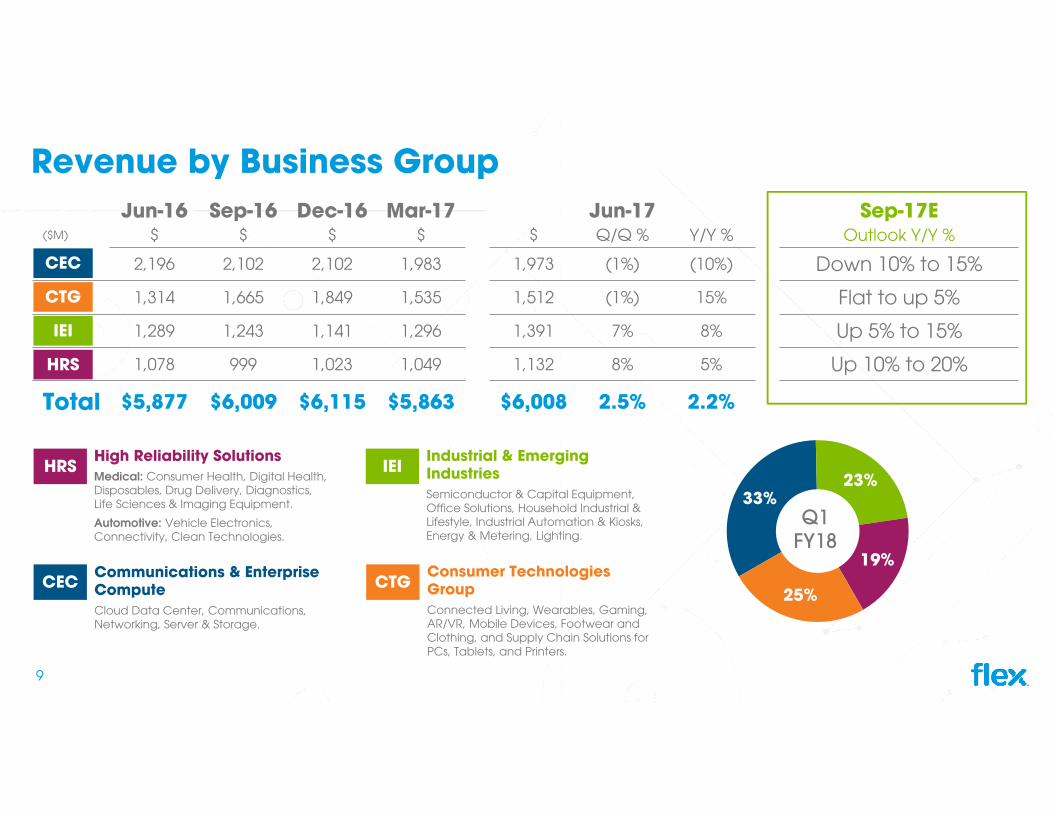
Industrial & Emerging IndustriesSemiconductor & Capital Equipment, Office Solutions, Household Industrial & Lifestyle, Industrial Automation & Kiosks, Energy & Metering, Lighting.
High Reliability SolutionsMedical: Consumer Health, Digital Health, Disposables, Drug Delivery, Diagnostics, Life Sciences & Imaging Equipment.
Automotive: Vehicle Electronics, Connectivity, Clean Technologies.
33%23%
19%
25%
9
Revenue by Business GroupJun-16 Sep-16 Dec-16 Mar-17 Jun-17 Sep-17E
($M) $ $ $ $ $ Q/Q % Y/Y % Outlook Y/Y %
2,196 2,102 2,102 1,983 1,973 (1%) (10%) Down 10% to 15%
1,314 1,665 1,849 1,535 1,512 (1%) 15% Flat to up 5%
1,289 1,243 1,141 1,296 1,391 7% 8% Up 5% to 15%
1,078 999 1,023 1,049 1,132 8% 5% Up 10% to 20%
Total $5,877 $6,009 $6,115 $5,863 $6,008 2.5% 2.2%
Q1 FY18
CEC
CTG
IEI
HRS
Communications & Enterprise ComputeCloud Data Center, Communications, Networking, Server & Storage.
Consumer Technologies GroupConnected Living, Wearables, Gaming, AR/VR, Mobile Devices, Footwear and Clothing, and Supply Chain Solutions for PCs, Tablets, and Printers.
HRS IEI
CEC CTG

10
Q2 FY2018 Guidance – September 2017
GAAP Income Before Income Taxes $100 - $130 million
GAAP Earnings Per Share $0.16 - $0.20
Other Information:Interest & Other Expense ~$30 - $35 million
Adjusted Income Tax Rate Low-end of 10% to 15% range
WASO 538 million shares
($M, except per share amounts)
$5,900 - $6,300Revenue
$170 - $200Adjusted Operating
Income
$0.24 - $0.28Adjusted Earnings
Per Share

11
For more information, go to investors.flex.com

12
Appendix: Reconciliation of GAAP to Non-GAAP MeasuresQuarter-ended
June 30, 2017($Thousands, except debt to EBITDA ratio) GAAP Adjustments Non-GAAP
Pretax income $145,509 $5,532 $151,041Depreciation 108,432 -- 108,432Amortization 19,901 (19,901) --Interest, net 24,790 6,870 31,660
EBITDA4 298,632 (7,499) 291,133EBITDA – rolling 4 qtrs. 1,009,128 1,245,975Total Debt $2,964,532 -- $2,964,532
Debt to EBITDA4 2.9x (0.6x) 2.4X
Quarter-endedJune 30, 2017
ROIC %1
GAAP 13.1%Non-GAAP Adjustments 6.0%
Non-GAAP 19.1%
Quarter-endedJune 30, 2017
($Thousands, except per share amounts)
GAAP gross profit $406,932Stock-based compensation expense 3,319
Non-GAAP gross profit $410,251
GAAP income before income taxes $145,509Stock-based compensation expense 21,796Intangible amortization 19,901Interests and other, net 26,876Other charges (income), net (36,165)
Non-GAAP operating income $177,917
GAAP provision for income taxes $20,799Intangible amortization benefits 1,766
Non-GAAP provision for income taxes $22,565
GAAP net income $124,710Stock-based compensation expense 21,796Intangible amortization 19,901Adjustments for taxes (1,766)Other Charges (income), net (36,165)
Non-GAAP net income $128,476
Diluted EPS GAAP EPS $0.23Non-GAAP EPS $0.24
For more details on the GAAP to Non-GAAP adjustments for current and historical periods, please refer to the Investor Relations section of our website which includes press releases and summary financials of the respective periods.

13
Appendix: Definitions1. Return on Invested Capital (ROIC) is calculated by dividing the Company's last twelve months after-tax Non-GAAP operating income by the net invested capital asset base as of each date. After-tax non-GAAP operating income excludes charges for stock-based compensation expense and certain other charges or income. The net invested capital asset base is defined as the sum of shareholders' equity plus total debt less cash and cash equivalents averaged over the last five quarters. We believe ROIC is a useful measure in providing investors with information regarding our performance. ROIC is a widely accepted measure of earnings efficiency in relation to total capital employed. We believe that increasing the return on total capital employed, as measured by ROIC, is an effective method to sustain and increase shareholder value. ROIC is not a measure of financial performance under generally accepted accounting principles in the U.S., and may not be defined and calculated by other companies in the same manner. ROIC should not be considered in isolation or as an alternative to net income or loss as an indicator of performance.
2. Corporate services and other: corporate service costs that are not included in the assessment of the performance of each of the identified business groups.
3. Net Working Capital is calculated as accounts receivable (AR), net adding back the reduction in AR resulting from the non-cash AR sales plus inventories less accounts payable.
4. Earnings before Interest, Taxes, Depreciation and Amortization (EBITDA) and Debt/EBITDA are non-GAAP financial measures. EBITDA is derived by adjusting for net interest and adding back depreciation to non-GAAP pretax income. Quarterly Debt to EBITDA is calculated by dividing the Company's total debt as of the date presented by LTM EBITDA. Non-GAAP pretax income excludes certain amounts that are included in the most directly comparable measures under GAAP including stock-based compensation expense, intangible amortization and certain other charges. Additionally, non-GAAP interest includes the loss on the sale of accounts receivable under our global AR securitization and factoring programs.