Embed Size (px)
Citation preview
1 NYSE: GSSTSX: GSC
Expanding Production and Reducing Costs
2 NYSE: GSSTSX: GSC
Disclaimer
SAFE HARBOUR: Some statements contained in this presentation are forward-looking statements or forward-looking information (collectively, “forward-looking statements”)within the meaning of the United States Private Securities Litigation Reform Act of 1995 and applicable Canadian securities laws. Investors are cautioned that forward-lookingstatements are inherently uncertain and involve risks and uncertainties that could cause actual results to differ materially. Such statements include comments regarding:production, cash operating cost, all-in sustaining cost and capital expenditure guidance for 2017; the potential expansion of production at Wassa Underground; the timing for therelease of further drilling results from Wassa Underground; the targeted 2017 mining rate at Wassa Underground; the updated short term mine plan at Wassa Underground,including increased mineable tonnages and ounces of gold produced, additional ore delivered between 695 and 720 Level and efficiencies from less waste development; the abilityto conduct additional drilling at Wassa Underground and the timing for completion thereof; the impact on grade as mining operations move further into B Shoot; the potential toadd additional ounces to the short term mine plan at Prestea Underground and increase the production rate; the ability to increase Prestea Underground’s annual production rateand extend its life of mine; the ability to increase drill production and exploration at Prestea Underground during 2017 and 2018; the potential drilling targets in 2017; the impactof Wassa Underground and Prestea Underground on the Company’s production profile, cost profile, cash operating cost per ounce and AISC per ounce; the timing for commercialproduction at Prestea Underground; the ability to mine via longitudinal stoping and transverse stoping at B Shoot at Wassa Underground and the timing and impact thereof; theachievement of 2017 production; the timing for blasting of the first stope at Prestea Underground; the extension of production at the Prestea Open Pits until the end of 2017; theability to expand Mineral Reserves and Mineral Resources and extend the life of mine at Prestea Underground and Wassa Underground through exploration; and the timing forincurring 2017 capital expenditures. Factors that could cause actual results to differ materially include timing of and unexpected events at the Prestea and/or the Wassaprocessing plants; variations in ore grade, tonnes mined, crushed or milled; delay or failure to receive board or government approvals and permits; construction delays; theavailability and cost of electrical power; timing and availability of external financing on acceptable terms or at all; technical, permitting, mining or processing issues, includingdifficulties in establishing the infrastructure for Wassa Underground or Prestea Underground, inconsistent power supplies, plant and/or equipment failures and an inability toobtain supplies and materials on reasonable terms (including pricing) or at all; changes in U.S. and Canadian securities markets; heavy rainfall and flooding of undergroundmines; and fluctuations in gold price and input costs and general economic conditions. There can be no assurance that future developments affecting the Company will be thoseanticipated by management. Please refer to the discussion of these and other factors in our Annual Information Form for the year ended December 31, 2016 filed on SEDAR atwww.sedar.com. The forecasts contained in this presentation constitute management's current estimates, as of the date of this presentation, with respect to the matters coveredthereby. We expect that these estimates will change as new information is received and that actual results will vary from these estimates, possibly by material amounts. Whilewe may elect to update these estimates at any time, we do not undertake to update any estimate at any particular time or in response to any particular event. Investors andothers should not assume that any forecasts in this presentation represent management's estimate as of any date other than the date of this presentation.
NON-GAAP FINANCIAL MEASURES: In this presentation, we use the terms “cash operating cost per ounce”, “All-In Sustaining Cost per ounce”, “AISC per ounce”, “AdjustedNet Income”, “Adjusted Net Income/Share”, “Cash operating margin per ounce” and “Cash Flow from operations before working capital changes”. These terms should beconsidered as Non-GAAP Financial Measures as defined in applicable Canadian and United States securities laws and should not be considered in isolation or as a substitute formeasures of performance prepared in accordance with International Financial Reporting Standards (“IFRS”). “Cash operating cost per ounce” for a period is equal to the cost ofsales excluding depreciation and amortization for the period less royalties, the cash component of metals inventory net realizable value adjustments and severance chargesdivided by the number of ounces of gold sold (excluding pre-commercial production ounces) during the period. “All-In Sustaining Costs per ounce” commences with cashoperating costs and then adds sustaining capital expenditures, corporate general and administrative costs, mine site exploratory drilling and greenfield evaluation costs andenvironmental rehabilitation costs, divided by the number of ounces of gold sold (excluding pre-commercial production ounces) during the period. This measure seeks torepresent the total costs of producing gold from operations. These measures are not representative of all cash expenditures as they do not include income tax payments orinterest costs. In order to indicate to stakeholders the Company's earnings excluding the non-cash (gain)/loss on the fair value of debentures, non-cash impairment charges andseverance charges, the Company calculates “Adjusted Net Income” and “Adjusted Net Income per share” to supplement the condensed interim consolidated financial statements.“Cash operating margin per ounce” is calculated as gold price minus cash operating cost per ounce. “Cash flow from operations before working capital changes” is calculated bysubtracting the "Changes in working capital" from "Net cash provided by operating activities" as found in the statements of cash flows. These measures are not necessarilyindicative of operating profit or cash flow from operations as would be determined under IFRS. Changes in numerous factors including, but not limited to, mining rates, millingrates, gold grade, gold recovery, and the costs of labor, consumables and mine site general and administrative activities can cause these measures to increase or decrease. Webelieve that these measures are the same or similar to the measures of other gold mining companies, but may not be comparable to similarly titled measures in every instance.Please see our “Management’s Discussion and Analysis of Financial Condition and Results of Operations for the three and six months ended June 30, 2017” for a reconciliation ofthese Non-GAAP measures to the nearest IFRS measure.
INFORMATION: The information contained in this presentation has been obtained by Golden Star from its own records and from other sources deemed reliable, however norepresentation or warranty is made as to its accuracy or completeness. The technical information relating to Golden Star's material properties disclosed herein is based upontechnical reports prepared and filed pursuant to National Instrument 43-101 - Standards of Disclosure for Mineral Projects ("NI 43-101") and other publicly available informationregarding the Company, including the following: (i) “NI 43-101 Technical Report on a Feasibility Study of the Wassa Open Pit Mine and Underground Project in Ghana” effectiveDecember 31, 2014; (ii) “NI 43-101 Technical Report on Resources and Reserves, Golden Star Resources Ltd., Bogoso Prestea Gold Mine, Ghana” effective December 31, 2013,and (iii) “NI 43-101 Technical Report on a Feasibility Study of the Prestea Underground gold project in Ghana” effective November 3, 2015. Additional information is included inGolden Star's Annual Information Form for the year ended December 31, 2016 which is filed on SEDAR. Mineral Reserves were prepared under the supervision of Dr. MartinRaffield, Senior Vice President Technical Services for the Company. Dr. Raffield is a "Qualified Person" as defined by NI 43-101. The Qualified Person reviewing and validating theestimation of the Mineral Resources is S. Mitchel Wasel, Golden Star Resources Vice President of Exploration.
CURRENCY: All monetary amounts refer to United States dollars unless otherwise indicated.
3 NYSE: GSSTSX: GSC
Golden Star: Snapshot
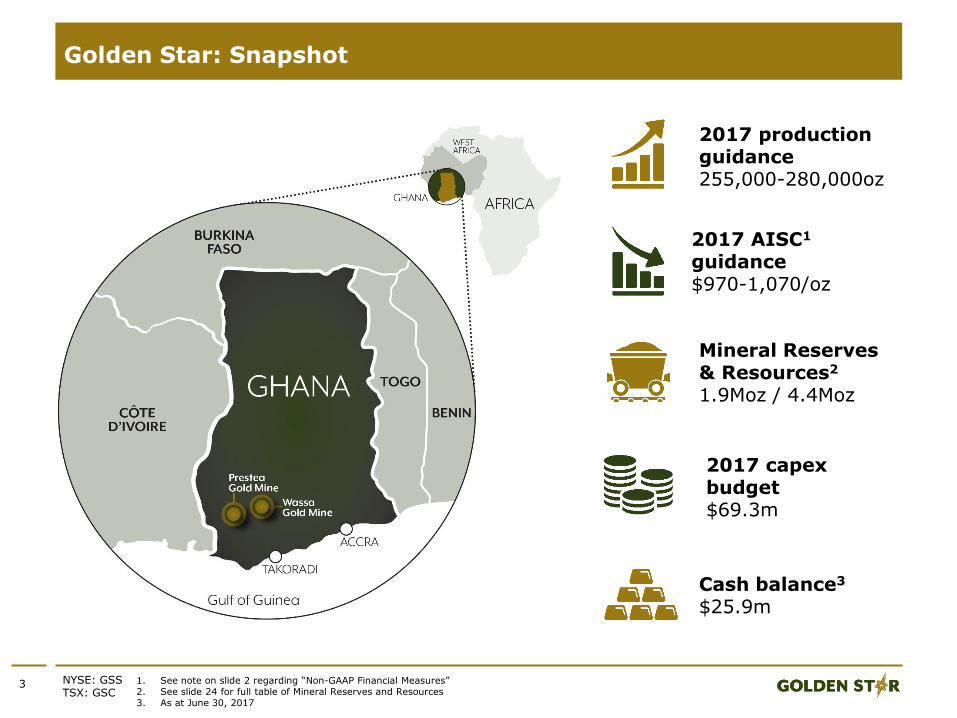
2017 AISC1
guidance$970-1,070/oz
2017 capex budget$69.3m
2017 production guidance255,000-280,000oz
Cash balance3
$25.9m
Mineral Reserves & Resources2
1.9Moz / 4.4Moz
1. See note on slide 2 regarding “Non-GAAP Financial Measures”2. See slide 24 for full table of Mineral Reserves and Resources3. As at June 30, 2017

4 NYSE: GSSTSX: GSC
Experienced Management and Technical Leadership
André van Niekerk, EVP & ChiefFinancial Officer• Joined GSR in 2006 - 5 years in
Ghana as GSR’s Head of Finance andBusiness Operations
• Previously VP, Financial Controller• Trained at KPMG
Sam Coetzer, President & CEO
• Mining engineer with over 28 years’experience with Kinross, XstrataNickel, Xstrata Coal and Placer Dome
• Previously SVP South AmericanOperations for Kinross
Daniel Owiredu, EVP & ChiefOperating Officer• 20 years’ experience in West African
mining, based in Ghana• Previously Deputy COO for AngloGold
- managed construction andoperation of the Bibiani, Siguiri andObuasi mines
Martin Raffield, SVP, ProjectDevelopment & Technical Services• Ph.D. geotechnical engineering & P.
Engineering• Previously worked for SRK, Placer
Dome and Breakwater Resources• Based at Prestea mine in Ghana
Mitch Wasel, VP Exploration• Joined GSR in 1993• Based in Ghana for GSR for past 17
years• Previously spent 10 years in gold &
base metal exploration in northwestern Canada
5 NYSE: GSSTSX: GSC
Q2 2017: Operational Snapshot
Multiple ore sources deliver significant reduction in risk profile
0
10,000
20,000
30,000
40,000
50,000
60,000
70,000
Q2 16 Q3 16 Q4 16 Q1 17 Q2 17
Ounces
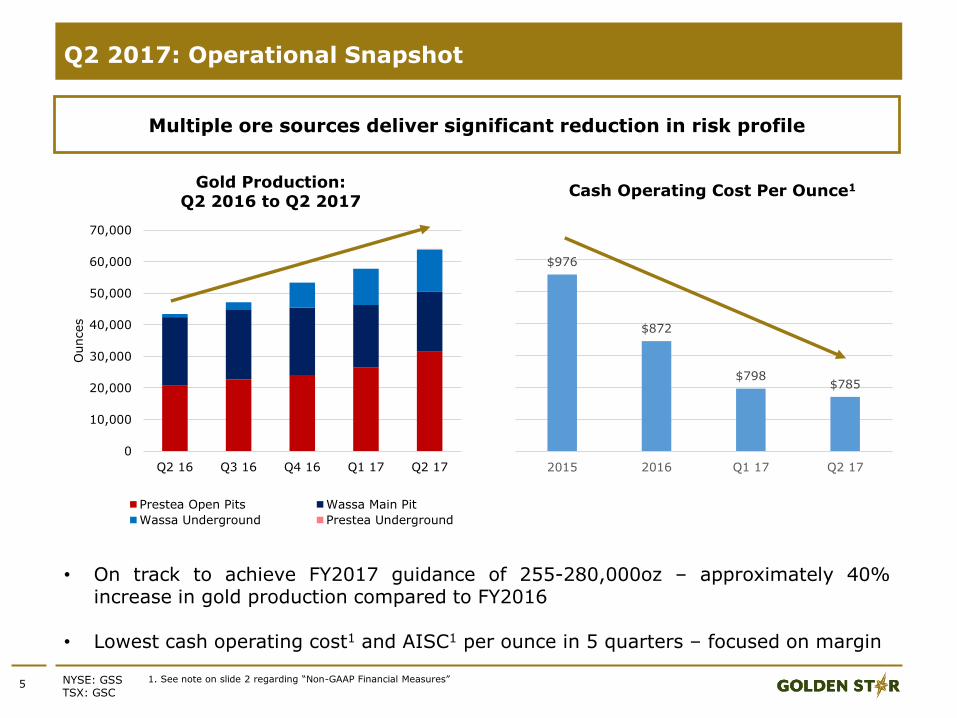
Gold Production: Q2 2016 to Q2 2017
Prestea Open Pits Wassa Main Pit
Wassa Underground Prestea Underground
$976
$872
$798 $785
2015 2016 Q1 17 Q2 17
Cash Operating Cost Per Ounce1
• On track to achieve FY2017 guidance of 255-280,000oz – approximately 40%increase in gold production compared to FY2016
• Lowest cash operating cost1 and AISC1 per ounce in 5 quarters – focused on margin
1. See note on slide 2 regarding “Non-GAAP Financial Measures”
6 NYSE: GSSTSX: GSC
Q2 2017: Financial Snapshot
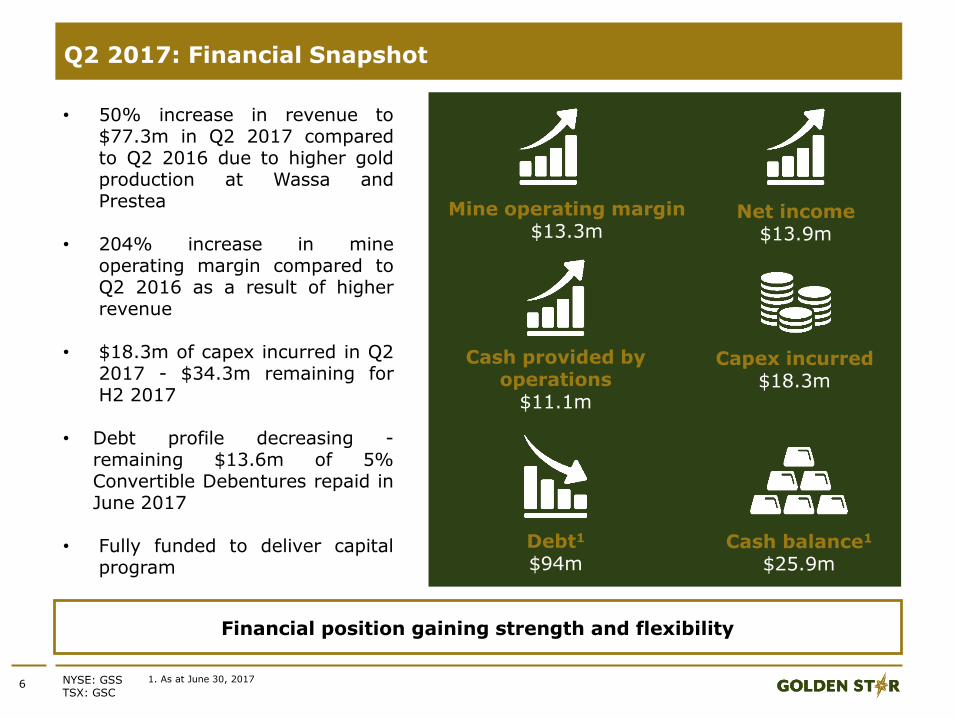
• 50% increase in revenue to$77.3m in Q2 2017 comparedto Q2 2016 due to higher goldproduction at Wassa andPrestea
• 204% increase in mineoperating margin compared toQ2 2016 as a result of higherrevenue
• $18.3m of capex incurred in Q22017 - $34.3m remaining forH2 2017
• Debt profile decreasing -remaining $13.6m of 5%Convertible Debentures repaid inJune 2017
• Fully funded to deliver capitalprogram
1. As at June 30, 2017
Financial position gaining strength and flexibility
Cash balance1
$25.9m
Cash provided by operations
$11.1m
Debt1
$94m
Net income$13.9m
Capex incurred$18.3m
Mine operating margin$13.3m
7 NYSE: GSSTSX: GSC
7
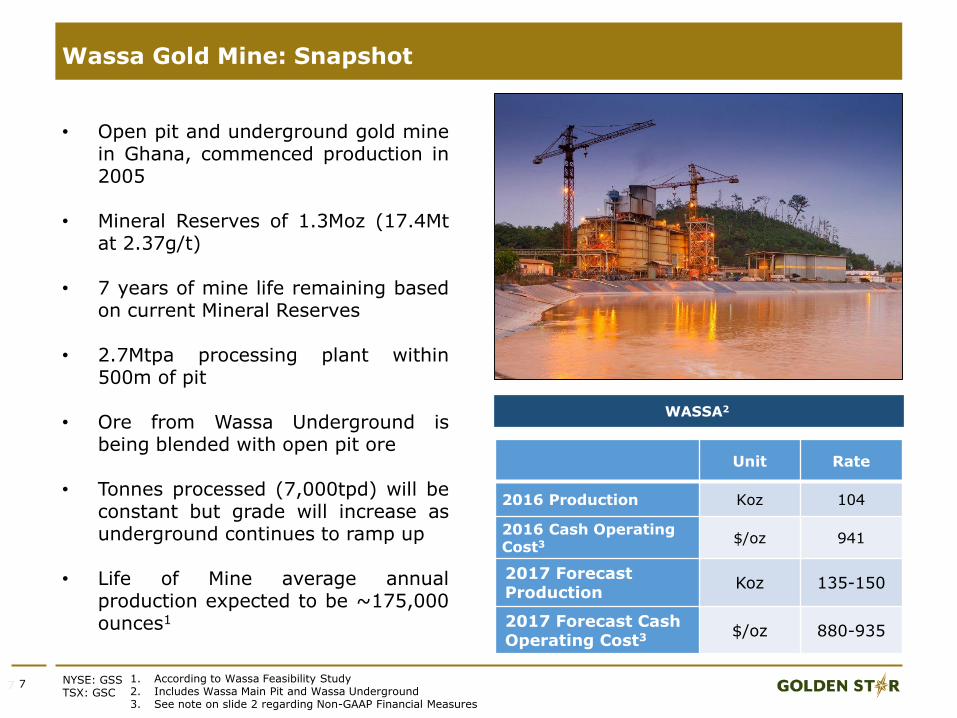
• Open pit and underground gold minein Ghana, commenced production in2005
• Mineral Reserves of 1.3Moz (17.4Mtat 2.37g/t)
• 7 years of mine life remaining basedon current Mineral Reserves
• 2.7Mtpa processing plant within500m of pit
• Ore from Wassa Underground isbeing blended with open pit ore
• Tonnes processed (7,000tpd) will beconstant but grade will increase asunderground continues to ramp up
• Life of Mine average annualproduction expected to be ~175,000ounces1
1. According to Wassa Feasibility Study2. Includes Wassa Main Pit and Wassa Underground3. See note on slide 2 regarding Non-GAAP Financial Measures
Wassa Gold Mine: Snapshot
Unit Rate
2016 Production Koz 104
2016 Cash Operating Cost3 $/oz 941
2017 Forecast Production
Koz 135-150
2017 Forecast Cash Operating Cost3 $/oz 880-935
WASSA2
8 NYSE: GSSTSX: GSC
Wassa Underground Extended Through Step Out Drilling
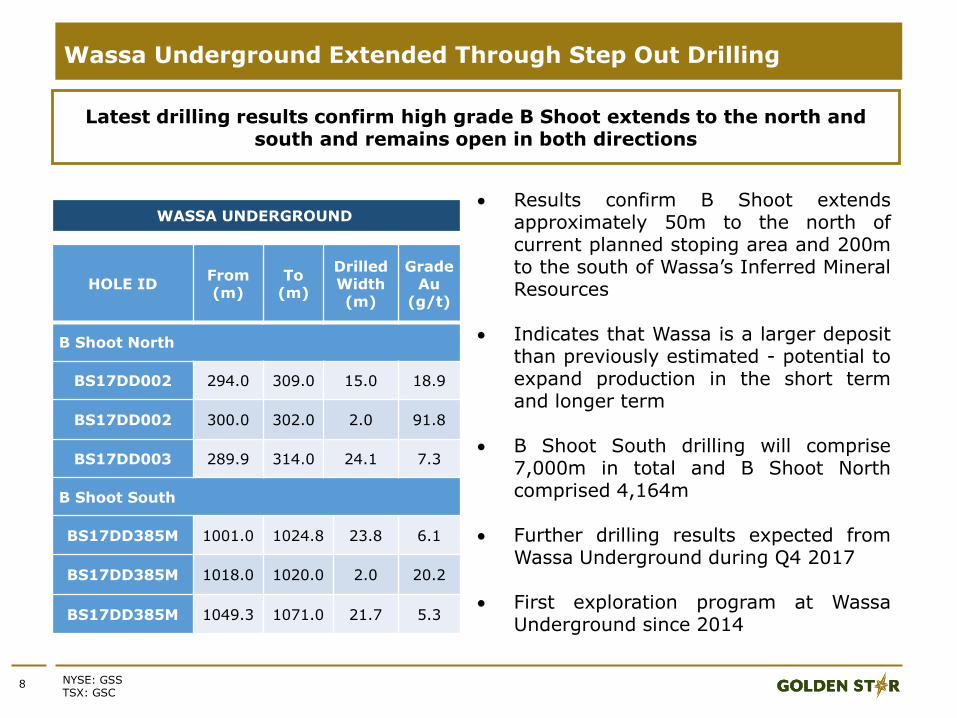
HOLE IDFrom (m)
To (m)
DrilledWidth (m)
Grade Au
(g/t)
B Shoot North
BS17DD002 294.0 309.0 15.0 18.9
BS17DD002 300.0 302.0 2.0 91.8
BS17DD003 289.9 314.0 24.1 7.3
B Shoot South
BS17DD385M 1001.0 1024.8 23.8 6.1
BS17DD385M 1018.0 1020.0 2.0 20.2
BS17DD385M 1049.3 1071.0 21.7 5.3
WASSA UNDERGROUND
Latest drilling results confirm high grade B Shoot extends to the north and south and remains open in both directions
Results confirm B Shoot extendsapproximately 50m to the north ofcurrent planned stoping area and 200mto the south of Wassa’s Inferred MineralResources
Indicates that Wassa is a larger depositthan previously estimated - potential toexpand production in the short termand longer term
B Shoot South drilling will comprise7,000m in total and B Shoot Northcomprised 4,164m
Further drilling results expected fromWassa Underground during Q4 2017
First exploration program at WassaUnderground since 2014
9 NYSE: GSSTSX: GSC
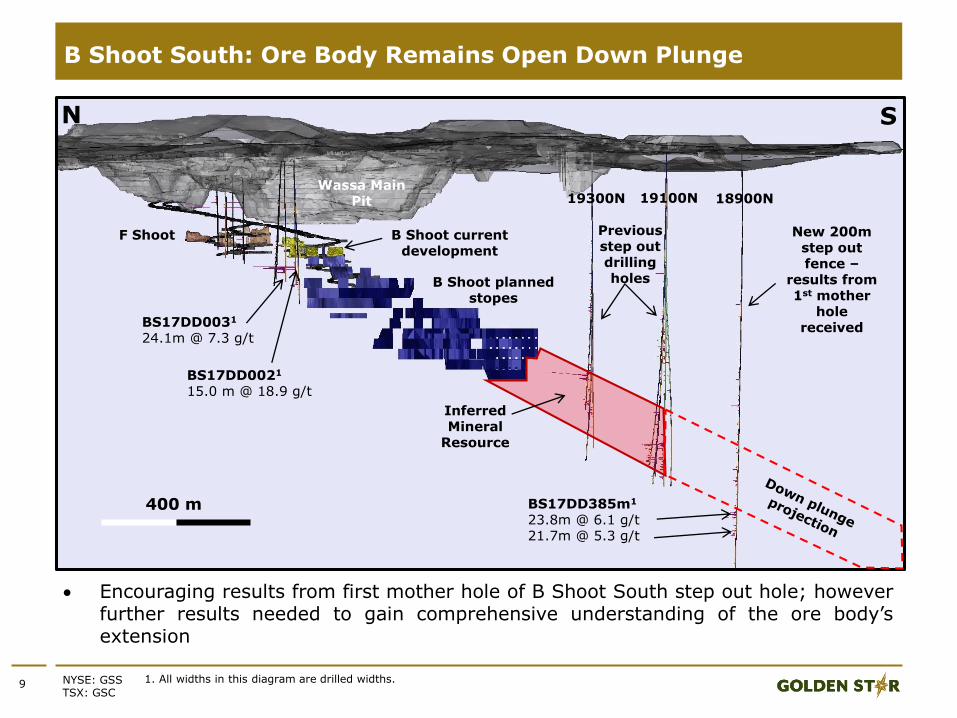
B Shoot South: Ore Body Remains Open Down Plunge
SN
BS17DD385m1
23.8m @ 6.1 g/t21.7m @ 5.3 g/t
18900N19100N19300N
New 200m step out fence –
results from 1st mother
hole received
B Shoot planned stopes
B Shoot current development
Wassa Main Pit
Previous step out drilling holes
Inferred Mineral
Resource
BS17DD0021
15.0 m @ 18.9 g/t
BS17DD0031
24.1m @ 7.3 g/t
400 m
F Shoot
Encouraging results from first mother hole of B Shoot South step out hole; howeverfurther results needed to gain comprehensive understanding of the ore body’sextension
1. All widths in this diagram are drilled widths.
10 NYSE: GSSTSX: GSC
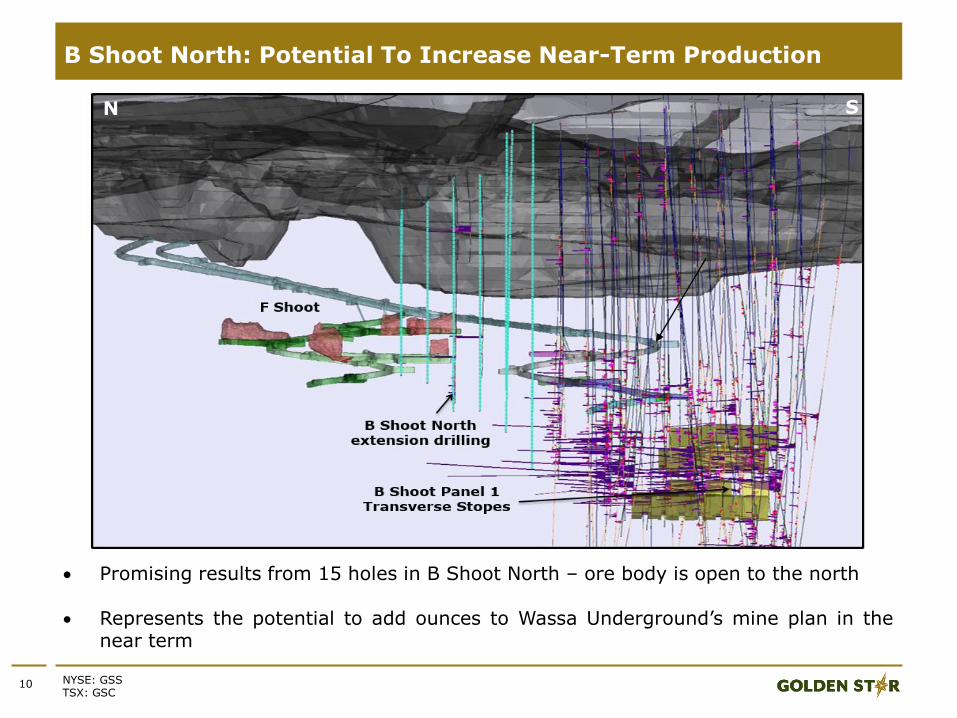
B Shoot North: Potential To Increase Near-Term Production
N S
Promising results from 15 holes in B Shoot North – ore body is open to the north
Represents the potential to add ounces to Wassa Underground’s mine plan in thenear term
11 NYSE: GSSTSX: GSC
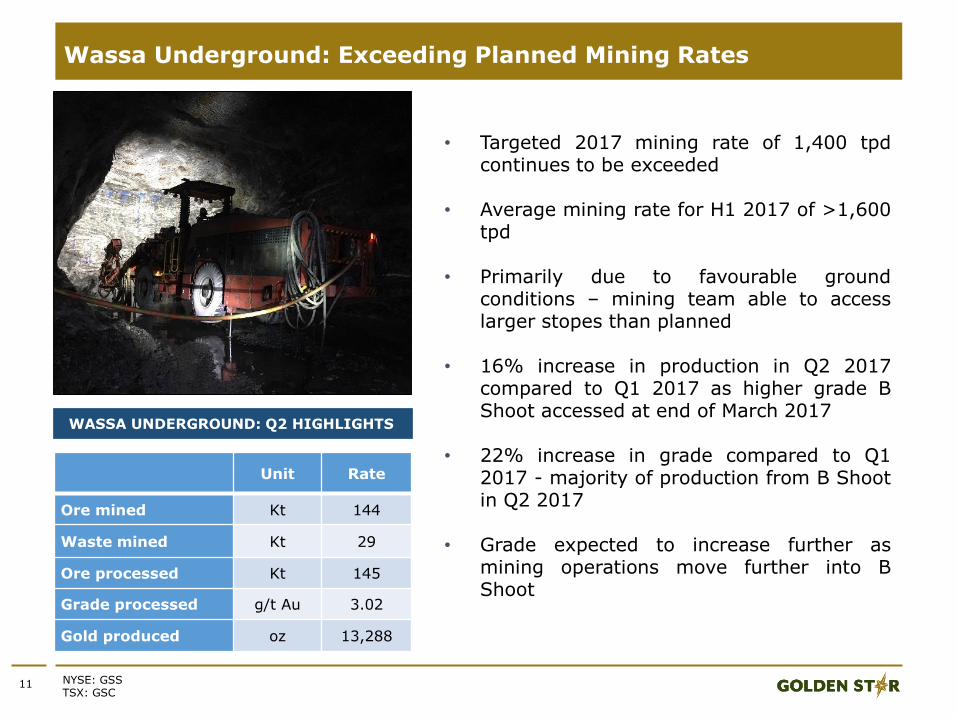
Wassa Underground: Exceeding Planned Mining Rates
• Targeted 2017 mining rate of 1,400 tpdcontinues to be exceeded
• Average mining rate for H1 2017 of >1,600tpd
• Primarily due to favourable groundconditions – mining team able to accesslarger stopes than planned
• 16% increase in production in Q2 2017compared to Q1 2017 as higher grade BShoot accessed at end of March 2017
• 22% increase in grade compared to Q12017 - majority of production from B Shootin Q2 2017
• Grade expected to increase further asmining operations move further into BShoot
Unit Rate
Ore mined Kt 144
Waste mined Kt 29
Ore processed Kt 145
Grade processed g/t Au 3.02
Gold produced oz 13,288
WASSA UNDERGROUND: Q2 HIGHLIGHTS
12 NYSE: GSSTSX: GSC
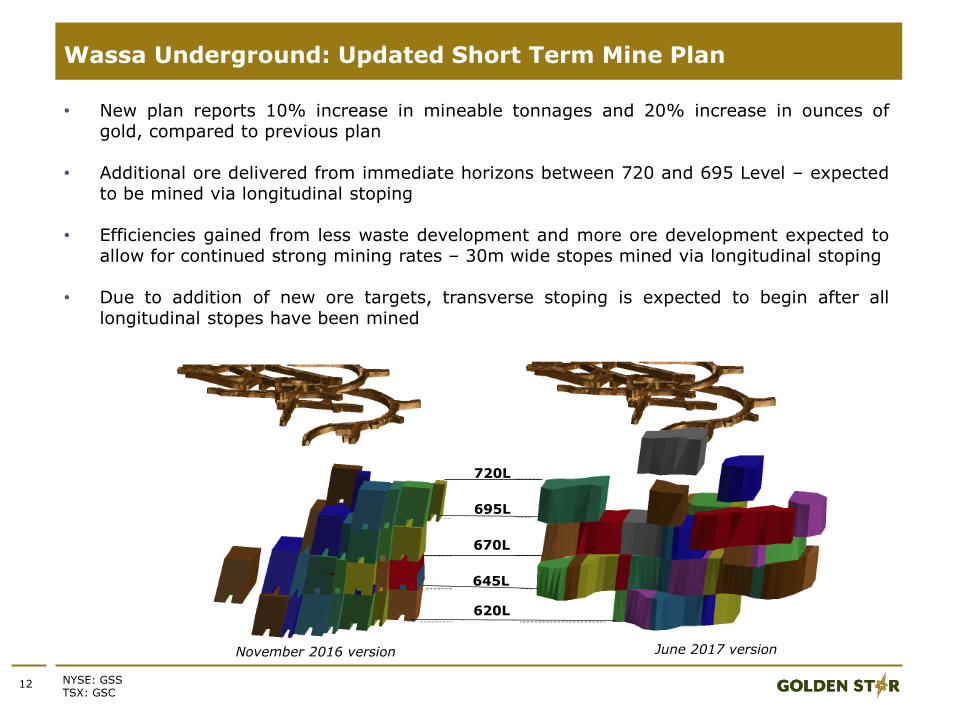
Wassa Underground: Updated Short Term Mine Plan
• New plan reports 10% increase in mineable tonnages and 20% increase in ounces ofgold, compared to previous plan
• Additional ore delivered from immediate horizons between 720 and 695 Level – expectedto be mined via longitudinal stoping
• Efficiencies gained from less waste development and more ore development expected toallow for continued strong mining rates – 30m wide stopes mined via longitudinal stoping
• Due to addition of new ore targets, transverse stoping is expected to begin after alllongitudinal stopes have been mined
November 2016 version June 2017 version
720L
695L
670L
645L
620L
13 NYSE: GSSTSX: GSC
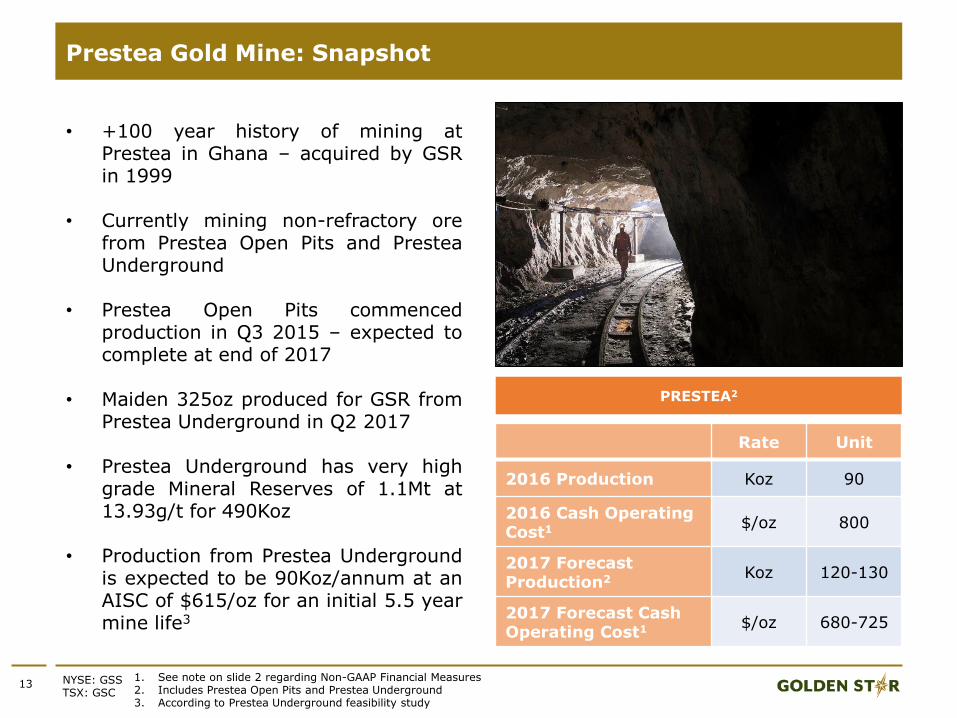
• +100 year history of mining atPrestea in Ghana – acquired by GSRin 1999
• Currently mining non-refractory orefrom Prestea Open Pits and PresteaUnderground
• Prestea Open Pits commencedproduction in Q3 2015 – expected tocomplete at end of 2017
• Maiden 325oz produced for GSR fromPrestea Underground in Q2 2017
• Prestea Underground has very highgrade Mineral Reserves of 1.1Mt at13.93g/t for 490Koz
• Production from Prestea Undergroundis expected to be 90Koz/annum at anAISC of $615/oz for an initial 5.5 yearmine life3
1. See note on slide 2 regarding Non-GAAP Financial Measures2. Includes Prestea Open Pits and Prestea Underground3. According to Prestea Underground feasibility study
Prestea Gold Mine: Snapshot
Rate Unit
2016 Production Koz 90
2016 Cash Operating Cost1 $/oz 800
2017 Forecast Production2 Koz 120-130
2017 Forecast Cash Operating Cost1 $/oz 680-725
PRESTEA2
14 NYSE: GSSTSX: GSC
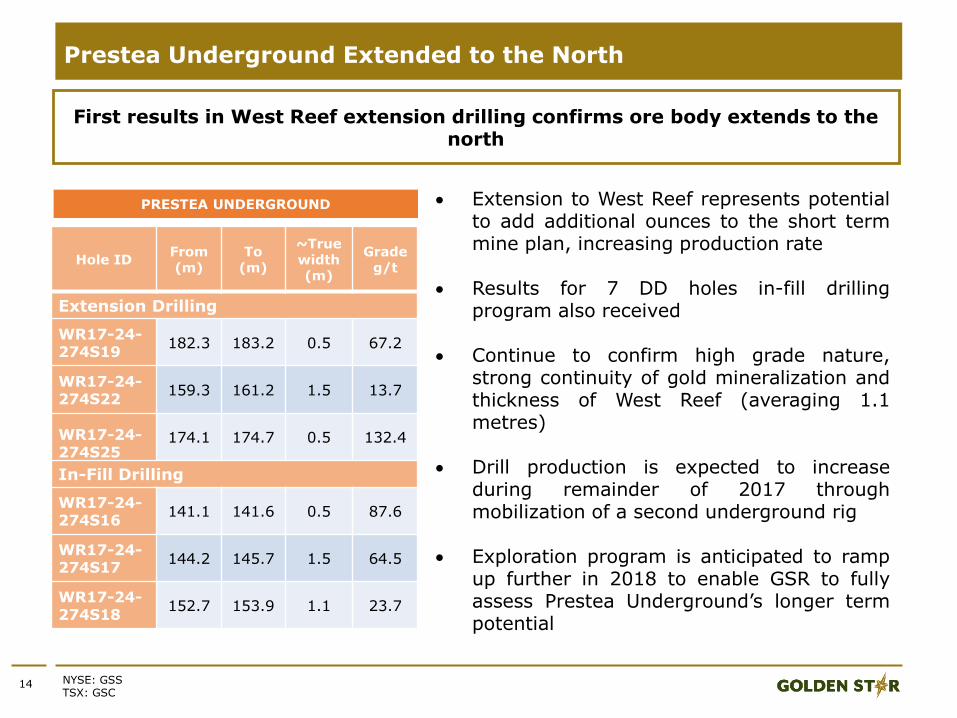
Prestea Underground Extended to the North
PRESTEA UNDERGROUND Extension to West Reef represents potentialto add additional ounces to the short termmine plan, increasing production rate
Results for 7 DD holes in-fill drillingprogram also received
Continue to confirm high grade nature,strong continuity of gold mineralization andthickness of West Reef (averaging 1.1metres)
Drill production is expected to increaseduring remainder of 2017 throughmobilization of a second underground rig
Exploration program is anticipated to rampup further in 2018 to enable GSR to fullyassess Prestea Underground’s longer termpotential
First results in West Reef extension drilling confirms ore body extends to the north
Hole IDFrom (m)
To (m)
~Truewidth(m)
Grade g/t
Extension Drilling
WR17-24-274S19
182.3 183.2 0.5 67.2
WR17-24-274S22
159.3 161.2 1.5 13.7
WR17-24-274S25
174.1 174.7 0.5 132.4
In-Fill Drilling
WR17-24-274S16
141.1 141.6 0.5 87.6
WR17-24-274S17
144.2 145.7 1.5 64.5
WR17-24-274S18
152.7 153.9 1.1 23.7
15 NYSE: GSSTSX: GSC
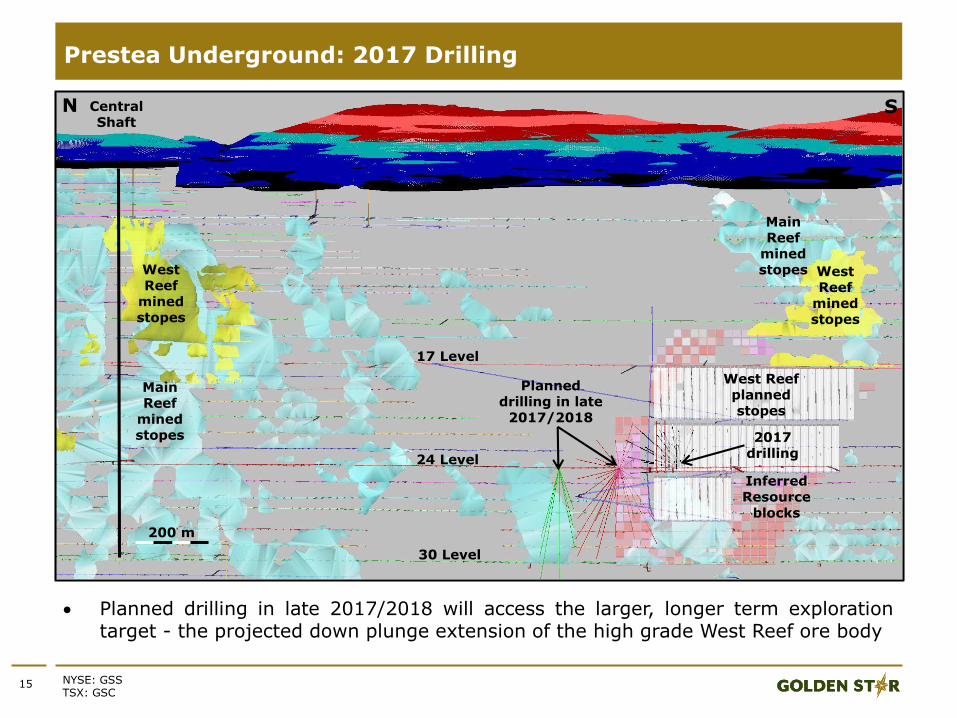
Prestea Underground: 2017 Drilling
17 Level
N S
24 Level
30 Level
West Reef planned stopes
West Reef
mined stopes
West Reef
mined stopes
Main Reef
mined stopes
Main Reef
mined stopes
Central Shaft
2017 drilling
Planned drilling in late
2017/2018
Inferred Resource
blocks
200 m
Planned drilling in late 2017/2018 will access the larger, longer term explorationtarget - the projected down plunge extension of the high grade West Reef ore body
16 NYSE: GSSTSX: GSC
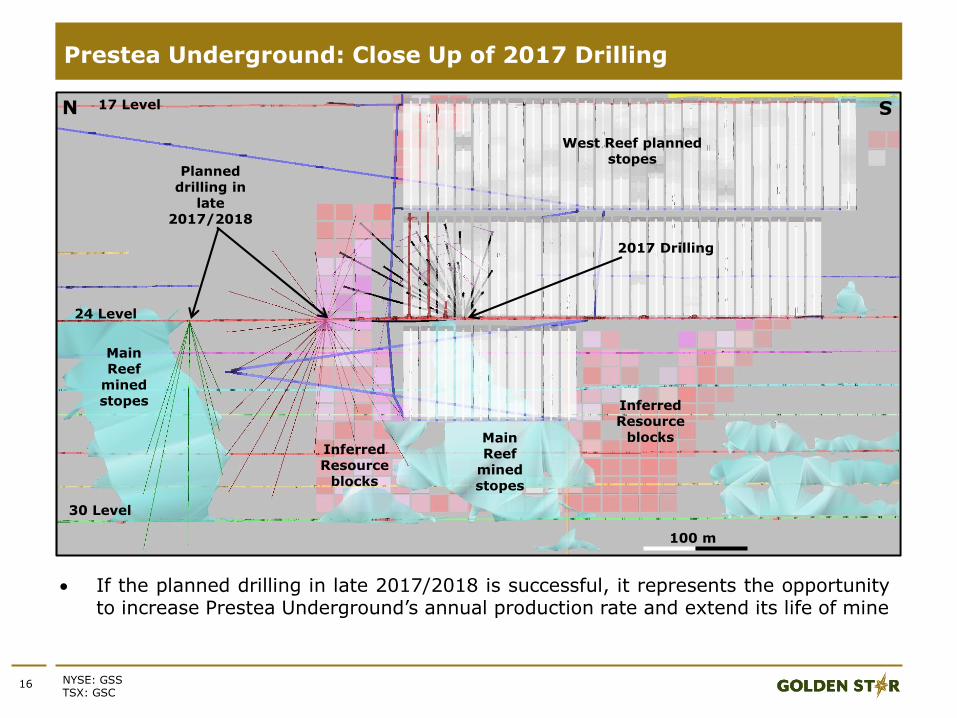
Prestea Underground: Close Up of 2017 Drilling
17 LevelN
S
24 Level
30 Level
West Reef planned stopes
Main Reef
mined stopes
Main Reef
mined stopes
2017 Drilling
Planned drilling in
late 2017/2018
Inferred Resource
blocks
100 m
Inferred Resource
blocks
If the planned drilling in late 2017/2018 is successful, it represents the opportunityto increase Prestea Underground’s annual production rate and extend its life of mine
17 NYSE: GSSTSX: GSC
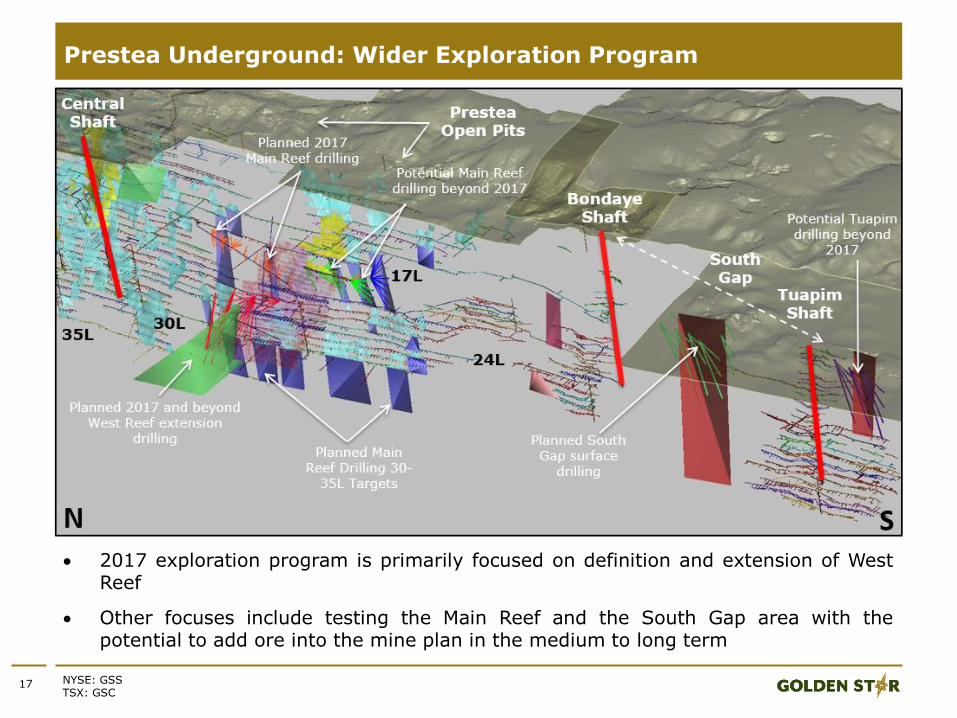
Prestea Underground: Wider Exploration Program
2017 exploration program is primarily focused on definition and extension of WestReef
Other focuses include testing the Main Reef and the South Gap area with thepotential to add ore into the mine plan in the medium to long term
18 NYSE: GSSTSX: GSC
Development of Prestea Underground Continues to Progress
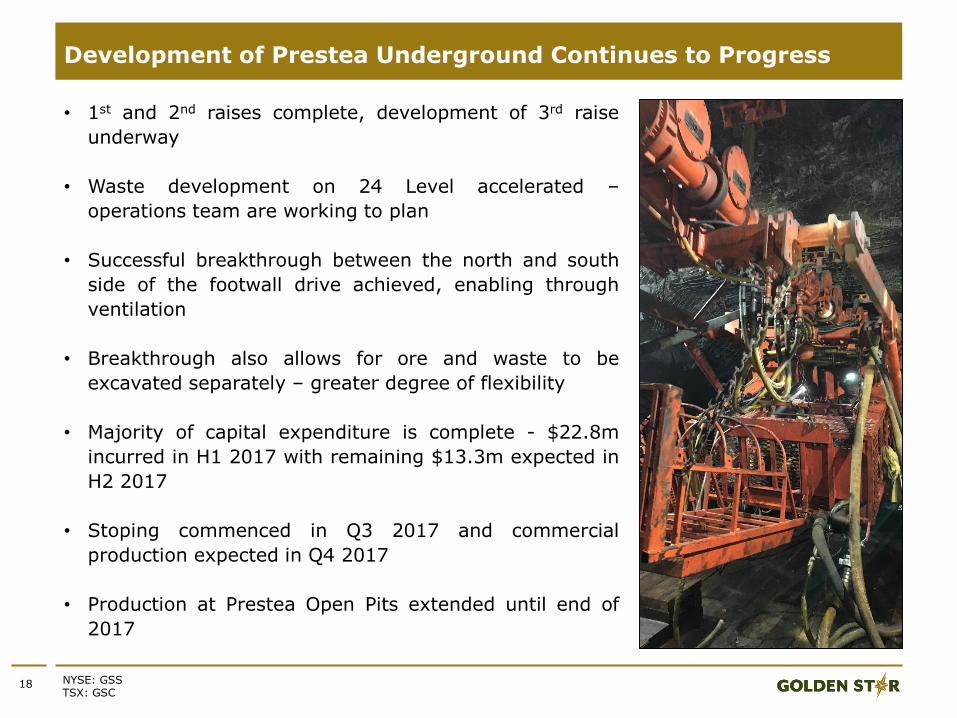
• 1st and 2nd raises complete, development of 3rd raise
underway
• Waste development on 24 Level accelerated –
operations team are working to plan
• Successful breakthrough between the north and south
side of the footwall drive achieved, enabling through
ventilation
• Breakthrough also allows for ore and waste to be
excavated separately – greater degree of flexibility
• Majority of capital expenditure is complete - $22.8m
incurred in H1 2017 with remaining $13.3m expected in
H2 2017
• Stoping commenced in Q3 2017 and commercial
production expected in Q4 2017
• Production at Prestea Open Pits extended until end of
2017
19 NYSE: GSSTSX: GSC
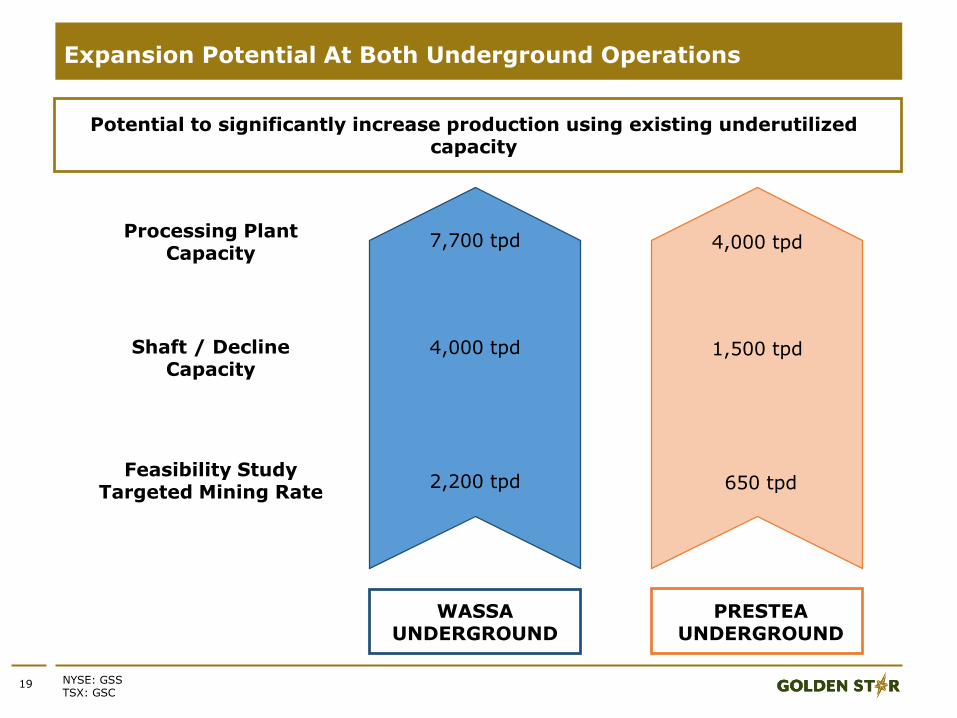
Expansion Potential At Both Underground Operations
Feasibility Study Targeted Mining Rate
Shaft / Decline Capacity
Processing Plant Capacity
Potential to significantly increase production using existing underutilized capacity
WASSA UNDERGROUND
2,200 tpd
4,000 tpd
7,700 tpd
PRESTEA UNDERGROUND
650 tpd
1,500 tpd
4,000 tpd
20 NYSE: GSSTSX: GSC
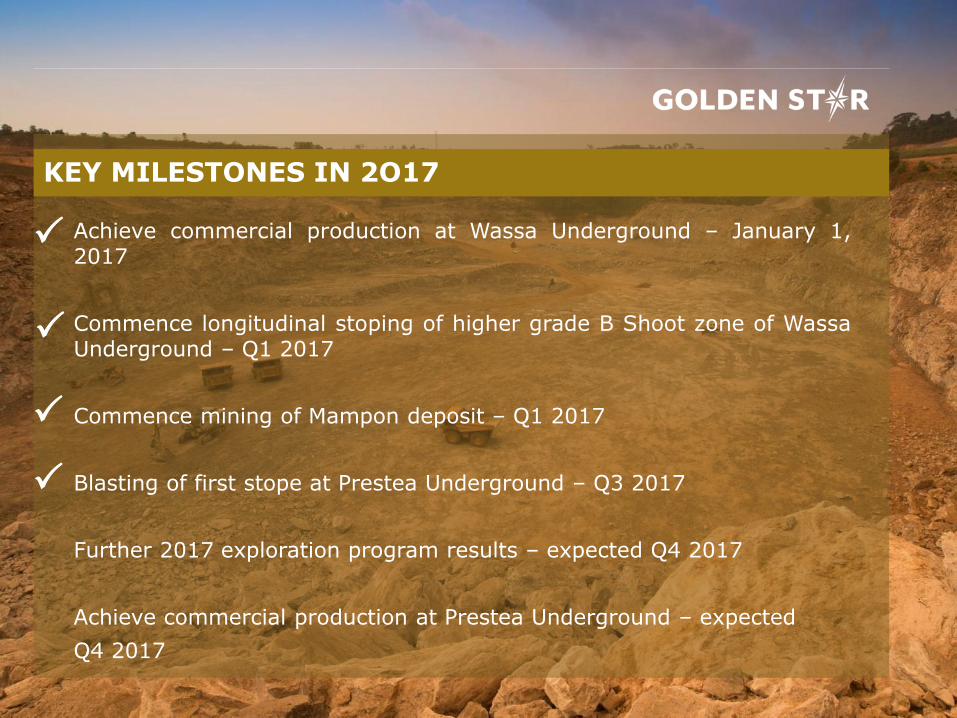
Achieve commercial production at Wassa Underground – January 1,2017
Commence longitudinal stoping of higher grade B Shoot zone of WassaUnderground – Q1 2017
Commence mining of Mampon deposit – Q1 2017
Blasting of first stope at Prestea Underground – Q3 2017
Further 2017 exploration program results – expected Q4 2017
Achieve commercial production at Prestea Underground – expected
Q4 2017
KEY MILESTONES IN 2O17

21 NYSE: GSSTSX: GSC
Contact Us
Katharine Sutton, Investor Relations+1 416 583 [email protected]
NYSE American: GSSTSX: GSC
Follow Us
22 NYSE: GSSTSX: GSC
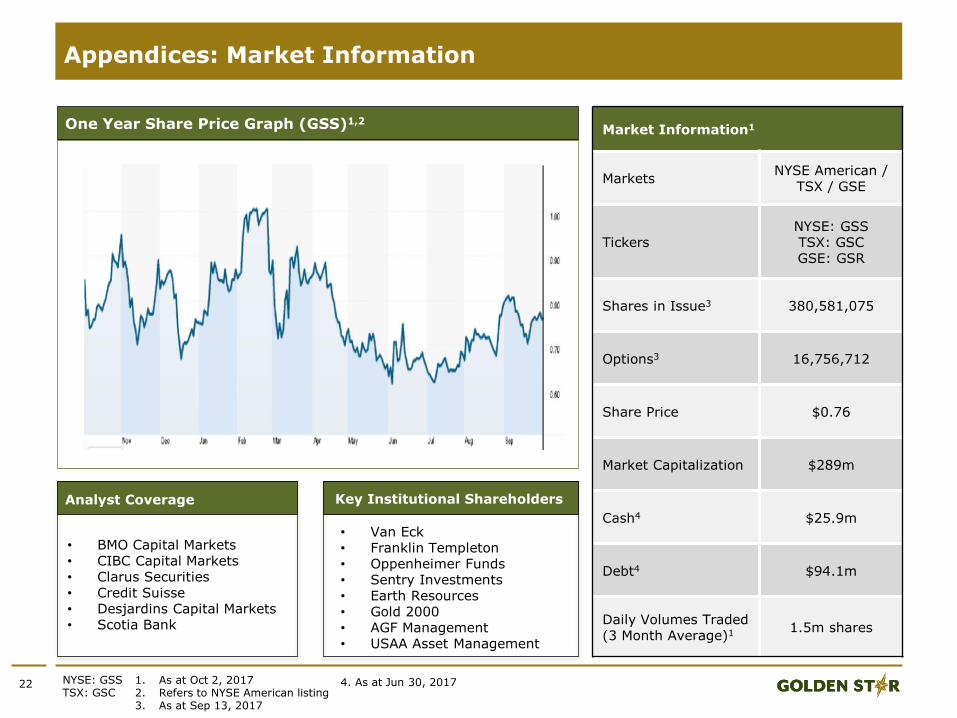
Appendices: Market Information
One year SP graph
Market Information1
MarketsNYSE American /
TSX / GSE
TickersNYSE: GSSTSX: GSCGSE: GSR
Shares in Issue3 380,581,075
Options3 16,756,712
Share Price $0.76
Market Capitalization $289m
Cash4 $25.9m
Debt4 $94.1m
Daily Volumes Traded (3 Month Average)1 1.5m shares
One Year Share Price Graph (GSS)1,2
Analyst Coverage Key Institutional Shareholders
• BMO Capital Markets• CIBC Capital Markets• Clarus Securities• Credit Suisse• Desjardins Capital Markets• Scotia Bank
• Van Eck• Franklin Templeton• Oppenheimer Funds• Sentry Investments• Earth Resources• Gold 2000• AGF Management• USAA Asset Management
1. As at Oct 2, 20172. Refers to NYSE American listing3. As at Sep 13, 2017
4. As at Jun 30, 2017
23 NYSE: GSSTSX: GSC
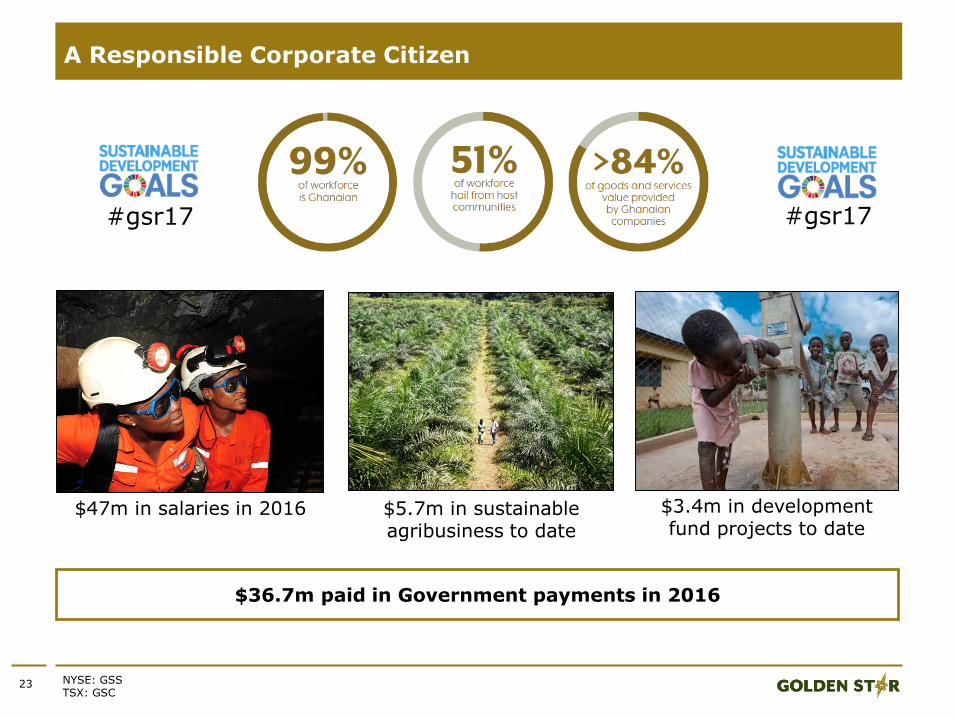
A Responsible Corporate Citizen
$5.7m in sustainable agribusiness to date
$3.4m in development fund projects to date
#gsr17
$47m in salaries in 2016
$36.7m paid in Government payments in 2016
#gsr17
24 NYSE: GSSTSX: GSC
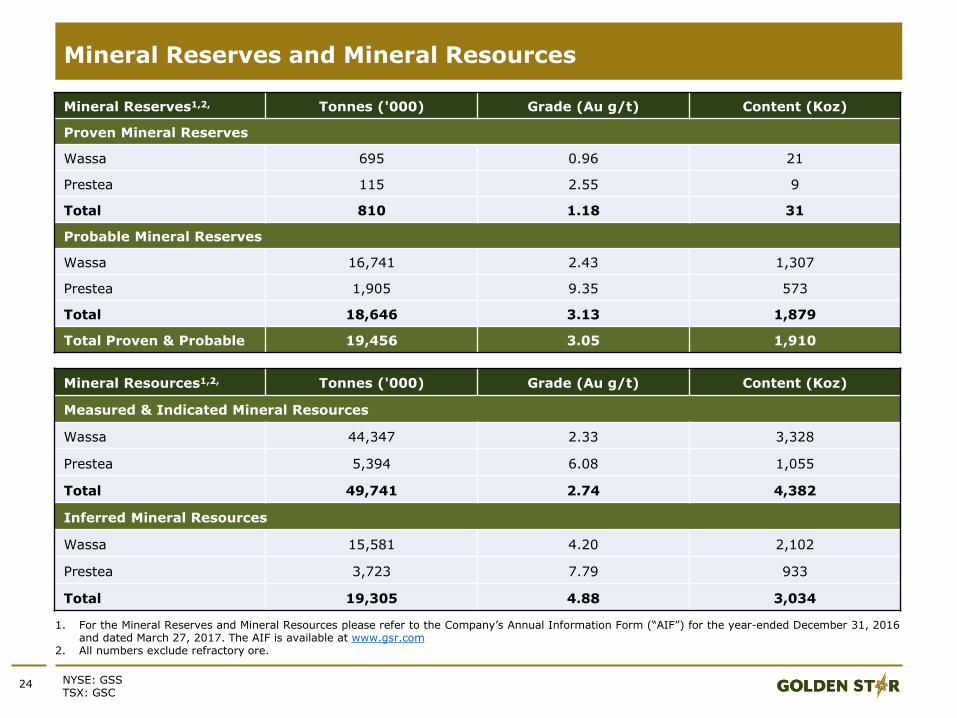
Mineral Reserves and Mineral Resources
Mineral Reserves1,2, Tonnes ('000) Grade (Au g/t) Content (Koz)
Proven Mineral Reserves
Wassa 695 0.96 21
Prestea 115 2.55 9
Total 810 1.18 31
Probable Mineral Reserves
Wassa 16,741 2.43 1,307
Prestea 1,905 9.35 573
Total 18,646 3.13 1,879
Total Proven & Probable 19,456 3.05 1,910
Mineral Resources1,2, Tonnes ('000) Grade (Au g/t) Content (Koz)
Measured & Indicated Mineral Resources
Wassa 44,347 2.33 3,328
Prestea 5,394 6.08 1,055
Total 49,741 2.74 4,382
Inferred Mineral Resources
Wassa 15,581 4.20 2,102
Prestea 3,723 7.79 933
Total 19,305 4.88 3,034
1. For the Mineral Reserves and Mineral Resources please refer to the Company’s Annual Information Form (“AIF”) for the year-ended December 31, 2016and dated March 27, 2017. The AIF is available at www.gsr.com
2. All numbers exclude refractory ore.