Embed Size (px)
Citation preview
Q2 2015 results presentation
2015-07-17

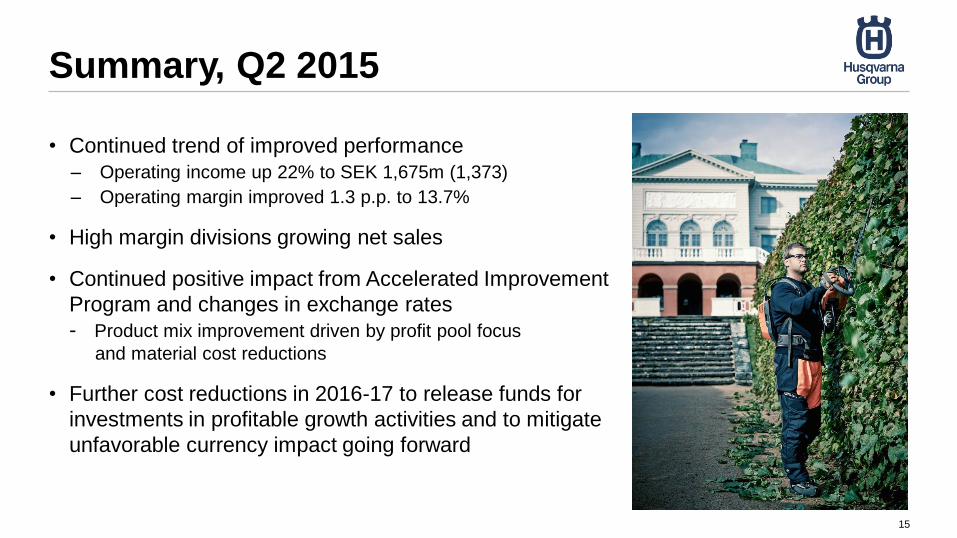
Summary, Q2 2015
• Continued trend of improved performance
– Operating income up 22% to SEK 1,675m (1,373)
– Operating margin improved 1.3 p.p. to 13.7%
• High margin divisions growing net sales
• Continued positive impact from Accelerated Improvement
Program and changes in exchange rates
- Product mix improvement driven by profit pool focus
and material cost reductions
• Further cost reductions in 2016-17 to release funds for
investments in profitable growth activities and to mitigate
unfavorable currency impact going forward
2
Financial highlights Q2 2015, Group
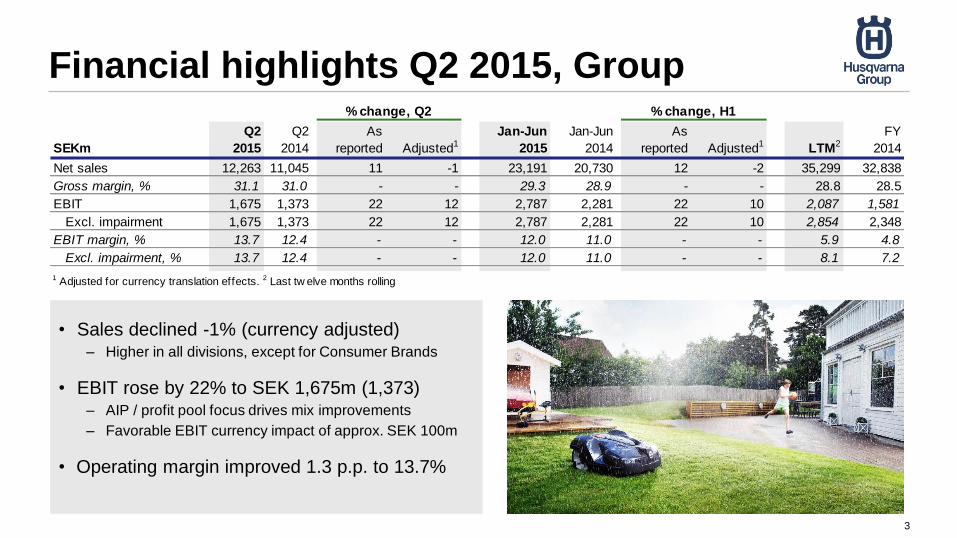
• Sales declined -1% (currency adjusted)– Higher in all divisions, except for Consumer Brands
• EBIT rose by 22% to SEK 1,675m (1,373)– AIP / profit pool focus drives mix improvements
– Favorable EBIT currency impact of approx. SEK 100m
• Operating margin improved 1.3 p.p. to 13.7%
3
SEKm
Q2
2015
Q2
2014
As
reported Adjusted1
Jan-Jun
2015
Jan-Jun
2014
As
reported Adjusted1 LTM2
FY
2014
Net sales 12,263 11,045 11 -1 23,191 20,730 12 -2 35,299 32,838
Gross margin, % 31.1 31.0 - - 29.3 28.9 - - 28.8 28.5
EBIT 1,675 1,373 22 12 2,787 2,281 22 10 2,087 1,581
Excl. impairment 1,675 1,373 22 12 2,787 2,281 22 10 2,854 2,348
EBIT margin, % 13.7 12.4 - - 12.0 11.0 - - 5.9 4.8
Excl. impairment, % 13.7 12.4 - - 12.0 11.0 - - 8.1 7.2
1 Adjusted for currency translation effects. 2 Last tw elve months rolling
% change, Q2 % change, H1
Husqvarna Division Q2 2015
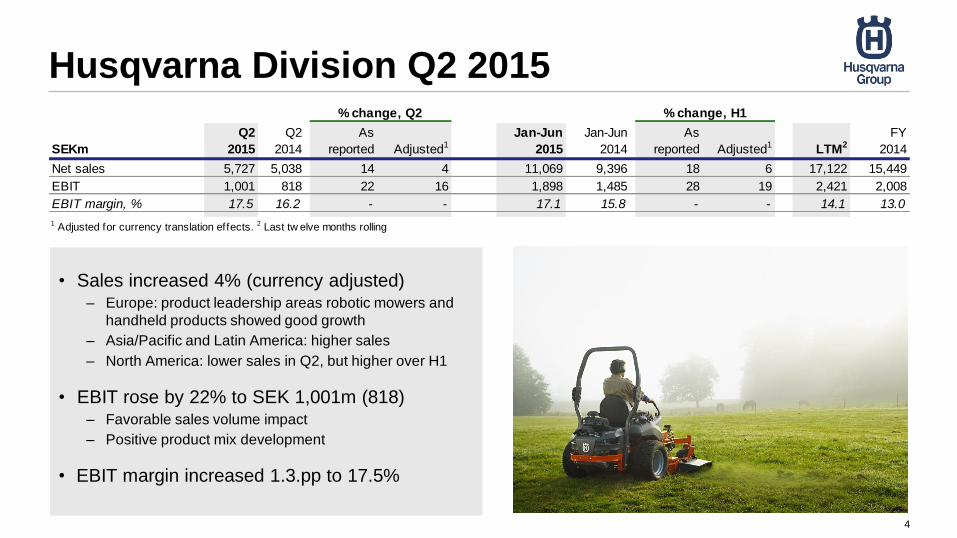
• Sales increased 4% (currency adjusted)– Europe: product leadership areas robotic mowers and
handheld products showed good growth
– Asia/Pacific and Latin America: higher sales
– North America: lower sales in Q2, but higher over H1
• EBIT rose by 22% to SEK 1,001m (818)– Favorable sales volume impact
– Positive product mix development
• EBIT margin increased 1.3.pp to 17.5%
4
SEKm
Q2
2015
Q2
2014
As
reported Adjusted1
Jan-Jun
2015
Jan-Jun
2014
As
reported Adjusted1 LTM2
FY
2014
Net sales 5,727 5,038 14 4 11,069 9,396 18 6 17,122 15,449
EBIT 1,001 818 22 16 1,898 1,485 28 19 2,421 2,008
EBIT margin, % 17.5 16.2 - - 17.1 15.8 - - 14.1 13.0
1 Adjusted for currency translation effects. 2 Last tw elve months rolling
% change, Q2 % change, H1
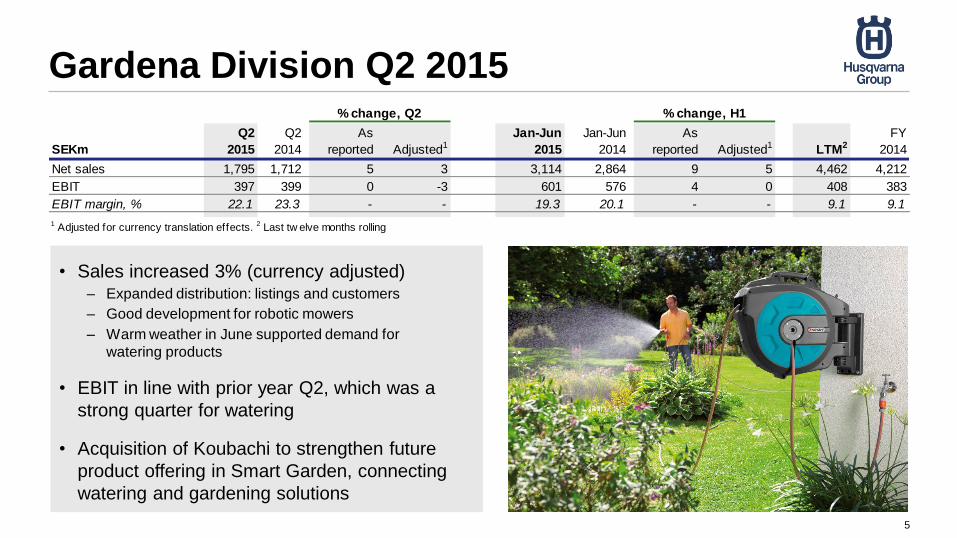
Gardena Division Q2 2015
5
• Sales increased 3% (currency adjusted)– Expanded distribution: listings and customers
– Good development for robotic mowers
– Warm weather in June supported demand for
watering products
• EBIT in line with prior year Q2, which was a
strong quarter for watering
• Acquisition of Koubachi to strengthen future
product offering in Smart Garden, connecting
watering and gardening solutions
SEKm
Q2
2015
Q2
2014
As
reported Adjusted1
Jan-Jun
2015
Jan-Jun
2014
As
reported Adjusted1 LTM2
FY
2014
Net sales 1,795 1,712 5 3 3,114 2,864 9 5 4,462 4,212
EBIT 397 399 0 -3 601 576 4 0 408 383
EBIT margin, % 22.1 23.3 - - 19.3 20.1 - - 9.1 9.1
1 Adjusted for currency translation effects. 2 Last tw elve months rolling
% change, Q2 % change, H1
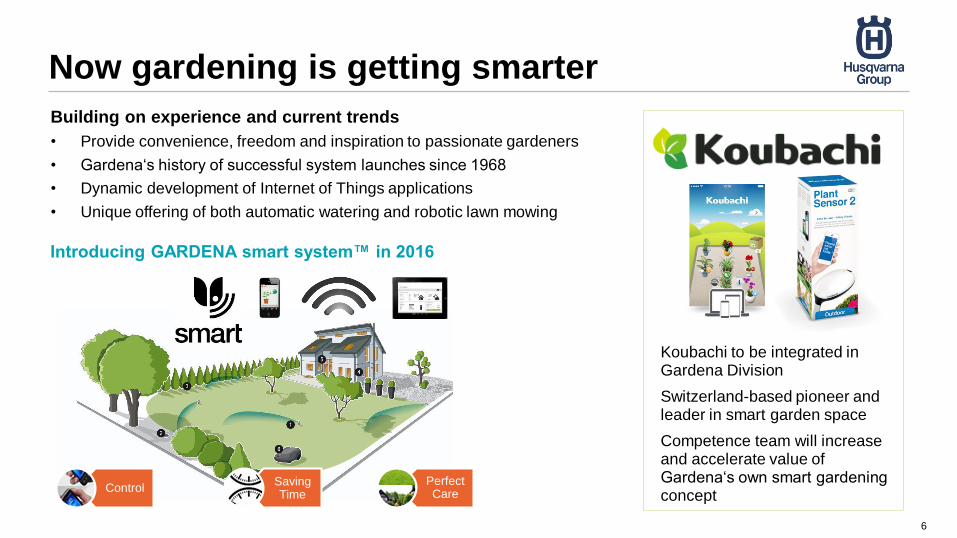
Now gardening is getting smarter
6
Building on experience and current trends
• Provide convenience, freedom and inspiration to passionate gardeners
• Gardena‘s history of successful system launches since 1968
• Dynamic development of Internet of Things applications
• Unique offering of both automatic watering and robotic lawn mowing
Koubachi to be integrated in Gardena Division
Switzerland-based pioneer and leader in smart garden space
Competence team will increase and accelerate value of Gardena‘s own smart gardening concept
Saving Time
Control Perfect Care
Introducing GARDENA smart system™ in 2016
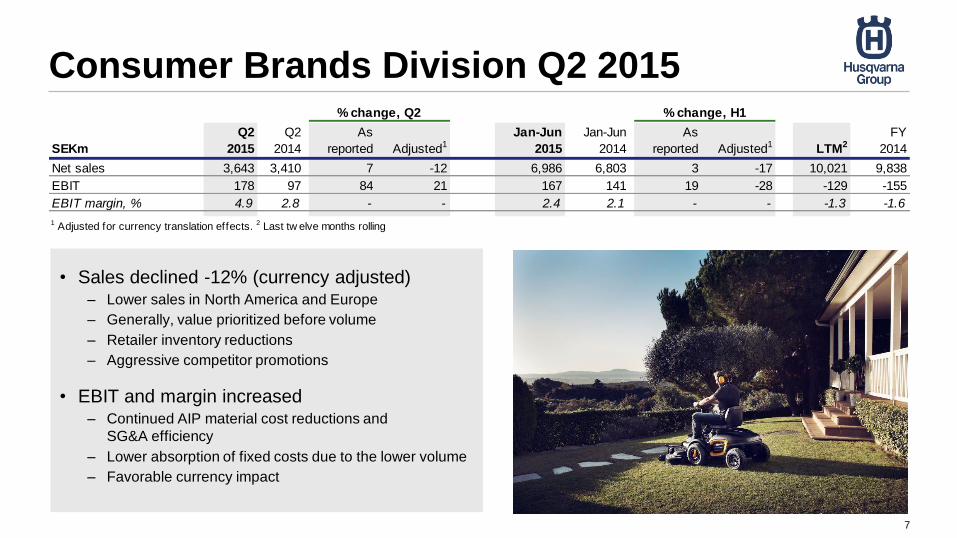
Consumer Brands Division Q2 2015
7
• Sales declined -12% (currency adjusted)– Lower sales in North America and Europe
– Generally, value prioritized before volume
– Retailer inventory reductions
– Aggressive competitor promotions
• EBIT and margin increased– Continued AIP material cost reductions and
SG&A efficiency
– Lower absorption of fixed costs due to the lower volume
– Favorable currency impact
SEKm
Q2
2015
Q2
2014
As
reported Adjusted1
Jan-Jun
2015
Jan-Jun
2014
As
reported Adjusted1 LTM2
FY
2014
Net sales 3,643 3,410 7 -12 6,986 6,803 3 -17 10,021 9,838
EBIT 178 97 84 21 167 141 19 -28 -129 -155
EBIT margin, % 4.9 2.8 - - 2.4 2.1 - - -1.3 -1.6
1 Adjusted for currency translation effects. 2 Last tw elve months rolling
% change, Q2 % change, H1
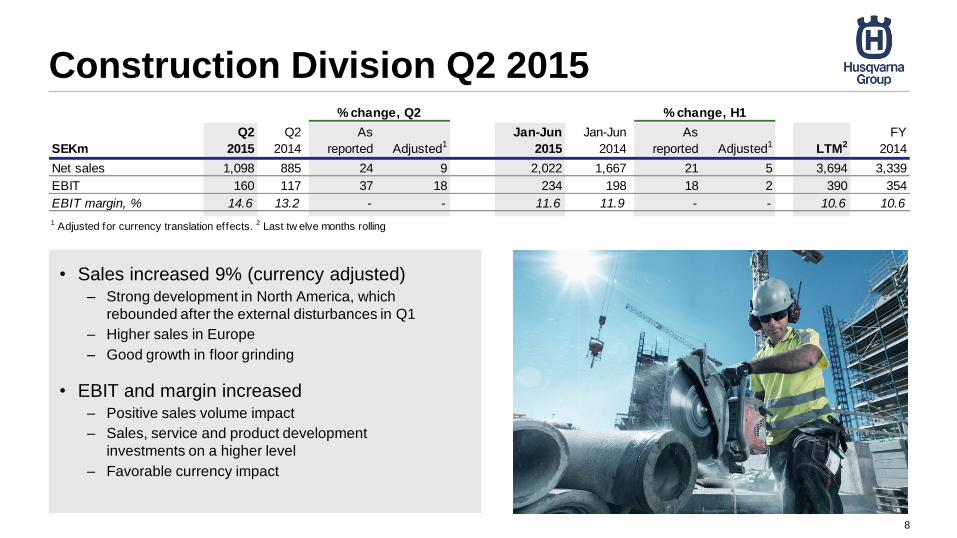
Construction Division Q2 2015
8
• Sales increased 9% (currency adjusted)– Strong development in North America, which
rebounded after the external disturbances in Q1
– Higher sales in Europe
– Good growth in floor grinding
• EBIT and margin increased– Positive sales volume impact
– Sales, service and product development
investments on a higher level
– Favorable currency impact
SEKm
Q2
2015
Q2
2014
As
reported Adjusted1
Jan-Jun
2015
Jan-Jun
2014
As
reported Adjusted1 LTM2
FY
2014
Net sales 1,098 885 24 9 2,022 1,667 21 5 3,694 3,339
EBIT 160 117 37 18 234 198 18 2 390 354
EBIT margin, % 14.6 13.2 - - 11.6 11.9 - - 10.6 10.6
1 Adjusted for currency translation effects. 2 Last tw elve months rolling
% change, Q2 % change, H1
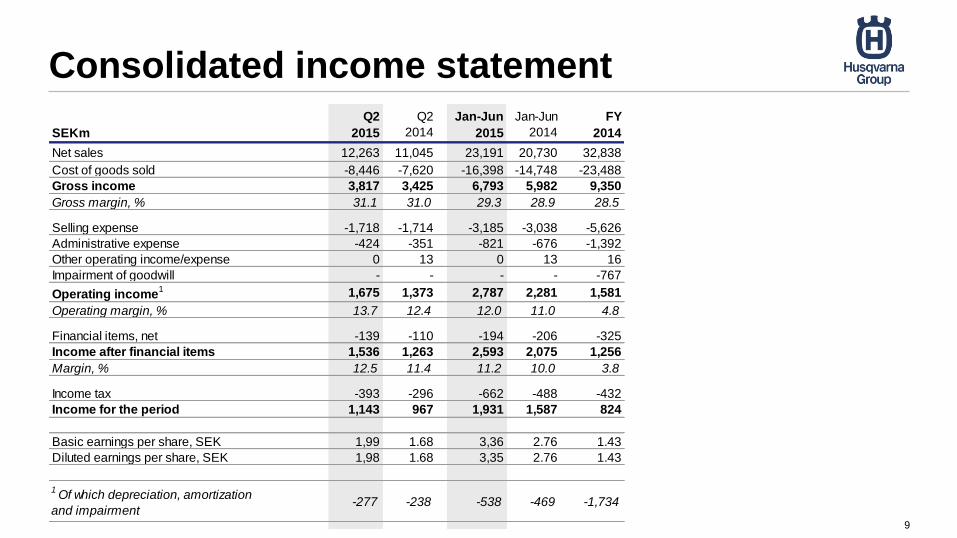
Consolidated income statement
9
SEKm
Q2
2015
Q2
2014
Jan-Jun
2015
Jan-Jun
2014
FY
2014
Net sales 12,263 11,045 23,191 20,730 32,838
Cost of goods sold -8,446 -7,620 -16,398 -14,748 -23,488
Gross income 3,817 3,425 6,793 5,982 9,350
Gross margin, % 31.1 31.0 29.3 28.9 28.5
Selling expense -1,718 -1,714 -3,185 -3,038 -5,626
Administrative expense -424 -351 -821 -676 -1,392
Other operating income/expense 0 13 0 13 16
Impairment of goodwill - - - - -767
Operating income1 1,675 1,373 2,787 2,281 1,581
Operating margin, % 13.7 12.4 12.0 11.0 4.8
Financial items, net -139 -110 -194 -206 -325
Income after financial items 1,536 1,263 2,593 2,075 1,256
Margin, % 12.5 11.4 11.2 10.0 3.8
Income tax -393 -296 -662 -488 -432
Income for the period 1,143 967 1,931 1,587 824
Basic earnings per share, SEK 1,99 1.68 3,36 2.76 1.43
Diluted earnings per share, SEK 1,98 1.68 3,35 2.76 1.43
1Of which depreciation, amortization
and impairment-277 -238 -538 -469 -1,734
26,8%
30,3%30,3%29,5%
27,0%
28,9%
27,7%27,8%
26,7%
28,7%
27,7%
25,2%25,2%
28,3%
26,3%
25,1%
26,4%
31,0%
29,0%
26,3%
27,2%
31,1%
20%
23%
26%
29%
32%
20%
25%
30%
35%
40%
Q1 2
01
0
Q2 2
01
0
Q3 2
01
0
Q4 2
01
0
Q1 2
01
1
Q2 2
01
1
Q3 2
01
1
Q4 2
01
1
Q1 2
01
2
Q2 2
01
2
Q3 2
01
2
Q4 2
01
2
Q1 2
01
3
Q2 2
01
3
Q3 2
01
3
Q4 2
01
3
Q1 2
01
4
Q2 2
01
4
Q3 2
01
4
Q4 2
01
4
Q1 2
01
5
Q2 2
01
5
LTMQuarter
Gross profit margin, % Q
Gross profit margin, % LTM
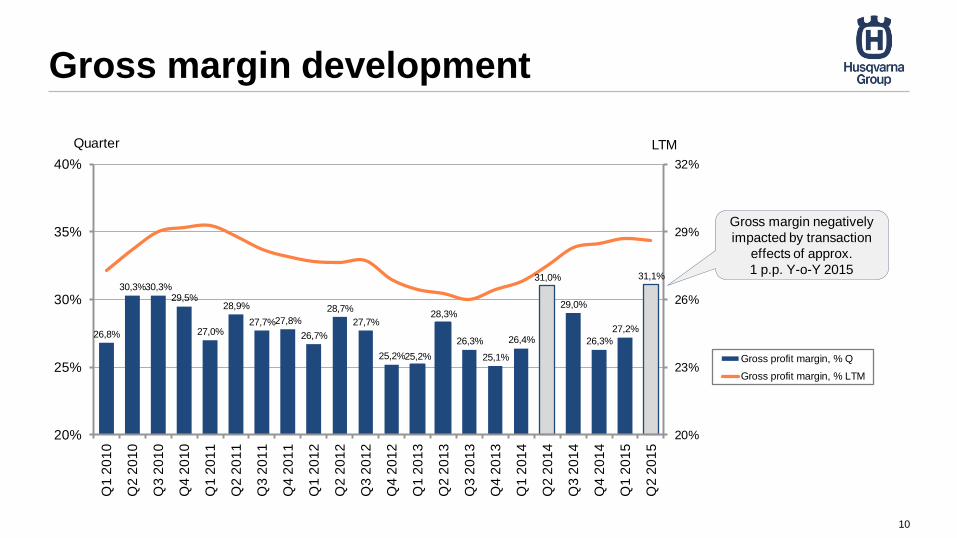
Gross margin development
10
Gross margin negatively
impacted by transaction
effects of approx.
1 p.p. Y-o-Y 2015
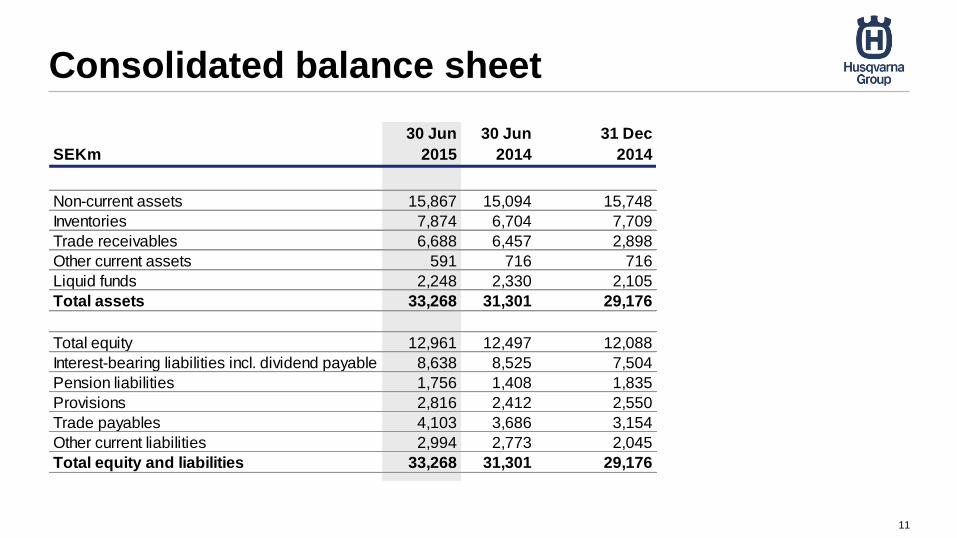
Consolidated balance sheet
11
SEKm
30 Jun
2015
30 Jun
2014
31 Dec
2014
Non-current assets 15,867 15,094 15,748
Inventories 7,874 6,704 7,709
Trade receivables 6,688 6,457 2,898
Other current assets 591 716 716
Liquid funds 2,248 2,330 2,105
Total assets 33,268 31,301 29,176
Total equity 12,961 12,497 12,088
Interest-bearing liabilities incl. dividend payable 8,638 8,525 7,504
Pension liabilities 1,756 1,408 1,835
Provisions 2,816 2,412 2,550
Trade payables 4,103 3,686 3,154
Other current liabilities 2,994 2,773 2,045
Total equity and liabilities 33,268 31,301 29,176
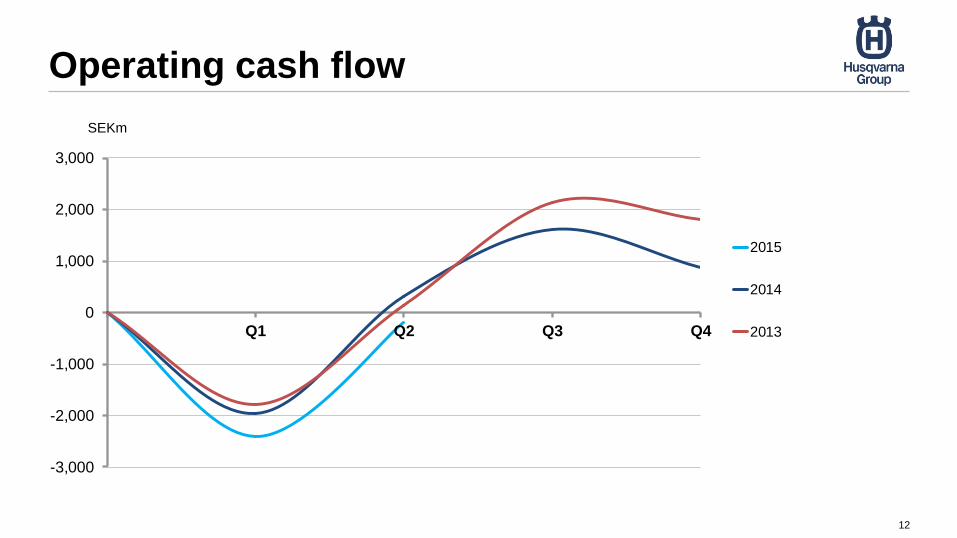
Operating cash flow
12
-3,000
-2,000
-1,000
0
1,000
2,000
3,000
Q1 Q2 Q3 Q4
SEKm
2015
2014
2013
0.00
0.30
0.60
0.90
1.20
1.50
1.80
2.10
2.40
0
2,000
4,000
6,000
8,000
10,000
12,000
14,000
201
0 Q
3
201
0 Q
4
201
1 Q
1
201
1 Q
2
201
1 Q
3
201
1 Q
4
201
2 Q
1
201
2 Q
2
201
2 Q
3
201
2 Q
4
201
3 Q
1
201
3 Q
2
201
3 Q
3
201
3 Q
4
201
4 Q
1
201
4 Q
2
201
4 Q
3
201
4 Q
4
201
5 Q
1
201
5 Q
2
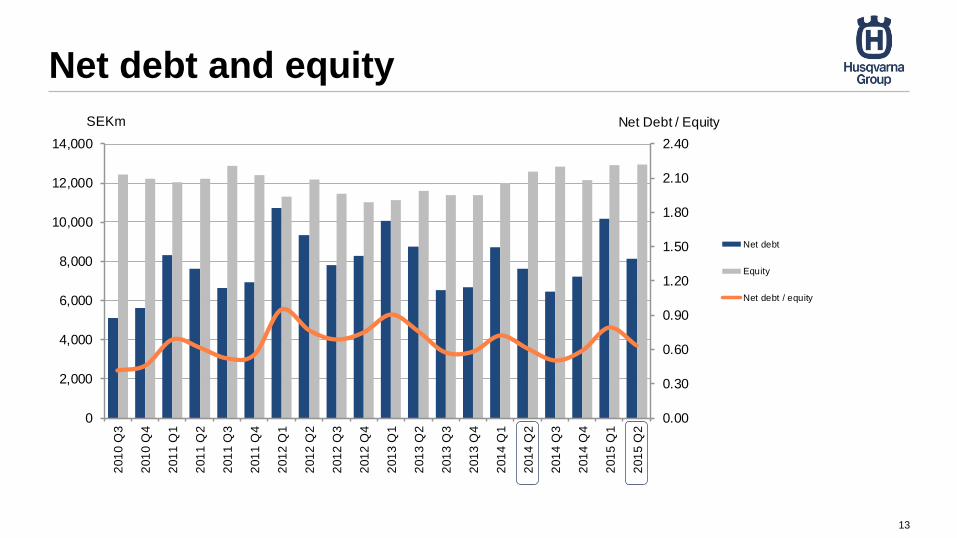
Net Debt / EquitySEKm
Net debt
Equity
Net debt / equity
Net debt and equity
13
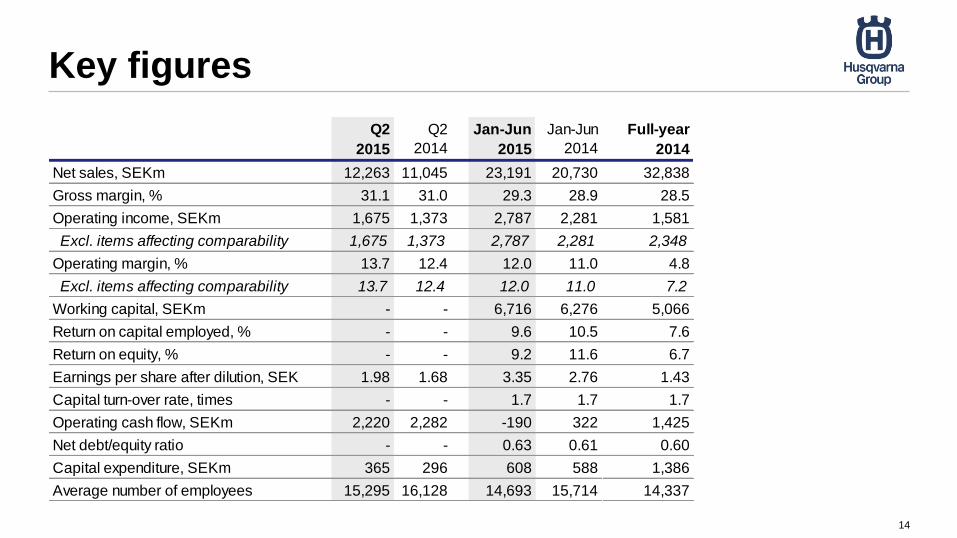
Key figures
14
Q2
2015
Q2
2014
Jan-Jun
2015
Jan-Jun
2014
Full-year
2014
Net sales, SEKm 12,263 11,045 23,191 20,730 32,838
Gross margin, % 31.1 31.0 29.3 28.9 28.5
Operating income, SEKm 1,675 1,373 2,787 2,281 1,581
Excl. items affecting comparability 1,675 1,373 2,787 2,281 2,348
Operating margin, % 13.7 12.4 12.0 11.0 4.8
Excl. items affecting comparability 13.7 12.4 12.0 11.0 7.2
Working capital, SEKm - - 6,716 6,276 5,066
Return on capital employed, % - - 9.6 10.5 7.6
Return on equity, % - - 9.2 11.6 6.7
Earnings per share after dilution, SEK 1.98 1.68 3.35 2.76 1.43
Capital turn-over rate, times - - 1.7 1.7 1.7
Operating cash flow, SEKm 2,220 2,282 -190 322 1,425
Net debt/equity ratio - - 0.63 0.61 0.60
Capital expenditure, SEKm 365 296 608 588 1,386
Average number of employees 15,295 16,128 14,693 15,714 14,337
Summary, Q2 2015
• Continued trend of improved performance
– Operating income up 22% to SEK 1,675m (1,373)
– Operating margin improved 1.3 p.p. to 13.7%
• High margin divisions growing net sales
• Continued positive impact from Accelerated Improvement
Program and changes in exchange rates
- Product mix improvement driven by profit pool focus
and material cost reductions
• Further cost reductions in 2016-17 to release funds for
investments in profitable growth activities and to mitigate
unfavorable currency impact going forward
15
www.husqvarnagroup.com


![Announces Q2 results [Result]](https://img.pdfslide.us/doc/110x75/577ca7391a28abea748c4b21/announces-q2-results-result.jpg)