Embed Size (px)
Citation preview
Franklin Resources, Inc.
First Quarter Results
Greg Johnson
Chairman and Chief Executive Officer
Ken Lewis
Chief Financial Officer
January 27, 2017

Statements in this presentation regarding Franklin Resources, Inc. (“Franklin”) and its subsidiaries, which are not historical facts, are "forward-looking statements" within the meaning of
the U.S. Private Securities Litigation Reform Act of 1995. When used in this presentation, words or phrases generally written in the future tense and/or preceded by words such as “will,”
“may,” “could,” “expect,” “believe,” “anticipate,” “intend,” “plan,” “seek,” “estimate” or other similar words are forward-looking statements. Forward-looking statements involve a number of
known and unknown risks, uncertainties and other important factors, some of which are listed below, that could cause actual results and outcomes to differ materially from any future
results or outcomes expressed or implied by such forward-looking statements. While forward-looking statements are our best prediction at the time that they are made, you should not rely
on them, and you are hereby cautioned against doing so. Forward-looking statements are based on our current expectations and assumptions regarding our business, the economy and
other future conditions. Because forward-looking statements relate to the future, they are subject to inherent uncertainties, risks and changes in circumstances that are difficult to predict.
They are neither statements of historical fact nor guarantees or assurances of future performance.
These and other risks, uncertainties and other important factors are described in more detail in Franklin’s recent filings with the U.S. Securities and Exchange Commission, including,
without limitation, in Risk Factors and Management’s Discussion and Analysis of Financial Condition and Results of Operations in Franklin’s Annual Report on Form 10-K for the fiscal
year ended September 30, 2016 and Franklin’s subsequent Quarterly Report on Form 10-Q: (1) volatility and disruption of the capital and credit markets, and adverse changes in the
global economy, may significantly affect our results of operations and may put pressure on our financial results; (2) the amount and mix of our assets under management (“AUM”) are
subject to significant fluctuations; (3) we are subject to extensive, complex, overlapping and frequently changing rules, regulations and legal interpretations; (4) global regulatory and
legislative actions and reforms have made the regulatory environment in which we operate more costly and future actions and reforms could adversely impact our financial condition and
results of operations; (5) failure to comply with the laws, rules or regulations in any of the jurisdictions in which we operate could result in substantial harm to our reputation and results of
operations; (6) changes in tax laws or exposure to additional income tax liabilities could have a material impact on our financial condition, results of operations and liquidity; (7) any
significant limitation, failure or security breach of our information and cyber security infrastructure, software applications, technology or other systems that are critical to our operations
could disrupt our business and harm our operations and reputation; (8) our business operations are complex and a failure to properly perform operational tasks or the misrepresentation
of our products and services, or the termination of investment management agreements representing a significant portion of our AUM, could have an adverse effect on our revenues and
income; (9) we face risks, and corresponding potential costs and expenses, associated with conducting operations and growing our business in numerous countries; (10) we depend on
key personnel and our financial performance could be negatively affected by the loss of their services; (11) strong competition from numerous and sometimes larger companies with
competing offerings and products could limit or reduce sales of our products, potentially resulting in a decline in our market share, revenues and income; (12) changes in the third-party
distribution and sales channels on which we depend could reduce our income and hinder our growth; (13) our increasing focus on international markets as a source of investments and
sales of investment products subjects us to increased exchange rate and market-specific political, economic or other risks that may adversely impact our revenues and income generated
overseas; (14) harm to our reputation or poor investment performance of our products could reduce the level of our AUM or affect our sales, and negatively impact our revenues and
income; (15) our future results are dependent upon maintaining an appropriate level of expenses, which is subject to fluctuation; (16) our ability to successfully manage and grow our
business can be impeded by systems and other technological limitations; (17) our inability to successfully recover should we experience a disaster or other business continuity problem
could cause material financial loss, loss of human capital, regulatory actions, reputational harm, or legal liability; (18) regulatory and governmental examinations and/or investigations,
litigation and the legal risks associated with our business, could adversely impact our AUM, increase costs and negatively impact our profitability and/or our future financial results; (19)
our ability to meet cash needs depends upon certain factors, including the market value of our assets, operating cash flows and our perceived creditworthiness; (20) we are dependent on
the earnings of our subsidiaries.
Any forward-looking statement made by us in this presentation speaks only as of the date on which it is made. Factors or events that could cause our actual results to differ may emerge
from time to time, and it is not possible for us to predict all of them. We undertake no obligation to publicly update any forward-looking statement, whether as a result of new information,
future developments or otherwise, except as may be required by law.
The information in this presentation is provided solely in connection with this presentation, and is not directed toward existing or potential investment advisory clients or
fund shareholders.
Forward-Looking Statements
2

Commentary and Conference Call Details
A written commentary on the results by Chairman and CEO Greg Johnson and CFO and Executive Vice President Ken
Lewis will be available today at approximately 8:30 a.m. Eastern Time. Access to the written commentary and
accompanying slides will be available via investors.franklinresources.com.
Johnson and Lewis will also lead a live teleconference today at 11:00 a.m. Eastern Time to answer questions of a material
nature. Access to the teleconference will be available via investors.franklinresources.com or by dialing (877) 407-8293 in
the U.S. and Canada or (201) 689-8349 internationally. A replay of the teleconference can also be accessed by calling
(877) 660-6853 in the U.S. and Canada or (201) 612-7415 internationally using access code 13652411, after 2:00 p.m.
Eastern Time on January 27, 2017 through February 27, 2017.
Analysts and investors are encouraged to review the Company’s recent filings with the U.S. Securities and Exchange
Commission and to contact Investor Relations at (650) 312-4091 before the live teleconference for any clarifications or
questions related to the earnings release or written commentary.
3
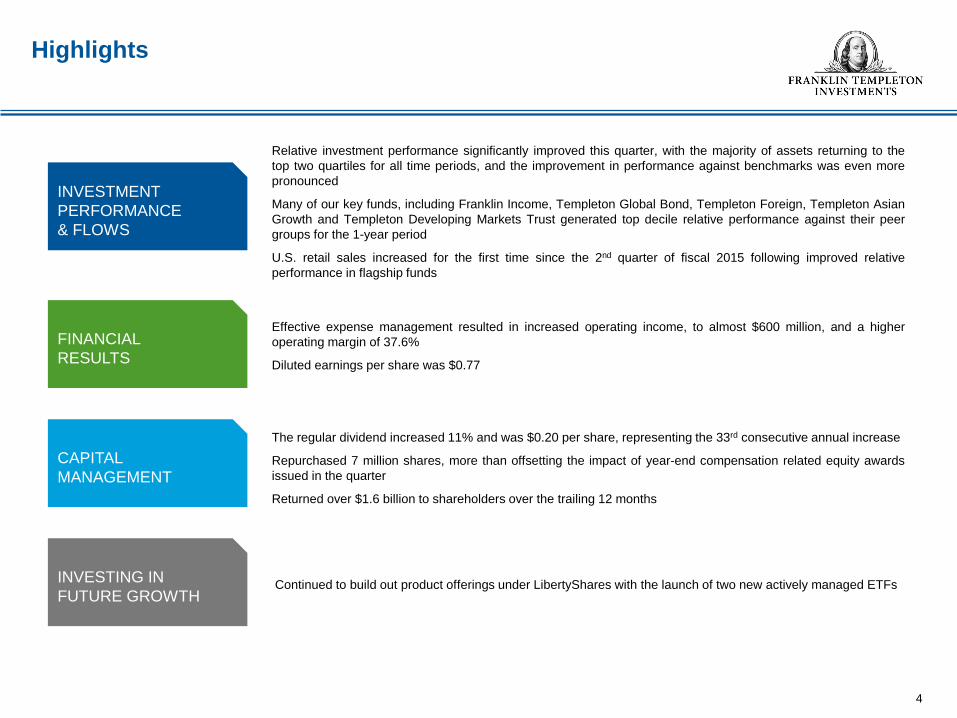
Highlights
4
INVESTMENT
PERFORMANCE
& FLOWS
FINANCIAL
RESULTS
CAPITAL
MANAGEMENT
INVESTING IN
FUTURE GROWTHContinued to build out product offerings under LibertyShares with the launch of two new actively managed ETFs
The regular dividend increased 11% and was $0.20 per share, representing the 33rd consecutive annual increase
Repurchased 7 million shares, more than offsetting the impact of year-end compensation related equity awards
issued in the quarter
Returned over $1.6 billion to shareholders over the trailing 12 months
Effective expense management resulted in increased operating income, to almost $600 million, and a higher
operating margin of 37.6%
Diluted earnings per share was $0.77
Relative investment performance significantly improved this quarter, with the majority of assets returning to the
top two quartiles for all time periods, and the improvement in performance against benchmarks was even more
pronounced
Many of our key funds, including Franklin Income, Templeton Global Bond, Templeton Foreign, Templeton Asian
Growth and Templeton Developing Markets Trust generated top decile relative performance against their peer
groups for the 1-year period
U.S. retail sales increased for the first time since the 2nd quarter of fiscal 2015 following improved relative
performance in flagship funds
Investment Performance and Flows

5-Year3-Year 10-Year
Investment Performance
6
The peer group rankings are sourced from either Lipper, a Thomson Reuters Company or Morningstar, as the case may be, and are based on an absolute ranking of returns as of December 31, 2016.
Lipper rankings for Franklin Templeton U.S.-registered long-term mutual funds are based on Class A shares and do not include sales charges. Franklin Templeton U.S.-registered long-term funds are
compared against a universe of all share classes. Performance rankings for other share classes may differ. Morningstar rankings for Franklin Templeton cross-border long-term mutual funds are based on
primary share classes and do not include sales charges. Performance rankings for other share classes may differ. Results may have been different if these or other factors had been considered. The figures
in the table are based on data available from Lipper and Morningstar as of January 9, 2017 and are subject to revision.
© 2017 Morningstar, Inc. All Rights Reserved. The information contained herein: (1) is proprietary to Morningstar and/or its content providers; (2) may not be copied or distributed; and (3) is not warranted to
be accurate, complete or timely. Neither Morningstar nor its content providers are responsible for any damages or losses arising from any use of this information.
Performance quoted above represents past performance, which cannot predict or guarantee future results. All investments involve risks, including loss of principal.
U.S.-Registered and Cross-Border Mutual Funds
Percentage of Total Long-Term Assets ($472 billion) in the Top Two Peer Group Quartiles
Equity & Hybrid - $275 billion
Fixed Income - $197 billion
77%
67% 68% 82%
63% 66%
73% 69% 89%

Assets Under Management Overview
7
68%
14%
12%
4%
2%
41%
19%
39%
1%782
737 740 736 723
764 743 732 733 720
12/15 3/16 6/16 9/16 12/16
(in US$ billions, for the three months ended)
Average AUM Ending AUM
Simple Monthly Average vs. End of Period As of December 31, 2016
Investment Objective Dec-16
Equity $ 298.3
Hybrid 138.3
Fixed Income 277.2
Cash Management 6.2
Total $ 720.0
Sales Region Dec-16
United States $ 491.0
Europe, the Middle East
and Africa100.5
Asia-Pacific 81.6
Canada 30.3
Latin America 16.6
Total $ 720.0
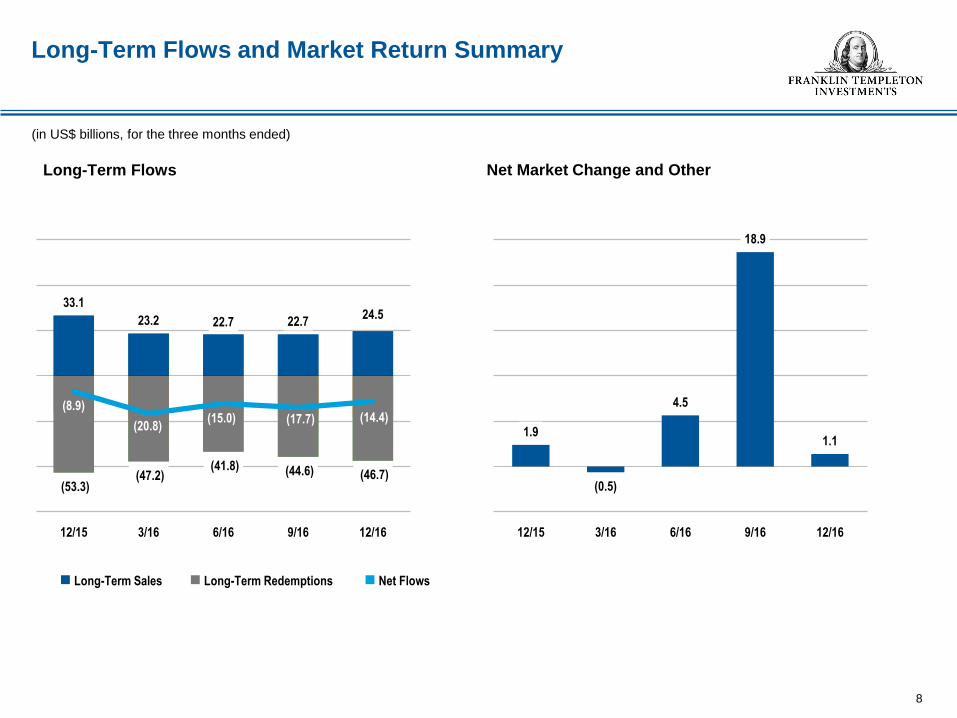
Long-Term Flows
Long-Term Flows and Market Return Summary
8
Net Flows Long-Term Sales Long-Term Redemptions
(in US$ billions, for the three months ended)
Net Market Change and Other
1.9
(0.5)
4.5
18.9
1.1
12/15 3/16 6/16 9/16 12/16
33.1
23.2 22.7 22.7 24.5
(53.3)(47.2)
(41.8) (44.6) (46.7)
(8.9)
(20.8)(15.0) (17.7) (14.4)
12/15 3/16 6/16 9/16 12/16

United States and International, Retail and
Institutional Flows
9
(in US$ billions, for the three months ended)
United States International
Retail Long-Term Sales Retail Long-Term Redemptions
Institutional Long-Term Sales Institutional Long-Term Redemptions
Graphs do not include high net-worth client flows.
11.9 11.5 11.3 10.3 10.9
3.4 2.5 2.0 2.0 2.1
(29.5)
(21.5)(20.9) (20.9)
(25.9)
(5.4) (5.7) (4.2) (5.6) (5.2)
12/15 3/16 6/16 9/16 12/16
7.2 5.5 6.5 7.7 8.5
10.2
3.4 2.6 2.5 2.1
(12.8) (12.2) (11.5) (11.5) (11.8)
(5.3)(7.5)
(4.8)(6.2)
(3.3)
12/15 3/16 6/16 9/16 12/16
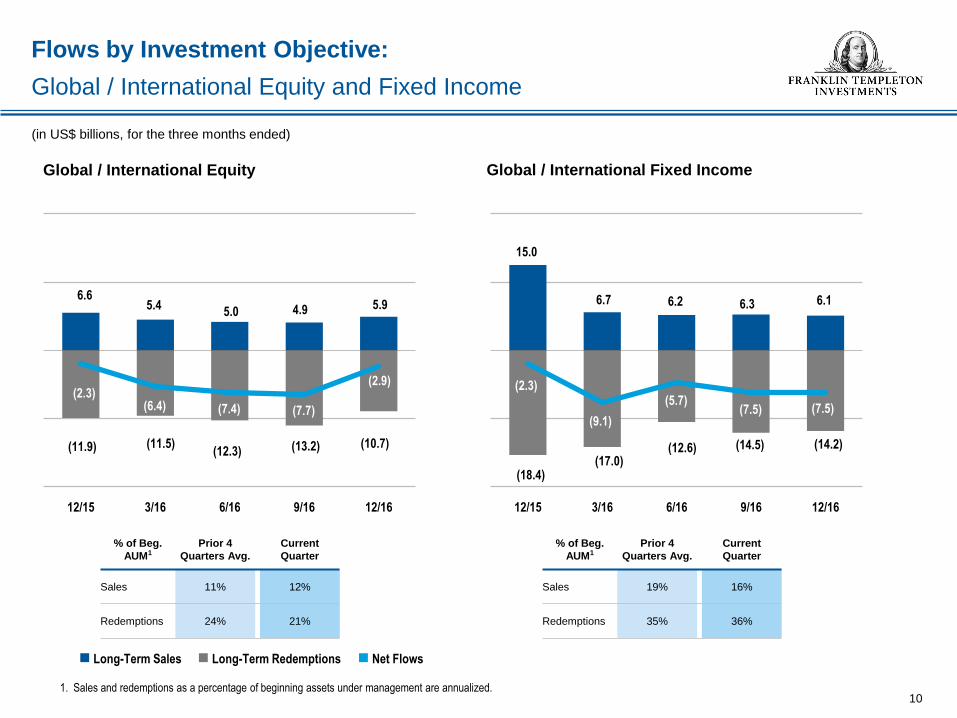
Flows by Investment Objective:
Global / International Equity and Fixed Income
101. Sales and redemptions as a percentage of beginning assets under management are annualized.
% of Beg.
AUM1
Prior 4
Quarters Avg.
Current
Quarter
Sales 11% 12%
Redemptions 24% 21%
% of Beg.
AUM1
Prior 4
Quarters Avg.
Current
Quarter
Sales 19% 16%
Redemptions 35% 36%
(in US$ billions, for the three months ended)
Global / International Equity Global / International Fixed Income
Net Flows Long-Term Sales Long-Term Redemptions
6.6 5.4
5.0 4.9 5.9
(11.9) (11.5)(12.3) (13.2) (10.7)
(2.3)(6.4) (7.4) (7.7)
(2.9)
12/15 3/16 6/16 9/16 12/16
15.0
6.7 6.2 6.3 6.1
(18.4)(17.0)
(12.6) (14.5) (14.2)
(2.3)
(9.1)
(5.7)(7.5) (7.5)
12/15 3/16 6/16 9/16 12/16

Flows by Investment Objective:
U.S. Equity and Hybrid
111. Sales and redemptions as a percentage of beginning assets under management are annualized.
% of Beg.
AUM1
Prior 4
Quarters Avg.
Current
Quarter
Sales 14% 14%
Redemptions 24% 29%
% of Beg.
AUM1
Prior 4
Quarters Avg.
Current
Quarter
Sales 11% 12%
Redemptions 20% 20%
(in US$ billions, for the three months ended)
U.S. Equity Hybrid
3.5 3.1
3.6 3.5 3.7
(7.0)
(5.5)(5.2)
(6.4)
(7.5)
1.2
(2.2)
(0.9)(2.1)
(0.5)
12/15 3/16 6/16 9/16 12/16
4.0 3.9 3.6 2.8
4.0
(9.2)
(6.8)(5.8)
(5.0)
(6.7)
(3.7)
(1.7)
(0.6) (1.1)(1.2)
12/15 3/16 6/16 9/16 12/16
Net Flows Long-Term Sales Long-Term Redemptions

Flows by Investment Objective:
Tax-Free and Taxable U.S. Fixed Income
121. Sales and redemptions as a percentage of beginning assets under management are annualized.
% of Beg.
AUM1
Prior 4
Quarters Avg.
Current
Quarter
Sales 12% 12%
Redemptions 12% 19%
% of Beg.
AUM1
Prior 4
Quarters Avg.
Current
Quarter
Sales 16% 19%
Redemptions 29% 29%
(in US$ billions, for the three months ended)
Tax-Free Fixed Income Taxable U.S. Fixed Income
1.7 2.2 2.4 2.6
2.2
(2.2) (2.3) (2.2) (2.1)
(3.7)
0.3 0.6 0.9 1.1
(1.5)
12/15 3/16 6/16 9/16 12/16
2.3 1.9 1.9
2.6 2.6
(4.6)(4.1)
(3.7)(3.4)
(3.9)
(2.1) (2.0)
(1.3)
(0.4)(0.8)
12/15 3/16 6/16 9/16 12/16
Net Flows Long-Term Sales Long-Term Redemptions

Financial Results
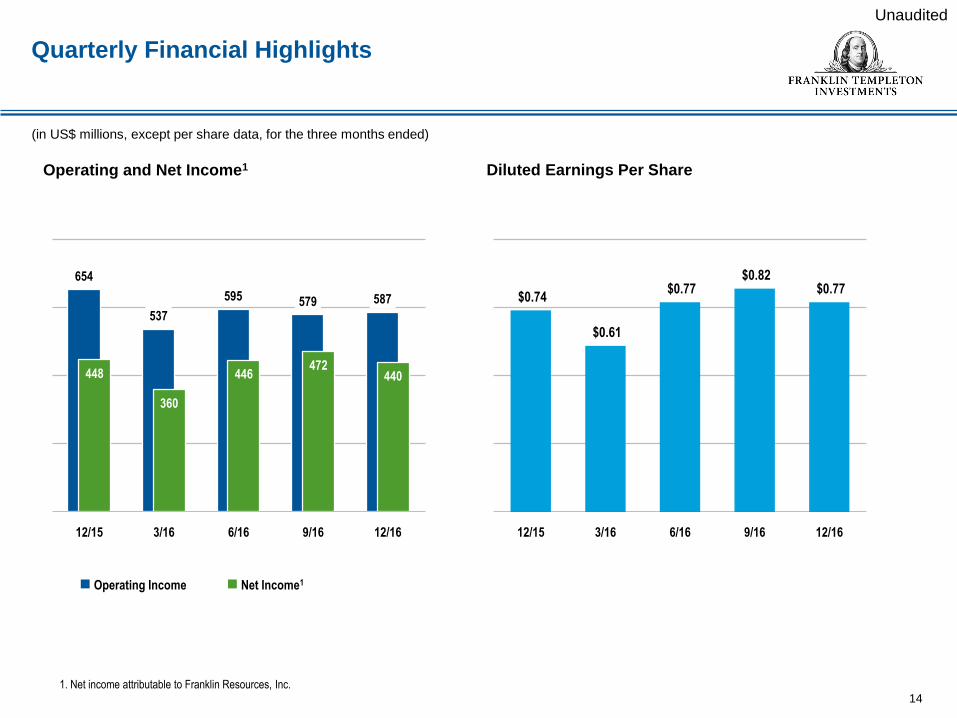
Quarterly Financial Highlights
14
1. Net income attributable to Franklin Resources, Inc.
Operating Income Net Income1
(in US$ millions, except per share data, for the three months ended)
Unaudited
Operating and Net Income1 Diluted Earnings Per Share
654
537
595 579 587
448
360
446472
440
12/15 3/16 6/16 9/16 12/16
$0.74
$0.61
$0.77 $0.82
$0.77
12/15 3/16 6/16 9/16 12/16

Operating Revenues
15
Unaudited
(in US$ millions, for the three months ended)
Dec-16 Sep-16Dec-16 vs.
Sep-16Jun-16 Mar-16 Dec-15
Dec-16 vs.
Dec-15
Investment management fees $ 1,063.2 $ 1,096.3 (3%) $ 1,093.5 $ 1,095.2 $ 1,186.7 (10%)
Sales and distribution fees 419.3 440.8 (5%) 450.2 437.0 478.4 (12%)
Shareholder servicing fees 56.6 58.4 (3%) 61.5 61.8 61.9 (9%)
Other 21.7 16.3 33% 29.1 19.9 31.0 (30%)
Total Operating Revenues $ 1,560.8 $ 1,611.8 (3%) $ 1,634.3 $ 1,613.9 $ 1,758.0 (11%)
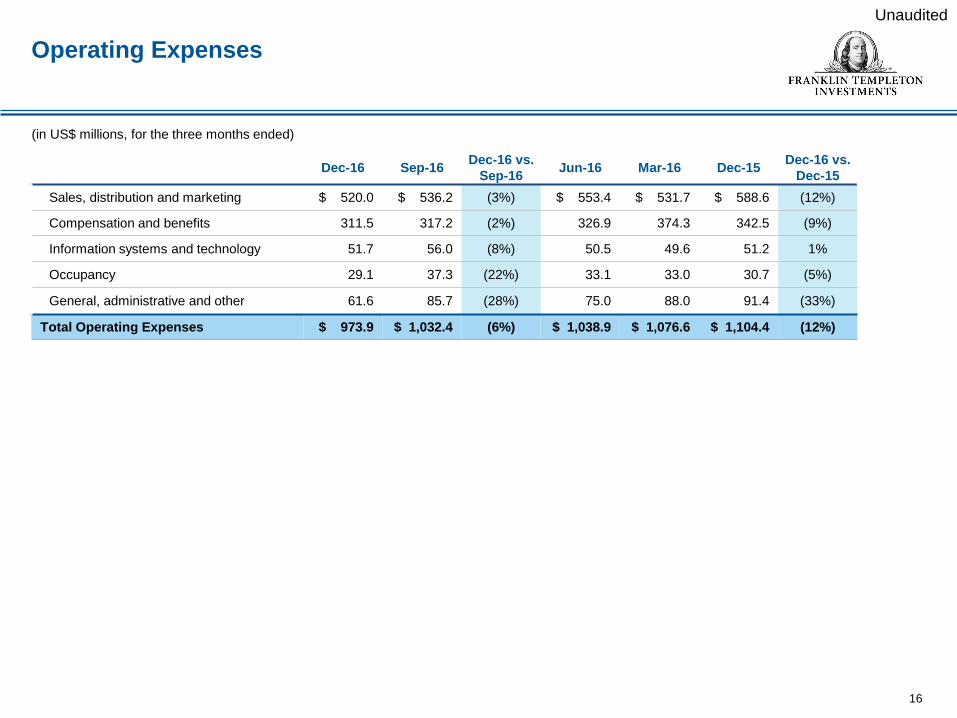
Operating Expenses
16
Unaudited
(in US$ millions, for the three months ended)
Dec-16 Sep-16Dec-16 vs.
Sep-16Jun-16 Mar-16 Dec-15
Dec-16 vs.
Dec-15
Sales, distribution and marketing $ 520.0 $ 536.2 (3%) $ 553.4 $ 531.7 $ 588.6 (12%)
Compensation and benefits 311.5 317.2 (2%) 326.9 374.3 342.5 (9%)
Information systems and technology 51.7 56.0 (8%) 50.5 49.6 51.2 1%
Occupancy 29.1 37.3 (22%) 33.1 33.0 30.7 (5%)
General, administrative and other 61.6 85.7 (28%) 75.0 88.0 91.4 (33%)
Total Operating Expenses $ 973.9 $ 1,032.4 (6%) $ 1,038.9 $ 1,076.6 $ 1,104.4 (12%)

Operating Leverage
17
Unaudited
1. Fiscal year-to-date operating income is annualized for CAGR calculation. CAGR is the compound average annual growth rate over the trailing 10-year period.
2,068 2,099 1,203 1,959 2,660 2,515 2,921 3,221 3,028 2,366 587
Fiscal Year
Operating Income
(in US$ millions)
Average AUM: 2.2% CAGR
Operating Income1: 1.3%
CAGR
Operating Margin (%) vs. Average AUM (in US$ billions for the fiscal year ended)
Operating Margin Average AUM
582 605
442
571
694 706
808
888 870
749 723
33.3%
34.8%
28.7%
33.5%
37.3%
35.4%
36.6% 37.9% 38.1%
35.7%37.6%
09/07 09/08 09/09 09/10 09/11 09/12 09/13 09/14 09/15 09/16 FYTD12/16
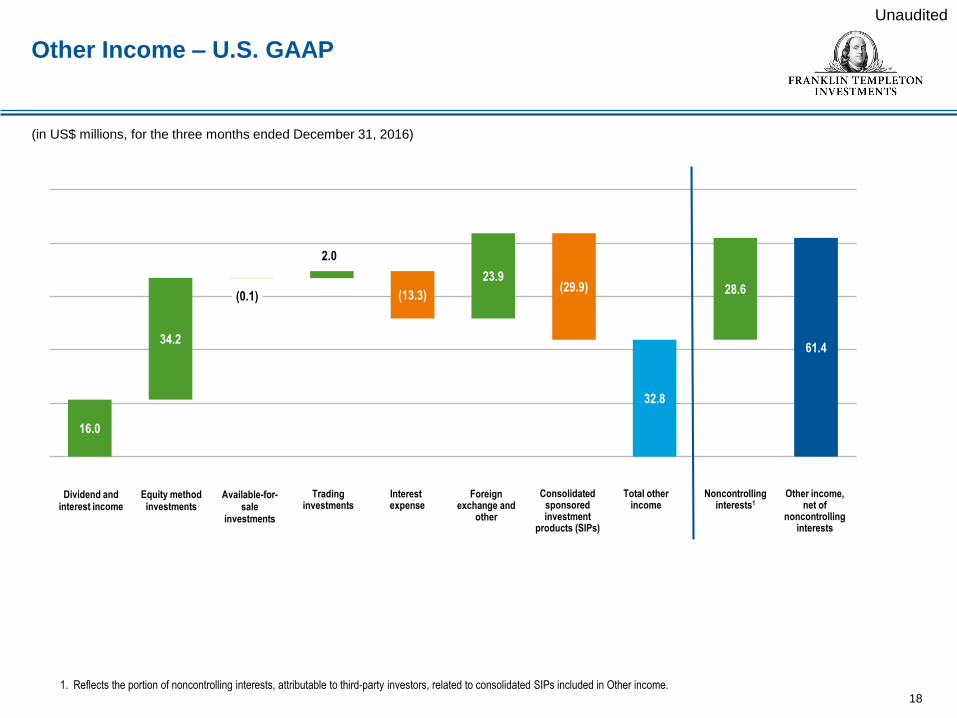
16.0
34.2
(0.1)
2.0
(13.3)
23.9(29.9)
32.8
28.6
61.4
181. Reflects the portion of noncontrolling interests, attributable to third-party investors, related to consolidated SIPs included in Other income.
Dividend and interest income
Equity method investments
Available-for-sale
investments
Trading investments
Interestexpense
Foreign exchange and
other
Consolidated sponsored investment
products (SIPs)
Total other income
Noncontrolling interests1
Other income, net of
noncontrolling interests
Unaudited
(in US$ millions, for the three months ended December 31, 2016)
Other Income – U.S. GAAP

Capital Management
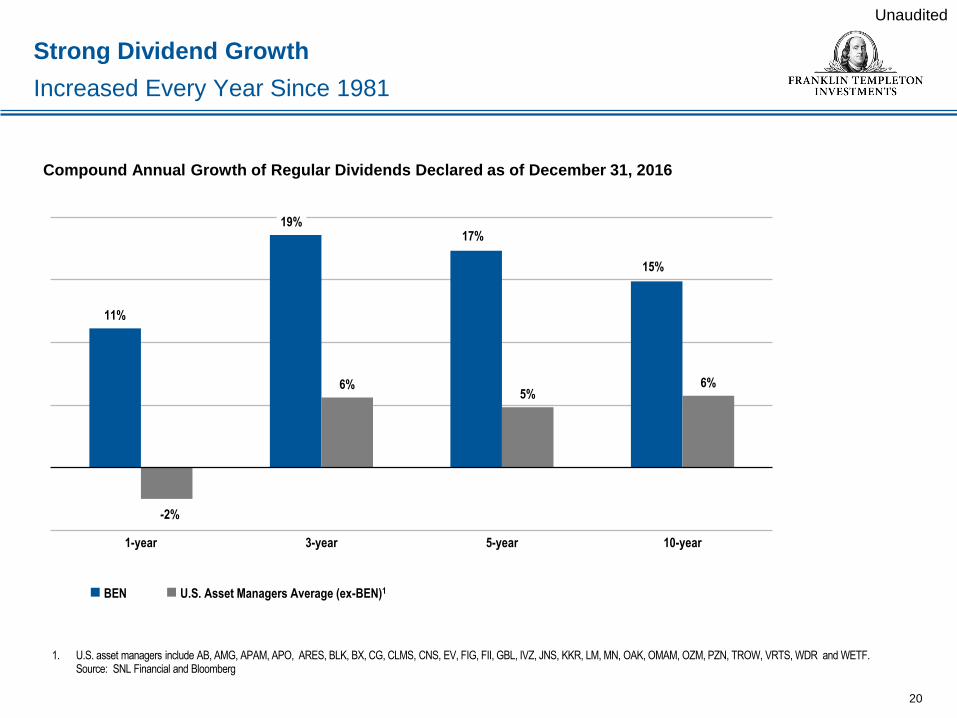
Strong Dividend Growth
Increased Every Year Since 1981
20
Unaudited
Compound Annual Growth of Regular Dividends Declared as of December 31, 2016
BEN U.S. Asset Managers Average (ex-BEN)1
1. U.S. asset managers include AB, AMG, APAM, APO, ARES, BLK, BX, CG, CLMS, CNS, EV, FIG, FII, GBL, IVZ, JNS, KKR, LM, MN, OAK, OMAM, OZM, PZN, TROW, VRTS, WDR and WETF. Source: SNL Financial and Bloomberg
11%
19%17%
15%
-2%
6%5%
6%
1-year 3-year 5-year 10-year

262256
327337
404
500
218190
151178
129179
137
265
105
23
9899
282
126
291
$0
$10
$20
$30
$40
$50
$60
12/166/1612/156/1512/146/1412/136/1312/126/1212/11
Share Repurchase Amount BEN Average Price for the Period Special Cash Dividend Declared
U.S. Asset Managers (ex-
BEN)1: 2.5% Compound
Annual Dilution
Share Repurchases
Accretive to Earnings per Share
21
1. U.S. asset managers include AB, AMG, APAM, APO, ARES, BLK, BX, CG, CLMS, CNS, EV, FIG, FII, GBL, IVZ, JNS, KKR, LM, MN, OAK, OMAM, OZM, PZN, TROW, VRTS, WDR and WETF. Source: Thomson Reuters and company reports.
BEN U.S. Asset Managers Average (ex-BEN)1
Unaudited
Change in Ending Shares Outstanding
Share Repurchases (US$ millions) vs. Average BEN Price
BEN: 2.7% Compound
Annual Accretion
Special Cash Dividends
per Share Declared:
Dec-14: $0.50
Nov-12: $1.00
Dec-11: $0.67
Dec-09: $1.00
-20%
-15%
-10%
-5%
0%
5%
10%
15%
20%
12/11 6/12 12/12 6/13 12/13 6/14 12/14 6/15 12/15 6/16 12/16

Return of Capital
Distributing U.S. Free Cash Flow
Unaudited
Trailing 12 Months Share Repurchases and Dividends1 (US$ millions and percentage of net income)
Dividends Share Repurchases
22
1. The chart above illustrates the amount of share repurchases and dividends over the trailing 12 months, for the period ended. Dividend payout is calculated as dividend amount declared divided by net income attributable to Franklin Resources, Inc. for the trailing 12-month period. Repurchase payout is calculated as stock repurchase amount divided by net income attributable to Franklin Resources, Inc. for the trailing 12-month period.
20% 24% 25% 24% 25%
68%87%
97%77%
69%
$1,696
$1,856
$1,977
$1,745
$1,608
12/15 3/16 6/16 9/16 12/16

Appendix

Strong Balance Sheet
Unaudited
Net Cash and Investments1 (US$ billions)
241. Net cash and investments consists of Franklin Resources, Inc. cash and investments (including only direct investments in consolidated SIPs), net of debt and deposits.
U.S. Net Cash and Investments Non-U.S. Net Cash and Investments
0.8 1.8 1.7 1.2
9.7
6.5
7.4 7.9 8.5
7.3
9.29.6 9.7 9.7
FYE-9/13 FYE-9/14 FYE-9/15 FYE-9/16 12/16
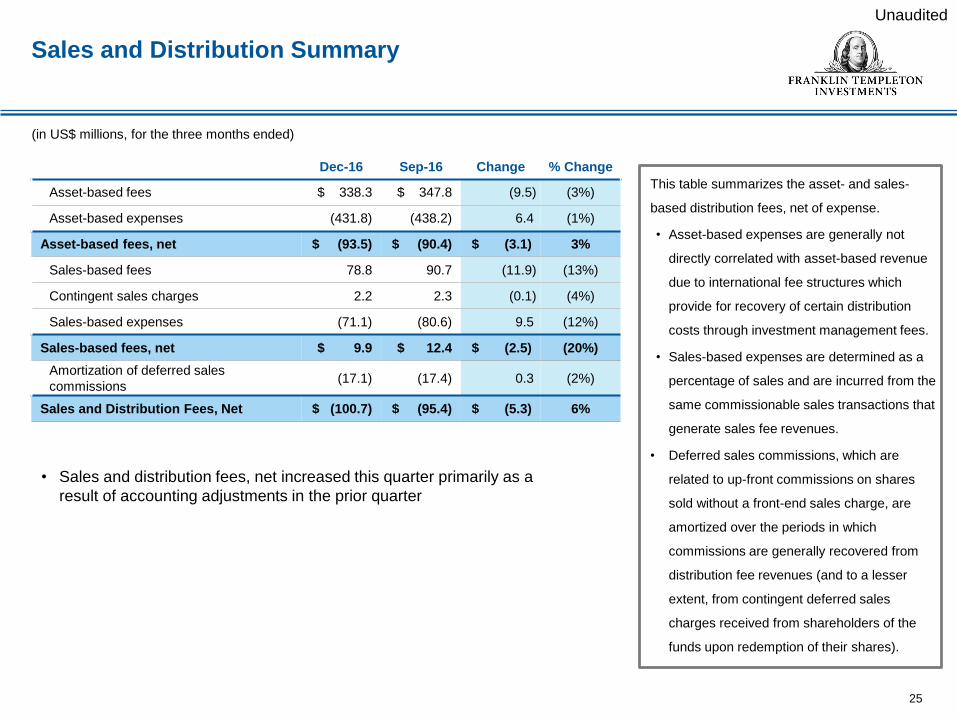
Sales and Distribution Summary
This table summarizes the asset- and sales-
based distribution fees, net of expense.
• Asset-based expenses are generally not
directly correlated with asset-based revenue
due to international fee structures which
provide for recovery of certain distribution
costs through investment management fees.
• Sales-based expenses are determined as a
percentage of sales and are incurred from the
same commissionable sales transactions that
generate sales fee revenues.
• Deferred sales commissions, which are
related to up-front commissions on shares
sold without a front-end sales charge, are
amortized over the periods in which
commissions are generally recovered from
distribution fee revenues (and to a lesser
extent, from contingent deferred sales
charges received from shareholders of the
funds upon redemption of their shares).
25
Unaudited
(in US$ millions, for the three months ended)
• Sales and distribution fees, net increased this quarter primarily as a
result of accounting adjustments in the prior quarter
Dec-16 Sep-16 Change % Change
Asset-based fees $ 338.3 $ 347.8 (9.5) (3%)
Asset-based expenses (431.8) (438.2) 6.4 (1%)
Asset-based fees, net $ (93.5) $ (90.4) $ (3.1) 3%
Sales-based fees 78.8 90.7 (11.9) (13%)
Contingent sales charges 2.2 2.3 (0.1) (4%)
Sales-based expenses (71.1) (80.6) 9.5 (12%)
Sales-based fees, net $ 9.9 $ 12.4 $ (2.5) (20%)
Amortization of deferred sales
commissions(17.1) (17.4) 0.3 (2%)
Sales and Distribution Fees, Net $ (100.7) $ (95.4) $ (5.3) 6%
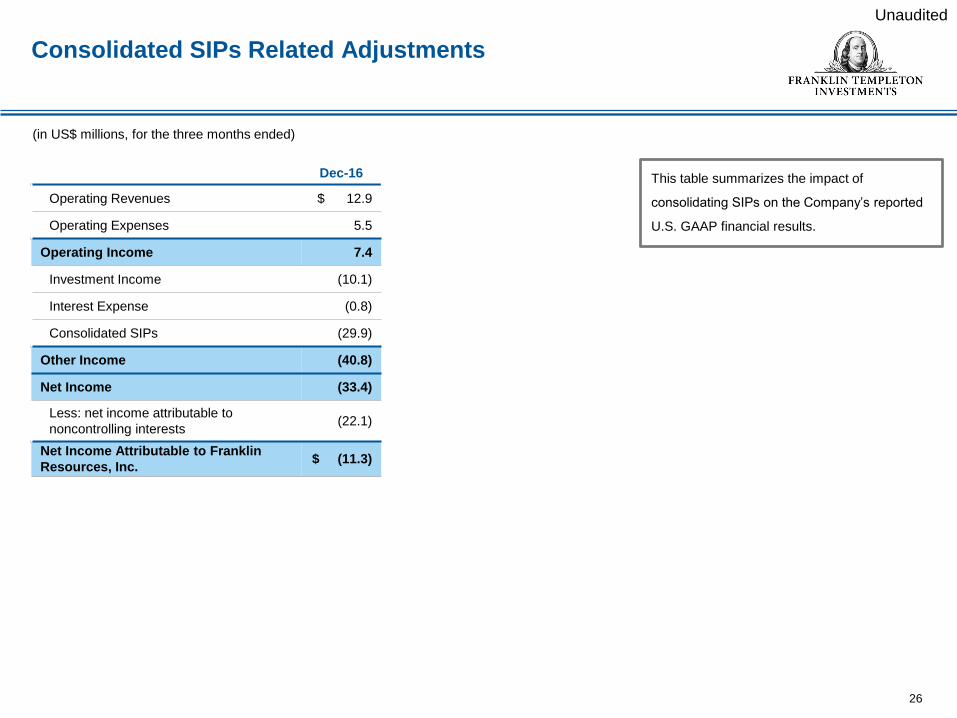
Consolidated SIPs Related Adjustments
26
Unaudited
(in US$ millions, for the three months ended)
This table summarizes the impact of
consolidating SIPs on the Company’s reported
U.S. GAAP financial results.
Dec-16
Operating Revenues $ 12.9
Operating Expenses 5.5
Operating Income 7.4
Investment Income (10.1)
Interest Expense (0.8)
Consolidated SIPs (29.9)
Other Income (40.8)
Net Income (33.4)
Less: net income attributable to
noncontrolling interests(22.1)
Net Income Attributable to Franklin
Resources, Inc.$ (11.3)