Embed Size (px)
Citation preview
Interim report January-September 2015 Fortum Corporation
22 October 2015
2
Disclaimer
This presentation does not constitute an invitation to underwrite, subscribe for,
or otherwise acquire or dispose of any Fortum shares
Past performance is no guide to future performance, and persons needing
advice should consult an independent financial adviser
IFRS restatement relating to discontinued operations
Distribution segment has been reclassified as discontinued operations in Q1/2015.
As a result, continuing operations and discontinued operations are presented
separately for Fortum Group. Comparative period information for 2014 has been
restated accordingly
Restated information for the interim periods of 2014 can be found in a stock
exchange release published 15 April 2015
3
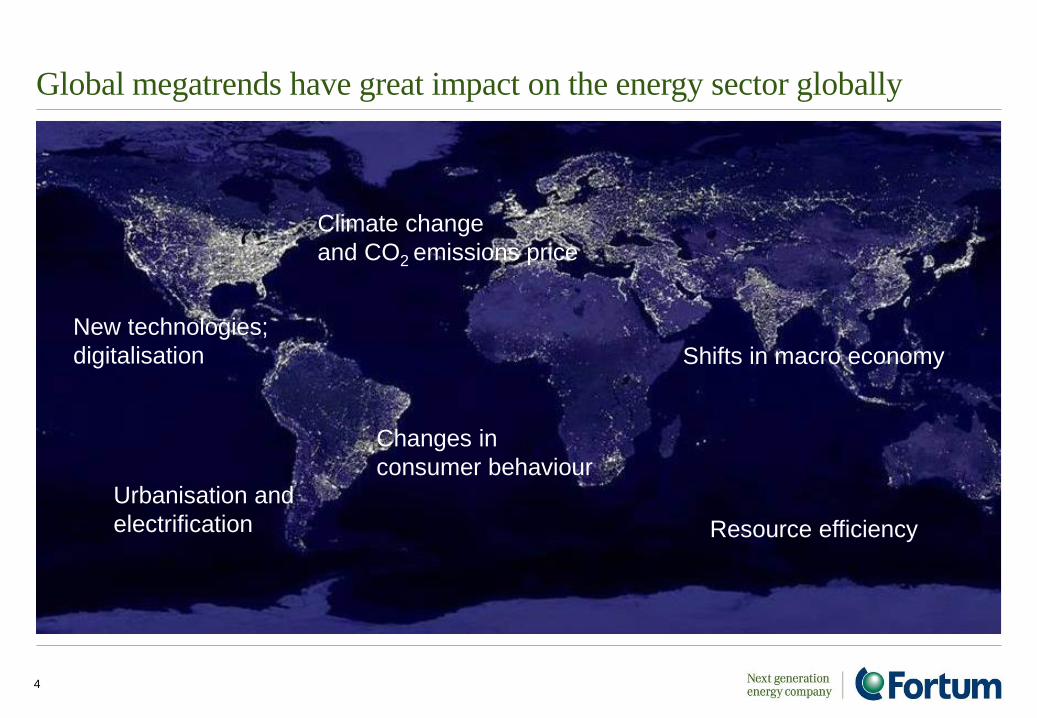
Global megatrends have great impact on the energy sector globally
Climate change
and CO2 emissions price
Shifts in macro economy
New technologies;
digitalisation
Changes in
consumer behaviour
4
Resource efficiency
Urbanisation and
electrification
VISION – STRATEGY – STRUCTURE
More concrete actions communicated at the full year release
Focus currently in strategic planning in order to decide our future direction
5
Future direction
• Decide the best way to increase investments in renewables
• Look for ways to grow faster in modern energy services for consumers, communities and businesses
• Keep our eyes open for opportunities as the restructuring of the energy industry proceeds
Operational excellence
• Further increase the productivity of our existing fleet in order to keep it competitive in the current low-
price environment
Q3 2015 Results
6
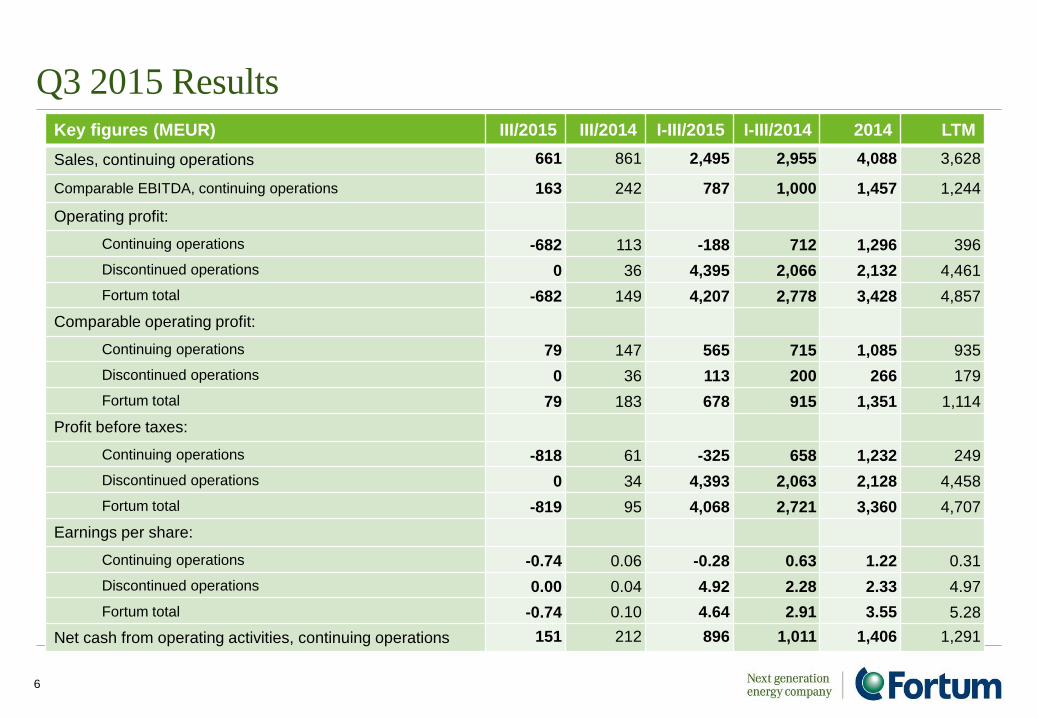
Key figures (MEUR) III/2015 III/2014 I-III/2015 I-III/2014 2014 LTM
Sales, continuing operations 661 861 2,495 2,955 4,088 3,628
Comparable EBITDA, continuing operations 163 242 787 1,000 1,457 1,244
Operating profit:
Continuing operations -682 113 -188 712 1,296 396
Discontinued operations 0 36 4,395 2,066 2,132 4,461
Fortum total -682 149 4,207 2,778 3,428 4,857
Comparable operating profit:
Continuing operations 79 147 565 715 1,085 935
Discontinued operations 0 36 113 200 266 179
Fortum total 79 183 678 915 1,351 1,114
Profit before taxes:
Continuing operations -818 61 -325 658 1,232 249
Discontinued operations 0 34 4,393 2,063 2,128 4,458
Fortum total -819 95 4,068 2,721 3,360 4,707
Earnings per share:
Continuing operations -0.74 0.06 -0.28 0.63 1.22 0.31
Discontinued operations 0.00 0.04 4.92 2.28 2.33 4.97
Fortum total -0.74 0.10 4.64 2.91 3.55 5.28
Net cash from operating activities, continuing operations 151 212 896 1,011 1,406 1,291
Summary of the third quarter 2015
• Fortum’s results burdened by
– The decision of early closure of nuclear units 1 and 2 in Oskarshamn, Sweden
– Continued pressure on electricity prices
• Exceptionally high inflow due to late snow melt created pressure on electricity prices particurlarily in Sweden
and Norway. The price in Finland decreased less, as the price area is exposed to a much lesser extent, to
hydrological pressure
• Record high hydroproduction
• Decision to participate in the Fennovoima nuclear plant project in Finland with a 6.6%
share
• The targeted operating profit level (EBIT) for the Russia segment, RUB 18.2 billion is
delayed by 2 to 3 years. Previously this level was targeted to be reached during 2015
after finalising the investment programme
7
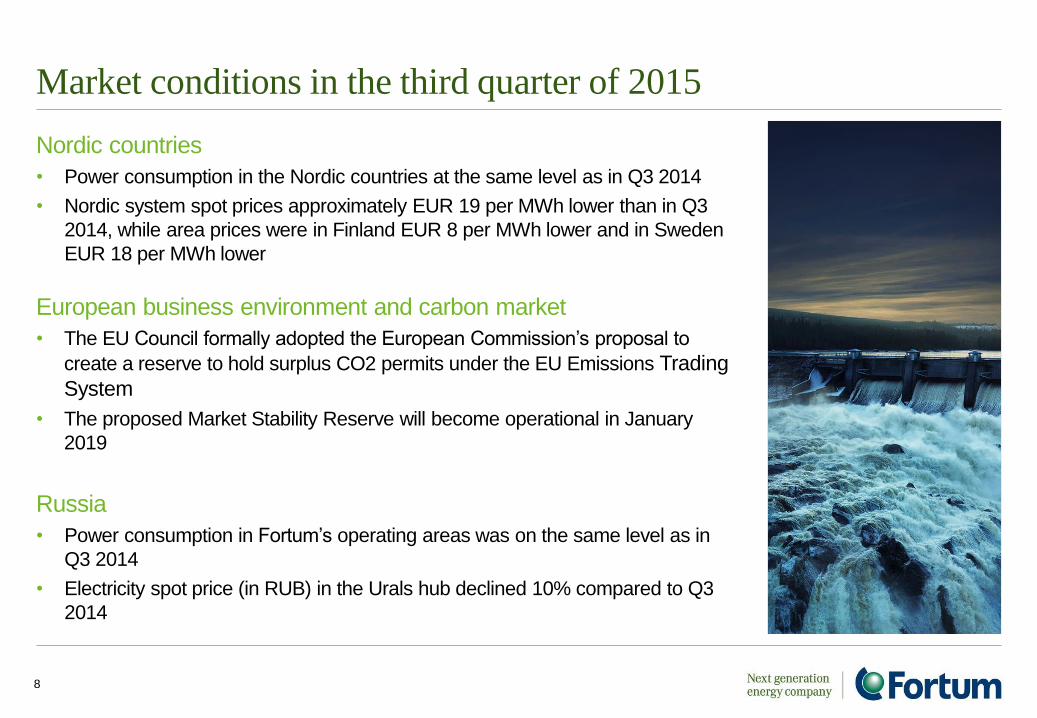
Market conditions in the third quarter of 2015
Nordic countries
• Power consumption in the Nordic countries at the same level as in Q3 2014
• Nordic system spot prices approximately EUR 19 per MWh lower than in Q3
2014, while area prices were in Finland EUR 8 per MWh lower and in Sweden
EUR 18 per MWh lower
European business environment and carbon market
• The EU Council formally adopted the European Commission’s proposal to
create a reserve to hold surplus CO2 permits under the EU Emissions Trading
System
• The proposed Market Stability Reserve will become operational in January
2019
Russia
• Power consumption in Fortum’s operating areas was on the same level as in
Q3 2014
• Electricity spot price (in RUB) in the Urals hub declined 10% compared to Q3
2014
8
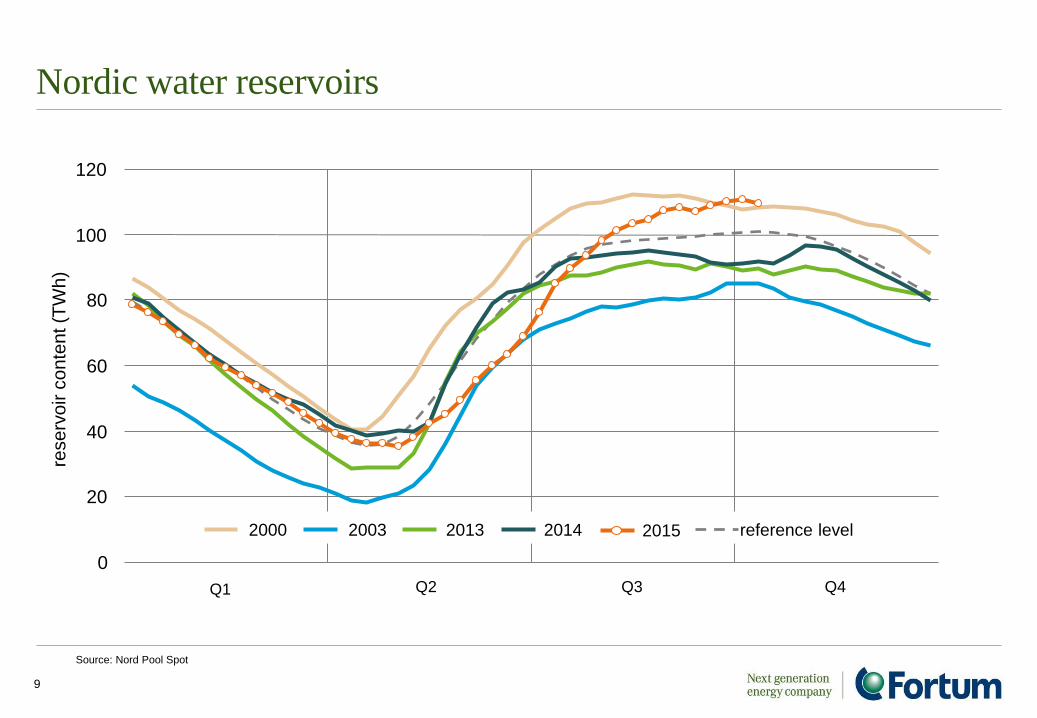
Nordic water reservoirs
9
Source: Nord Pool Spot
Q1 Q2 Q3 Q4
20
40
60
80
100
120
rese
rvo
ir c
on
ten
t (T
Wh)
0
2000 2003 2014 2013 reference level 2015
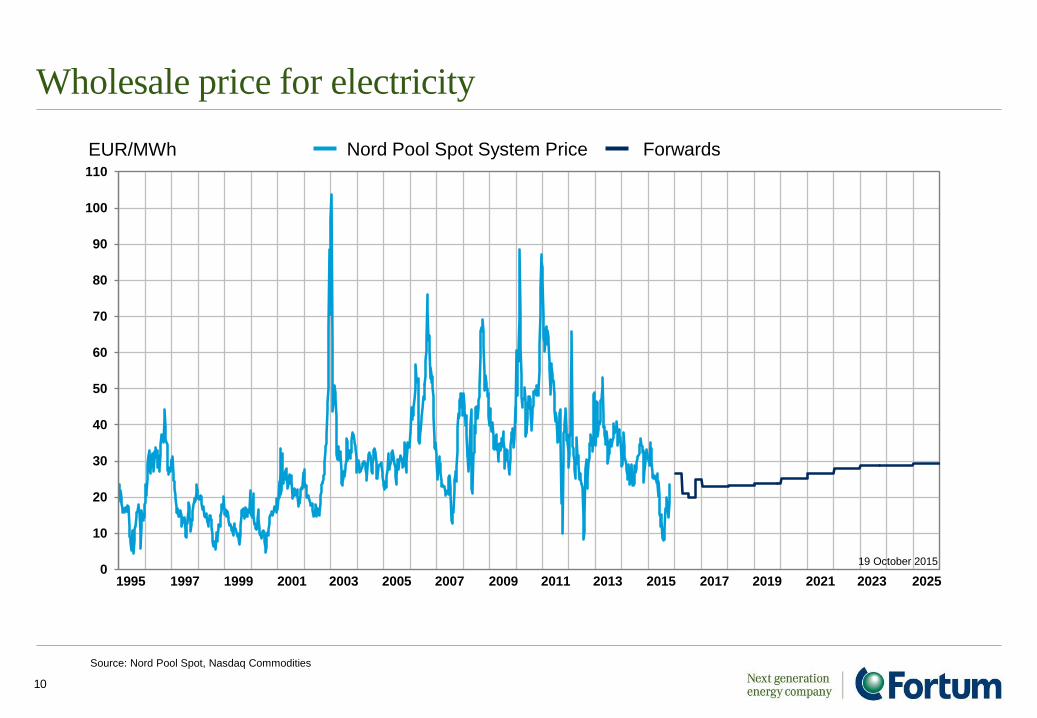
Wholesale price for electricity
10
Source: Nord Pool Spot, Nasdaq Commodities
0
10
20
30
40
50
60
70
80
90
100
110
EUR/MWh Nord Pool Spot System Price Forwards
19 October 2015
1995 1997 1999 2001 2003 2005 2007 2009 2011 2013 2015 2017 2019 2021 2023 2025
0
30
60
90
120
150
US
D /
bb
l
Crude oil price (ICE Brent)
2007 2008 20112009 2010 20132012 2014 2015 20160
7
14
21
28
35
EU
R /
tC
O2
CO2 price (ICE EUA)
2007 2008 20112009 2010 20132012 2014 2015 2016
0
50
100
150
200
250
US
D /
t
Coal price (ICE Rotterdam)
2007 2008 20112009 2010 20132012 2014 2015 20160
20
40
60
80
100
GB
p /
th
erm
Gas price (ICE NBP)
2007 2008 20112009 2010 20132012 2014 2015 2016
11
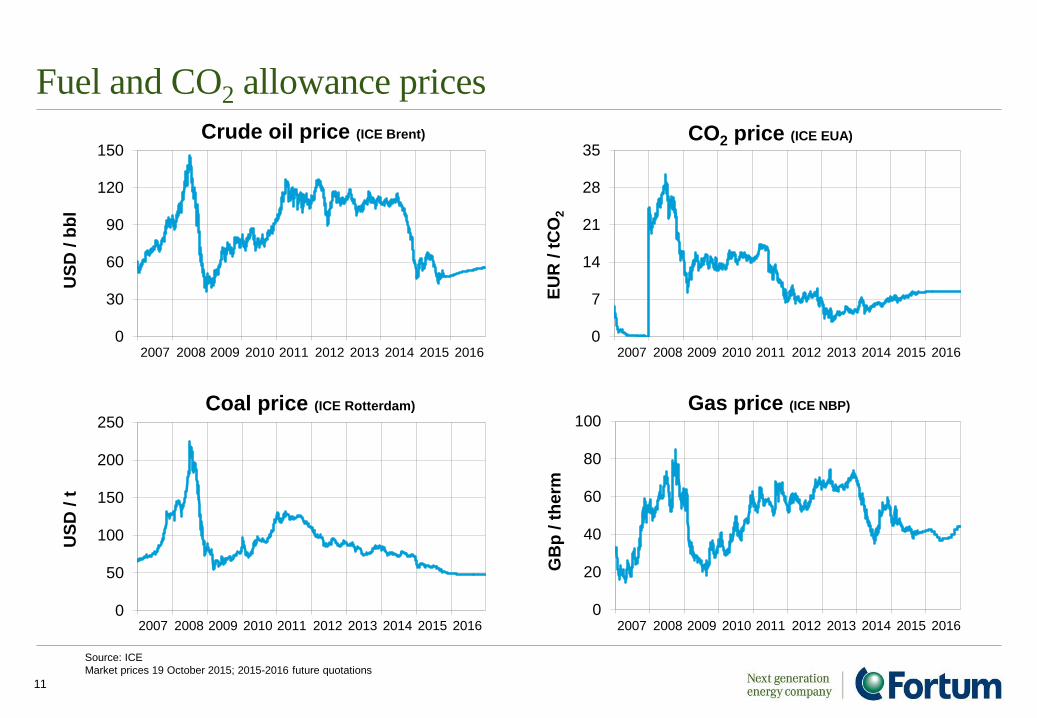
Source: ICE
Market prices 19 October 2015; 2015-2016 future quotations
Fuel and CO2 allowance prices
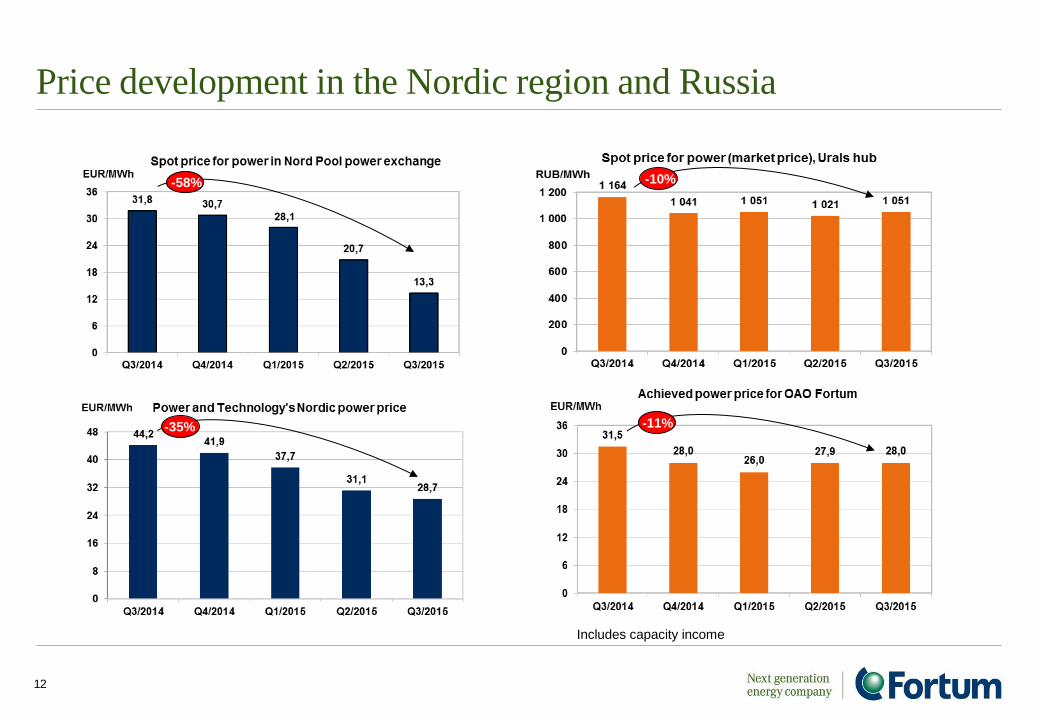
Price development in the Nordic region and Russia
12
Includes capacity income
-58%
-35% -11%
-10%
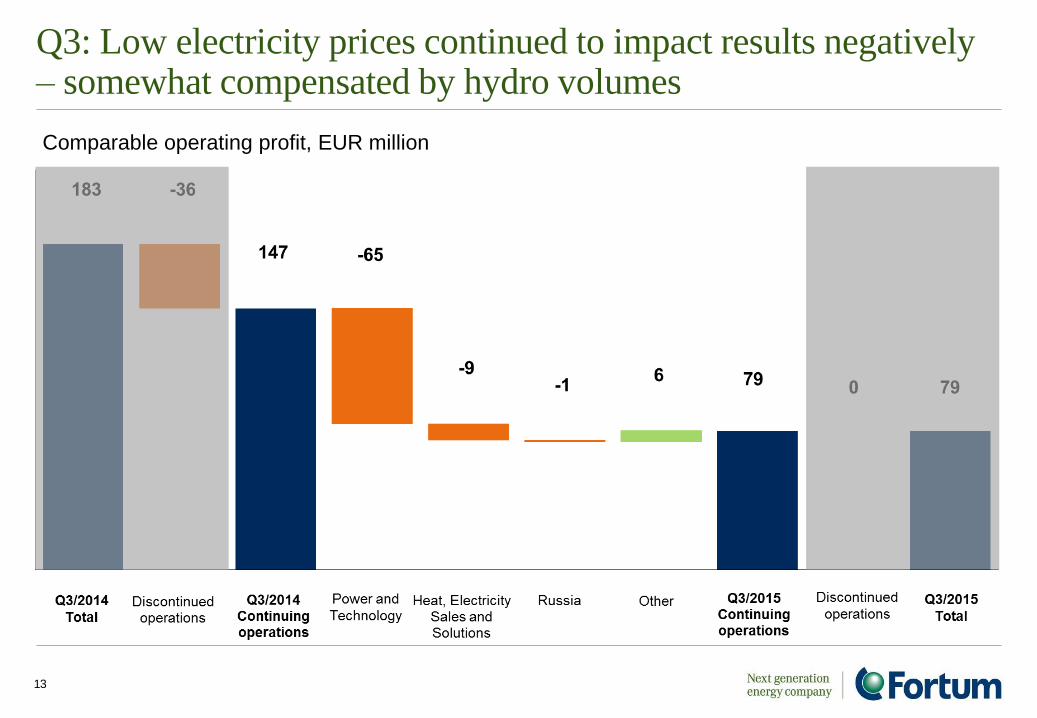
Q3: Low electricity prices continued to impact results negatively – somewhat compensated by hydro volumes
13
Comparable operating profit, EUR million
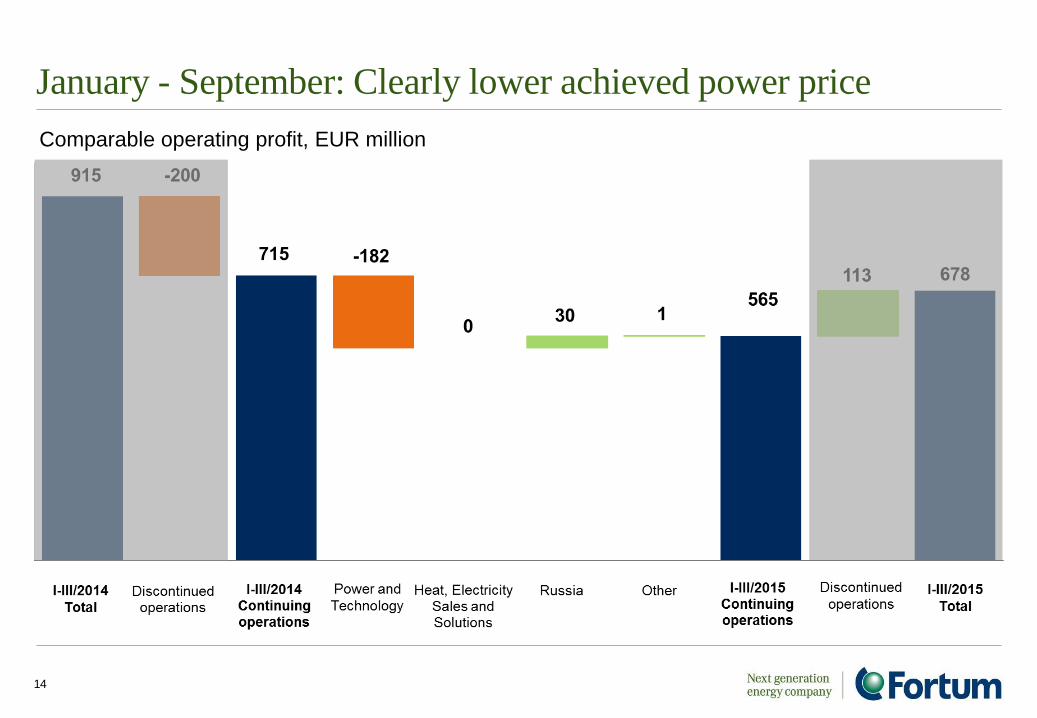
January - September: Clearly lower achieved power price
14
Comparable operating profit, EUR million
Financials
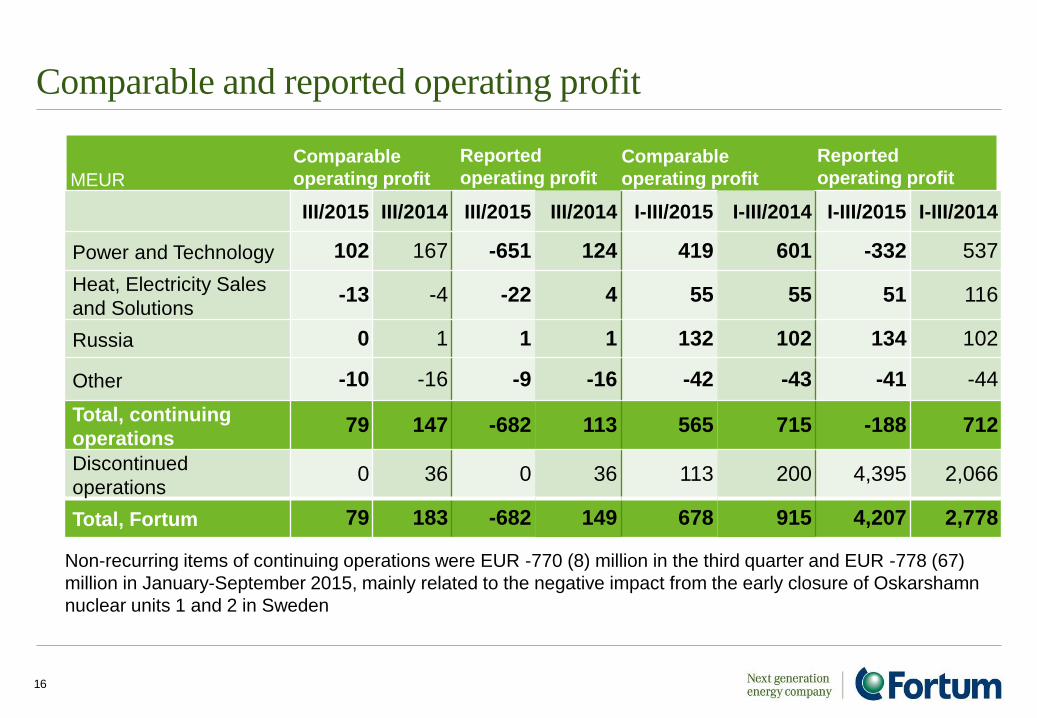
Comparable and reported operating profit
III/2015 III/2014 III/2015 III/2014 I-III/2015 I-III/2014 I-III/2015 I-III/2014
Power and Technology 102 167 -651 124 419 601 -332 537
Heat, Electricity Sales
and Solutions -13 -4 -22 4 55 55 51 116
Russia 0 1 1 1 132 102 134 102
Other -10 -16 -9 -16 -42 -43 -41 -44
Total, continuing
operations 79 147 -682 113 565 715 -188 712
Discontinued
operations 0 36 0 36 113 200 4,395 2,066
Total, Fortum 79 183 -682 149 678 915 4,207 2,778
16
Comparable
operating profit
Reported
operating profit MEUR
Non-recurring items of continuing operations were EUR -770 (8) million in the third quarter and EUR -778 (67)
million in January-September 2015, mainly related to the negative impact from the early closure of Oskarshamn
nuclear units 1 and 2 in Sweden
Reported
operating profit Comparable
operating profit
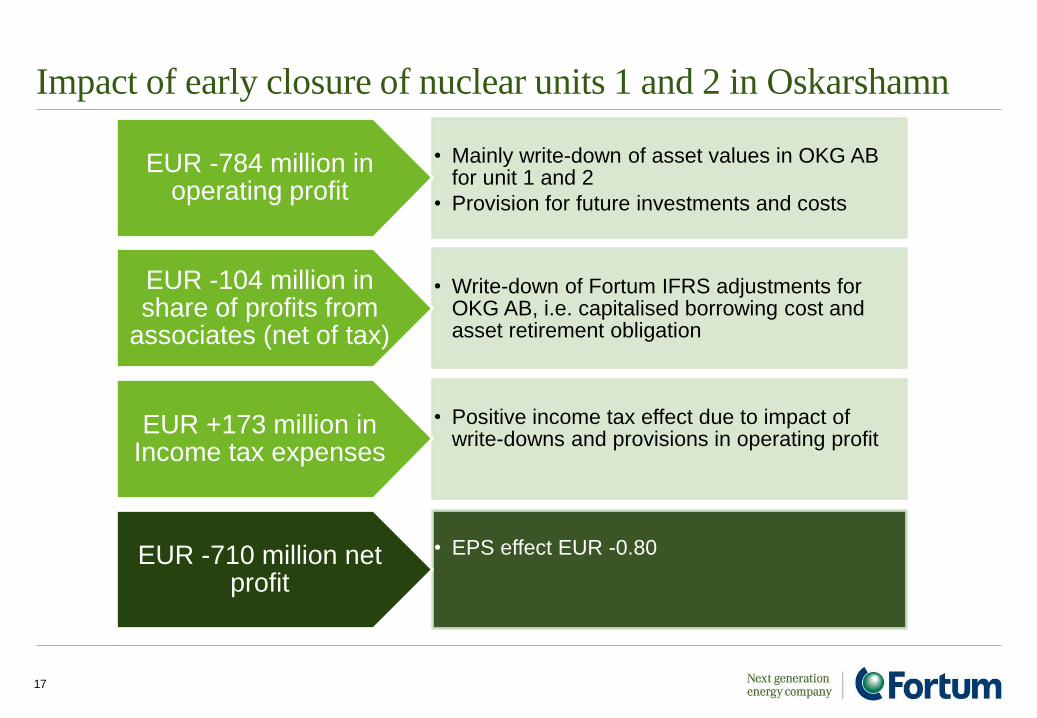
Impact of early closure of nuclear units 1 and 2 in Oskarshamn
17
• Mainly write-down of asset values in OKG AB for unit 1 and 2
• Provision for future investments and costs
EUR -784 million in operating profit
• Write-down of Fortum IFRS adjustments for OKG AB, i.e. capitalised borrowing cost and asset retirement obligation
EUR -104 million in share of profits from
associates (net of tax)
• Positive income tax effect due to impact of write-downs and provisions in operating profit
EUR +173 million in Income tax expenses
• EPS effect EUR -0.80 EUR -710 million net profit
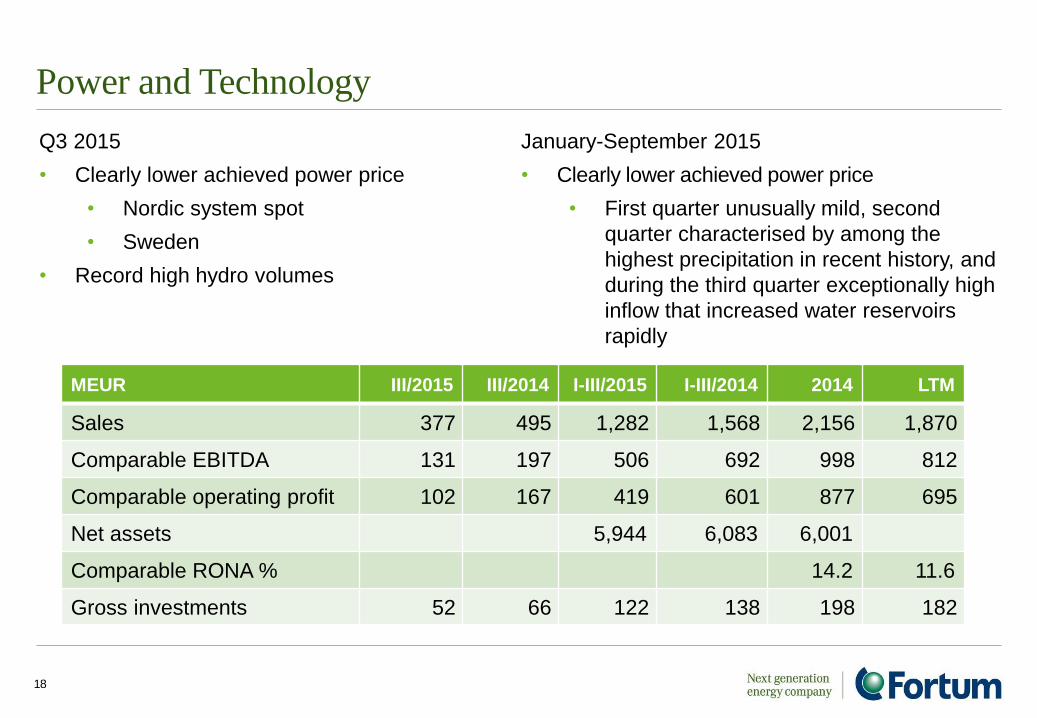
Power and Technology
MEUR III/2015 III/2014 I-III/2015 I-III/2014 2014 LTM
Sales 377 495 1,282 1,568 2,156 1,870
Comparable EBITDA 131 197 506 692 998 812
Comparable operating profit 102 167 419 601 877 695
Net assets 5,944 6,083 6,001
Comparable RONA % 14.2 11.6
Gross investments 52 66 122 138 198 182
18
Q3 2015
• Clearly lower achieved power price
• Nordic system spot
• Sweden
• Record high hydro volumes
January-September 2015
• Clearly lower achieved power price
• First quarter unusually mild, second
quarter characterised by among the
highest precipitation in recent history, and
during the third quarter exceptionally high
inflow that increased water reservoirs
rapidly
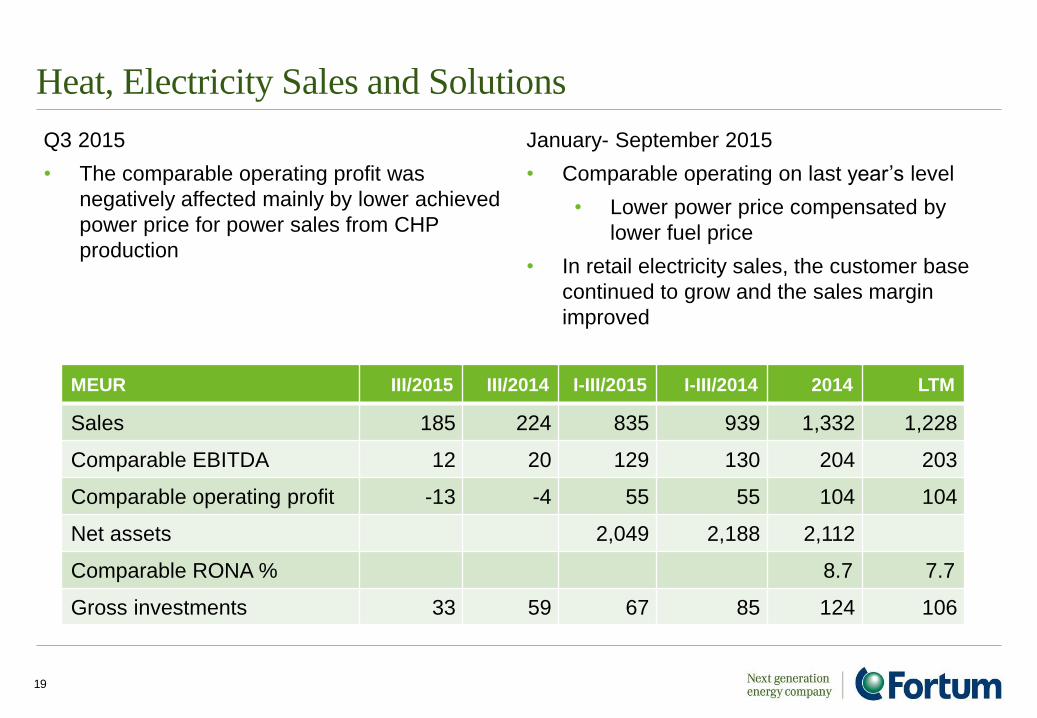
Heat, Electricity Sales and Solutions
MEUR III/2015 III/2014 I-III/2015 I-III/2014 2014 LTM
Sales 185 224 835 939 1,332 1,228
Comparable EBITDA 12 20 129 130 204 203
Comparable operating profit -13 -4 55 55 104 104
Net assets 2,049 2,188 2,112
Comparable RONA % 8.7 7.7
Gross investments 33 59 67 85 124 106
19
Q3 2015
• The comparable operating profit was
negatively affected mainly by lower achieved
power price for power sales from CHP
production
January- September 2015
• Comparable operating on last year’s level
• Lower power price compensated by
lower fuel price
• In retail electricity sales, the customer base
continued to grow and the sales margin
improved
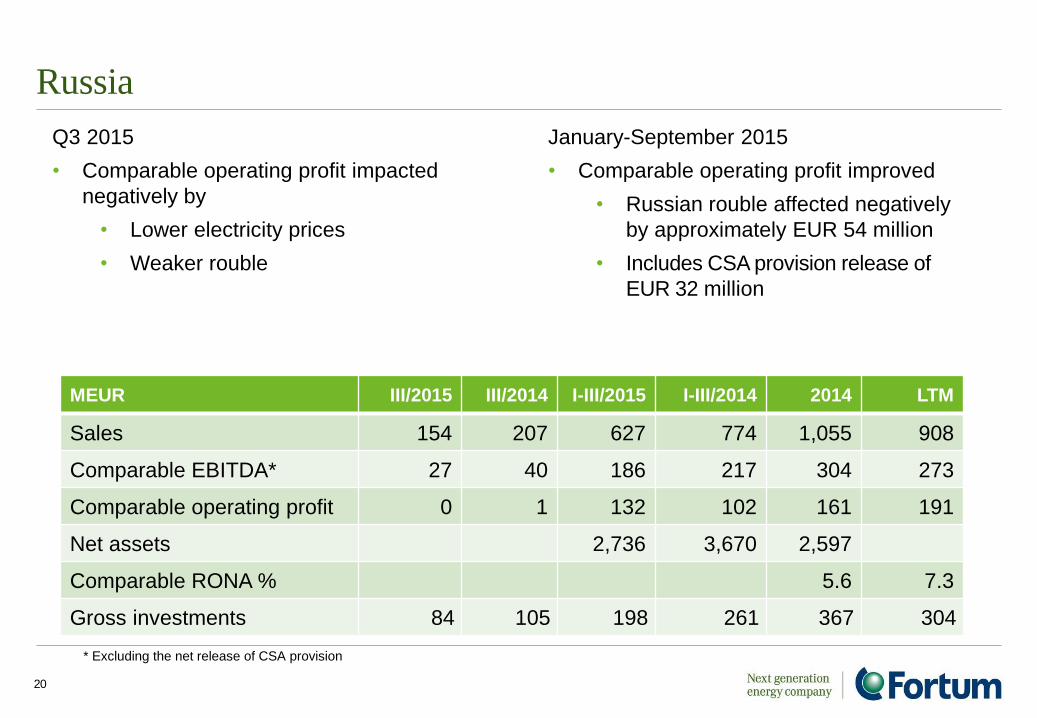
Russia
Q3 2015
• Comparable operating profit impacted
negatively by
• Lower electricity prices
• Weaker rouble
20
MEUR III/2015 III/2014 I-III/2015 I-III/2014 2014 LTM
Sales 154 207 627 774 1,055 908
Comparable EBITDA* 27 40 186 217 304 273
Comparable operating profit 0 1 132 102 161 191
Net assets 2,736 3,670 2,597
Comparable RONA % 5.6 7.3
Gross investments 84 105 198 261 367 304
January-September 2015
• Comparable operating profit improved
• Russian rouble affected negatively
by approximately EUR 54 million
• Includes CSA provision release of
EUR 32 million
* Excluding the net release of CSA provision
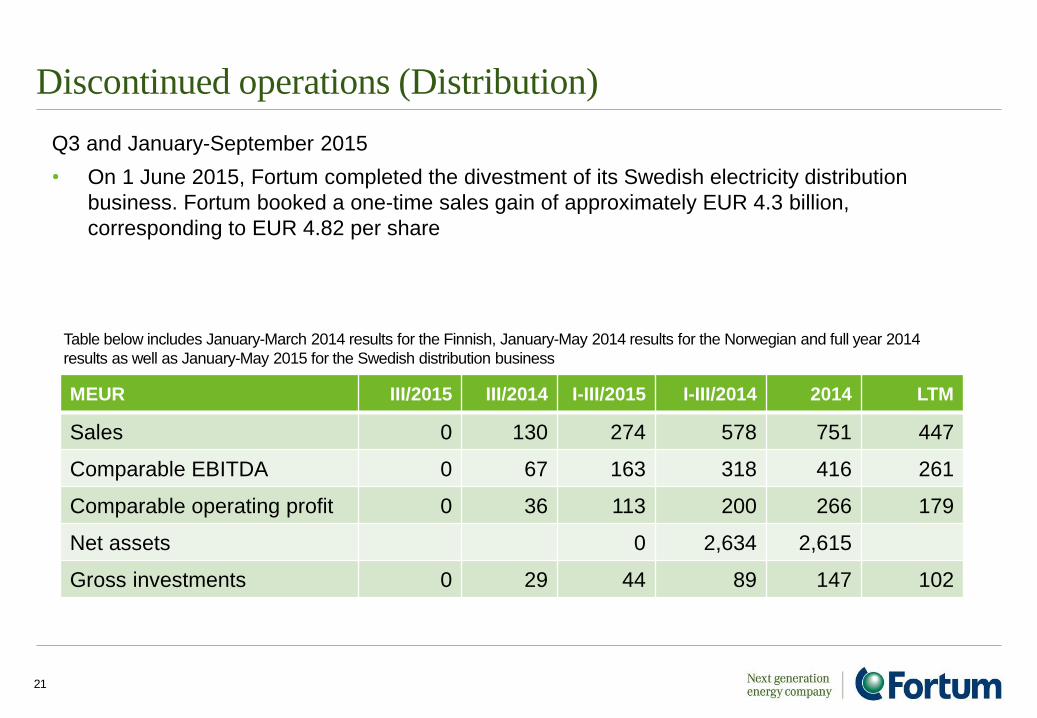
Discontinued operations (Distribution)
21
Q3 and January-September 2015
• On 1 June 2015, Fortum completed the divestment of its Swedish electricity distribution
business. Fortum booked a one-time sales gain of approximately EUR 4.3 billion,
corresponding to EUR 4.82 per share
Table below includes January-March 2014 results for the Finnish, January-May 2014 results for the Norwegian and full year 2014
results as well as January-May 2015 for the Swedish distribution business
MEUR III/2015 III/2014 I-III/2015 I-III/2014 2014 LTM
Sales 0 130 274 578 751 447
Comparable EBITDA 0 67 163 318 416 261
Comparable operating profit 0 36 113 200 266 179
Net assets 0 2,634 2,615
Gross investments 0 29 44 89 147 102
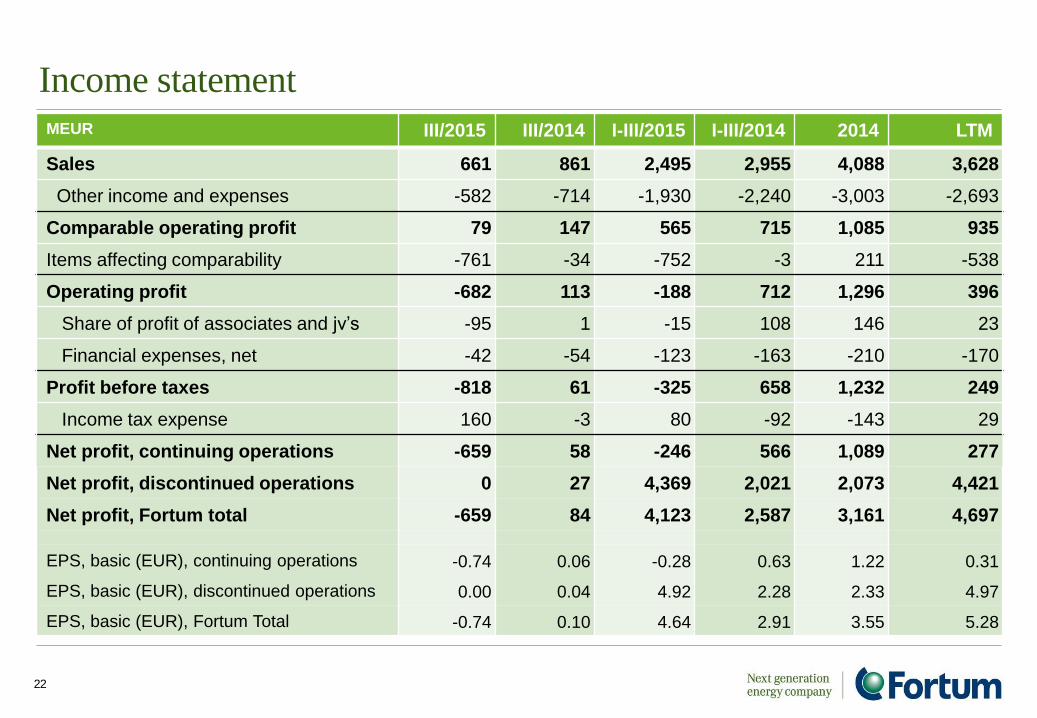
Income statement MEUR III/2015 III/2014 I-III/2015 I-III/2014 2014 LTM
Sales 661 861 2,495 2,955 4,088 3,628
Other income and expenses -582 -714 -1,930 -2,240 -3,003 -2,693
Comparable operating profit 79 147 565 715 1,085 935
Items affecting comparability -761 -34 -752 -3 211 -538
Operating profit -682 113 -188 712 1,296 396
Share of profit of associates and jv’s -95 1 -15 108 146 23
Financial expenses, net -42 -54 -123 -163 -210 -170
Profit before taxes -818 61 -325 658 1,232 249
Income tax expense 160 -3 80 -92 -143 29
Net profit, continuing operations -659 58 -246 566 1,089 277
Net profit, discontinued operations 0 27 4,369 2,021 2,073 4,421
Net profit, Fortum total -659 84 4,123 2,587 3,161 4,697
EPS, basic (EUR), continuing operations -0.74 0.06 -0.28 0.63 1.22 0.31
EPS, basic (EUR), discontinued operations 0.00 0.04 4.92 2.28 2.33 4.97
EPS, basic (EUR), Fortum Total -0.74 0.10 4.64 2.91 3.55 5.28
22
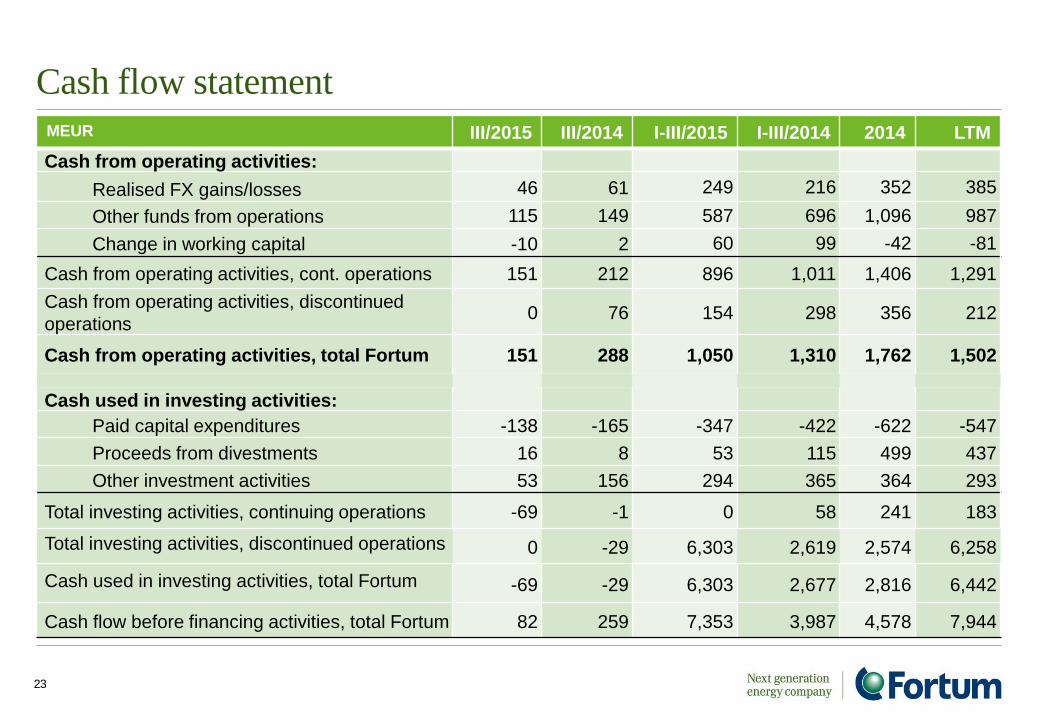
Cash flow statement
MEUR III/2015 III/2014 I-III/2015 I-III/2014 2014 LTM
Cash from operating activities:
Realised FX gains/losses 46 61 249 216 352 385
Other funds from operations 115 149 587 696 1,096 987
Change in working capital -10 2 60 99 -42 -81
Cash from operating activities, cont. operations 151 212 896 1,011 1,406 1,291
Cash from operating activities, discontinued
operations 0 76 154 298 356 212
Cash from operating activities, total Fortum 151 288 1,050 1,310 1,762 1,502
Cash used in investing activities:
Paid capital expenditures -138 -165 -347 -422 -622 -547
Proceeds from divestments 16 8 53 115 499 437
Other investment activities 53 156 294 365 364 293
Total investing activities, continuing operations -69 -1 0 58 241 183
Total investing activities, discontinued operations
0 -29 6,303 2,619 2,574 6,258
Cash used in investing activities, total Fortum
-69 -29 6,303 2,677 2,816 6,442
Cash flow before financing activities, total Fortum 82 259 7,353 3,987 4,578 7,944
23
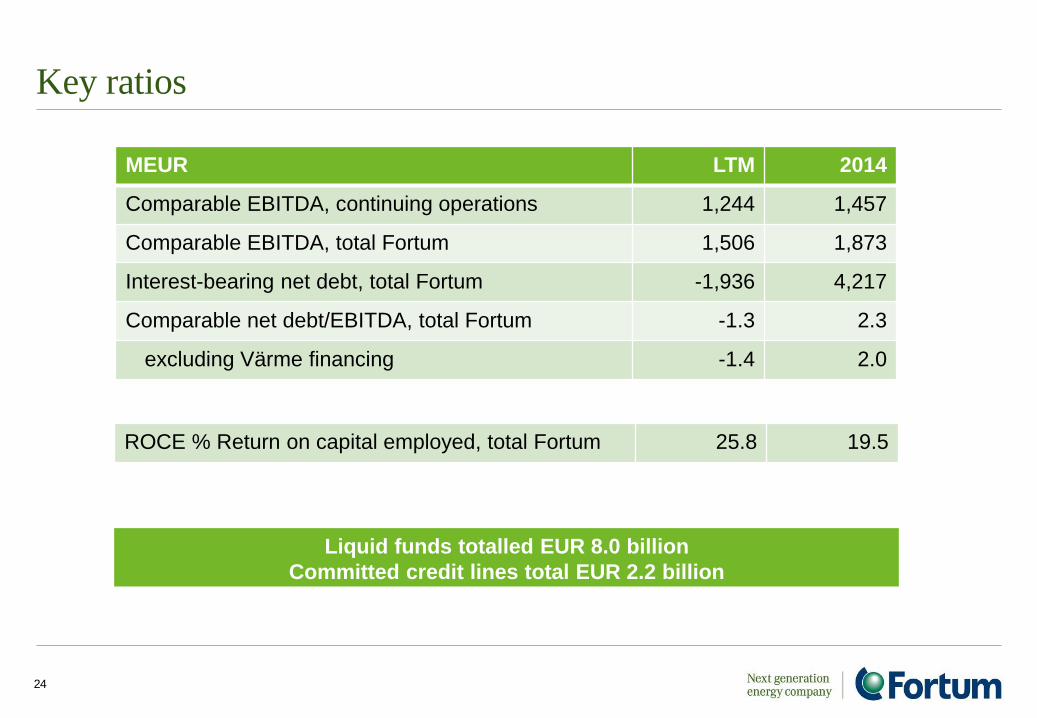
Key ratios
MEUR LTM 2014
Comparable EBITDA, continuing operations 1,244 1,457
Comparable EBITDA, total Fortum 1,506 1,873
Interest-bearing net debt, total Fortum -1,936 4,217
Comparable net debt/EBITDA, total Fortum -1.3 2.3
excluding Värme financing -1.4 2.0
24
ROCE % Return on capital employed, total Fortum 25.8 19.5
Liquid funds totalled EUR 8.0 billion
Committed credit lines total EUR 2.2 billion
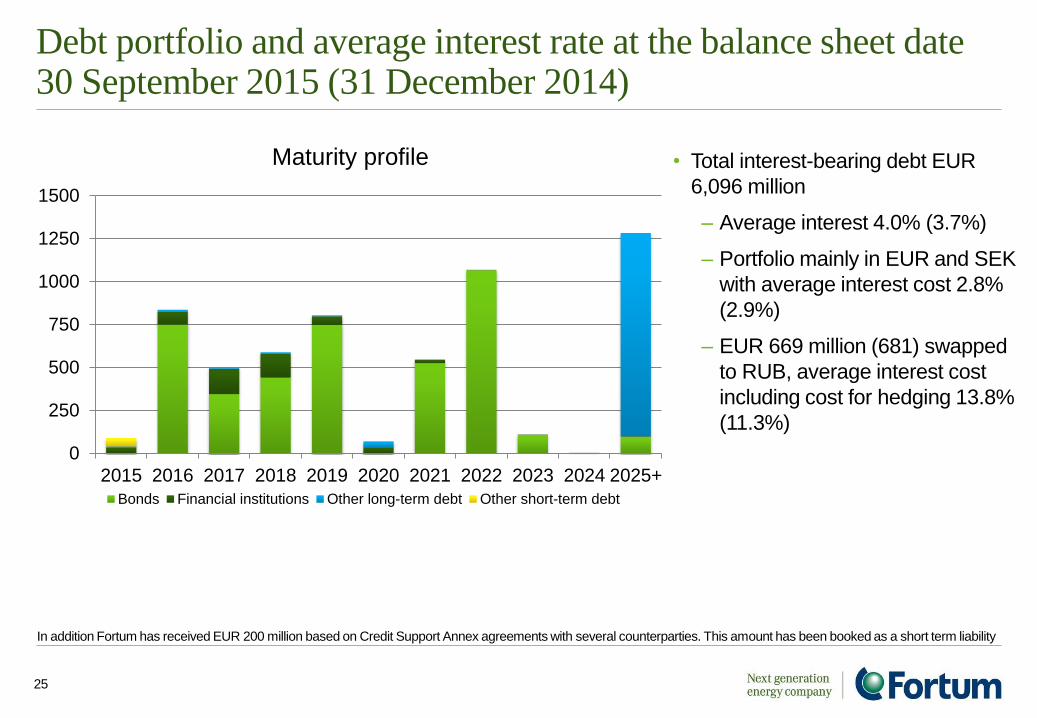
Debt portfolio and average interest rate at the balance sheet date 30 September 2015 (31 December 2014)
25
In addition Fortum has received EUR 200 million based on Credit Support Annex agreements with several counterparties. This amount has been booked as a short term liability
• Total interest-bearing debt EUR
6,096 million
– Average interest 4.0% (3.7%)
– Portfolio mainly in EUR and SEK
with average interest cost 2.8%
(2.9%)
– EUR 669 million (681) swapped
to RUB, average interest cost
including cost for hedging 13.8%
(11.3%)
0
250
500
750
1000
1250
1500
2015 2016 2017 2018 2019 2020 2021 2022 2023 2024 2025+
Bonds Financial institutions Other long-term debt Other short-term debt
Maturity profile

Outlook
Outlook
Nordic markets
• Fortum continues to expect that the average annual electricity demand
growth will be on average approximately 0.5% in the coming years
• Electricity is expected to continue to gain share of total energy consumption
Russia
• The targeted operating profit (EBIT) level of RUB 18.2 billion in the Russia
segment is delayed by 2 to 3 years. Previously the run-rate operating profit level
(EBIT) was targeted to be reached during 2015 after finalising the investment
programme.
Key drivers and risks
• Economic
• Political
• Currency
• Wholesale price of electricity and volumes
• demand and supply • fuels
• hydrological situation • power plant availability
• CO2 emissions allowance prices
27
Outlook
Annual capex estimate, excluding potential acquisitions
• 2015 approximately EUR 0.6 billion
Hedging
• Rest of 2015 approx. 65% hedge ratio at approx. EUR 36/MWh
• 2016 approx. 35% hedge ratio at approx. EUR 34/MWh
• 2017 approx. 15% hedge ratio at approx. EUR 33/MWh
Taxation
• Effective tax rate for 2015 for the Group 19-21%
• The Swedish Parliament decided to approve the proposed tax increase of 17% on
installed nuclear capacity. The tax was implemented as of 1 August 2015. The
estimated impact on Fortum is approximately EUR 15 million annually, albeit
corporate tax-deductible
28

For more information www.fortum.com/investors