Embed Size (px)
Citation preview

1Q Results BBVAResults 1Q Results Presentation
2015

Angel Cano, BBVA´s President & Chief Operating Officer
Madrid, April 29th 2015
First quarter results 2015

3
Results 1Q15 / April 29th 2015
Disclaimer This document is only provided for information purposes and does not constitute, nor must it be interpreted as, an offer to sell or exchange or acquire,
or an invitation for offers to buy securities issued by any of the aforementioned companies. Any decision to buy or invest in securities in relation to a
specific issue must be made solely and exclusively on the basis of the information set out in the pertinent prospectus filed by the company in relation to
such specific issue. Nobody who becomes aware of the information contained in this report must regard it as definitive, because it is subject to changes
and modifications.
This document contains or may contain forward looking statements (in the usual meaning and within the meaning of the US Private Securities Litigation
Act of 1995) regarding intentions, expectations or projections of BBVA or of its management on the date thereof, that refer to miscellaneous aspects,
including projections about the future earnings of the business. The statements contained herein are based on our current projections, although the said
earnings may be substantially modified in the future by certain risks, uncertainty and other factors relevant that may cause the results or final decisions to
differ from such intentions, projections or estimates. These factors include, without limitation, (1) the market situation, macroeconomic factors,
regulatory, political or government guidelines, (2) domestic and international stock market movements, exchange rates and interest rates, (3) competitive
pressures, (4) technological changes, (5) alterations in the financial situation, creditworthiness or solvency of our customers, debtors or counterparts.
These factors could condition and result in actual events differing from the information and intentions stated, projected or forecast in this document and
other past or future documents. BBVA does not undertake to publicly revise the contents of this or any other document, either if the events are not
exactly as described herein, or if such events lead to changes in the information of this document.
This document may contain summarised information or information that has not been audited, and its recipients are invited to consult the
documentation and public information filed by BBVA with stock market supervisory bodies, in particular, the prospectuses and periodical information filed
with the Spanish Securities Exchange Commission (CNMV) and the Annual Report on form 20-F and information on form 6-K that are disclosed to the
US Securities and Exchange Commission.
Distribution of this document in other jurisdictions may be prohibited, and recipients into whose possession this document comes shall be solely
responsible for informing themselves about, and observing any such restrictions. By accepting this document you agree to be bound by the foregoing
restrictions.
4
Results 1Q15 / April 29th 2015
4
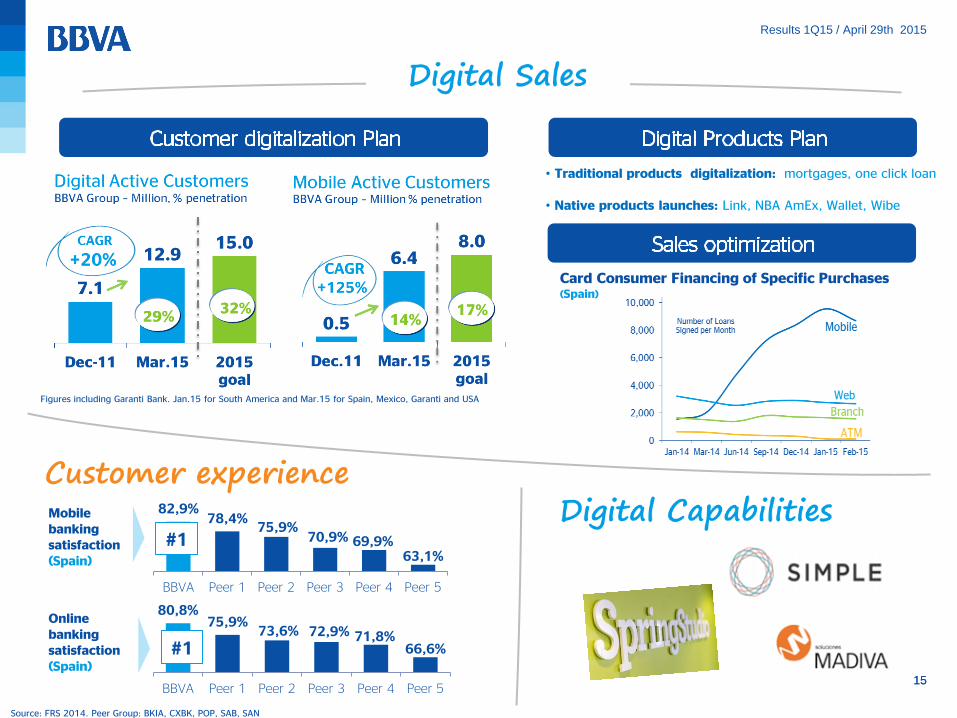
Catalunya Caixa Closing
Main highlights:

5
Results 1Q15 / April 29th 2015
5
NPL ratio
5.6% Core Capital CRD IV Leverage ratio
6.2% (Fully-loaded)
12.7% (Phased-in)
1Q 2015 Highlights:
Income growth
(1Q15 vs 1Q14)
Gross Income
Digital Transformation
Risk indicators improving
Sound capital position
Digital Sales
Coverage ratio
65%
10.8% (Fully-loaded)
+16.2%
Note: In order to explain more clearly the evolution of the area´s income statement, figures herein exclude Venezuela as it has been impacted by the implementation of Simadi in 1Q15. In annex page 38 of this presentation we provide details on this change.

6
Results 1Q15 / April 29th 2015
6
+17.0%
3.170 3.316
3.624
1Q13 1Q14 1Q15
Earnings: Growth in net interest income
Net interest income 1Q15 vs 1Q14
Growth in all regions
Note: figures exclude Venezuela
(Constant €m) +9.3%

7
Results 1Q15 / April 29th 2015
7
Note: figures exclude Venezuela
Upward trend in revenues…
4.163 4.329
4.695
4.922 5.080
5.538
1Q13 1Q14 1Q15
Net Interest Income + fee income Gross income
+9.0% (Constant €m)
+8.4%
+16.2% Gross income 1Q15 vs 1Q14

8
Results 1Q15 / April 29th 2015
8
… and costs under control growing slower than revenues …
Note: figures exclude Venezuela
+9.6% Costs 1Q15 vs 1Q14
6,1
2,8 2,1
2,4 2,0 3,1
-0,7
3,2 4,6 5,0
6,9
9,0
12M13 3M14 6M14 9M14 12M14 3M15
Costs Gross income
Gross income vs costs YoY (%) (Constant €m)

9
Results 1Q15 / April 29th 2015
9
2.319 2.403
2.778
1Q13 1Q14 1Q15
… resulting in a significant operating income growth
Note: figures exclude Venezuela
Operating income 1Q15 vs 1Q14
(Constant €m)
+23.5%
+15.6%

10
Results 1Q15 / April 29th 2015
10
2.311
1.616
1.196 1.204
2012Quarterlyaverage
2013Quarterlyaverage
2014Quarterlyaverage
1Q15
Spain (loan-loss + RE provisions)
Rest of areas
Cost of risk remains stable
Loan-loss + real estate provisions €m
2.21.6
1.2 1.2
2012 2013 2014 1Q15
Cost of risk YTD (%)
(%)
Provisions change mix
Note: figures exclude Venezuela
47% 53%
63%
77%

11
Results 1Q15 / April 29th 2015
11
€m
Note: The P&L is presented this way to show the performance of recurring business. The reconciliation to the income statement is shown on pages 42-43 of the financial information filed today with the CNMV.
Income growth Cost control Corporate operations
In summary, growth earnings cycle continues
47.2Net attributable profit (Total Group; ex corporate operations) 953 +329 52.8
BBVA Group ex Venezuela 1Q15
Growth
Abs. %
1Q15/1Q14
% constant
Net interest Income MARGEN DE INTERESES3,624 + 527 17.0
9.0
9.3
Gross Income MARGEN BRUTO5,538 + 770 16.2
Operating income MARGEN NETO2,778 + 529 23.5 15.6
Income Before Tax RESULTADOS ANTES DE IMPUESTOS1,395 + 529 61.2 43.0
NI ex corporate operations BDI OPS. CONTINUADAS1,030 + 388 60.5 42.2
Corporate Operations Income RDO. OPS. CORPORATIVAS583 + 583 n.s. n.s.
Net Attributable Profit (ex Venezuela) RESULTADO ATRIBUIBLE AL GRUPO1,521 + 954 n.s. n.s.
n.s.Net Attributable Profit (Total Group) 1,536 + 912 n.s.RESULTADO ATRIBUIBLE AL GRUPO

12
Results 1Q15 / April 29th 2015
12
25.4
23.6 23.2
1Q14 4Q14 1Q15
60 64 65
Mar.14 Dec.14 Mar.15
6,6 5,8 5,6
Mar.14 Dec.14 Mar.15
Risk: indicators continue to improve
Excl. Real Estate
NPL ratio (%)
Coverage ratio (%)
- €2.2 bn
NPLs €bn
59% 65% 66% Excl. Real
Estate
16.8 15.8 15.8
Excl. Real Estate 4.6% 4.1% 3.9%
13
Results 1Q15 / April 29th 2015
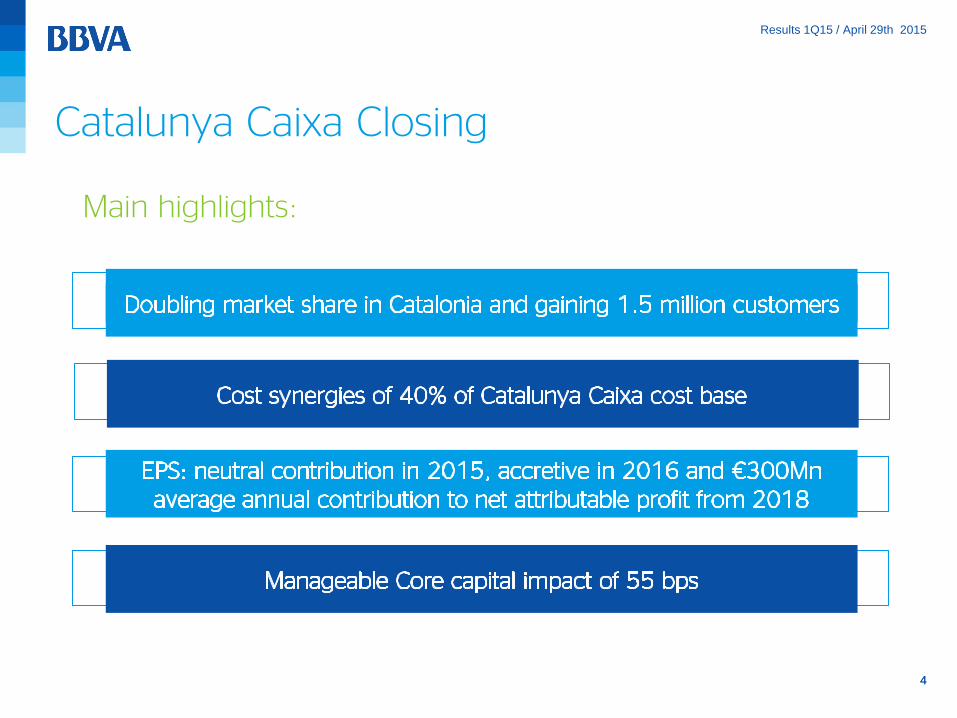
Capital
Leverage ratio
10.8% (Fully-loaded)
12.7% (Phased-in)
6.2% (Fully-loaded)
Core Capital CRD IV
High Quality Capital
• The highest RWA density ratio of the European peer group (52%)
Capital Management
• €1.5bn AT1 issue
• Expected manageable TLAC impact
1Q15 Pro-forma*
Strong & Resilient Regulatory Ratios
* Pro-forma of corporate operations announced and pending to be closed.
Core Capital CRD IV
(Fully-loaded)
9.8%e

14
Results 1Q15 / April 29th 2015
14
Digital Transformation Framework
15
Results 1Q15 / April 29th 2015
15
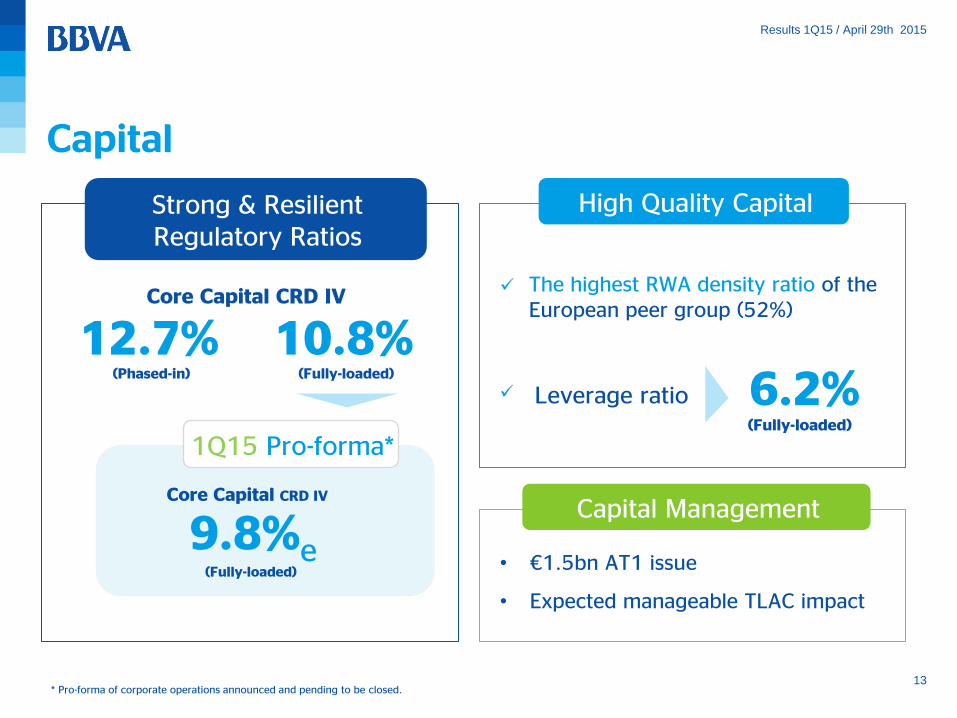
80,8% 75,9%
73,6% 72,9% 71,8% 66,6%
BBVA Peer 1 Peer 2 Peer 3 Peer 4 Peer 5
82,9% 78,4%
75,9% 70,9% 69,9%
63,1%
BBVA Peer 1 Peer 2 Peer 3 Peer 4 Peer 5
Figures including Garanti Bank. Jan.15 for South America and Mar.15 for Spain, Mexico, Garanti and USA
Online banking satisfaction (Spain)
Mobile banking satisfaction (Spain)
#1
#1
• Traditional products digitalization: mortgages, one click loan
• Native products launches: Link, NBA AmEx, Wallet, Wibe
Source: FRS 2014. Peer Group: BKIA, CXBK, POP, SAB, SAN
Card Consumer Financing of Specific Purchases (Spain)

16
Results 1Q15 / April 29th 2015
16
Business Areas

17
Results 1Q15 / April 29th 2015
17
1.753 1.786
1Q14 1Q15
Business activity (YoY and QoQ chg)
1.278 1.345
1Q14 1Q15
Results (€m)
1.048 1.081
1Q14 1Q15
NII + fees Gross income Operating income
Banking activity in Spain
Customer funds
+5.3% +1.9% +3.2%
-4.3%
-0.1%
YoY QoQ 5.1%
0.5%
1 2YoY QoQ
Lending*
* Gross loans and advances to customers Note: Activity excludes repos

18
Results 1Q15 / April 29th 2015
18
Risk
Banking activity in Spain
Risk
Loan-loss provisions and cost of risk (€m, %)
458 421
1.0 1.0
Mar.14 Mar.15
Loan-loss provisions Cost of risk
12.5
11.4 11.2
Mar.14 Dec.14 Mar.15
NPLs (€ bn)
4145 46
6.4 6.0 5.9
Mar.14 Dec.14 Mar.15
NPL ratio
Risk indicators (%) Coverage ratio
-10%

19
Results 1Q15 / April 29th 2015
19
Income Statement (€m)
Banking activity in Spain
More dynamic new loan production
Cost control management
Ongoing digital transformation plan
1Q15
-9.8
Operating income 1,081 + 34 3.2
Gross Income MARGEN BRUTO1,786 + 33 1.9
Net interest Income MARGEN DE INTERESES968 + 37 3.9
1Q15/1Q14
Abs. %
Banking activity in Spain
Growth
Income Before TaxRESULTADOS ANTES DE IMPUESTOS496 - 54
Net Attributable Profit 347 - 37 -9.6
20
Results 1Q15 / April 29th 2015
20
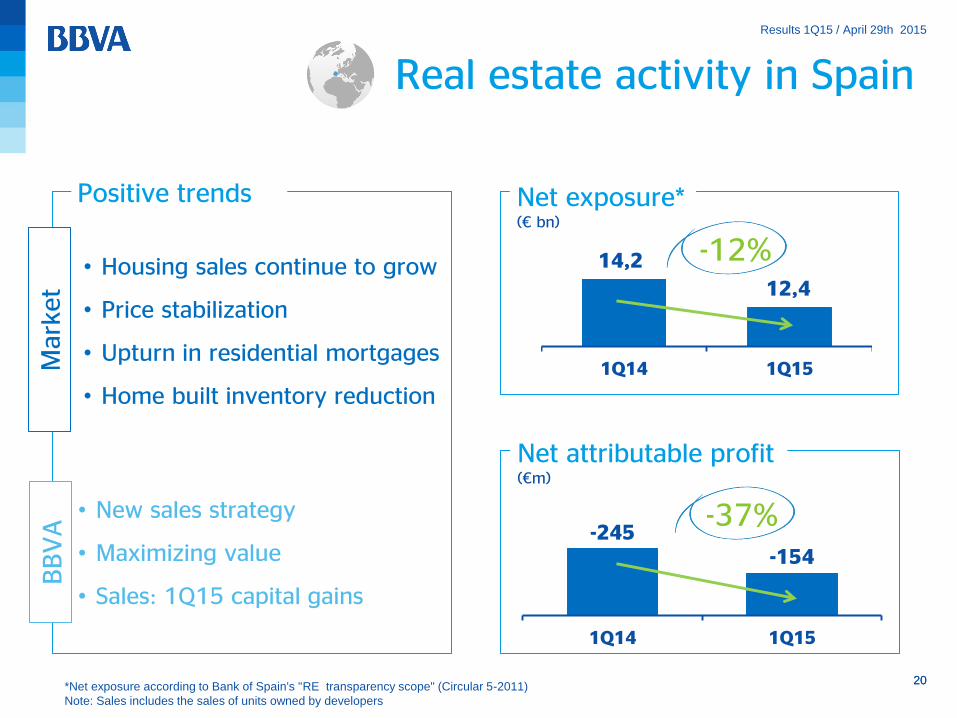
14,2
12,4
1Q14 1Q15
Real estate activity in Spain
Net attributable profit (€m)
Net exposure* (€ bn)
-12%
-245 -154
1Q14 1Q15
-37%
Positive trends
• Housing sales continue to grow
• Price stabilization
• Upturn in residential mortgages
• Home built inventory reduction
*Net exposure according to Bank of Spain's "RE transparency scope" (Circular 5-2011)
Note: Sales includes the sales of units owned by developers
Mark
et
BBV
A • New sales strategy
• Maximizing value
• Sales: 1Q15 capital gains

21
Results 1Q15 / April 29th 2015
21
Lending* +12.2% +15.3% Customer
Funds
Business activity (YoY, in constant €)
582 591
1Q14 1Q15
630 654
1Q14 1Q15
202 223
1Q14 1Q15
USA
Results (Constant €m)
NII + fees Gross income Operating income
+1.5% +3.7% +10.1%
* Gross loans and advances to customers Note: Activity excludes repos

22
Results 1Q15 / April 29th 2015
22
Risk
NPL and coverage ratios (%)
Loan-loss provisions and cost of risk (Constant €m, %)
160
167164
1.0 0.9 0.9
Mar.14 Dec.14 Mar.15
23
31
0,2 0.2
Mar.14 Mar.15
Loan-loss provisions Cost of risk
NPL ratio
Coverage ratio
USA
23
Results 1Q15 / April 29th 2015
23
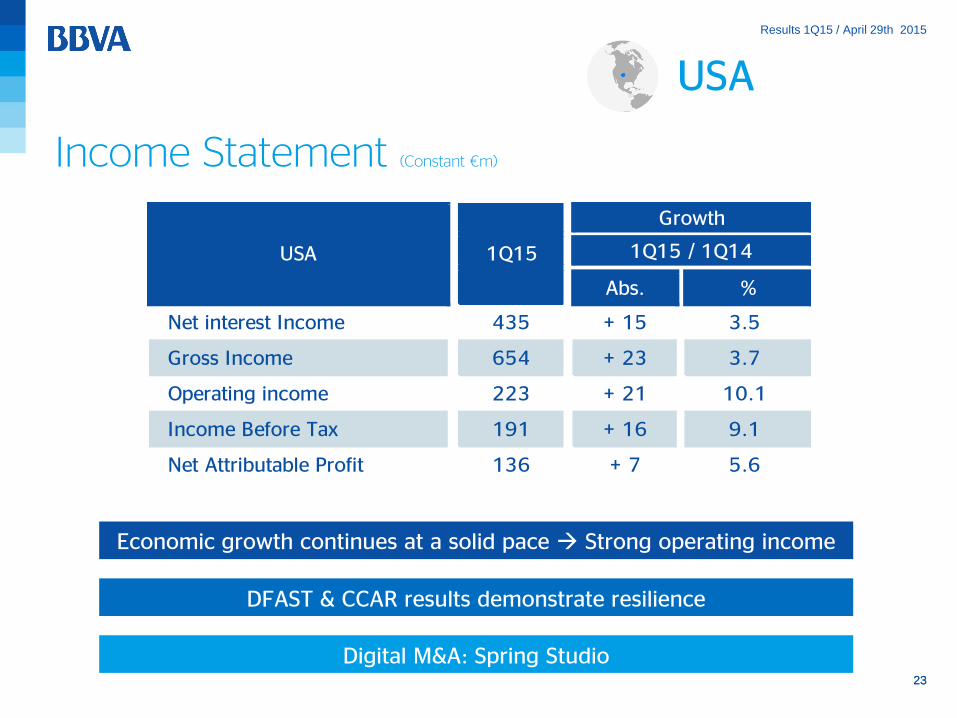
Income Statement (Constant €m)
USA
Economic growth continues at a solid pace Strong operating income
DFAST & CCAR results demonstrate resilience
Digital M&A: Spring Studio
5.6
191
1Q15 / 1Q14
%
1Q15
+ 16
3.7
+ 21
+ 7Net Attributable Profit 136
Operating income 223
Income Before Tax 9.1
3.5
10.1
Gross Income MARGEN BRUTO654 + 23
USA
Abs.
Growth
Net interest Income MARGEN DE INTERESES435 + 15
24
Results 1Q15 / April 29th 2015
24
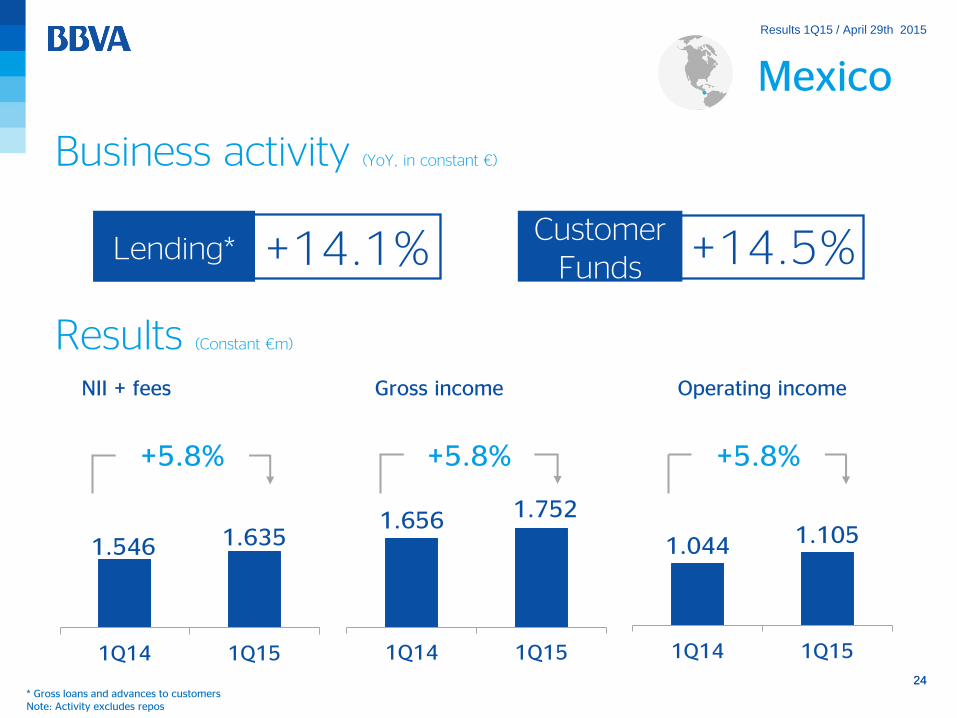
Mexico
1.546 1.635
1Q14 1Q15
1.656 1.752
1Q14 1Q15
1.044 1.105
1Q14 1Q15
Lending* +14.1% +14.5% Customer
Funds
Business activity (YoY, in constant €)
Results (Constant €m)
NII + fees Gross income Operating income
+5.8% +5.8% +5.8%
* Gross loans and advances to customers Note: Activity excludes repos

25
Results 1Q15 / April 29th 2015
25
Risk
114 114 116
3.42.9 2.8
Mar.14 Dec.14 Mar.15
NPL ratio
Coverage ratio
383 422
3.4 3.3
Mar.14 Mar.15
Loan-loss provisions Cost of risk
NPL and coverage ratios (%)
Loan-loss provisions and cost of risk (Constant €m, %)
Mexico

26
Results 1Q15 / April 29th 2015
26
Income Statement (Constant €m)
Mexico
Double-digit business activity
Stable risk indicators
Leader and bank of reference in Mexico
+ 35 7,1
Mexico
Growth
1Q15 / 1Q14
7,7
Abs. %
Gross Income MARGEN BRUTO1.752
Net interest Income MARGEN DE INTERESES1.340 + 77 6,1
1Q15
+ 96 5,8
+ 61 5,8
693 + 50
1.105Operating income
Income Before TaxRESULTADOS ANTES DE IMPUESTOS
Net Attributable Profit 524

27
Results 1Q15 / April 29th 2015
27
+14.2%
South America ex Ven
826
931
1Q14 1Q15
933
1.065
1Q14 1Q15
506
576
1Q14 1Q15
Lending* Customer
Funds
Business activity (YoY, in constant €)
Results (Constant €m)
NII + fees Gross income Operating income
+12.8% +13.9%
+12.5% +11.0%
Note: In order to explain more clearly the evolution of the area´s income statement, figures herein exclude Venezuela as it has been impacted by the implementation of Simadi in 1Q15. In annex page 38 of this presentation we provide details on this change.
* Gross loans and advances to customers Note: activity excluding repos
28
Results 1Q15 / April 29th 2015
28
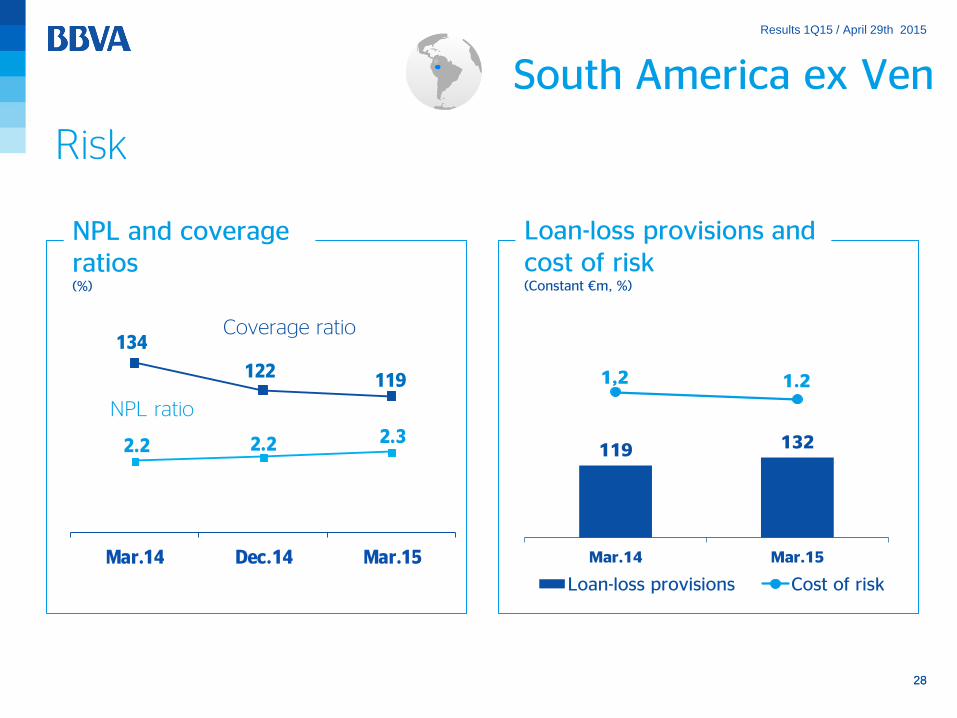
134
122 119
2.2 2.2 2.3
Mar.14 Dec.14 Mar.15
Risk
NPL ratio
NPL and coverage ratios (%)
Loan-loss provisions and cost of risk (Constant €m, %)
Coverage ratio
South America ex Ven
119 132
1,2 1.2
Mar.14 Mar.15
Loan-loss provisions Cost of risk

29
Results 1Q15 / April 29th 2015
29
Net Attributable Profit 213 + 16 8.1
Income Before TaxRESULTADOS ANTES DE IMPUESTOS421 + 49 13.1
Operating income 576 + 71 13.9
Gross Income MARGEN BRUTO1,065 + 133 14.2
Net interest Income 763 + 84 12.3
1Q15 / 1Q140
Abs. %
South America ex Venezuela 1Q15
Growth
Income Statement (Constant €m)
South America ex Ven
The area will continue to be a relevant contributor to the Group
The Andean region positioning itself as the main growth lever
Venezuela: limited contribution to P&L

30
Results 1Q15 / April 29th 2015
250 Gross income +8.9%
140 Operating income +8.4%
86 Net attributable
profit +12.2%
260 NII + fees +26.2%
Constant €m YoY
1Q15 Results
2015 GDP growth expected to be higher than the 2014 2.9%
Garanti Highlights
Successful customer spread management
Standing out for its asset quality
High LT growth potential backed by attractive demographics & underpenetrated market
Turkey

31
Results 1Q15 / April 29th 2015
Angel Cano, BBVA´s President & Chief Operating Officer
Madrid, April 29th 2015
First quarter results 2015

32
Results 1Q15 / April 29th 2015
32
Annex
33
Results 1Q15 / April 29th 2015
33
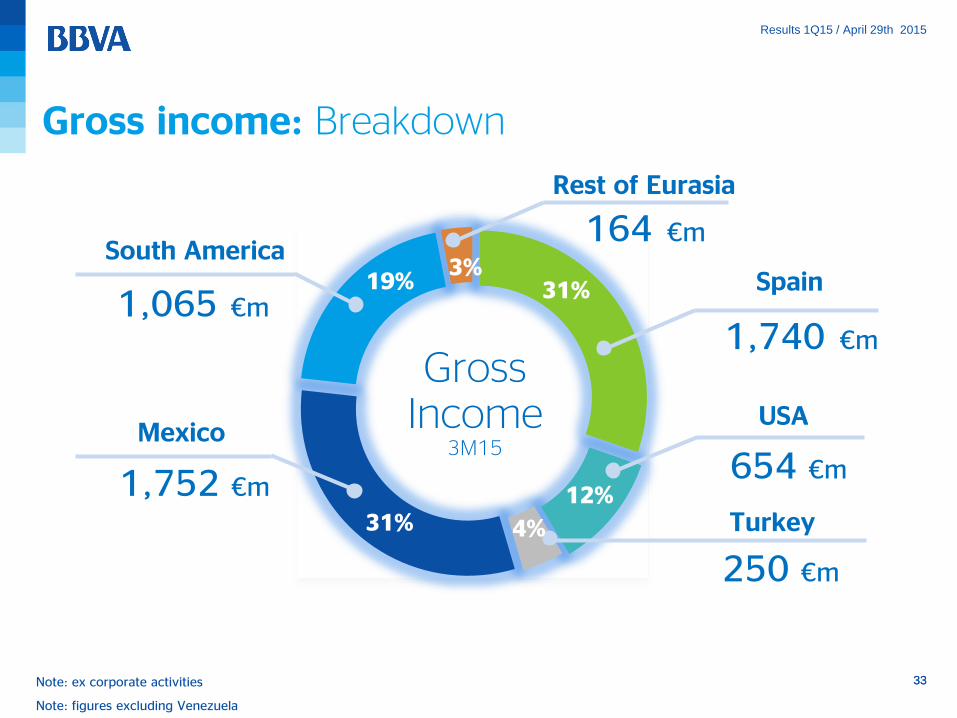
Gross income: Breakdown
Spain
1,740 €m
654 €m
USA
250 €m
Turkey
Rest of Eurasia
164 €m
31%
Gross Income
3M15
12%
4% 31%
Mexico
1,752 €m
19% South America
1,065 €m
3%
Note: ex corporate activities
Note: figures excluding Venezuela

34
Results 1Q15 / April 29th 2015
34
10,4 0,25 -0.14 0,20
0,10 10,8
Dec.14 Net earnings(net of dividends)
Organic RWAs Corporate operationsSale of CNCB
Others Mar.15
Capital: Core capital fully-loaded evolution 2015
Core capital CRD IV Fully-loaded Group BBVA (%)
+41 bp
Note: Net earnings (net of dividends) and organic RWAs exclude FX impact. All FX impacts (excluding VZ) are included in “Others”.

35
Results 1Q15 / April 29th 2015
35
BBVA Group 1Q15
Abs. %Abs.
constant
Net interest Income MARGEN DE INTERESES3,663 + 272 8.0 + 325
Gross Income MARGEN BRUTO5,632 + 581 11.5 + 531 10.4
Operating income MARGEN NETO2,857 + 419 17.2 + 440 18.2
Income Before Tax RESULTADOS ANTES DE IMPUESTOS1,442 + 425 41.8 + 455
NI ex corporate operationsBDI OPS. CONTINUADAS1,056 + 312 42.0 + 324
Corporate Operations IncomeRDO. OPS. CORPORATIVAS583 + 583 n.s. + 583
Net Attributable ProfitRESULTADO ATRIBUIBLE AL GRUPO1,536 + 912 n.s. + 889
Growth
1Q15/1Q14
%
constant
9.7
46.1
44.3
n.s.
n.s.
Income statement BBVA Group (€m)

36
Results 1Q15 / April 29th 2015
36
Proforma Catalunya Caixa income statement (€m)
Net Attributable Profit 20
Results from discontinued operations 16
Income Before Tax 4
Operating income 6
Gross Income MARGEN BRUTO541
Net interest Income MARGEN DE INTERESES323
Proforma Catalunya Caixa Dec.141.5 Million customers
*Gross customer loans 24.9 € Bn
*Customer deposits 25.5 € Bn
Note: Proforma figures excluding porfolio sale to Blackstone
*Dec’14

37
Results 1Q15 / April 29th 2015
37
63 61 61 63 62
54.2 54.8 55.3 55.4 53.9
Mar.14 Jun.14 Sep.14 Dec.14 Mar. 15
NPL ratio (%)
Coverage ratio (%)
Risk: Real Estate activity in Spain

38
Results 1Q15 / April 29th 2015
38
Income statement RE (€m)
Other RESTO ACTIVOS0 + 6 n.s.
Real Estate Activity in Spain
Growth
1Q15/1Q14
Abs. %
Net interest income MARGEN DE INTERESES-9 - 2 29.4
1Q15
-16.3
Gross income MARGEN BRUTO-46 + 12 -20.3
Loan-loss provisions SANMTO CREDITICIO-57 + 18 -24.4
Operating income -79 + 15
Income Before Tax -221 + 132 -37.5
RESULTADO ATRIBUIBLE AL GRUPO-154 + 91 -37.2
Provisions (net) and other gains (losses) -85 + 93 -52.2
Net Attributable Profit

39
Results 1Q15 / April 29th 2015
39
Income statement Rest of Eurasia (Constant €m)
Net Attributable Profit 36 - 2 -4.4
Income Before Tax 56 + 7 13.8
Operating income 74 + 3 4.3
Gross Income MARGEN BRUTO164 + 6 3.7
Net interest Income MARGEN DE INTERESES46 - 2 -3.2
Rest of EurAsia 1Q15
Growth
1Q15 / 1Q14
Abs. %

40
Results 1Q15 / April 29th 2015
40
Income statement Venezuela (€m)
Venezuela 1Q15
Growth
1Q15/1Q14
Abs. %
+ 17 78.4
Abs.
constant
%
constant
Net interest Income MARGEN DE INTERESES39 - 254 -86.7
+ 73 n.s.Gross Income MARGEN BRUTO94 - 189 -66.8
+ 65 n.s.Operating income MARGEN NETO79 - 110 -58.2
+ 36 n.s.Income Before Tax RESULTADOS ANTES DE IMPUESTOS47 - 104 -69.0
+ 18 n.s.NI ex corporate operationsBDI OPS. CONTINUADAS26 - 76 -74.5
RESULTADO ATRIBUIBLE AL GRUPO15 - 42 -74.2 + 10 n.s.Net Attributable Profit

41
Results 1Q15 / April 29th 2015
41
Income statement Corporate Center (€m)
Net Attributable Profit 333 + 758 n.s.
Corporate Operations Income 583 + 583 n.s.
Income Before Tax -349 + 210 -37.6
Operating income -343 + 161 -31.9
Gross Income MARGEN BRUTO-86 + 139 -61.8
Net interest Income MARGEN DE INTERESES-129 + 49 -27.6
Abs. %
Corporate Center 1Q15
Growth
1Q15/1Q14

42
Results 1Q15 / April 29th 2015
42
Customer Spreads
Note: customer spreads, difference between lending yield and cost of deposits from customers
* USA ex NY Business Activity
Customer Spreads 1Q14 2Q14 3Q14 4Q14 1Q15 3M14 3M15
Spain 1.77% 1.83% 1.92% 1.94% 1.93% 1.77% 1.93%
USA 3.32% 3.26% 3.13% 3.18% 3.13% 3.13% 3.32%
Mexico 11.36% 11.22% 11.05% 11.23% 10.94% 11.36% 10.94%
Argentina 14.68% 15.37% 16.37% 17.34% 16.70% 14.68% 16.70%
Chile 3.89% 4.57% 3.43% 4.80% 2.84% 3.89% 2.84%
Colombia 7.15% 6.82% 6.42% 6.31% 6.49% 7.15% 6.49%
Peru 7.54% 7.38% 7.16% 7.36% 7.22% 7.54% 7.22%
Venezuela 17.21% 17.33% 16.99% 17.94% 17.71% 17.21% 17.71%
Turquía 3.44% 3.60% 4.49% 4.67% 4.57% 3.44% 4.57%