Embed Size (px)
Citation preview

Datatec Group Unaudited results for the six months ended
31 August 2014

2
Datatec Group Agenda
1
2
3
Results summary & Market conditions
Jens Montanana, Datatec Group CEO
Financial results
Jurgens Myburgh, Datatec Group CFO
Operational review
Jens Montanana, Datatec Group CEO
4 Strategy & Outlook
Jens Montanana, Datatec Group CEO

Results summary & Market conditions

4
Datatec Group
* Excluding impairment of goodwill and intangible assets, profit or loss on sale of investments and assets, amortisation of acquired intangible assets, unrealised
foreign exchange movements, acquisition related adjustments, fair value movements on acquisition-related financial instruments and the taxation effect on all of the
aforementioned.
• Solid overall revenue growth
• Strong recovery in Westcon
• Modest decline in EPS due to
group costs and Logicalis H1
Brazil FIFA World Cup delays
• Dividend maintained
Results summary
Revenue
8%
to US$2.98bn
H1 FY14: US$2.77bn
Underlying* EPS
5%
to 18,2 US¢
H1 FY14: 19,2 US¢
Interim dividend
to 8 US¢
H1 FY14: 8 US¢
EBITDA
1%
to US$90.1m
H1 FY14: US$89.2m
Overview | Group Financials | Westcon Group | Logicalis Group | Consulting Services | Future outlook
0%

5
Datatec Group Market conditions
Overview | Group Financials | Westcon Group | Logicalis Group | Consulting Services | Future outlook
• Macro picture remains very mixed
• Significant strengthening of US$
• Asia Pacific weak with much uncertainty in Europe and Emerging Markets
• Technology sector adjusting to Cloud usage and data centre concentration

Financial results

7
Datatec Group
US$m H1 FY15 H1 FY14 Change %
Revenue 2,983.6 2,765.5 8%
Gross profit 446.2 413.5 8%
Gross margin % 15.0% 15.0%
Operating costs (356.1) (324.3) 10%
Operating cost margin % 11.9% 11.7%
EBITDA 90.1 89.2 1%
EBITDA% 3.0% 3.2%
Depreciation & Amortisation (24.4) (22.2) 10%
Operating profit 65.7 67.0 (2%)
Operating profit % 2.2% 2.4%
• Westcon revenues up 14%
partially offset by Logicalis
decline of 7%
• Stable gross margins
• Operating costs increase 10%
• EBITDA sequentially up from
H2 FY14
Financial performance
Overview | Group Financials | Westcon Group | Logicalis Group | Consulting Services | Future outlook

8
Datatec Group
* Excluding impairment of goodwill and intangible assets, profit or loss on sale of investments and assets, amortisation of acquired intangible assets, unrealised
foreign exchange movements, acquisition related adjustments, fair value movements on acquisition-related financial instruments and the taxation effect on all of the
aforementioned.
US$m H1 FY15 H1 FY14 Change %
Operating profit 65.7 67.0 (2%)
Net finance costs (8.9) (10.4) (14%)
Profit before tax 57.5 57.7 -
Underlying* EPS (US cents) 18,2 19,2 (5%)
HEPS (US cents) 16,0 18,2 (12%)
• Reduced net finance costs
• Effective tax rate of 33.5%
Financial performance - continued
Overview | Group Financials | Westcon Group | Logicalis Group | Consulting Services | Future outlook

9
Datatec Group
US$m Revenue %
change
Gross
profit %
change EBITDA %
change
Operating
profit %
change
Westcon 2,241.4 14% 257.5 16% 55.7 22% 42.9 23%
Logicalis 714.4 (7%) 179.6 2% 41.6 (5%) 30.5 (7%)
Consulting* 27.8 (25%) 9.1 (37%) 1.4 (36%) 0.9 (47%)
Corporate - - - - (8.6) (8.6)
Total 2,983.6 8% 446.2 8% 90.1 1% 65.7 (2%)
• Westcon showing revenue
growth in all regions
• Operating leverage results in
22% EBITDA growth
• Logicalis $50m revenue
shortfall in Brazil
• Consulting now excludes Intact
• Corporate includes forex,
headcount, acquisition &
restructuring expenses
Divisional financial performance H1 FY15
Overview | Group Financials | Westcon Group | Logicalis Group | Consulting Services | Future outlook
* Comparative period H1 FY14 includes Intact results

10
Datatec Group
75%
24%
1%
Revenue | H1 FY15
US$2.98b
58%
40%
2%
Gross profit | H1 FY15
US$446.2m
57%
42%
1%
EBITDA | H1 FY15
US$90.1m
71%
28%
1%
Revenue | H1 FY14
US$2.77b
54%
43%
3%
Gross profit | H1 FY14
US$413.5m 50%
48%
2%
EBITDA | H1 FY14
US$89.2m
Contribution per division
Westcon Logicalis Consulting
Overview | Group Financials | Westcon Group | Logicalis Group | Consulting Services | Future outlook

11
Datatec Group
• Westcon grew revenues by
27% in North America
• LATAM impacted by FIFA
World Cup - remains robust
• Higher margin business in
developing world
• Stable gross profit distribution
30%
33%
11%
10%
16%
Revenue | H1 FY15
US$2.98b
27%
34%
11%
10%
18%
Revenue | H1 FY14
US$2.77b
24%
31% 11%
9%
25%
Gross profit | H1 FY15
US$446.2m
25%
31% 12%
8%
24%
Gross profit | H1 FY14
US$413.5m
Revenue and gross profit % contribution by geography
North America Europe Asia Pacific AME Latin America
Overview | Group Financials | Westcon Group | Logicalis Group | Consulting Services | Future outlook

12
Datatec Group
US$m H1 FY15 FY 2014 H1 FY14
Assets 3,183.7 2,992.0 2,830.1
Non current assets
Goodwill 450.2 438.2 430.7
Acquired intangible assets & software 46.7 53.7 58.0
Other non-current assets 183.8 181.7 185.8
Current assets 2,503.0 2,318.4 2,155.6
Equity and Liabilities 3,183.7 2,992.0 2,830.1
Shareholders funds 907.0 871.6 859.9
Non-controlling interests 56.7 52.9 50.9
Non-current liabilities 118.3 91.7 94.0
Amounts owing to vendors 4.5 9.9 11.0
Current liabilities 2,097.2 1,965.9 1,814.3
Balance sheet summary
Overview | Group Financials | Westcon Group | Logicalis Group | Consulting Services | Future outlook
• Current assets exceeding
$2.5 billion
• NAV of $4,59 per share
• TNAV of $1,85 per share
• ROIC at 11.0% sequentially
amortised

13
Datatec Group
* Less than $100 000
US$m H1 FY15 H1 FY14
Operating profit before working capital changes 96.8 83.5
Working capital changes 107.7 (102.6)
Cash generated from (utilised by) operations 204.5 (19.1)
Net finance costs paid (8.9) (10.4)
Taxation paid (20.7) (17.4)
Net cash inflow (outflow) from operating activities 174.9 (46.9)
Net cash outflow for acquisitions - (0.4)
Net cash outflow from other investing activities (18.7) (19.1)
Net cash inflow from financing activities 4.2 0.2
Net cash inflow from disposal of investments - *
Capital distribution to shareholders (17.2) (16.2)
Increase (decrease) in cash and cash equivalents 143.2 (82.4)
Cash & cash equivalents at beginning of period (41.8) 73.3
Translation difference on opening cash position 3.3 (8.2)
Cash and cash equivalents at end of period 104.7 (17.3)
Net cash (debt) 48.9 (56.7)
• Progressive working capital
management
• Net cash positive at HY15
Cash flow
Overview | Group Financials | Westcon Group | Logicalis Group | Consulting Services | Future outlook

Operational Review
Westcon Group

16
Westcon Group
• Revenues growth across all
regions highlighted by 27%
increase in North America
• Overall gross margin
improvement
• EBITDA growth across all
operating regions
Financial performance
Overview | Group Financials | Westcon Group | Logicalis Group | Consulting Services | Future outlook
US$m H1 FY15 H1 FY14 Change %
Revenue 2,241.4 1,961.1 14%
Gross profit 257.5 222.2 16%
Gross margin % 11.5% 11.3%
Operating costs (201.8) (176.5) 14%
Operating cost margin % 9.0% 9.0%
EBITDA 55.7 45.7 22%
EBITDA% 2.5% 2.3%
Operating profit 42.9 35.0 23%
Operating profit % 1.9% 1.8%

17
Westcon Group
• Revenues increase in all
regions
• Big increase in North America
sales contribution
• Slight reduction in North
America margins
• Improved margins in Europe
and AME
Revenue and gross profit contribution % by geography
North America Europe Asia Pacific AME Latin America
Overview | Group Financials | Westcon Group | Logicalis Group | Consulting Services | Future outlook
31%
33%
11%
13%
12%
Revenue | H1 FY15
US$2.24b
28%
35%
12%
14%
11%
Revenue | H1 FY14
US$1.96b
22%
34% 13%
14%
17%
Gross profit | H1 FY14
US$222.2m
23%
33% 12%
15%
17%
Gross profit | H1 FY15
US$257.5m

18
Westcon Group
44%
22%
25%
9%
Product category | H1 FY15
48%
23%
24%
5%
Product category | H1 FY14
64% 21%
15%
Customer | H1 FY15
60% 23%
17%
Customer | H1 FY14
Revenue % by product category and customer
Cisco Unified Communications* Security Data Centre & Other
Reseller System integrator Service provider
Overview | Group Financials | Westcon Group | Logicalis Group | Consulting Services | Future outlook
• Cisco product sales at 44%
• Significant growth in Data
Centre & Other
• Reseller segment increases to
64%
Note: Unified Communications includes: Avaya, Polycom and Smart Technologies

19
Westcon Group Historical quarterly sales
Overview | Group Financials | Westcon Group | Logicalis Group | Consulting Services | Future outlook
918 983
948 973 936
1025 1015 1089
1031
1210
0
200
400
600
800
1000
1200
1400
US$m
Qtr 1 Qtr 2 Qtr 3 Qtr 4 Qtr 1 Qtr 2 Qtr 3 Qtr 4 Qtr 1 Qtr 2
FY13 FY14 H1 FY15
20
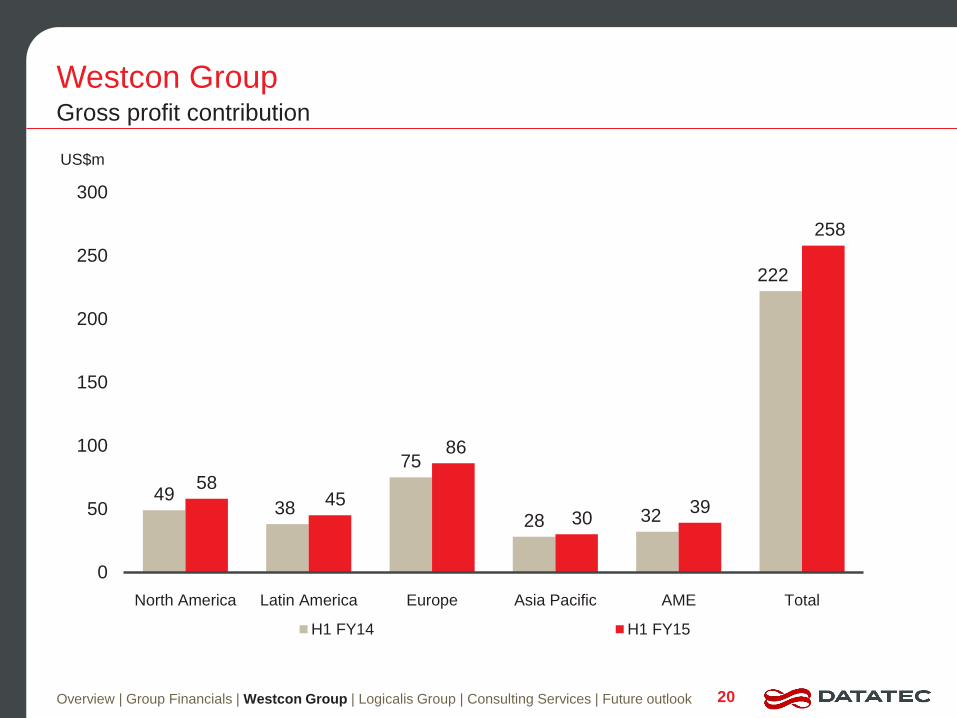
Westcon Group Gross profit contribution
Overview | Group Financials | Westcon Group | Logicalis Group | Consulting Services | Future outlook
49 38
75
28 32
222
58 45
86
30 39
258
0
50
100
150
200
250
300
North America Latin America Europe Asia Pacific AME Total
US$m
H1 FY14 H1 FY15

21
Westcon Group EBITDA
Overview | Group Financials | Westcon Group | Logicalis Group | Consulting Services | Future outlook
21
12
20
9 6
-22
46
27
16 22
8 10
-27
56
-40
-30
-20
-10
0
10
20
30
40
50
60
70
North America Latin America Europe Asia Pacific AME Central Costs Total
US$m
H1 FY14 H1 FY15

22
Westcon Group Working capital
Overview | Group Financials | Westcon Group | Logicalis Group | Consulting Services | Future outlook
US$m H1 FY15 H1 FY14
Accounts receivable 1,101.3 885.8
DSO (days) 82 78
Inventory 421.4 335.2
Inventory turns 10.3x 11.0x
Accounts payable (1,153.8) (791.2)
DPO days 97 78
Net working capital 368.9 429.8
NWC (days) 21 32
Net (debt) / cash (34.1) (116.3)
• Balancing strong growth with
inbound/outbound credit terms
• Net working capital decreases
• NWC days improves as DPO
days increase
• Net debt improves $82m

23
Westcon Group Net cash / (debt)
Overview | Group Financials | Westcon Group | Logicalis Group | Consulting Services | Future outlook
(500)
(450)
(400)
(350)
(300)
(250)
(200)
(150)
(100)
(50)
0
50
100
150
Feb-09
May-09
Aug-09
Nov-09
Feb-10
May-10
Aug-10
Nov-10
Feb-11
May-11
Aug-11
Nov-11
Feb-12
May-12
Aug-12
Nov-12
Feb-13
May-13
Aug-13
Nov-13
Feb-14
May-14
Aug-14
US$m

24
Westcon Group Future outlook
Overview | Group Financials | Westcon Group | Logicalis Group | Consulting Services | Future outlook
• Continued focus on operating leverage and EBITDA margin expansion
• Continued global vendor roll-out
• Investing for growth in services and cloud business
• Planned integration of Verecloud and Intact acquisitions
• Ongoing SAP implementation in Asia Pacific
• Preparing for EMEA Shared Services transformation and SAP roll-out in FY15
• Expect good year-on-year recovery

Logicalis Group

26
Logicalis Group
US$m H1 FY15 H1 FY14 Change %
Revenue 714.4 767.3 (7%)
Gross profit 179.6 176.9 2%
Gross margin % 25.1% 23.1%
Operating costs (138.0) (133.2) 4%
Operating cost margin % 19.3% 17.4%
EBITDA 41.6 43.7 (5%)
EBITDA% 5.8% 5.7%
Operating profit 30.5 32.7 (7%)
Operating profit % 4.3% 4.3%
Financial performance
Overview | Group Financials | Westcon Group | Logicalis Group | Consulting Services | Future outlook
• Total revenue down 7%
• Brazil delays due to World Cup
• Services revenues up 8%
• Gross margin % up due to
product/services mix
• Investing to adapt to services
led business model
• EBITDA down 5%
27
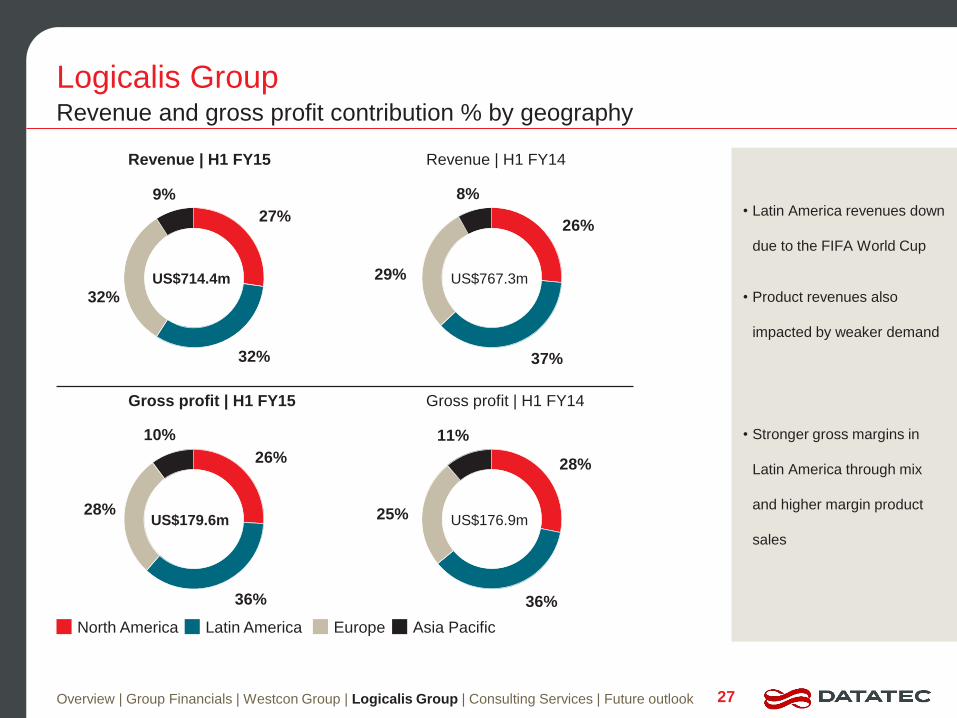
Logicalis Group
• Latin America revenues down
due to the FIFA World Cup
• Product revenues also
impacted by weaker demand
• Stronger gross margins in
Latin America through mix
and higher margin product
sales
27%
32%
32%
9%
Revenue | H1 FY15
26%
37%
29%
8%
Revenue | H1 FY14
US$767.3m
26%
36%
28%
10%
Gross profit | H1 FY15
US$179.6m
28%
36%
25%
11%
Gross profit | H1 FY14
US$176.9m
Revenue and gross profit contribution % by geography
North America Latin America Europe Asia Pacific
US$714.4m
Overview | Group Financials | Westcon Group | Logicalis Group | Consulting Services | Future outlook

28
Logicalis Group
• Services revenues were 35%
› Annuity up 9%
› Professional Services up 5%
• Product revenues down 13%
• Strong EMC and Arbor growth
• Cisco decline reflects lower
product revenues in Latin
America
65%
13%
22%
Segment | H1 FY15
70%
11%
19%
Segment | H1 FY14
56%
16%
6%
22%
Vendor | H1 FY15
61% 16%
6%
17%
Vendor | H1 FY14
Revenue by segment and product by vendor
IBM Cisco HP Other
Product Professional services Maintenance and managed services
Overview | Group Financials | Westcon Group | Logicalis Group | Consulting Services | Future outlook

29
Logicalis Group
45 49
64
19
177
50 48
65
17
180
0
50
100
150
200
Europe North America Latin America Asia Pacific Total
US$m
H1 FY14 H1 FY15
Gross profit contribution
Overview | Group Financials | Westcon Group | Logicalis Group | Consulting Services | Future outlook

30
Logicalis Group EBITDA
Overview | Group Financials | Westcon Group | Logicalis Group | Consulting Services | Future outlook
8 10
26
5
-5
44
10 8
26
3
-5
42
-10
0
10
20
30
40
50
Europe North America Latin America Asia Pacific Central Costs Total
US$m
H1 FY14 H1 FY15

31
Logicalis Group
* Excluding lease liabilities and Datatec loans
US$m H1 FY15 H1 FY14
Deferred revenue 79.9 74.5
Inventory 64.6 67.5
Inventory days (excluding spares stock) 26 22
Accounts receivable 294.0 330.4
DSO (days) 50 54
Accounts payable (246.8) (275.4)
DPO (days) 98 91
Net working capital 111.8 122.5
Net cash * 74.8 59.6
• Overall good working capital
management
• Lower AR and AP balances
on lower activity
• Improvement in DSO reflected
in net cash
Working Capital
Overview | Group Financials | Westcon Group | Logicalis Group | Consulting Services | Future outlook

32
Logicalis Group Future outlook
Overview | Group Financials | Westcon Group | Logicalis Group | Consulting Services | Future outlook
• General market for IT products and services is forecast to improve in 2014/15
• Trading conditions for certain categories of product sales remain challenging
• Strong growth in cloud infrastructure services
• Group well positioned to drive annuity services and improve operating margins
• Recovery in Southern Cone region within Latin America expected to continue in H2
• H2 performance expected to be better

Consulting Services

34
Consulting Services
US$m H1 FY15 H1 FY14 Change %
Revenue 27.8 37.1 (25%)
Gross profit 9.1 14.4 (37%)
Gross margin % 32.7% 38.8%
Operating costs (7.7) (12.2) (37%)
Operating cost margin % 27.7% 32.9%
EBITDA 1.4 2.2 (36%)
EBITDA% 5.0% 5.9%
Operating profit 0.9 1.7 (47%)
Operating profit % 3.2% 4.6%
Financial performance
Overview | Group Financials | Westcon Group | Logicalis Group | Consulting Services | Future outlook
• Analysys Mason comprises
the majority of this division
• Revenue shortfall reflects
Intact disposal
• Expect improvement in
second half
Strategy & Outlook

36
Datatec Group Strategy
Overview | Group Financials | Westcon Group | Logicalis Group | Consulting Services | Future outlook
• Tracking innovation, operational improvement and earnings leverage
• Adapting to services driven revenue streams with lower transactional capex component
• Exploring financing initiatives to meet evolving customer demands
• Continued global diversification

37
Datatec Group Current trading and prospects
Overview | Group Financials | Westcon Group | Logicalis Group | Consulting Services | Future outlook
• Strengthening US$ should boost contribution from the US but headwind in some EMs
• Asia Pacific has slowed around lower China growth
• Networking, Security, Data Centre and infrastructure services are strong growth areas
• Our geographic diversification and business mix remains our strength
• No change to original full year forecast

Thank you & Questions

39
Datatec Group Disclaimer
This presentation may contain statements regarding the future financial performance of the Group which may be considered to be
forward-looking statements. By their nature, forward-looking statements involve risk and uncertainty, and although the Group has taken
reasonable care to ensure the accuracy of the information presented, no assurance can be given that such expectations will prove to
have been correct.
The Group has attempted to identify important factors that could cause actual actions, events or results to differ materially from those
described in forward-looking statements, there may be other factors that cause actions, events or results not to be as anticipated,
estimated or intended. It is important to note, that:
• unless otherwise indicated, forward-looking statements indicate the Group’s expectations and have not been reviewed or reported on
by the Group’s external auditors;
• actual results may differ materially from the Group`s expectations if known and unknown risks or uncertainties affect its business, or if
estimates or assumptions prove inaccurate;
• the Group cannot guarantee that any forward-looking statement will materialize and, accordingly, readers are cautioned not to place
undue reliance on these forward- looking statements; and
• the Group disclaims any intention and assumes no obligation to update or revise any forward-looking statement even if new
information becomes available, as a result of future events or for any other reason, other than as required by the JSE Limited Listings
Requirements.