Embed Size (px)
Citation preview
1
Ferrovial Investing for Growth FY 2015
2
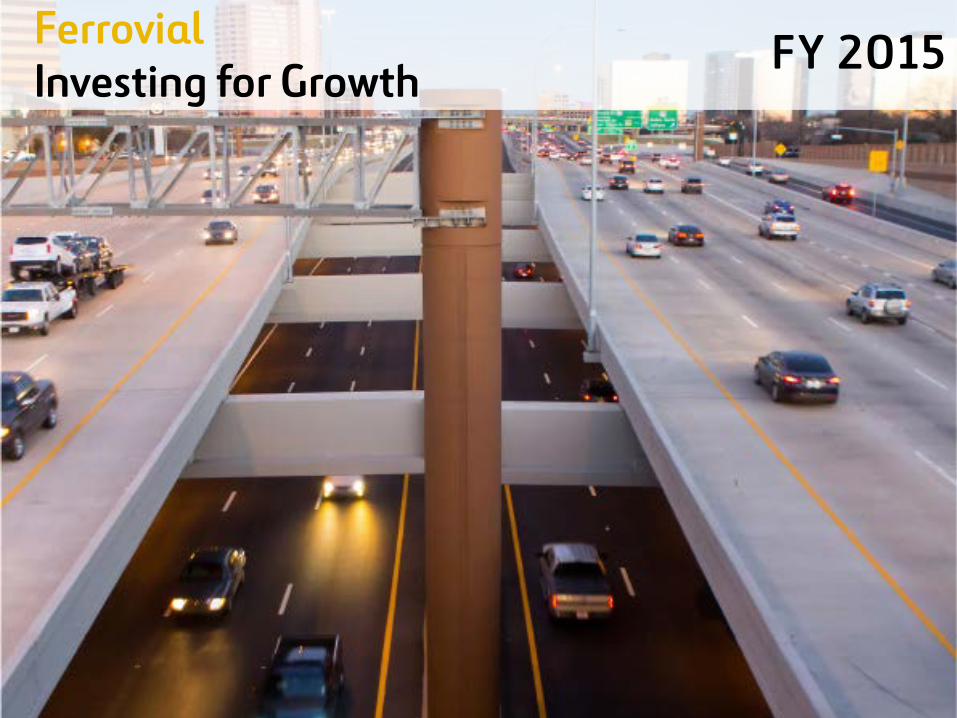
Human Resources
Ferrovial spent 0.22% of revenues on employee training
22 Hours per employee
84% employees would recommend Ferrovial as a good company to work for
-43.7Reduction of greenhouse gas emissions
2009 - 2015
Employee education commitment
Environment
19Of electricity consumed by ferrovial came
from renewable sources
100 in the case of Amey
FY2015 figures
Spain 51%
America 3%
UK 28%
Poland 6%
RoW 12%
70% MALE
30% FEMALE
41.9 42.8 AVERAGE AGE
8.5 8.4 YEARS OF SENIORITY
77% 81% PERMANENT CONTRACT
87% 13% MANAGEMENT
2.5% 0.7% ROTATION INDEX
67% 33% NEW RECRUITMENTS
Present in 24 countries
74,032 Workforce

3
Ferrovial Overview & Strategy
4
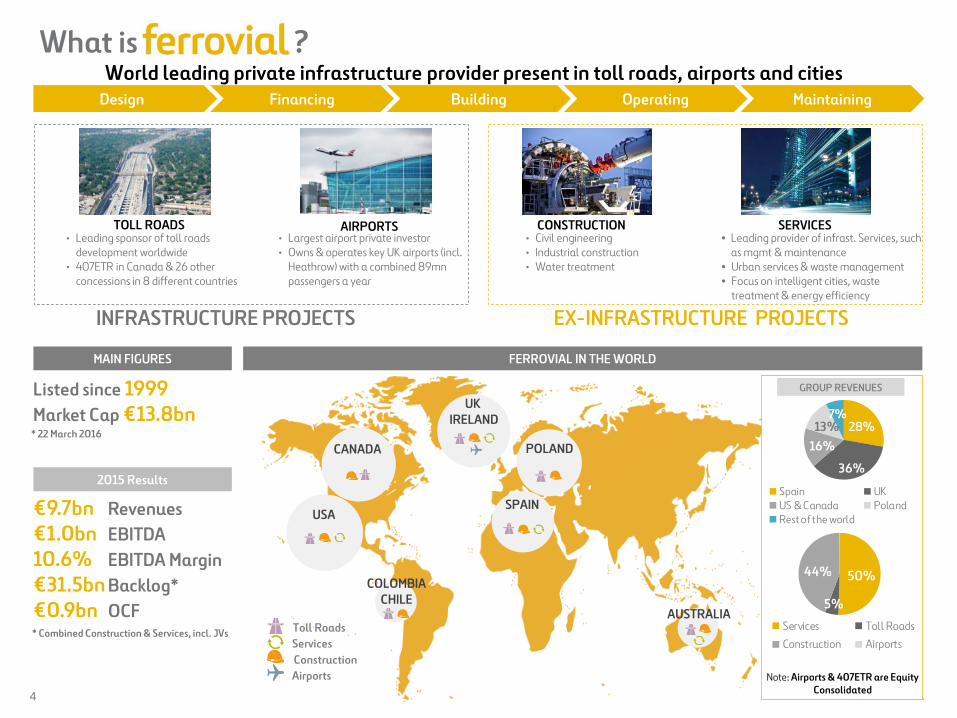
World leading private infrastructure provider present in toll roads, airports and cities
AIRPORTS CONSTRUCTION TOLL ROADS SERVICES
Design Financing Operating Building Maintaining
CANADA
UK IRELAND
SPAIN
POLAND
USA
Construction Airports
Toll Roads Services
AUSTRALIA
GROUP REVENUES
Note: Airports & 407ETR are Equity Consolidated
COLOMBIA CHILE
FERROVIAL IN THE WORLD MAIN FIGURES
€9.7bn Revenues €1.0bn EBITDA 10.6% EBITDA Margin €31.5bn Backlog* €0.9bn OCF
2015 Results
* Combined Construction & Services, incl. JVs
• Civil engineering • Industrial construction • Water treatment
• Largest airport private investor • Owns & operates key UK airports (incl.
Heathrow) with a combined 89mn passengers a year
• Leading sponsor of toll roads development worldwide
• 407ETR in Canada & 26 other concessions in 8 different countries
• Leading provider of infrast. Services, such as mgmt & maintenance
• Urban services & waste management • Focus on intelligent cities, waste
treatment & energy efficiency
What is ?
EX-INFRASTRUCTURE PROJECTS
INFRASTRUCTURE PROJECTS
Listed since 1999 Market Cap €13.8bn * 22 March 2016 28%
36%
16%13%
7%
Spain UKUS & Canada PolandRest of the world
50%
5%
44%
Services Toll Roads
Construction Airports
5
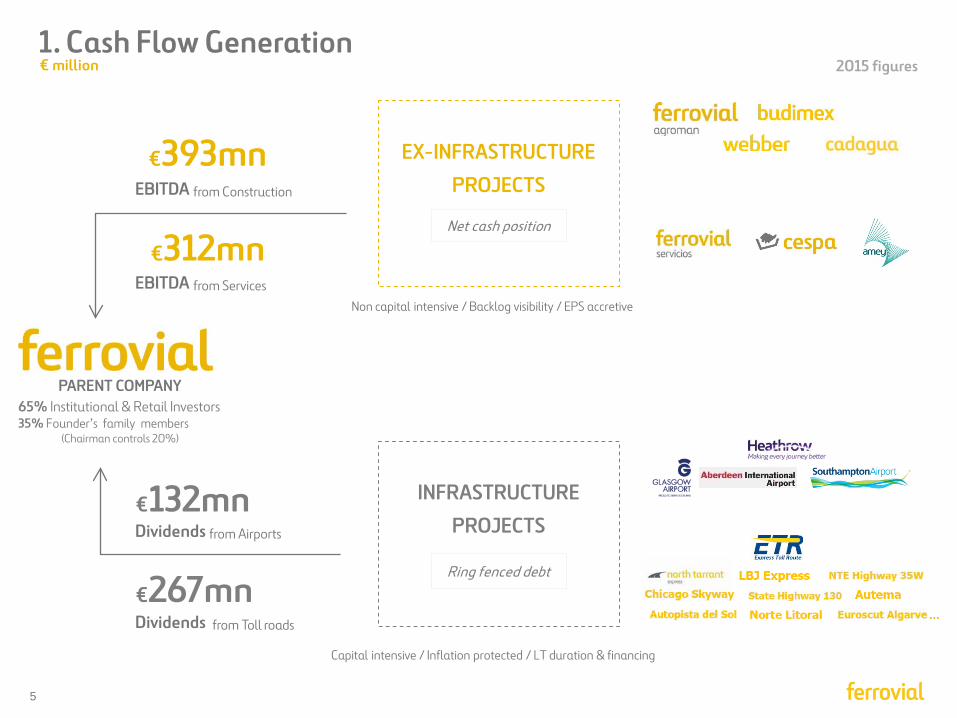
PARENT COMPANY
INFRASTRUCTURE
PROJECTS
EX-INFRASTRUCTURE
PROJECTS
Capital intensive / Inflation protected / LT duration & financing
Non capital intensive / Backlog visibility / EPS accretive
Ring fenced debt
Net cash position
1. Cash Flow Generation
€267mn Dividends from Toll roads
€132mn Dividends from Airports
€312mn
€393mn EBITDA from Construction
EBITDA from Services
€ million 2015 figures
65% Institutional & Retail Investors 35% Founder’s family members
(Chairman controls 20%)
…
6
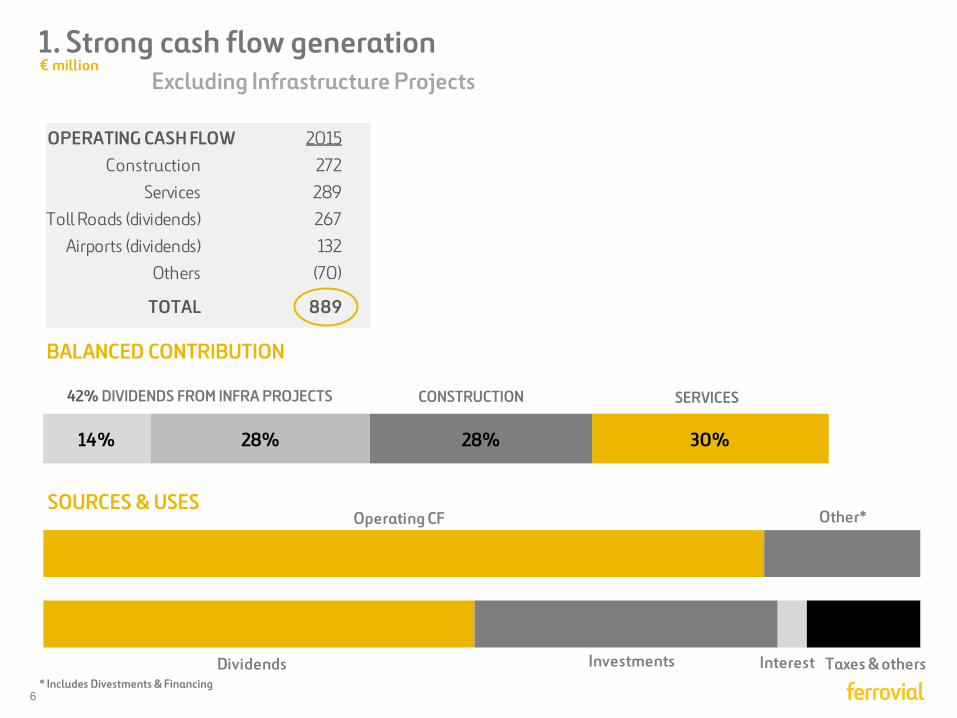
SOURCES & USES
BALANCED CONTRIBUTION
Excluding Infrastructure Projects
42% DIVIDENDS FROM INFRA PROJECTS CONSTRUCTION SERVICES
* Includes Divestments & Financing
1. Strong cash flow generation € million
30%28%28%14%
Dividends
Operating CF
Investments
Other*
Interest Taxes & others
OPERATING CASH FLOW 2015Construction 272
Services 289Toll Roads (dividends) 267
Airports (dividends) 132Others (70)
TOTAL 889
7
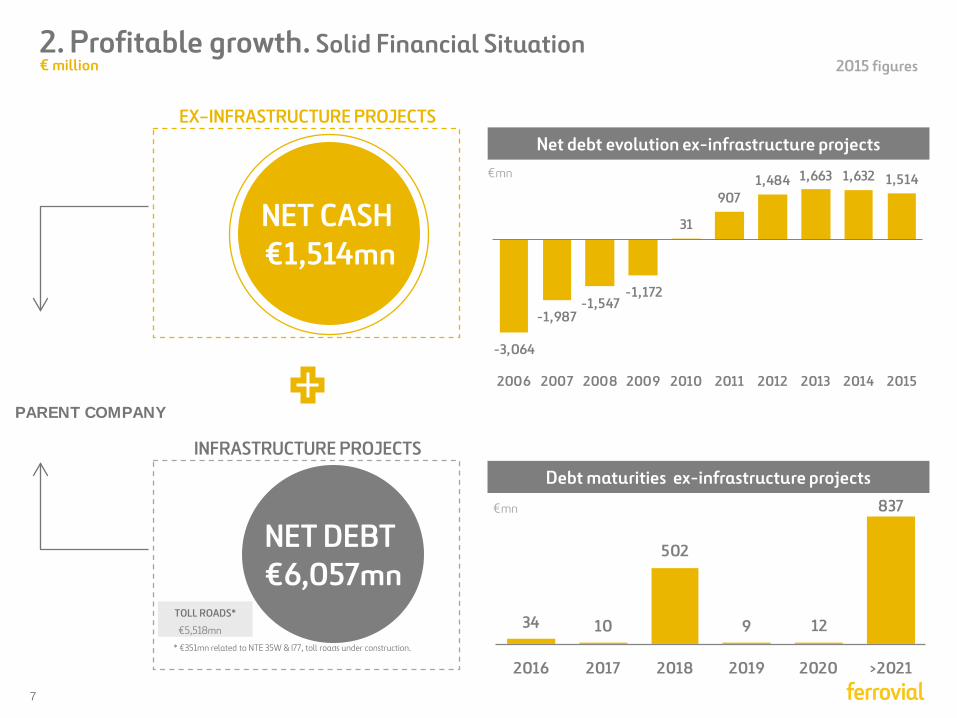
34 10
502
9 12
837
2016 2017 2018 2019 2020 >2021
-3,064
-1,987-1,547
-1,172
31
9071,484 1,663 1,632 1,514
2006 2007 2008 2009 2010 2011 2012 2013 2014 2015
PARENT COMPANY
2. Profitable growth. Solid Financial Situation
Net debt evolution ex-infrastructure projects EX–INFRASTRUCTURE PROJECTS
TOLL ROADS* €5,518mn
* €351mn related to NTE 35W & I77, toll roads under construction.
INFRASTRUCTURE PROJECTS
Debt maturities ex-infrastructure projects
NET CASH €1,514mn
€mn
€mn
NET DEBT €6,057mn
€ million 2015 figures
8
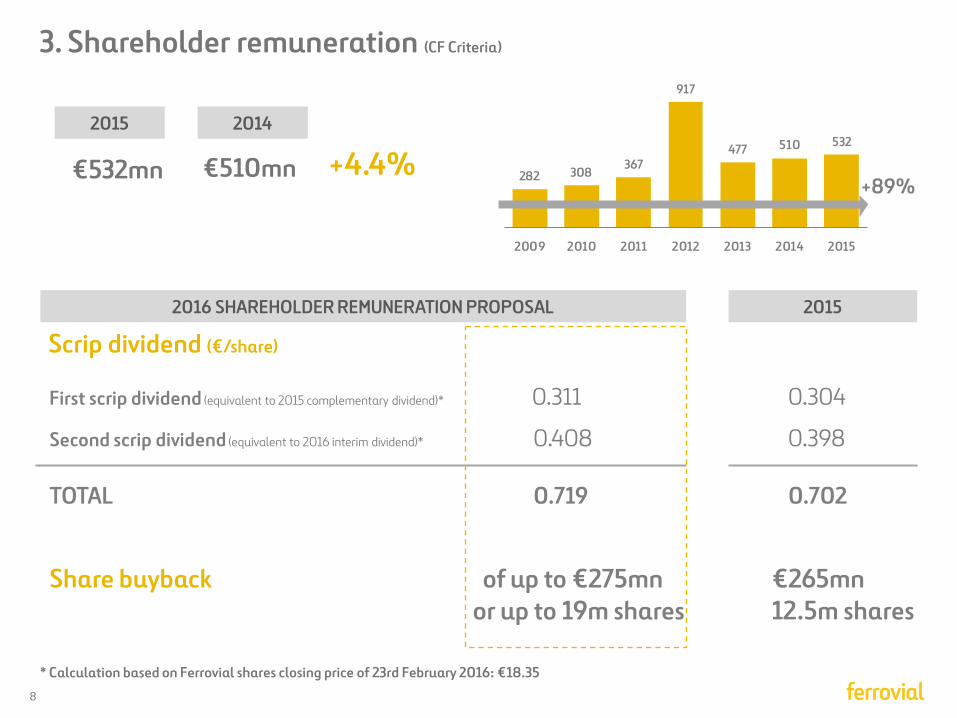
3. Shareholder remuneration (CF Criteria)
282 308367
917
477 510 532
2009 2010 2011 2012 2013 2014 2015
+4.4% 2014 2015
€510mn €532mn +89%
2016 SHAREHOLDER REMUNERATION PROPOSAL
Scrip dividend (€/share)
First scrip dividend (equivalent to 2015 complementary dividend)* 0.311 0.304
Second scrip dividend (equivalent to 2016 interim dividend)* 0.408 0.398 TOTAL 0.719 0.702
Share buyback of up to €275mn or up to 19m shares
2015
€265mn 12.5m shares
* Calculation based on Ferrovial shares closing price of 23rd February 2016: €18.35

9
Ferrovial 2015 Results
10
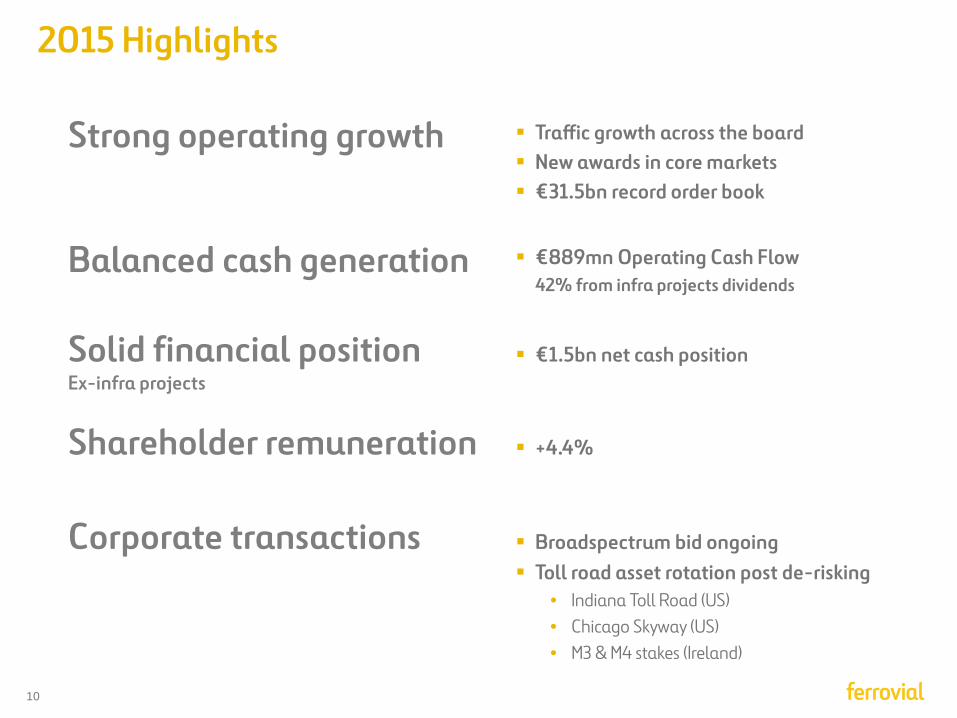
Traffic growth across the board New awards in core markets €31.5bn record order book
Strong operating growth
Balanced cash generation €889mn Operating Cash Flow 42% from infra projects dividends
Shareholder remuneration +4.4%
Corporate transactions Broadspectrum bid ongoing Toll road asset rotation post de-risking
• Indiana Toll Road (US) • Chicago Skyway (US) • M3 & M4 stakes (Ireland)
Solid financial position Ex-infra projects
€1.5bn net cash position
2015 Highlights
11
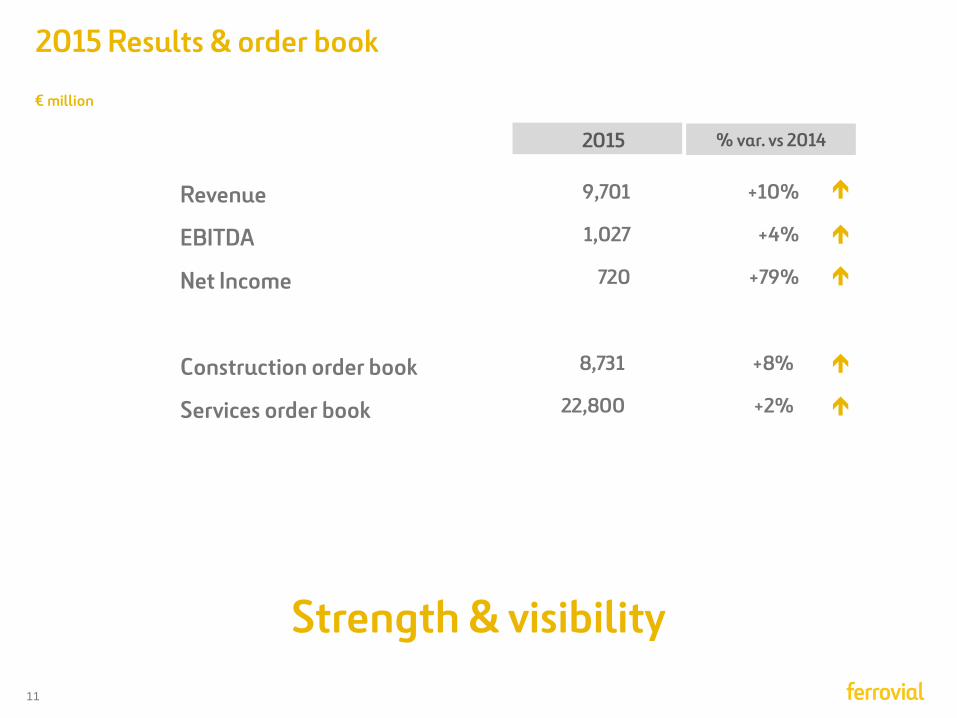
Revenue
EBITDA
Net Income
Construction order book
Services order book
€ million
Strength & visibility
% var. vs 2014
2015 Results & order book
9,701 +10%
1,027 +4%
720 +79%
8,731 +8%
22,800 +2%
2015
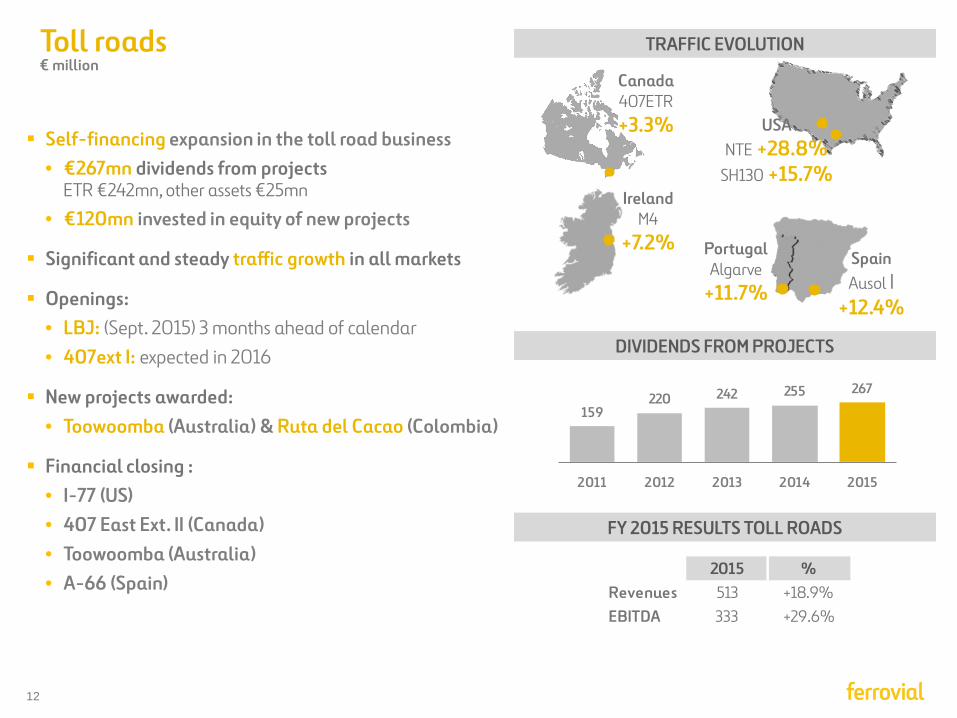
12
Self-financing expansion in the toll road business • €267mn dividends from projects
ETR €242mn, other assets €25mn
• €120mn invested in equity of new projects
Significant and steady traffic growth in all markets
Openings: • LBJ: (Sept. 2015) 3 months ahead of calendar • 407ext I: expected in 2016
New projects awarded: • Toowoomba (Australia) & Ruta del Cacao (Colombia)
Financial closing : • I-77 (US) • 407 East Ext. II (Canada) • Toowoomba (Australia) • A-66 (Spain)
TRAFFIC EVOLUTION
DIVIDENDS FROM PROJECTS
FY 2015 RESULTS TOLL ROADS
Canada 407ETR +3.3% USA
NTE +28.8% SH130 +15.7%
Ireland M4
+7.2% Portugal Algarve
+11.7%
Spain Ausol I
+12.4%
Toll roads € million
159220 242 255 267
2011 2012 2013 2014 2015
2015 %Revenues 513 +18.9%EBITDA 333 +29.6%
13
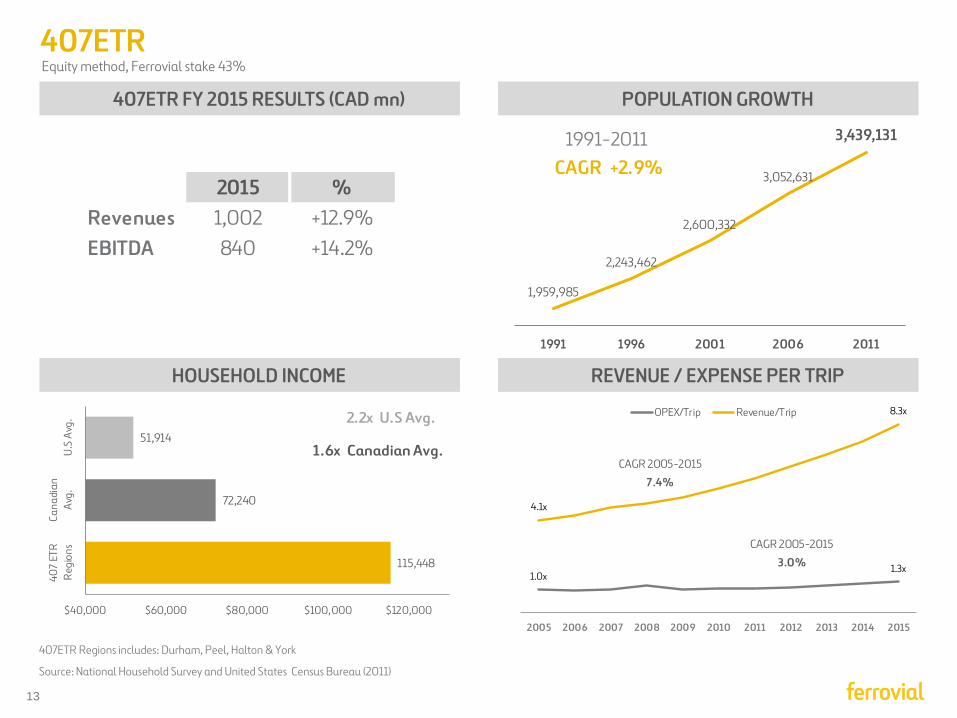
Equity method, Ferrovial stake 43%
407ETR FY 2015 RESULTS (CAD mn)
407ETR Regions includes: Durham, Peel, Halton & York
Source: National Household Survey and United States Census Bureau (2011)
POPULATION GROWTH
HOUSEHOLD INCOME REVENUE / EXPENSE PER TRIP
407ETR
2015 %Revenues 1,002 +12.9%EBITDA 840 +14.2%
1,959,985
2,243,462
2,600,332
3,052,631
3,439,131
1991 1996 2001 2006 2011
1991-2011CAGR +2.9%
115,448
72,240
51,914
$40,000 $60,000 $80,000 $100,000 $120,000
407
ETR
Reg
ions
Cana
dian
Avg
.U
.S A
vg. 2.2x U.S Avg.
1.6x Canadian Avg.
1.0x1.3x
4.1x
8.3x
2005 2006 2007 2008 2009 2010 2011 2012 2013 2014 2015
OPEX/Trip Revenue/Trip
CAGR 2005-2015
3.0%
CAGR 2005-2015
7.4%
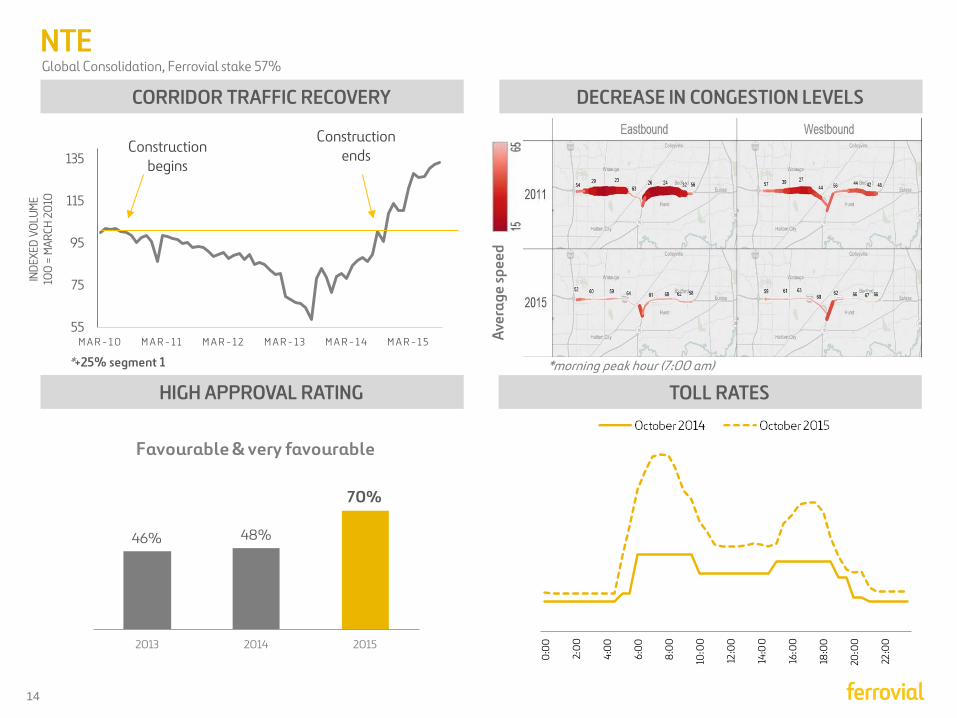
14
HIGH APPROVAL RATING
CORRIDOR TRAFFIC RECOVERY
TOLL RATES
DECREASE IN CONGESTION LEVELS
Aver
age
spee
d
55
75
95
115
135
M A R - 1 0 M A R - 1 1 M A R - 1 2 M A R - 1 3 M A R - 1 4 M A R - 1 5
Construction begins
Construction ends
INDE
XED
VOLU
ME
100
= M
ARCH
201
0
*morning peak hour (7:00 am) *+25% segment 1
NTE Global Consolidation, Ferrovial stake 57%
0:0
0
2:0
0
4:0
0
6:0
0
8:0
0
10:0
0
12:0
0
14:0
0
16:0
0
18:0
0
20:0
0
22:0
0
46% 48%
70%
2013 2014 2015
Favourable & very favourable
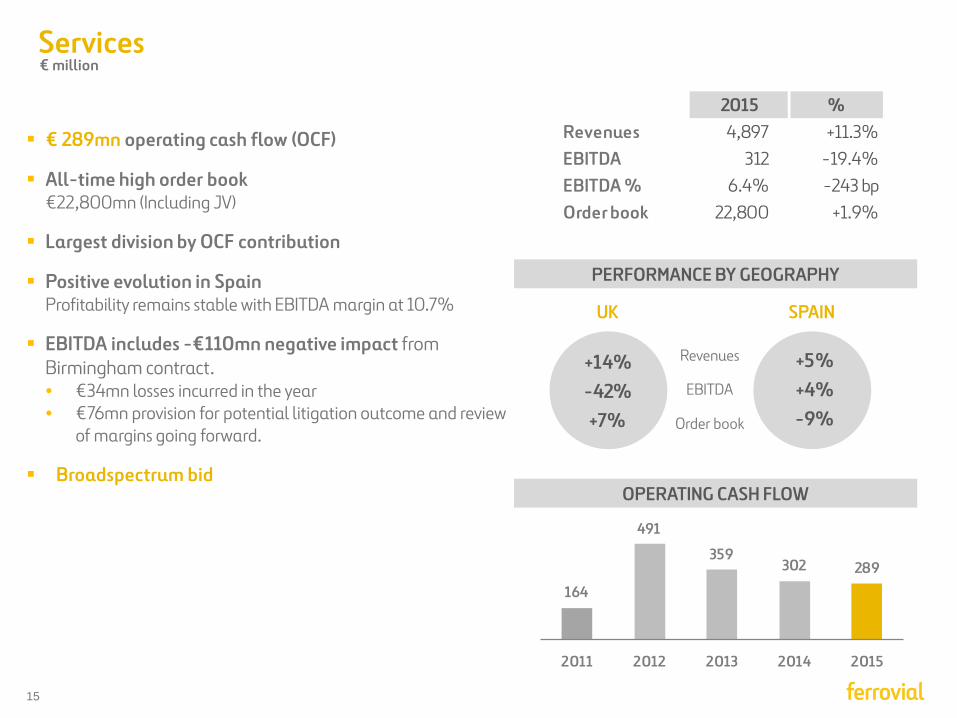
15
€ 289mn operating cash flow (OCF)
All-time high order book €22,800mn (Including JV)
Largest division by OCF contribution
Positive evolution in Spain Profitability remains stable with EBITDA margin at 10.7%
EBITDA includes -€110mn negative impact from Birmingham contract. • €34mn losses incurred in the year • €76mn provision for potential litigation outcome and review
of margins going forward.
Broadspectrum bid
SPAIN UK
Revenues
EBITDA
Order book
PERFORMANCE BY GEOGRAPHY
OPERATING CASH FLOW
Services € million
164
491
359302 289
2011 2012 2013 2014 2015
2015 %Revenues 4,897 +11.3%EBITDA 312 -19.4%EBITDA % 6.4% -243 bpOrder book 22,800 +1.9%
+14%-42%+7%
+5%+4%-9%
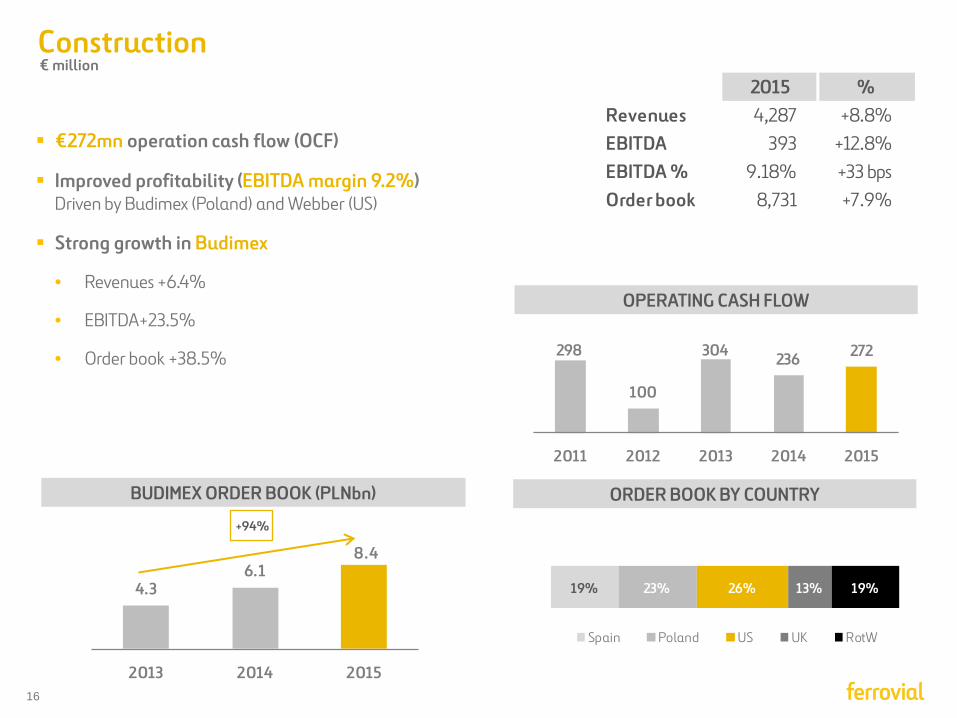
16
€272mn operation cash flow (OCF)
Improved profitability (EBITDA margin 9.2%) Driven by Budimex (Poland) and Webber (US)
Strong growth in Budimex
• Revenues +6.4%
• EBITDA+23.5%
• Order book +38.5%
OPERATING CASH FLOW
ORDER BOOK BY COUNTRY BUDIMEX ORDER BOOK (PLNbn)
Construction € million
2015 %Revenues 4,287 +8.8%EBITDA 393 +12.8%EBITDA % 9.18% +33 bpsOrder book 8,731 +7.9%
298
100
304 236 272
2011 2012 2013 2014 2015
4.36.1
8.4
2013 2014 2015
+94%
19% 23% 26% 13% 19%
Spain Poland US UK RotW
17
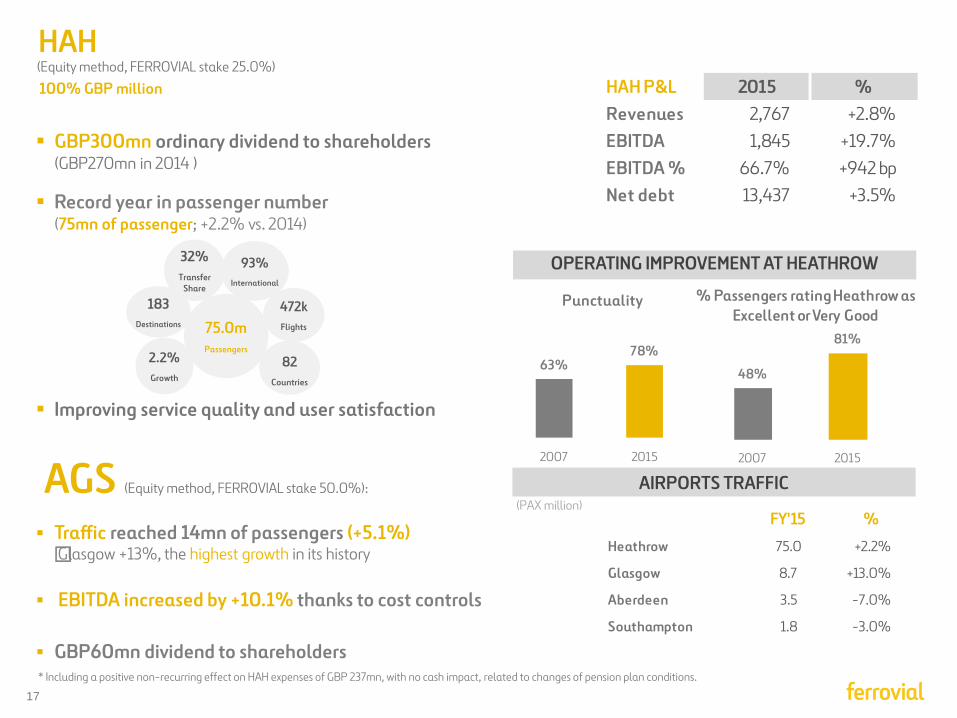
100% GBP million
GBP300mn ordinary dividend to shareholders (GBP270mn in 2014 )
Record year in passenger number (75mn of passenger; +2.2% vs. 2014)
Improving service quality and user satisfaction
AGS (Equity method, FERROVIAL stake 50.0%):
Traffic reached 14mn of passengers (+5.1%)
Glasgow +13%, the highest growth in its history
EBITDA increased by +10.1% thanks to cost controls
GBP60mn dividend to shareholders
(PAX million)
AIRPORTS TRAFFIC
OPERATING IMPROVEMENT AT HEATHROW
* Including a positive non-recurring effect on HAH expenses of GBP 237mn, with no cash impact, related to changes of pension plan conditions.
(Equity method, FERROVIAL stake 25.0%)
82 Countries
32% Transfer
Share
2.2% Growth
93% International
472k Flights 75.0m
Passengers
183 Destinations
HAH HAH P&L 2015 %Revenues 2,767 +2.8%EBITDA 1,845 +19.7%EBITDA % 66.7% +942 bpNet debt 13,437 +3.5%
FY'15 %
Heathrow 75.0 +2.2%
Glasgow 8.7 +13.0%
Aberdeen 3.5 -7.0%
Southampton 1.8 -3.0%
63%78%
2007 2015
Punctuality
48%
81%
2007 2015
% Passengers rating Heathrow as Excellent or Very Good
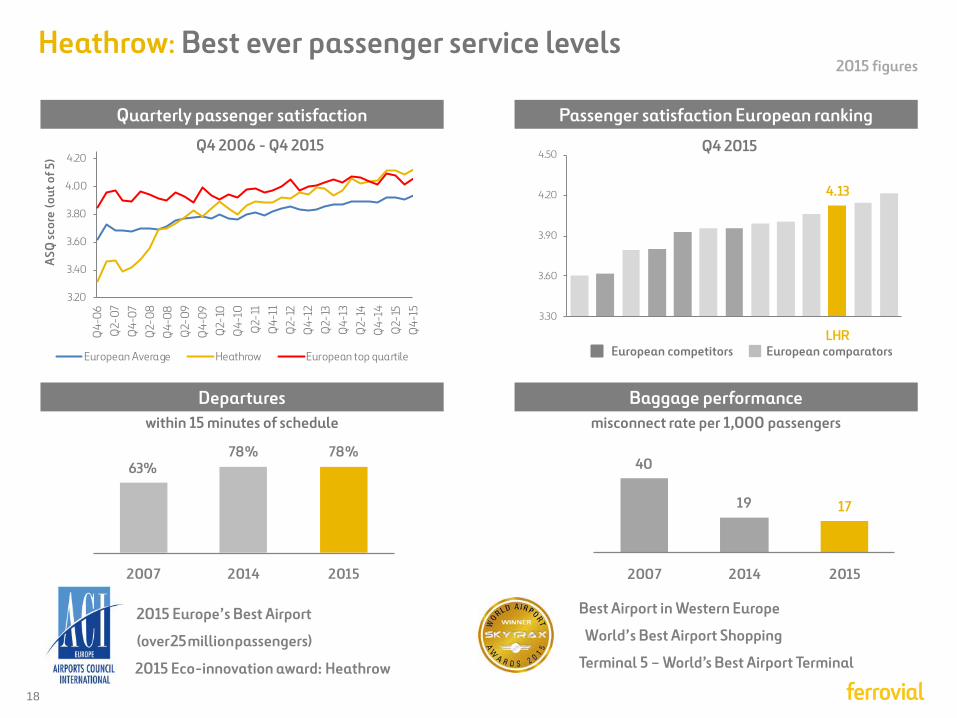
18
Heathrow: Best ever passenger service levels
Passenger satisfaction European ranking
2015 figures
Quarterly passenger satisfaction
Q4 2006 - Q4 2015
European competitors European comparators
Baggage performance Departures misconnect rate per 1,000 passengers within 15 minutes of schedule
Q4 2015
Best Airport in Western Europe
World’s Best Airport Shopping
Terminal 5 – World’s Best Airport Terminal
•2015 Europe’s Best Airport
•(over 25 million passengers)
2015 Eco-innovation award: Heathrow
3.20
3.40
3.60
3.80
4.00
4.20
Q4-
06Q
2-07
Q4-
07Q
2-08
Q4-
08Q
2-09
Q4-
09Q
2-10
Q4-
10Q
2-11
Q4-
11Q
2-12
Q4-
12Q
2-13
Q4-
13Q
2-14
Q4-
14Q
2-15
Q4-
15
ASQ
scor
e (o
ut o
f 5)
European Average Heathrow European top quartile
4.13
3.30
3.60
3.90
4.20
4.50
LHR
63%78% 78%
2007 2014 2015
40
19 17
2007 2014 2015
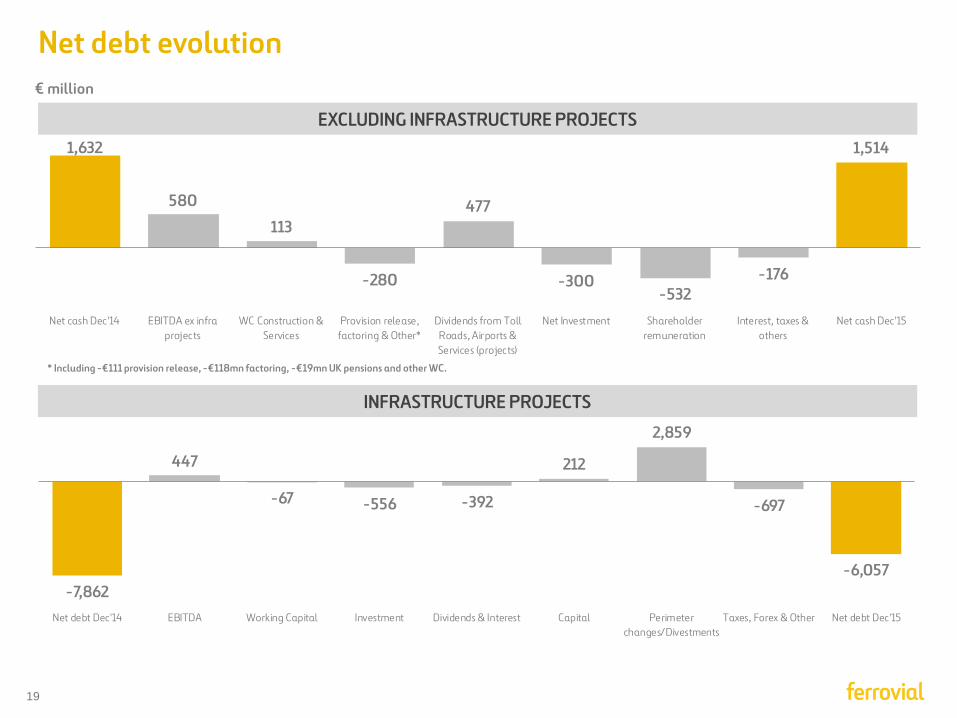
19
€ million
INFRASTRUCTURE PROJECTS
EXCLUDING INFRASTRUCTURE PROJECTS
* Including -€111 provision release, -€118mn factoring, -€19mn UK pensions and other WC.
Net debt evolution
1,632
580
113
-280
477
-300-532
-176
1,514
Net cash Dec'14 EBITDA ex infraprojects
WC Construction &Services
Provision release,factoring & Other*
Dividends from TollRoads, Airports &Services (projects)
Net Investment Shareholderremuneration
Interest, taxes &others
Net cash Dec'15
-7,862
447
-67 -556 -392
212
2,859
-697
-6,057
Net debt Dec'14 EBITDA Working Capital Investment Dividends & Interest Capital Perimeterchanges/Divestments
Taxes, Forex & Other Net debt Dec'15
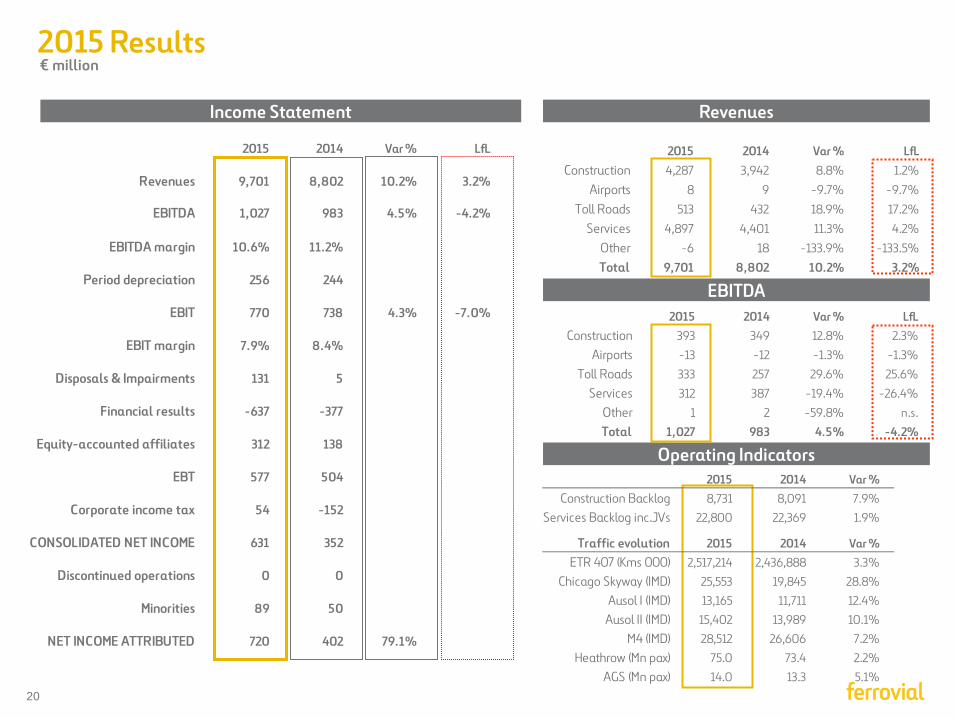
20
2015 Results
Income Statement Revenues
EBITDA
Operating Indicators
€ million
2015 2014 Var % LfL
Revenues 9,701 8,802 10.2% 3.2%
EBITDA 1,027 983 4.5% -4.2%
EBITDA margin 10.6% 11.2%
Period depreciation 256 244
EBIT 770 738 4.3% -7.0%
EBIT margin 7.9% 8.4%
Disposals & Impairments 131 5
Financial results -637 -377
Equity-accounted affiliates 312 138
EBT 577 504
Corporate income tax 54 -152
CONSOLIDATED NET INCOME 631 352
Discontinued operations 0 0
Minorities 89 50
NET INCOME ATTRIBUTED 720 402 79.1%
2015 2014 Var % LfLConstruction 4,287 3,942 8.8% 1.2%
Airports 8 9 -9.7% -9.7%
Toll Roads 513 432 18.9% 17.2%
Services 4,897 4,401 11.3% 4.2%
Other -6 18 -133.9% -133.5%
Total 9,701 8,802 10.2% 3.2%
2015 2014 Var % LfLConstruction 393 349 12.8% 2.3%
Airports -13 -12 -1.3% -1.3%
Toll Roads 333 257 29.6% 25.6%
Services 312 387 -19.4% -26.4%
Other 1 2 -59.8% n.s.
Total 1,027 983 4.5% -4.2%
2015 2014 Var %Construction Backlog 8,731 8,091 7.9%
Services Backlog inc.JVs 22,800 22,369 1.9%
Traffic evolution 2015 2014 Var % ETR 407 (Kms 000) 2,517,214 2,436,888 3.3%
Chicago Skyway (IMD) 25,553 19,845 28.8%
Ausol I (IMD) 13,165 11,711 12.4%
Ausol II (IMD) 15,402 13,989 10.1%
M4 (IMD) 28,512 26,606 7.2%
Heathrow (Mn pax) 75.0 73.4 2.2%
AGS (Mn pax) 14.0 13.3 5.1%

22
Appendix
Introduction to 407ETR Toll road
Managed Lanes Toll roads
407ETR vs Managed Lanes
Diversified porftolio
Historic consolidated & business units figures
23
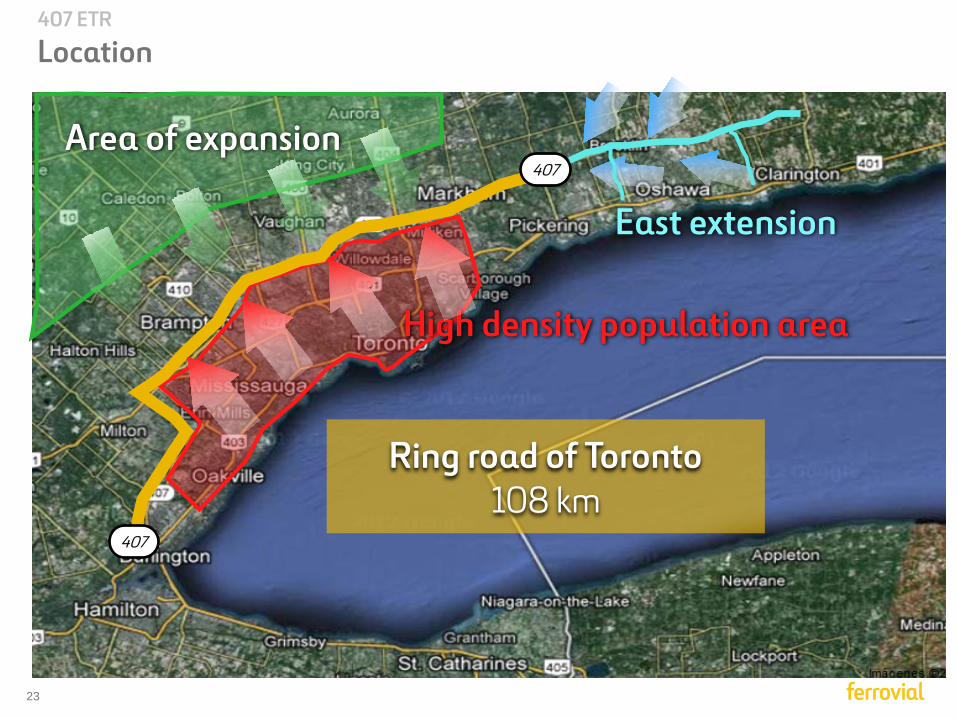
High density population area
Ring road of Toronto 108 km
407
407
East extension
Area of expansion
407 ETR
Location
24
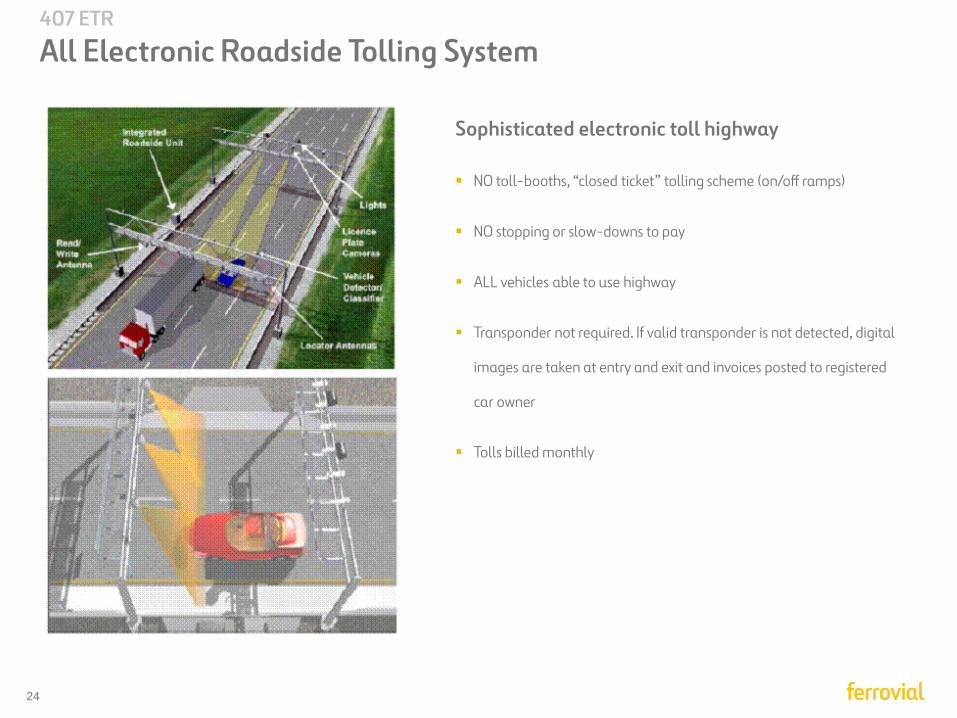
407 ETR
All Electronic Roadside Tolling System
Sophisticated electronic toll highway
NO toll-booths, “closed ticket” tolling scheme (on/off ramps)
NO stopping or slow-downs to pay
ALL vehicles able to use highway
Transponder not required. If valid transponder is not detected, digital
images are taken at entry and exit and invoices posted to registered
car owner
Tolls billed monthly
25
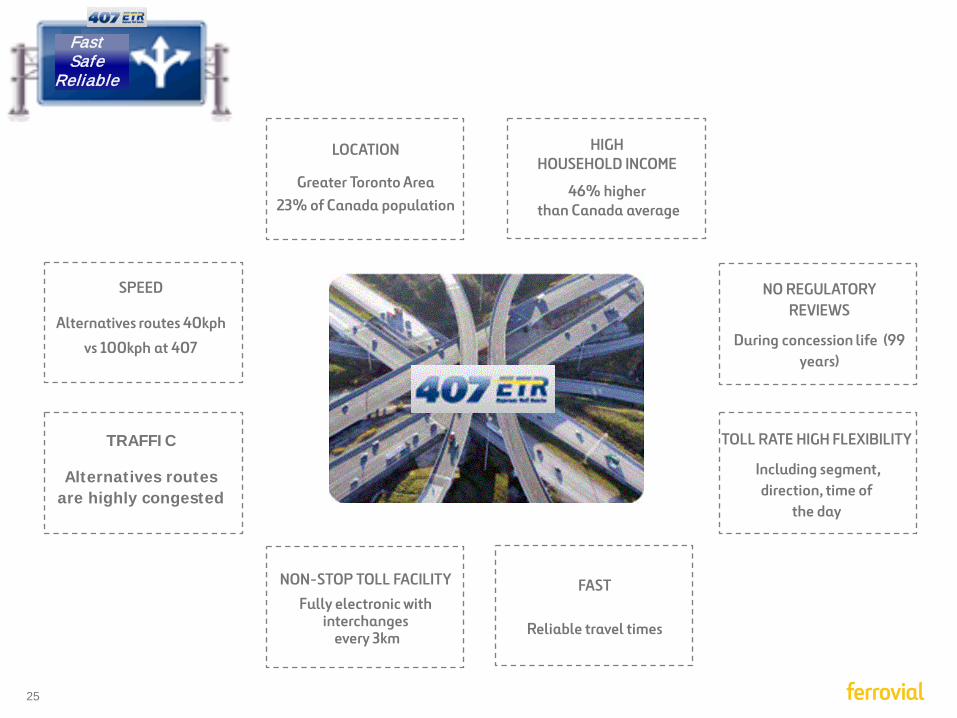
407 ETR
LOCATION
Greater Toronto Area 23% of Canada population
TRAFFIC
Alternatives routes are highly congested
HIGH HOUSEHOLD INCOME
46% higher than Canada average
NO REGULATORY REVIEWS
During concession life (99 years)
SPEED
Alternatives routes 40kph
vs 100kph at 407
NON-STOP TOLL FACILITY
Fully electronic with interchanges
every 3km
TOLL RATE HIGH FLEXIBILITY
Including segment, direction, time of
the day
FAST
Reliable travel times
Fast Safe
Reliable
26
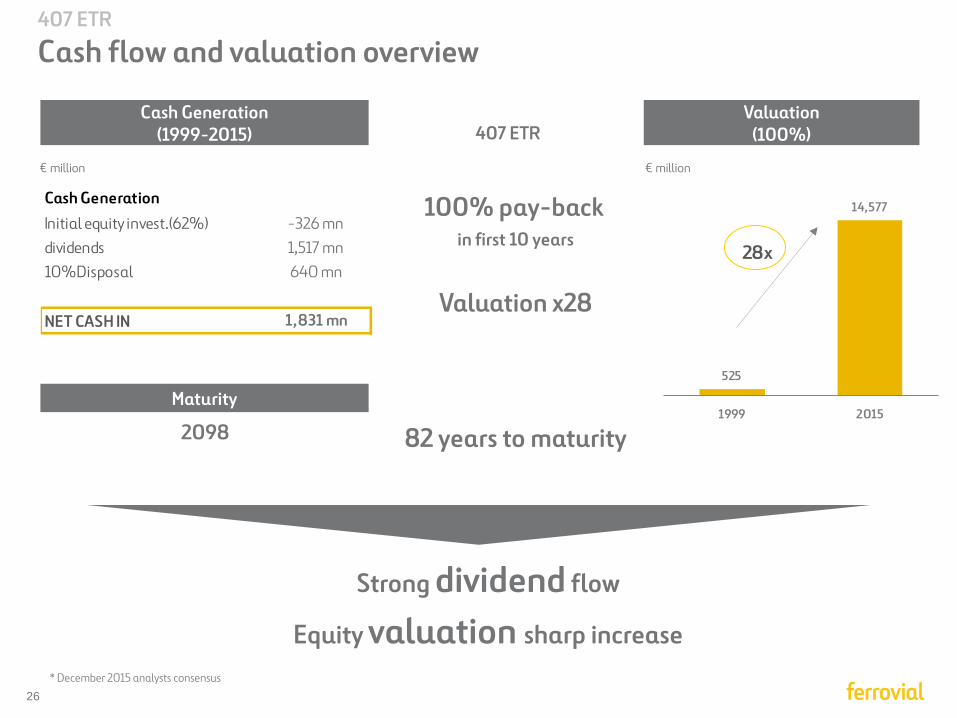
525
14,577
1999 2015
Strong dividend flow
Equity valuation sharp increase
2098
100% pay-back
in first 10 years
Valuation x28
* December 2015 analysts consensus
407 ETR
82 years to maturity
407 ETR
Cash flow and valuation overview
€ million
Cash Generation (1999-2015)
Valuation (100%)
€ million
Maturity
28x
Cash GenerationInitial equity invest.(62%) -326 mndividends 1,517 mn10%Disposal 640 mn
NET CASH IN 1,831 mn
27
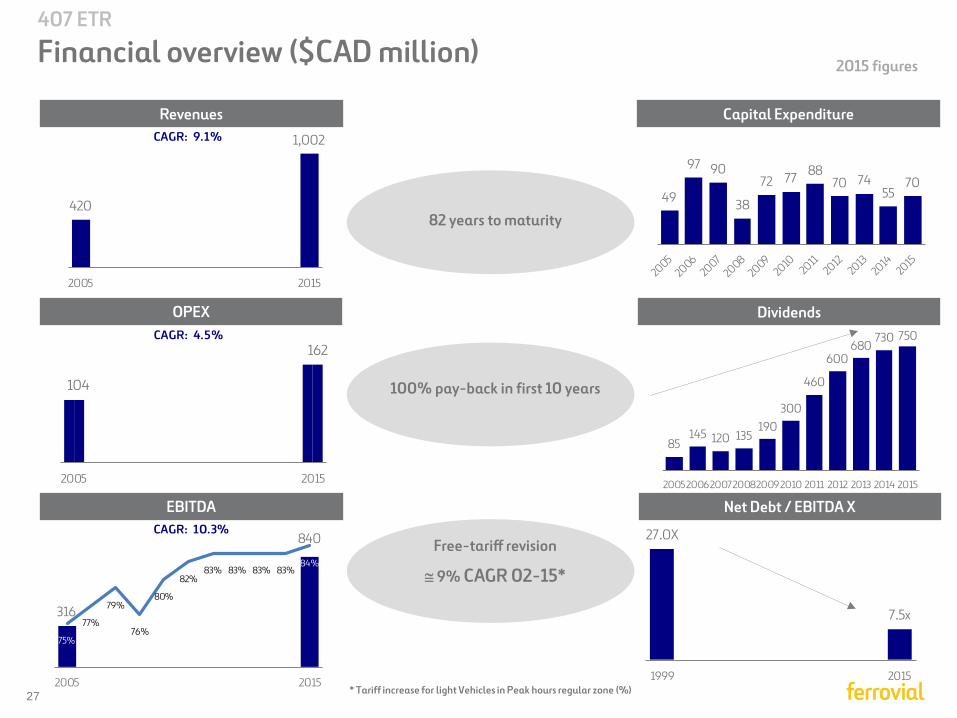
316
840
75%
77%
79%
76%
80%
82%83% 83% 83% 83%
84%
2005 2015
420
1,002
2005 2015
82 years to maturity
100% pay-back in first 10 years
Free-tariff revision
≅ 9% CAGR 02-15*
* Tariff increase for light Vehicles in Peak hours regular zone (%)
407 ETR
Financial overview ($CAD million)
Revenues
EBITDA
OPEX
Capital Expenditure
Dividends
Net Debt / EBITDA X
2015 figures
CAGR: 9.1%
CAGR: 4.5%
104
162
2005 2015
CAGR: 10.3%
49
97 90
38
72 77 8870 74
5570
85145 120 135
190300
460
600680
730 750
20052006200720082009 2010 2011 2012 2013 2014 2015
27.0X
7.5x
1999 2015
28
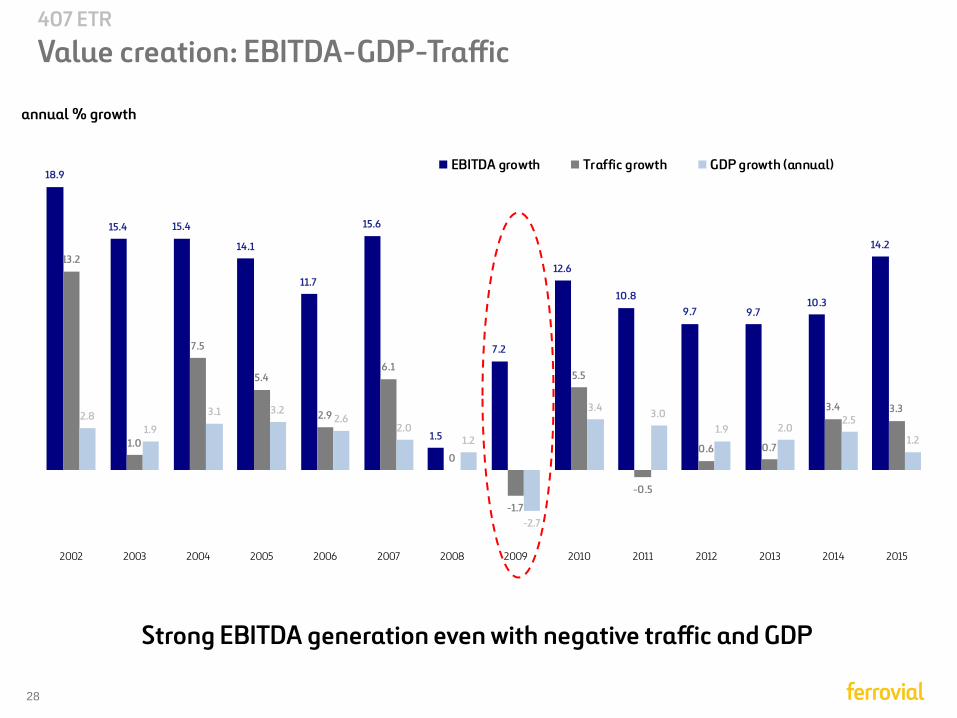
407 ETR
Value creation: EBITDA-GDP-Traffic
Strong EBITDA generation even with negative traffic and GDP
annual % growth
18.9
15.4 15.4
14.1
11.7
15.6
1.5
7.2
12.6
10.89.7 9.7
10.3
14.213.2
1.0
7.5
5.4
2.9
6.1
0
-1.7
5.5
-0.5
0.6 0.7
3.4 3.32.8
1.9
3.1 3.22.6
2.01.2
-2.7
3.4 3.01.9 2.0
2.5
1.2
2002 2003 2004 2005 2006 2007 2008 2009 2010 2011 2012 2013 2014 2015
EBITDA growth Traffic growth GDP growth (annual)
29
Appendix
Introduction to 407ETR Toll road
Managed Lanes Toll roads
407ETR vs Managed Lanes
Diversified porftolio
Historic consolidated & business units figures
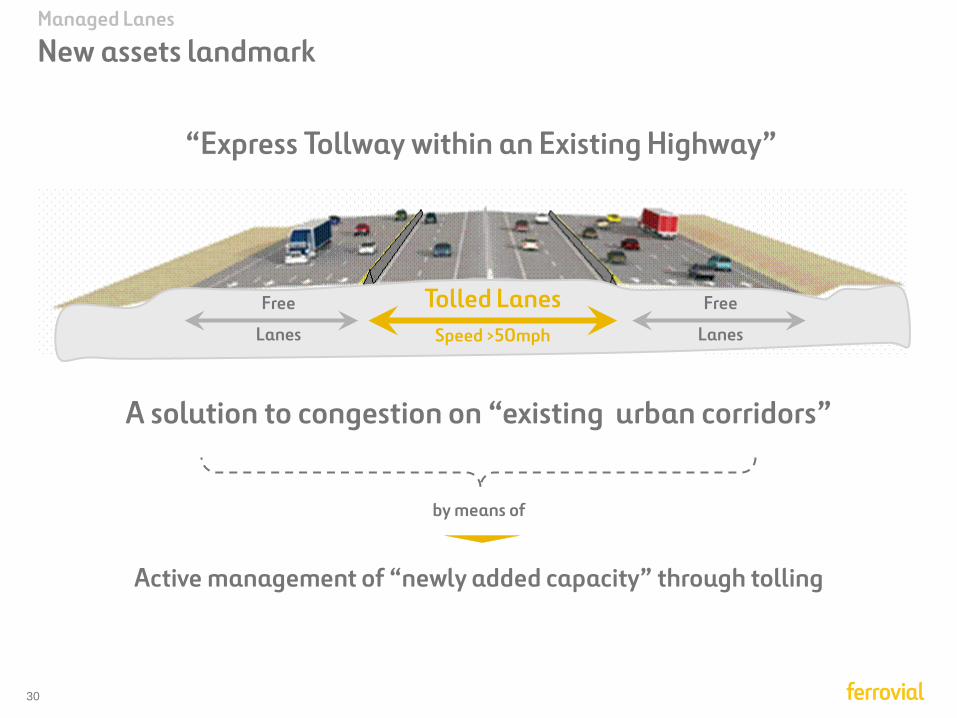
30
A solution to congestion on “existing urban corridors”
Active management of “newly added capacity” through tolling
by means of
Free
Lanes
Free
Lanes
Tolled Lanes Speed >50mph
“Express Tollway within an Existing Highway”
Managed Lanes
New assets landmark
31
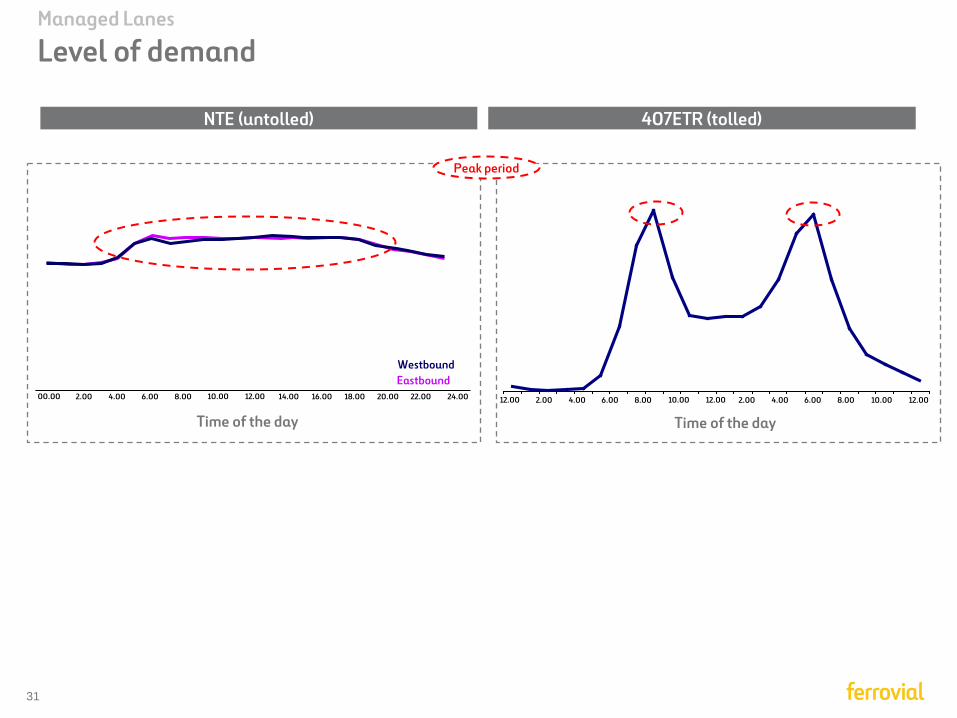
Time of the day
Eastbound Westbound
00.00 2.00 4.00 6.00 8.00 10.00 12.00 14.00 16.00 18.00 20.00 22.00 24.00 12.00 2.00 4.00 6.00 8.00 10.00 12.00 2.00 4.00 6.00 8.00 10.00 12.00
Time of the day
Peak period
Managed Lanes
Level of demand
NTE (untolled) 407ETR (tolled)
32
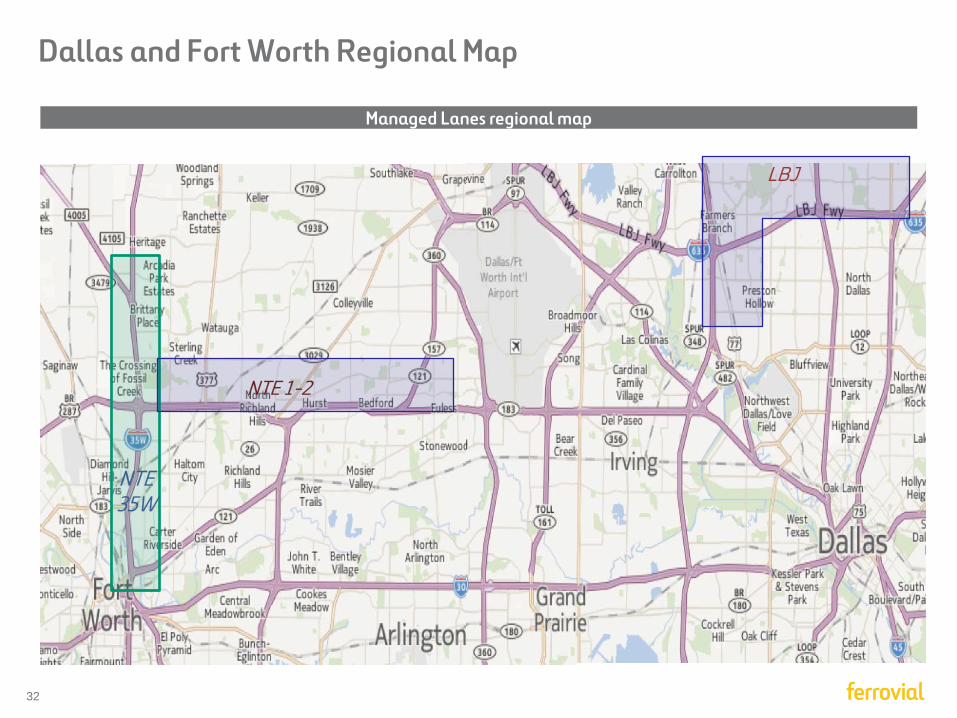
LBJ
Dallas and Fort Worth Regional Map
Managed Lanes regional map
NTE 1-2
NTE 35W
33
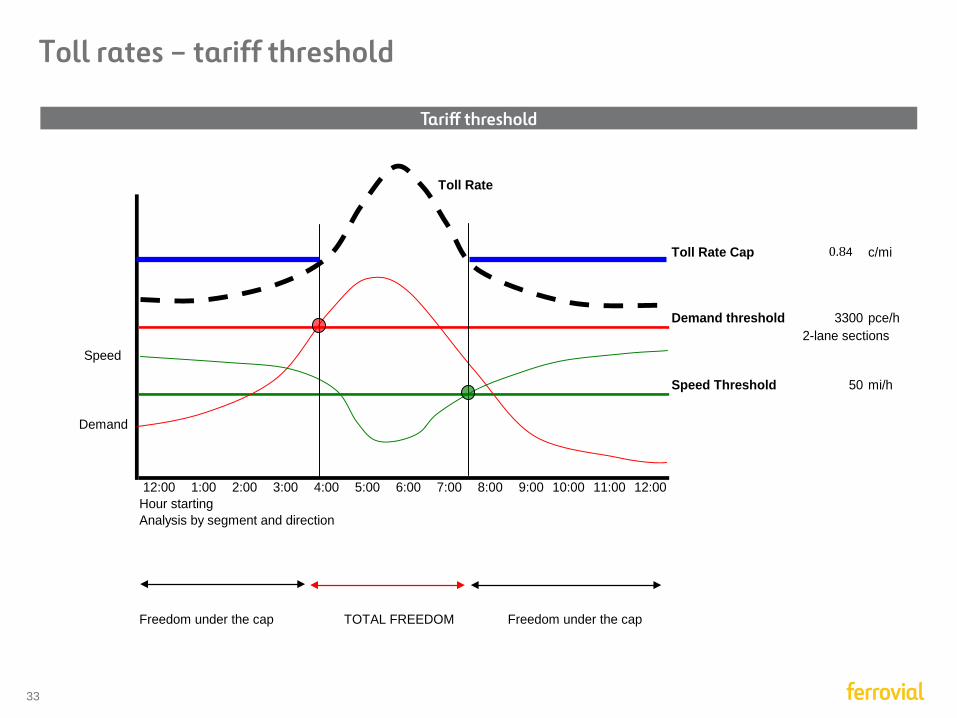
Toll rates – tariff threshold
Toll Rate Cap 0.75 c/mi
Demand threshold 3300 pce/h2-lane sections
Speed Threshold 50 mi/h
12:00 1:00 2:00 3:00 4:00 5:00 6:00 7:00 8:00 9:00 10:00 11:00 12:00Hour startingAnalysis by segment and direction
Freedom under the cap TOTAL FREEDOM Freedom under the cap
Speed
Demand
Toll Rate
Tariff threshold
0.84
34
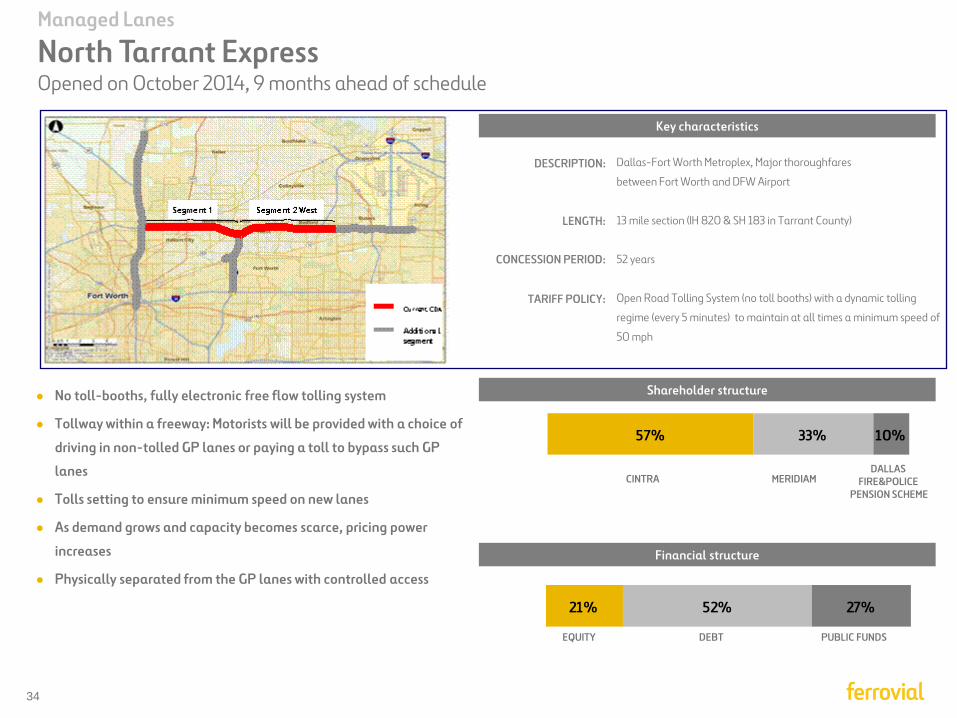
CINTRA MERIDIAM DALLAS
FIRE&POLICE PENSION SCHEME
DESCRIPTION:
LENGTH:
CONCESSION PERIOD:
TARIFF POLICY:
Dallas-Fort Worth Metroplex, Major thoroughfares
between Fort Worth and DFW Airport
13 mile section (IH 820 & SH 183 in Tarrant County)
52 years
Open Road Tolling System (no toll booths) with a dynamic tolling
regime (every 5 minutes) to maintain at all times a minimum speed of
50 mph
● No toll-booths, fully electronic free flow tolling system
● Tollway within a freeway: Motorists will be provided with a choice of
driving in non-tolled GP lanes or paying a toll to bypass such GP
lanes
● Tolls setting to ensure minimum speed on new lanes
● As demand grows and capacity becomes scarce, pricing power
increases
● Physically separated from the GP lanes with controlled access
EQUITY DEBT PUBLIC FUNDS
Managed Lanes
North Tarrant Express Opened on October 2014, 9 months ahead of schedule
Key characteristics
Shareholder structure
Financial structure
57% 33% 10%
21% 52% 27%
35
CINTRA MERIDIAM DALLAS FIRE&POLICE
PENSION SCHEME
Key characteristics
108Km Electronic toll
DESCRIPTION:
LENGTH:
CONCESSION PERIOD:
TARIFF POLICY:
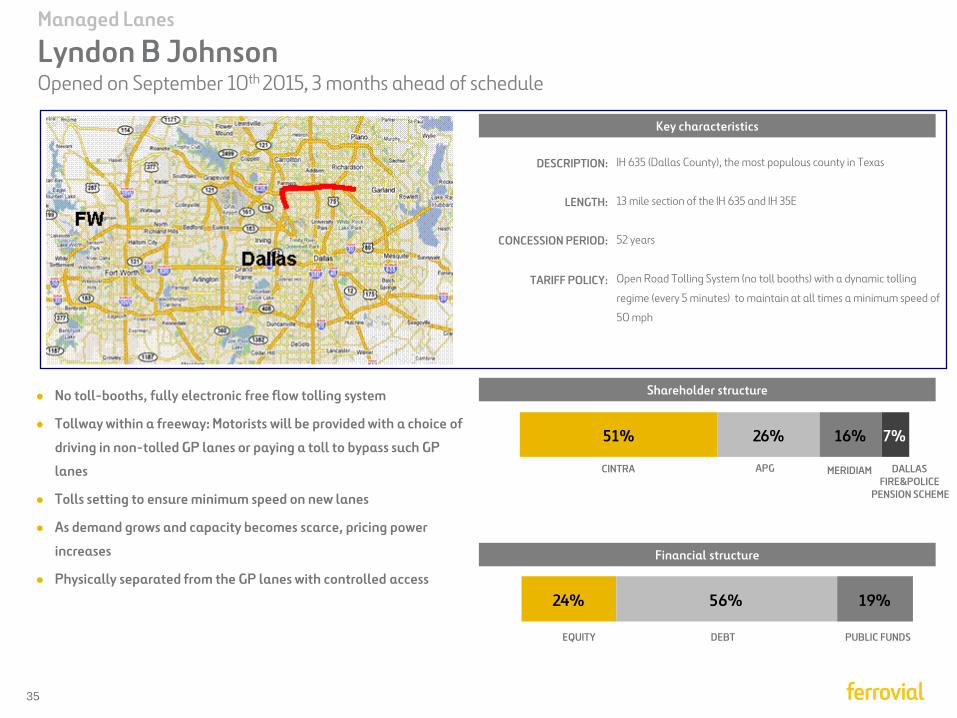
IH 635 (Dallas County), the most populous county in Texas
13 mile section of the IH 635 and IH 35E
52 years
Open Road Tolling System (no toll booths) with a dynamic tolling
regime (every 5 minutes) to maintain at all times a minimum speed of
50 mph
● No toll-booths, fully electronic free flow tolling system
● Tollway within a freeway: Motorists will be provided with a choice of
driving in non-tolled GP lanes or paying a toll to bypass such GP
lanes
● Tolls setting to ensure minimum speed on new lanes
● As demand grows and capacity becomes scarce, pricing power
increases
● Physically separated from the GP lanes with controlled access
EQUITY DEBT PUBLIC FUNDS
Managed Lanes
Lyndon B Johnson Opened on September 10th 2015, 3 months ahead of schedule
Shareholder structure
Financial structure
APG
51% 26% 16% 7%
24% 56% 19%
36
CINTRA MERIDIAM DALLAS FIRE&POLICE PENSION SCHEME
DESCRIPTION:
LENGTH:
CONCESSION PERIOD:
TARIFF POLICY:
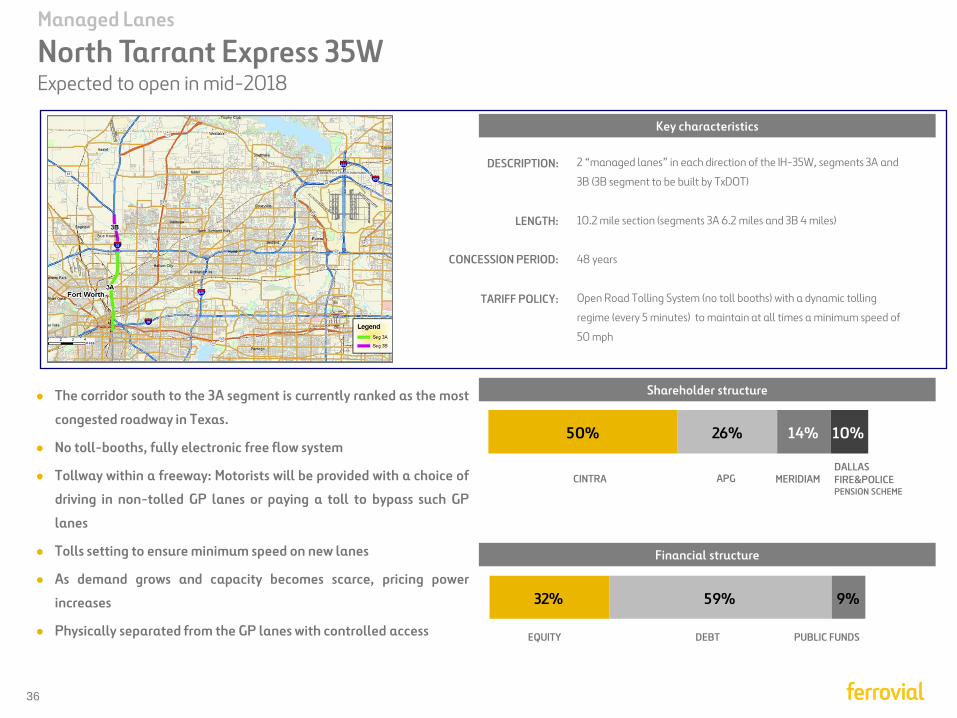
2 “managed lanes” in each direction of the IH-35W, segments 3A and
3B (3B segment to be built by TxDOT)
10.2 mile section (segments 3A 6.2 miles and 3B 4 miles)
48 years
Open Road Tolling System (no toll booths) with a dynamic tolling
regime (every 5 minutes) to maintain at all times a minimum speed of
50 mph
● The corridor south to the 3A segment is currently ranked as the most
congested roadway in Texas.
● No toll-booths, fully electronic free flow system
● Tollway within a freeway: Motorists will be provided with a choice of
driving in non-tolled GP lanes or paying a toll to bypass such GP
lanes
● Tolls setting to ensure minimum speed on new lanes
● As demand grows and capacity becomes scarce, pricing power
increases
● Physically separated from the GP lanes with controlled access EQUITY DEBT PUBLIC FUNDS
APG
Managed Lanes
North Tarrant Express 35W Expected to open in mid-2018
Key characteristics
Shareholder structure
Financial structure
50% 26% 14% 10%
32% 59% 9%
37
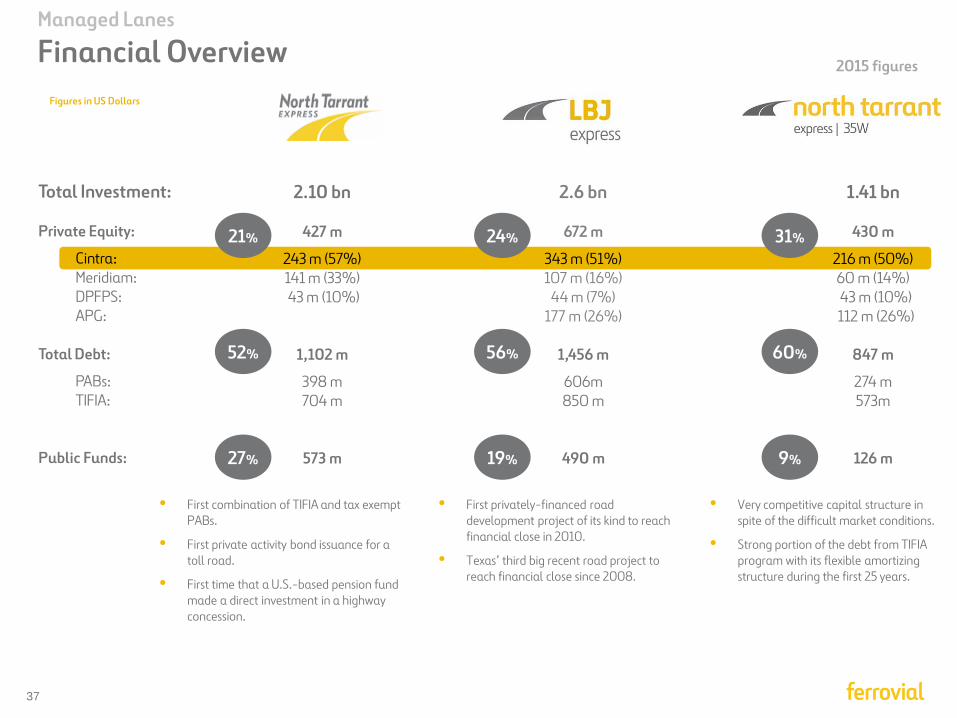
• First privately-financed road development project of its kind to reach financial close in 2010.
• Texas’ third big recent road project to reach financial close since 2008.
• First combination of TIFIA and tax exempt PABs.
• First private activity bond issuance for a toll road.
• First time that a U.S.-based pension fund made a direct investment in a highway concession.
21%
52%
27%
24%
56%
19%
Figures in US Dollars
Managed Lanes
Financial Overview
31%
60%
9%
• Very competitive capital structure in spite of the difficult market conditions.
• Strong portion of the debt from TIFIA program with its flexible amortizing structure during the first 25 years.
2.10 bn
427 m
243 m (57%) 141 m (33%) 43 m (10%)
1,102 m
398 m 704 m
573 m
2.6 bn
672 m
343 m (51%) 107 m (16%)
44 m (7%) 177 m (26%)
1,456 m
606m 850 m
490 m
1.41 bn
430 m
216 m (50%) 60 m (14%) 43 m (10%) 112 m (26%)
847 m
274 m 573m
126 m
Total Investment: Private Equity:
Cintra: Meridiam: DPFPS: APG:
Total Debt:
PABs: TIFIA:
Public Funds:
2015 figures
38
Appendix
Introduction to 407ETR Toll road
Managed Lanes Toll roads
407ETR vs Managed Lanes
Diversified porftolio
Historic consolidated & business units figures
39
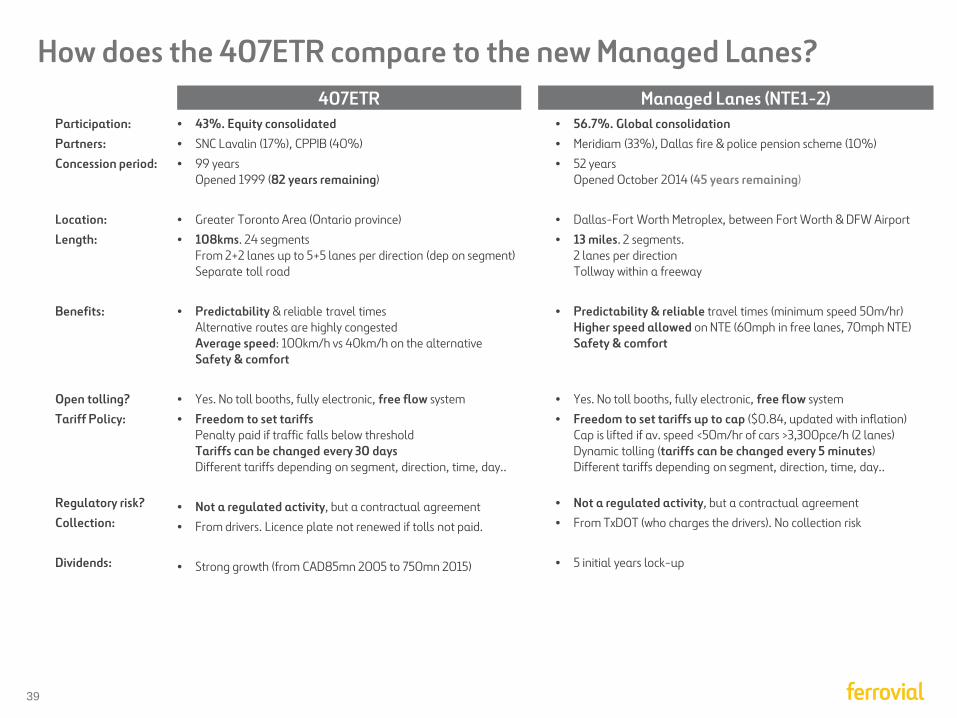
How does the 407ETR compare to the new Managed Lanes? 407ETR Managed Lanes (NTE1-2)
• 56.7%. Global consolidation • Meridiam (33%), Dallas fire & police pension scheme (10%) • 52 years
Opened October 2014 (45 years remaining)
• Dallas-Fort Worth Metroplex, between Fort Worth & DFW Airport • 13 miles. 2 segments.
2 lanes per direction Tollway within a freeway
• Predictability & reliable travel times (minimum speed 50m/hr) Higher speed allowed on NTE (60mph in free lanes, 70mph NTE) Safety & comfort
• Yes. No toll booths, fully electronic, free flow system • Freedom to set tariffs up to cap ($0.84, updated with inflation)
Cap is lifted if av. speed <50m/hr of cars >3,300pce/h (2 lanes) Dynamic tolling (tariffs can be changed every 5 minutes) Different tariffs depending on segment, direction, time, day..
• Not a regulated activity, but a contractual agreement • From TxDOT (who charges the drivers). No collection risk
• 5 initial years lock-up
• 43%. Equity consolidated • SNC Lavalin (17%), CPPIB (40%) • 99 years
Opened 1999 (82 years remaining)
• Greater Toronto Area (Ontario province) • 108kms. 24 segments
From 2+2 lanes up to 5+5 lanes per direction (dep on segment) Separate toll road
• Predictability & reliable travel times Alternative routes are highly congested Average speed: 100km/h vs 40km/h on the alternative Safety & comfort
• Yes. No toll booths, fully electronic, free flow system • Freedom to set tariffs
Penalty paid if traffic falls below threshold Tariffs can be changed every 30 days Different tariffs depending on segment, direction, time, day..
• Not a regulated activity, but a contractual agreement • From drivers. Licence plate not renewed if tolls not paid.
• Strong growth (from CAD85mn 2005 to 750mn 2015)
Participation: Partners: Concession period: Location: Length: Benefits: Open tolling? Tariff Policy: Regulatory risk? Collection: Dividends:
40
Appendix
Introduction to 407ETR Toll road
Managed Lanes Toll roads
407ETR vs Managed Lanes
Diversified porftolio
Historic consolidated & business units figures
41
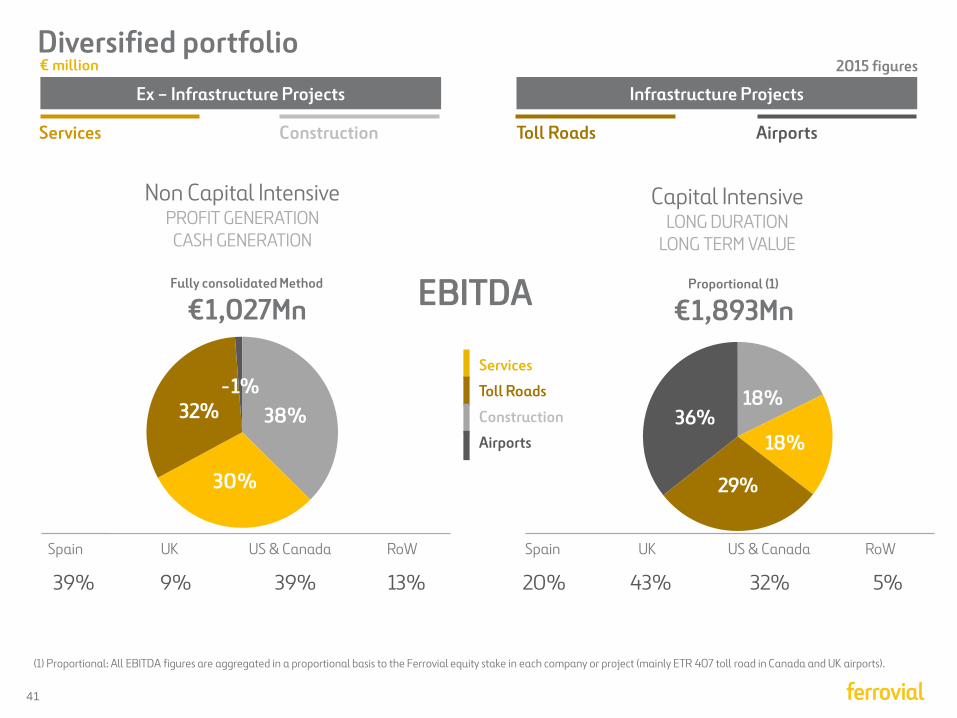
18%
18%
29%
36%
(1) Proportional: All EBITDA figures are aggregated in a proportional basis to the Ferrovial equity stake in each company or project (mainly ETR 407 toll road in Canada and UK airports).
Diversified portfolio
Services Construction Toll Roads Airports
Non Capital Intensive PROFIT GENERATION CASH GENERATION
Fully consolidated Method
€1,027Mn Proportional (1)
€1,893Mn
Capital Intensive LONG DURATION
LONG TERM VALUE
EBITDA
Services
Toll Roads
Construction
Airports
Spain UK US & Canada RoW Spain UK US & Canada RoW
€ million 2015 figures
Ex – Infrastructure Projects Infrastructure Projects
38%
30%
32%-1%
39% 9% 39% 13% 20% 43% 32% 5%
42
Appendix
Introduction to 407ETR Toll road
Managed Lanes Toll roads
407ETR vs Managed Lanes
Diversified porftolio
Historic consolidated & business units figures
43
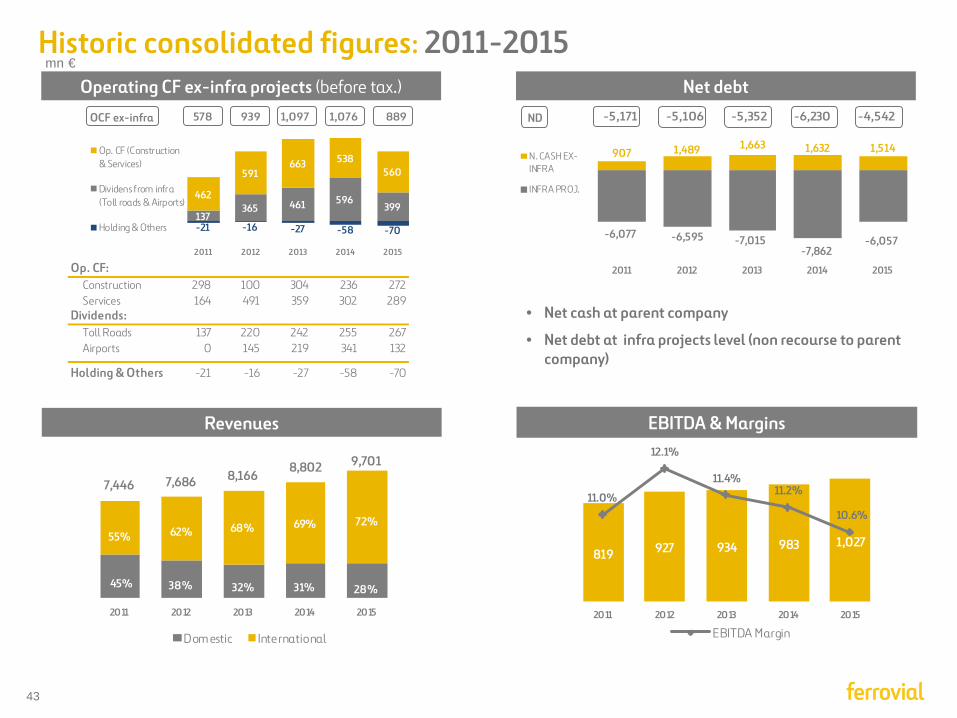
Historic consolidated figures: 2011-2015 Operating CF ex-infra projects (before tax.)
EBITDA & Margins
mn €
• Net cash at parent company
• Net debt at infra projects level (non recourse to parent company)
Revenues
Net debt OCF ex-infra ND
-6,077 -6,595 -7,015-7,862
-6,057
907 1,489 1,663 1,632 1,514
2011 2012 2013 2014 2015
N. CASH EX-INFRA
INFRA PROJ.
-5,171 -5,106 -5,352 -6,230 -4,542
7,446 7,686 8,1668,802 9,701
45% 38% 32% 31% 28%
55% 62% 68% 69% 72%
2011 2012 2013 2014 2015
Dom estic International
819 927 934 983 1,027
11.0%
12.1%
11.4%11.2%
10.6%
9 .0 %
9 .5 %
1 0. 0%
1 0. 5%
1 1. 0%
1 1. 5%
1 2. 0%
0
2 00
4 00
6 00
8 00
1 ,0 00
1 ,2 00
2011 2012 2013 2014 2015
EBITDA Margin
-21 -16 -27 -58 -70137
365 461 596399
462
591663 538
560
2011 2012 2013 2014 2015
Op. CF (Construction& Services)
Dividens from infra(Toll roads & Airports)
Holding & Others
Op. CF:Construction 298 100 304 236 272Services 164 491 359 302 289
Dividends:Toll Roads 137 220 242 255 267Airports 0 145 219 341 132
Holding & Others -21 -16 -27 -58 -70
578 939 1,097 1,076 889
44
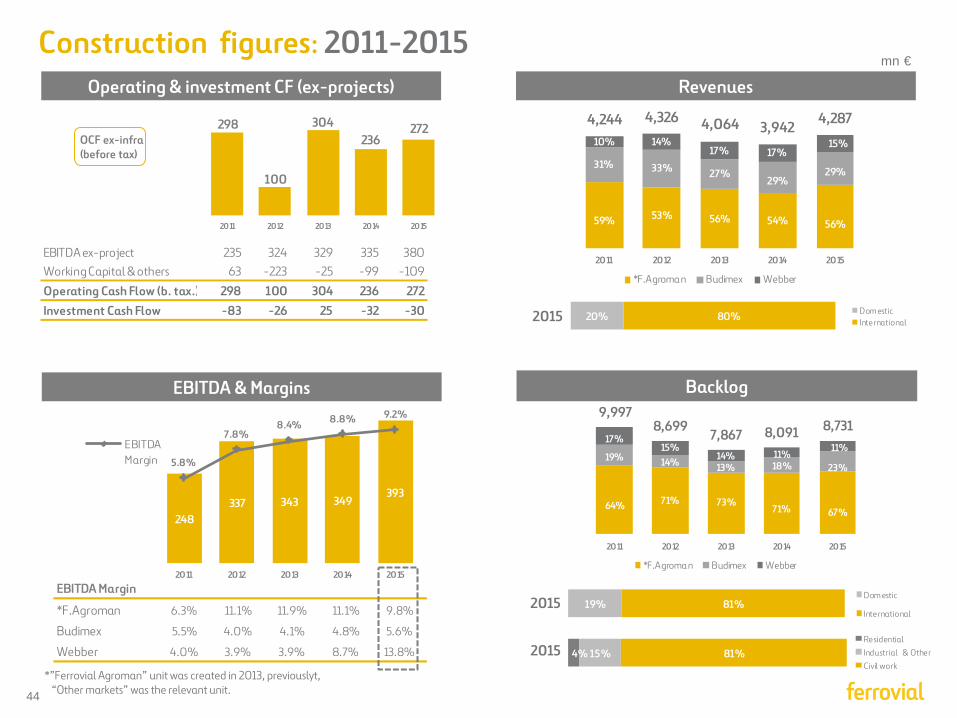
Construction figures: 2011-2015 mn €
2015
2015
Operating & investment CF (ex-projects)
Backlog
Revenues
EBITDA & Margins
298
100
304236
272
2011 2012 2013 2014 2015
4,244 4,326 4,064 3,942 4,287
59% 53% 56% 54% 56%
31% 33% 27%29%
29%
10% 14%17% 17%
15%
2011 2012 2013 2014 2015
*F.Agroma n Budimex Webber
248337 343 349
393
5.8%
7.8%8.4% 8.8% 9.2%
0 .0 %
1 .0 %
2 .0 %
3 .0 %
4 .0 %
5 .0 %
6 .0 %
7 .0 %
8 .0 %
9 .0 %
1 0. 0%
0
5 0
1 00
1 50
2 00
2 50
3 00
3 50
4 00
2011 2012 2013 2014 2015
EBITDAMargin
19% 81%Dom estic
International
OCF ex-infra (before tax)
EBITDA Margin
*F.Agroman 6.3% 11.1% 11.9% 11.1% 9.8%
Budimex 5.5% 4.0% 4.1% 4.8% 5.6%
Webber 4.0% 3.9% 3.9% 8.7% 13.8% 2015
9,9978,699
7,867 8,091 8,731
64% 71% 73%71% 67%
19% 14% 13% 18% 23%
17%15%
14% 11%11%
2011 2012 2013 2014 2015
*F.Agroma n Budimex Webber
*”Ferrovial Agroman” unit was created in 2013, previouslyt, “Other markets” was the relevant unit.
EBITDA ex-project 235 324 329 335 380Working Capital & others 63 -223 -25 -99 -109
Operating Cash Flow (b. tax.) 298 100 304 236 272Investment Cash Flow -83 -26 25 -32 -30
4% 15% 81%ResidentialIndustrial ^ & OtherCivil work
20% 80% Dom esticInternational
45
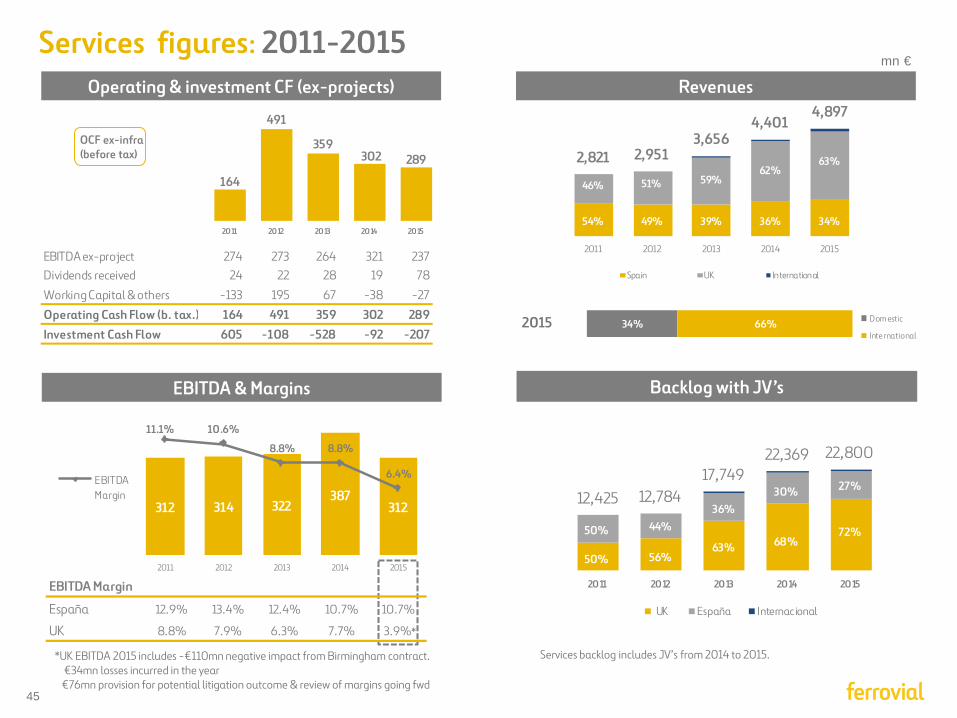
mn €
Operating & investment CF (ex-projects)
Backlog with JV’s
Revenues
EBITDA & Margins
2015
164
491
359302 289
2011 2012 2013 2014 2015
2,821 2,9513,656
4,4014,897
54% 49% 39% 36% 34%
46% 51% 59%62%
63%
2011 2012 2013 2014 2015
Spain UK International
312 314 322387
312
11.1% 10.6%
8.8% 8.8%
6.4%
0 .0 %
1 .0 %
2 .0 %
3 .0 %
4 .0 %
5 .0 %
6 .0 %
7 .0 %
8 .0 %
9 .0 %
1 0. 0%
1 1. 0%
1 2. 0%
0
5 0
1 00
1 50
2 00
2 50
3 00
3 50
4 00
2011 2012 2013 2014 2015
EBITDAMargin 12,425 12,784
17,74922,369 22,800
50% 56%63% 68%
72%50% 44%36%
30% 27%
2011 2012 2013 2014 2015
UK España Internac ional
Services backlog includes JV’s from 2014 to 2015.
EBITDA Margin
España 12.9% 13.4% 12.4% 10.7% 10.7%
UK 8.8% 7.9% 6.3% 7.7% 3.9%
34% 66% Dom estic
International
EBITDA ex-project 274 273 264 321 237Dividends received 24 22 28 19 78
Working Capital & others -133 195 67 -38 -27
Operating Cash Flow (b. tax.) 164 491 359 302 289Investment Cash Flow 605 -108 -528 -92 -207
OCF ex-infra (before tax)
Services figures: 2011-2015
*UK EBITDA 2015 includes -€110mn negative impact from Birmingham contract. €34mn losses incurred in the year €76mn provision for potential litigation outcome & review of margins going fwd
*
46
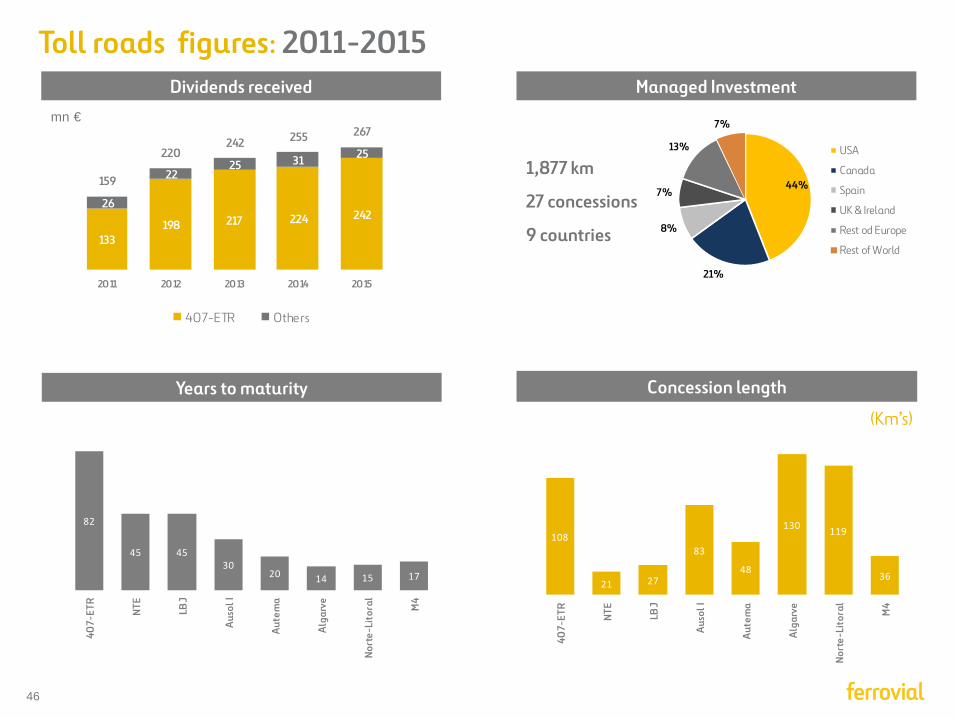
Toll roads figures: 2011-2015
mn €
1,877 km
27 concessions
9 countries
(Km’s)
Dividends received Managed Investment
Concession length Years to maturity
133198 217 224 242
26
2225 31 25
159
220242 255 267
2011 2012 2013 2014 2015
407-ETR Others
44%
21%
8%
7%
13%
7%
USA
Canada
Spain
UK & Ireland
Rest od Europe
Rest of World
82
45 4530
20 14 15 17
407-
ETR
NTE
LBJ
Auso
l I
Aute
ma
Alga
rve
Nort
e-Li
tora
l
M4
108
21 27
83
48
130 119
3640
7-ET
R
NTE
LBJ
Auso
l I
Aute
ma
Alga
rve
Nort
e-Li
tora
l
M4
47
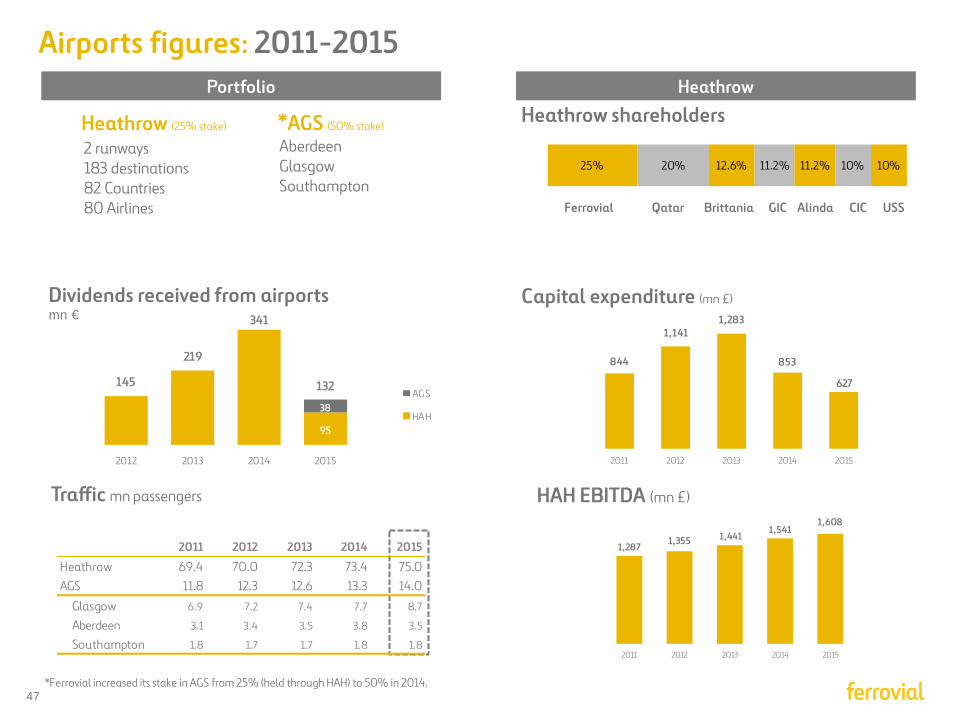
Airports figures: 2011-2015
mn € Dividends received from airports
Heathrow (25% stake)
2 runways 183 destinations 82 Countries 80 Airlines
*AGS (50% stake) Aberdeen Glasgow Southampton
Traffic mn passengers HAH EBITDA (mn £)
Heathrow shareholders Portfolio Heathrow
*Ferrovial increased its stake in AGS from 25% (held through HAH) to 50% in 2014.
Capital expenditure (mn £)
Ferrovial Qatar Brittania GIC CIC Alinda USS
95
38
145
219
341
132
2012 2013 2014 2015
AGS
HA H
844
1,1411,283
853
627
2011 2012 2013 2014 2015
1,2871,355 1,441
1,5411,608
2011 2012 2013 2014 2015
2011 2012 2013 2014 2015
Heathrow 69.4 70.0 72.3 73.4 75.0AGS 11.8 12.3 12.6 13.3 14.0
Glasgow 6.9 7.2 7.4 7.7 8.7
Aberdeen 3.1 3.4 3.5 3.8 3.5
Southampton 1.8 1.7 1.7 1.8 1.8
25% 20% 12.6% 11.2% 11.2% 10% 10%
48
Disclaimer
This document may contain statements that constitute forward looking statements about the Company. These statements are
based on financial projections and estimates and their underlying assumptions, statements regarding plans, objectives and
expectations, which refer to estimates regarding, among others, future growth in the different business lines and the global
business, market share, financial results and other aspects of the activity and situation relating to the Company.
Such forward looking statements, by its nature, are not guarantees of future performance and involve risks and uncertainties, and
other important factors that could cause actual developments or results to differ from those expressed in these forward looking
statements.
Analysts and investors, and any other person or entity that may need to take decisions, or prepare or release opinions about the
securities issued by the Company, are cautioned not to place undue reliance on those forward looking statements which speak only
as of the date of this communication. They are all encouraged to consult the Company’s communications and periodic filings made
with the relevant securities markets regulators and, in particular, with the Spanish Securities Markets Regulator.