Embed Size (px)
Citation preview
3Q08 ResultsNovember 11, 2008
Comments on the 3Q08Comments on the 3Q08
2
Rubens Menin – CEO
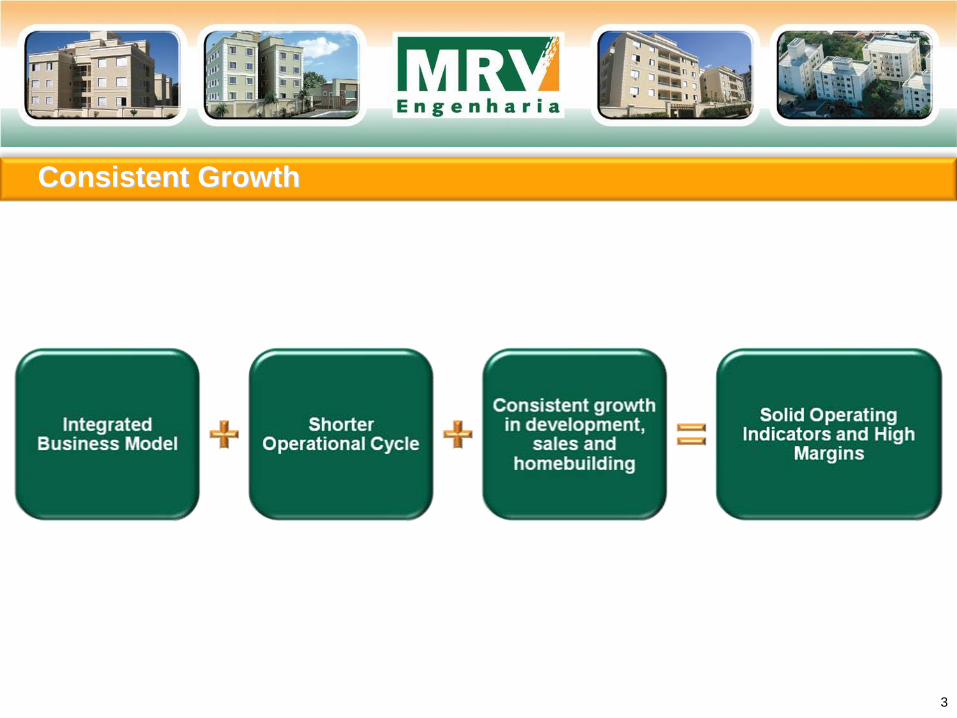
Consistent GrowthConsistent Growth
3
.

Comments on the 3Q08Comments on the 3Q08
4
Leonardo Corrêa – Executive Vice President & Chief Officer for Finances and Investor Relations
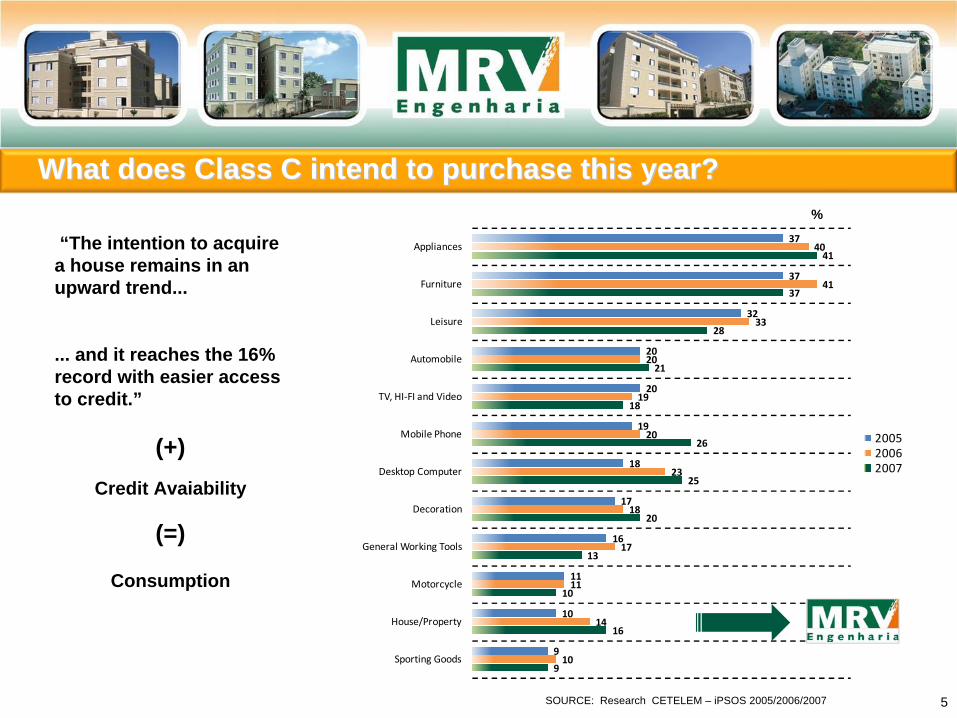
What does Class C intend to purchase this year?What does Class C intend to purchase this year?
“The intention to acquire a house remains in an upward trend...
... and it reaches the 16% record with easier access to credit.”
(+)Credit Avaiability
(=)
Consumption
SOURCE: Research CETELEM – iPSOS 2005/2006/2007
%
5
9
16
10
13
20
25
26
18
21
28
37
41
10
14
11
17
18
23
20
19
20
33
41
40
9
10
11
16
17
18
19
20
20
32
37
37
Sporting Goods
House/Property
Motorcycle
General Working Tools
Decoration
Desktop Computer
Mobile Phone
TV, HI‐FI and Video
Automobile
Leisure
Furniture
Appliances
200520062007
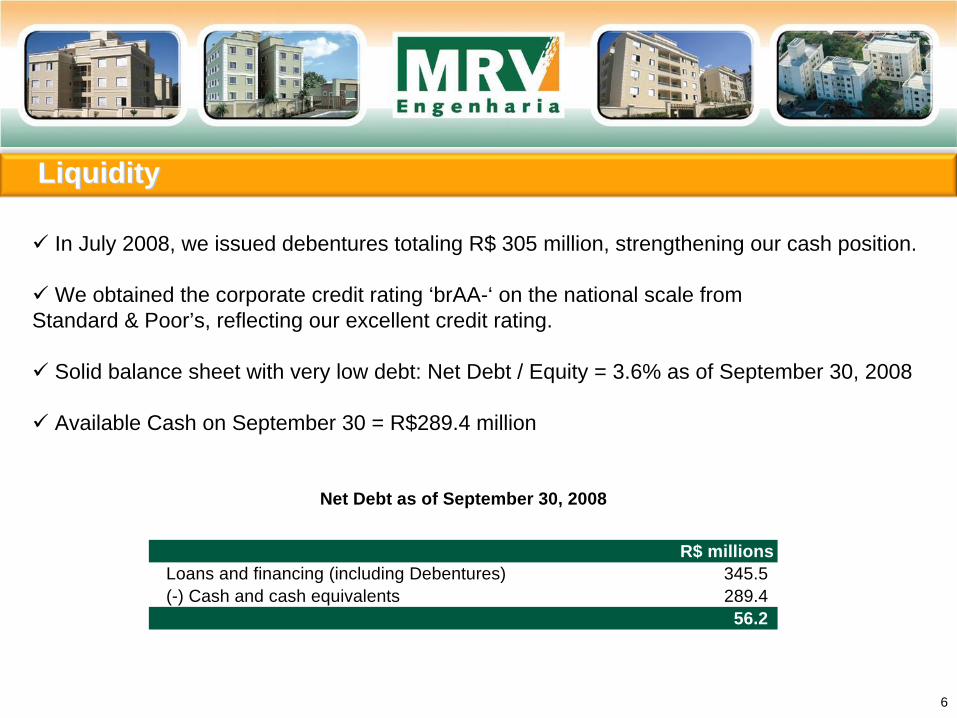
LiquidityLiquidity
6
In July 2008, we issued debentures totaling R$ 305 million, strengthening our cash position.
We obtained the corporate credit rating ‘brAA-‘ on the national scale from Standard & Poor’s, reflecting our excellent credit rating.
Solid balance sheet with very low debt: Net Debt / Equity = 3.6% as of September 30, 2008
Available Cash on September 30 = R$289.4 million
R$ millionsLoans and financing (including Debentures) 345.5 (-) Cash and cash equivalents 289.4
56.2
Net Debt as of September 30, 2008
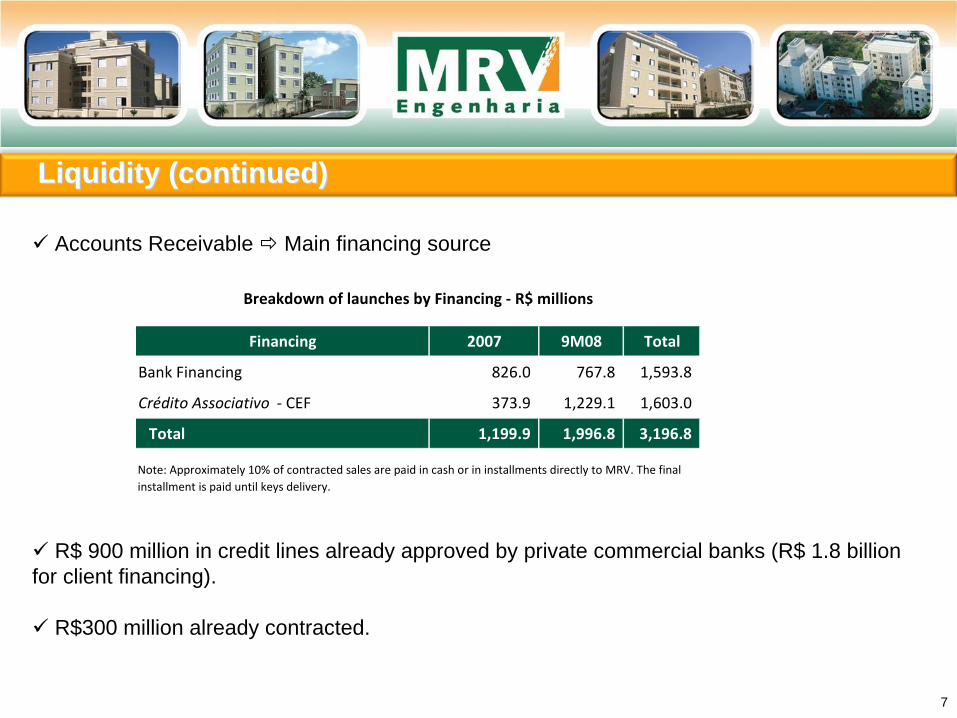
Liquidity (continued)Liquidity (continued)
7
Accounts Receivable Main financing source
R$ 900 million in credit lines already approved by private commercial banks (R$ 1.8 billion for client financing).
R$300 million already contracted.
Financing 2007 9M08 Total
Bank Financing 826.0 767.8 1,593.8
Crédito Associativo ‐ CEF 373.9 1,229.1 1,603.0
Total 1,199.9 1,996.8 3,196.8
Breakdown of launches by Financing ‐ R$ millions
Note: Approximately 10% of contracted sales are paid in cash or in installments directly to MRV. The final installment is paid until keys delivery.
Liquidity (continued)Liquidity (continued)
8
Crédito Associativo – CEF
• Credit lines and projects approved by the CEF for a sum higher than the amount required for 2008 and 2009.
• It´s not Company's debt.
• Funds released during construction.
• Plentiful resources available
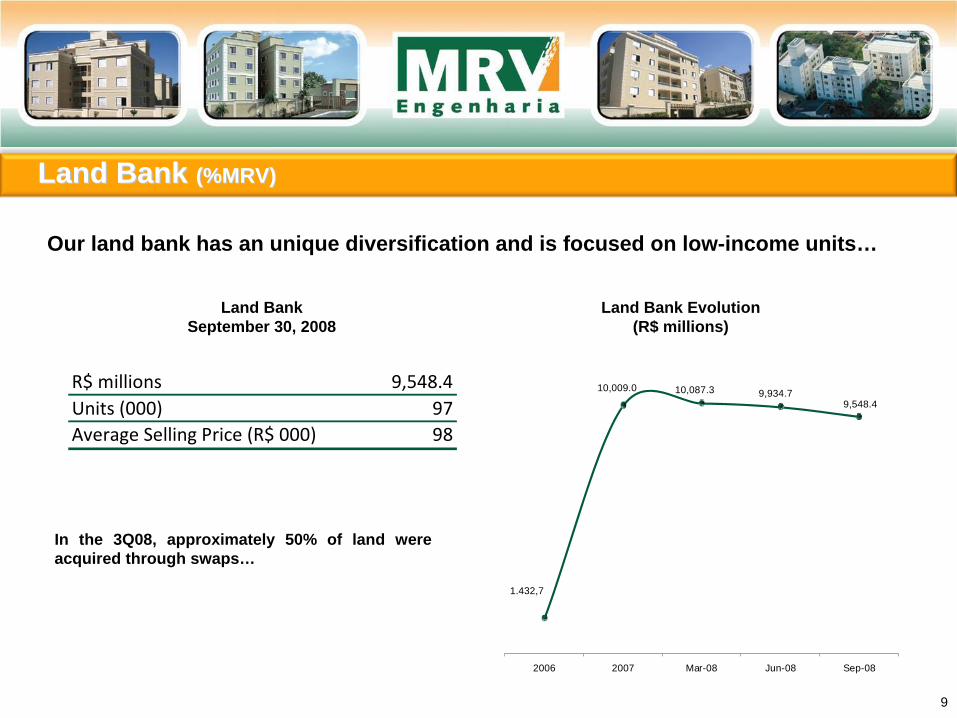
Land Bank Land Bank (%MRV)(%MRV)
9
Our land bank has an unique diversification and is focused on low-income units…
1.432,7
10,009.0 10,087.3 9,934.7 9,548.4
2006 2007 Mar-08 Jun-08 Sep-08
In the 3Q08, approximately 50% of land were acquired through swaps…
R$ millions 9,548.4Units (000) 97Average Selling Price (R$ 000) 98
Land Bank September 30, 2008
Land Bank Evolution (R$ millions)
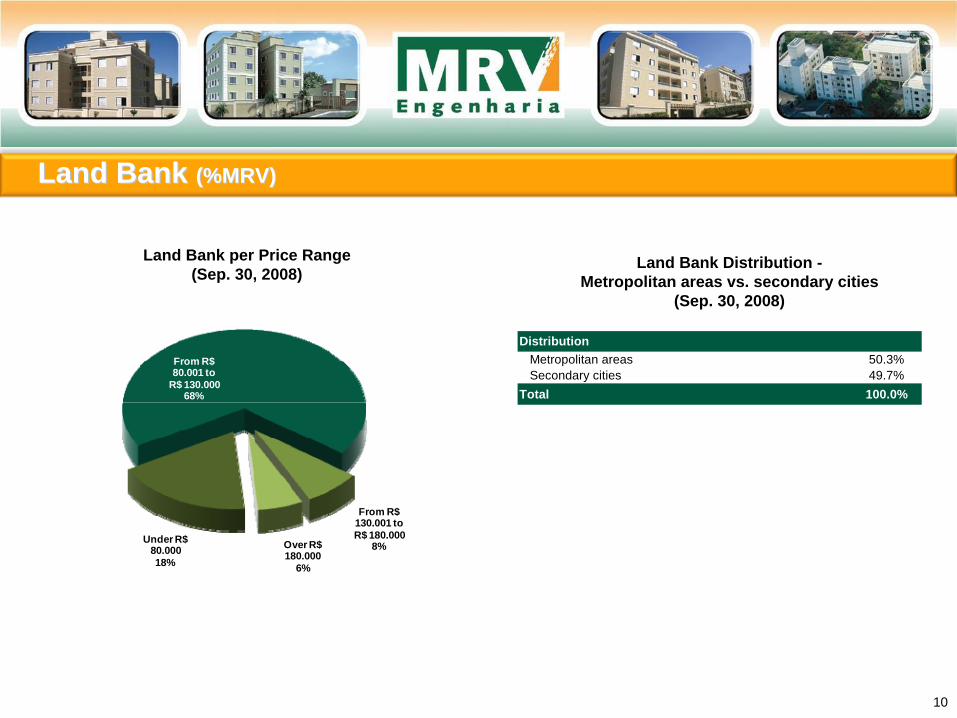
Land Bank Land Bank (%MRV)(%MRV)
10
DistributionMetropolitan areas 50.30% 50.3%Secondary cities 49.70% 49.7%
Total 1 100.0%
Land Bank per Price Range (Sep. 30, 2008)
Land Bank Distribution - Metropolitan areas vs. secondary cities
(Sep. 30, 2008)
Under R$ 80.00018%
From R$ 80.001 to
R$ 130.00068%
From R$ 130.001 to R$ 180.000
8%Over R$ 180.000
6%

Operating and Financial HighlightsOperating and Financial Highlights
11
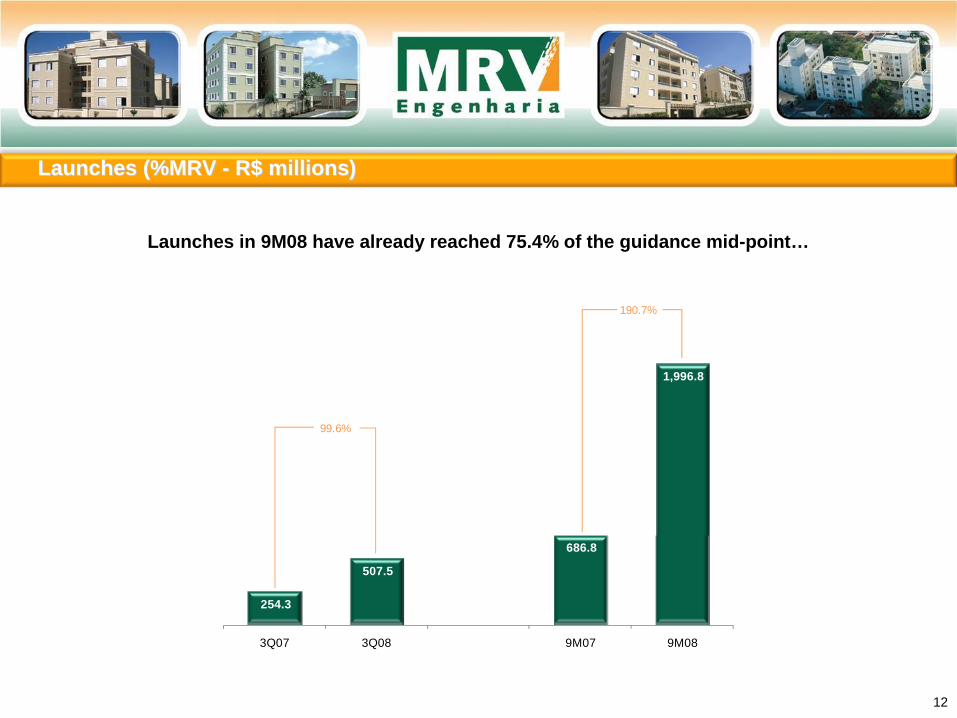
Launches (%MRV Launches (%MRV -- R$ millions)R$ millions)
12
Launches in 9M08 have already reached 75.4% of the guidance mid-point…
254.3
507.5
686.8
1,996.8
3Q07 3Q08 9M07 9M08
99.6%
190.7%
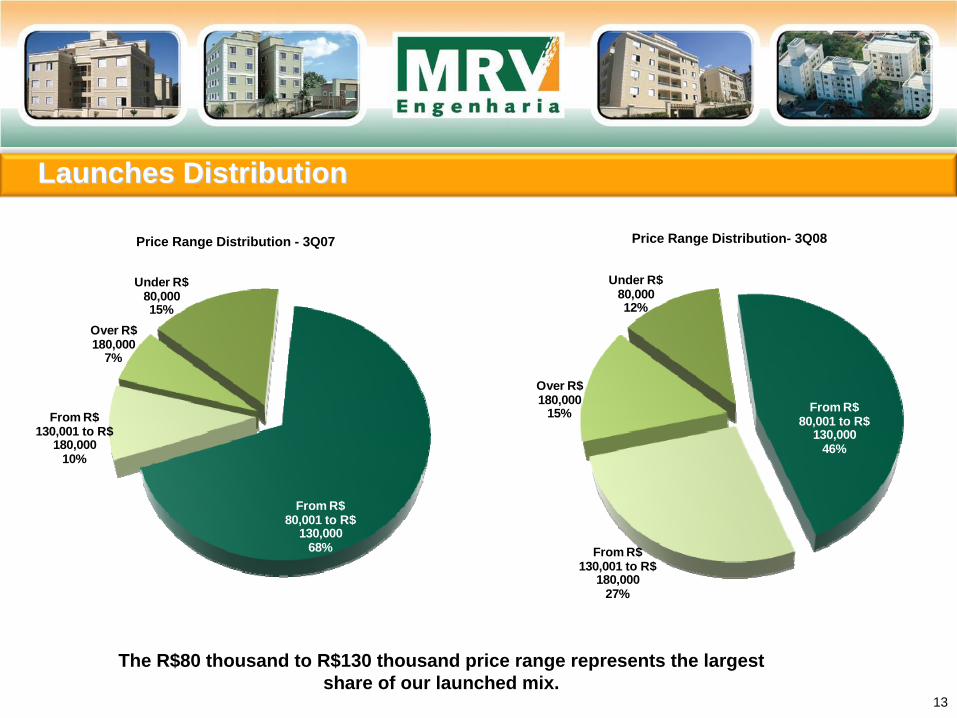
Launches DistributionLaunches Distribution
13
Price Range Distribution - 3Q07 Price Range Distribution- 3Q08
The R$80 thousand to R$130 thousand price range represents the largest share of our launched mix.
Under R$ 80,00015%
From R$ 80,001 to R$
130,00068%
From R$ 130,001 to R$
180,00010%
Over R$ 180,000
7%
Under R$ 80,00012%
From R$ 80,001 to R$
130,00046%
From R$ 130,001 to R$
180,00027%
Over R$ 180,000
15%
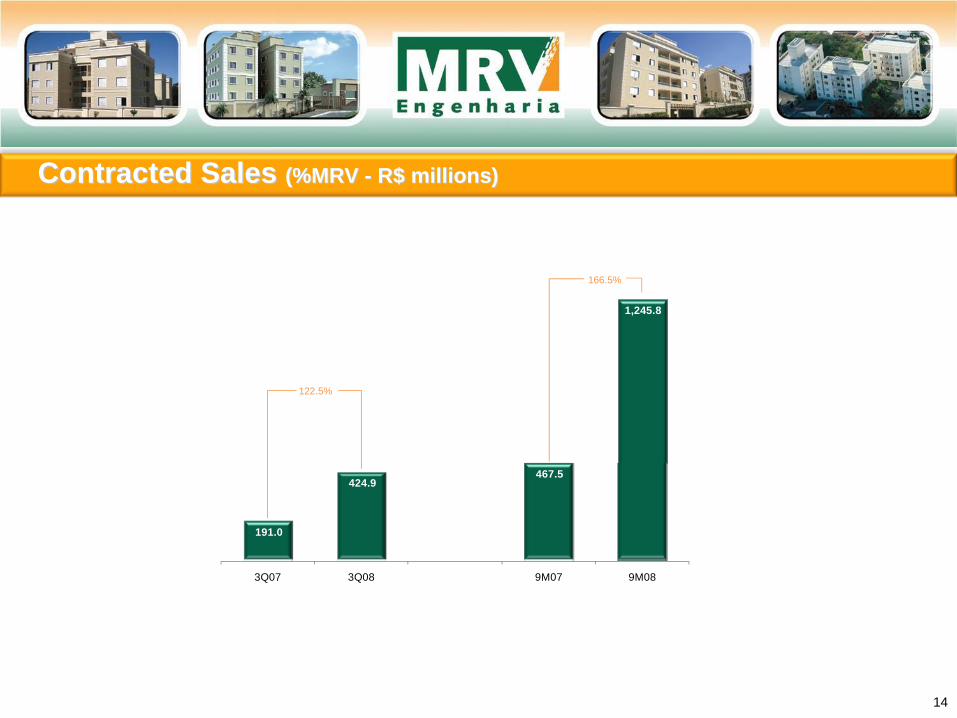
Contracted Sales Contracted Sales (%MRV (%MRV -- R$ millionsR$ millions) )
14
191.0
424.9 467.5
1,245.8
3Q07 3Q08 9M07 9M08
122.5%
166.5%
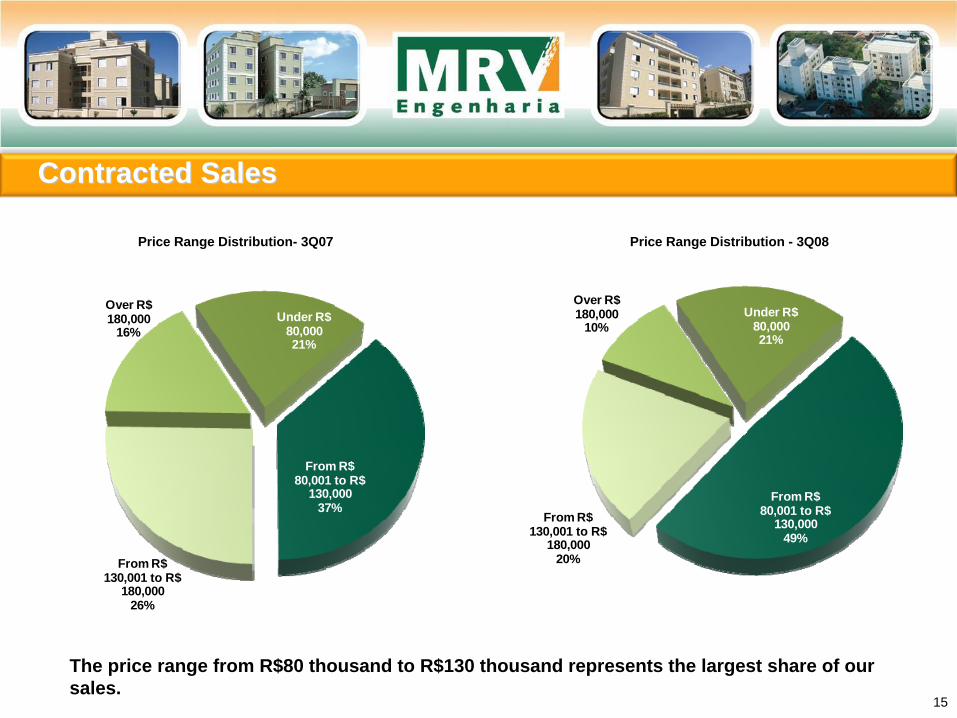
Contracted SalesContracted Sales
15
Price Range Distribution- 3Q07 Price Range Distribution - 3Q08
The price range from R$80 thousand to R$130 thousand represents the largest share of our sales.
Under R$ 80,00021%
From R$ 80,001 to R$
130,00049%
From R$ 130,001 to R$
180,00020%
Over R$ 180,000
10%Under R$
80,00021%
From R$ 80,001 to R$
130,00037%
From R$ 130,001 to R$
180,00026%
Over R$ 180,000
16%
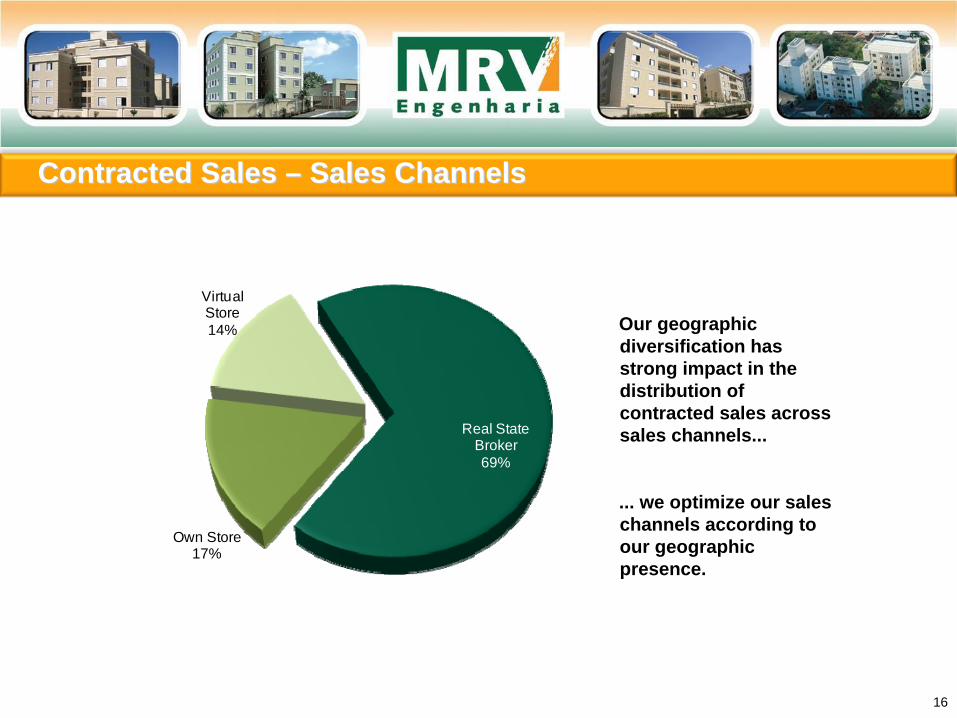
Contracted Sales Contracted Sales –– Sales ChannelsSales Channels
16
Our geographic diversification has strong impact in the distribution of contracted sales across sales channels...
... we optimize our sales channels according to our geographic presence.
Real State Broker69%
Own Store17%
Virtual Store14%
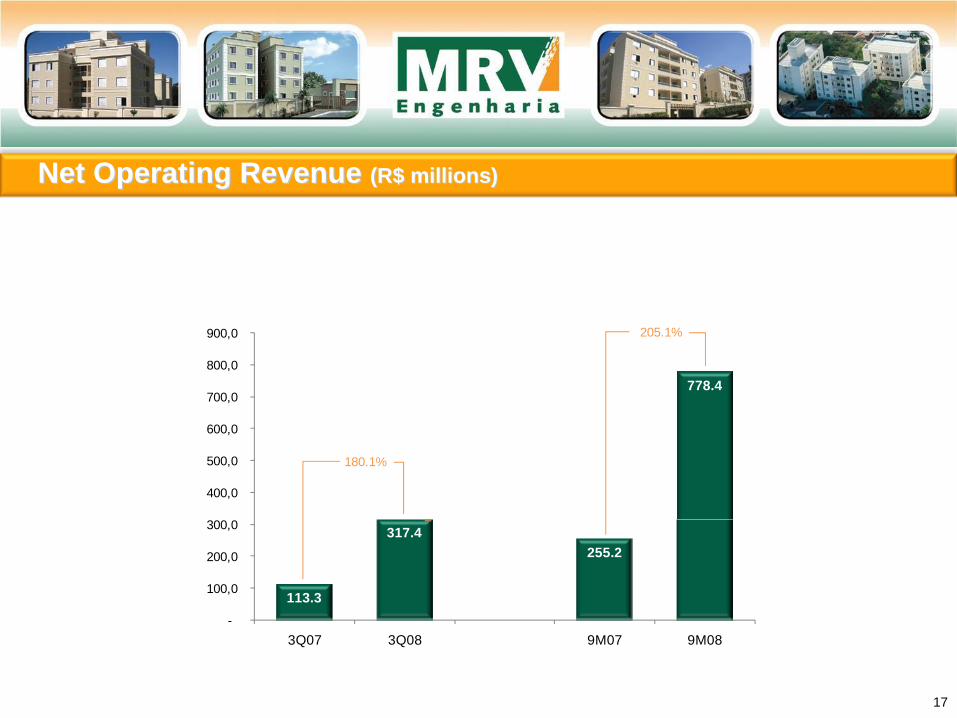
Net Operating Revenue Net Operating Revenue (R$ millions)(R$ millions)
17
113.3
317.4255.2
778.4
-
100,0
200,0
300,0
400,0
500,0
600,0
700,0
800,0
900,0
3Q07 3Q08 9M07 9M08
Net Operating Revenue (R$'MM)
180.1%
205.1%
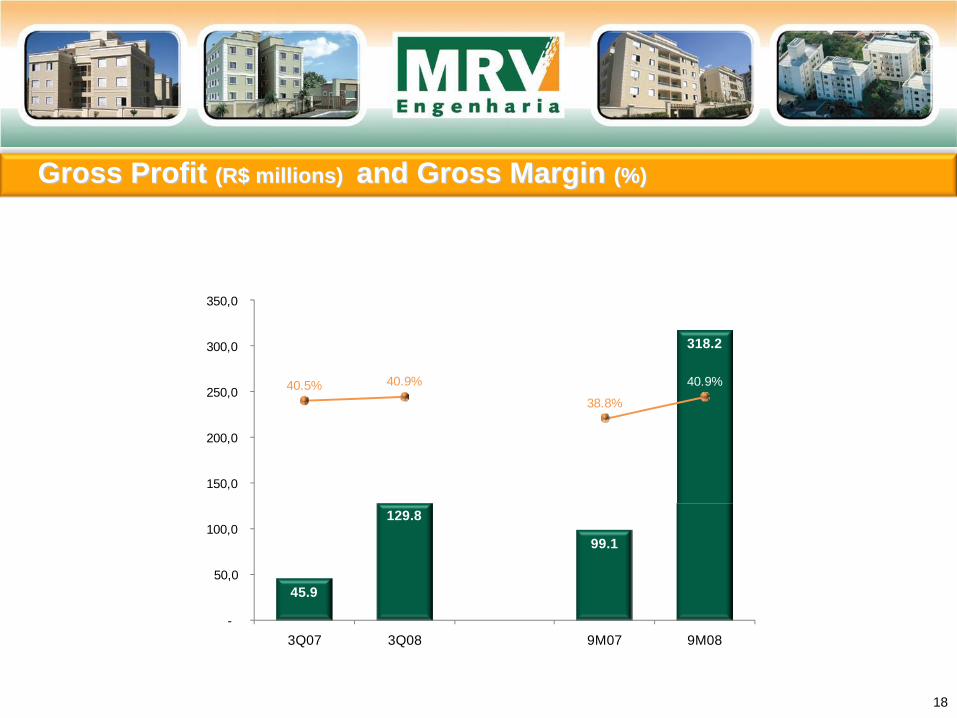
Gross Profit Gross Profit (R$ millions) (R$ millions) and Gross Margin and Gross Margin (%)(%)
18
45.9
129.8
99.1
318.2
40.5% 40.9%
38.8%
40.9%
-
50,0
100,0
150,0
200,0
250,0
300,0
350,0
3Q07 3Q08 9M07 9M08
Gross Revenue R$'MM and Gross Margin %
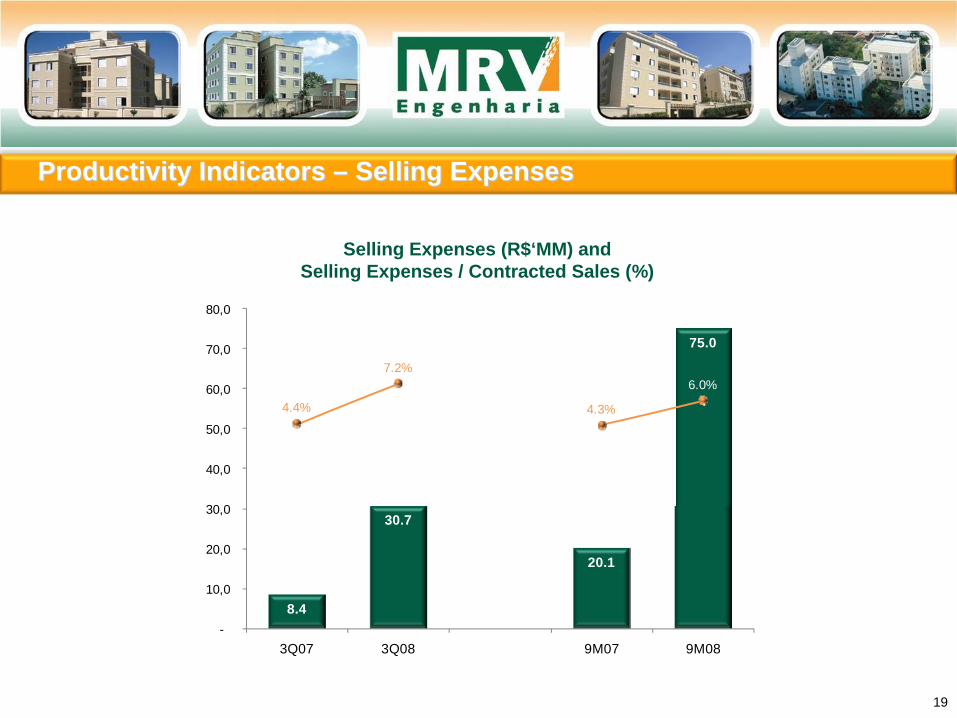
Selling Expenses (R$‘MM) and Selling Expenses / Contracted Sales (%)
Productivity Indicators Productivity Indicators –– Selling ExpensesSelling Expenses
19
8.4
30.7
20.1
75.0
4.4%
7.2%
4.3%
6.0%
-
10,0
20,0
30,0
40,0
50,0
60,0
70,0
80,0
3Q07 3Q08 9M07 9M08
G&A (R$’MM) and G&A / Sales (%)
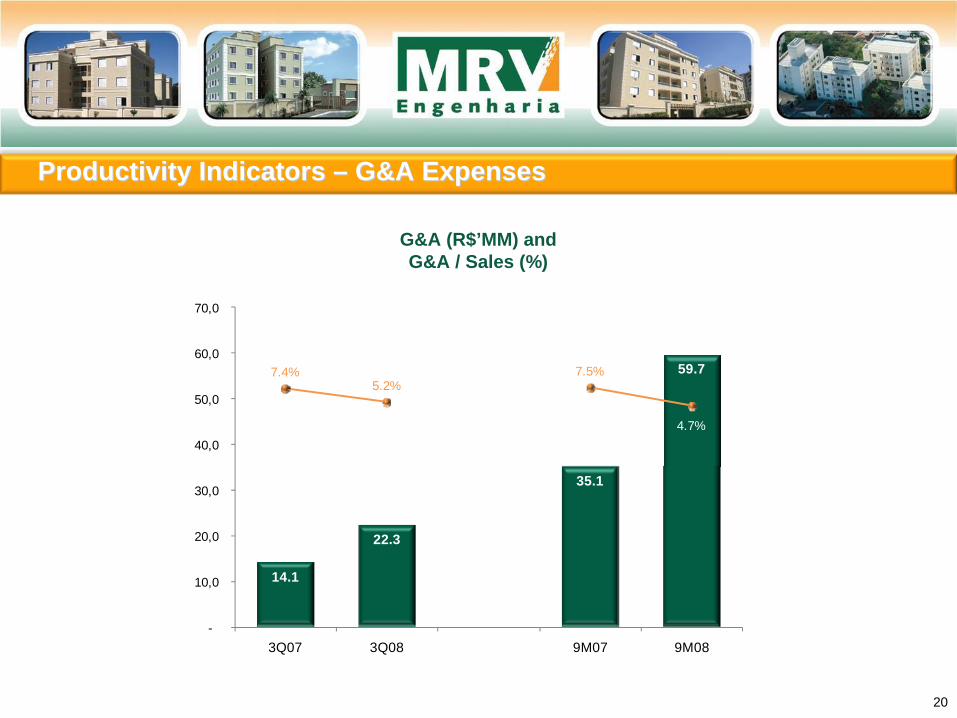
Productivity Indicators Productivity Indicators –– G&A ExpensesG&A Expenses
20
14.1
22.3
35.1
59.77.4%5.2%
7.5%
4.7%
-
10,0
20,0
30,0
40,0
50,0
60,0
70,0
3Q07 3Q08 9M07 9M08
Despesas Gerais e Administrativas R$'MM e DespesasGerais e Administrativas sobre Vendas Contratadas %
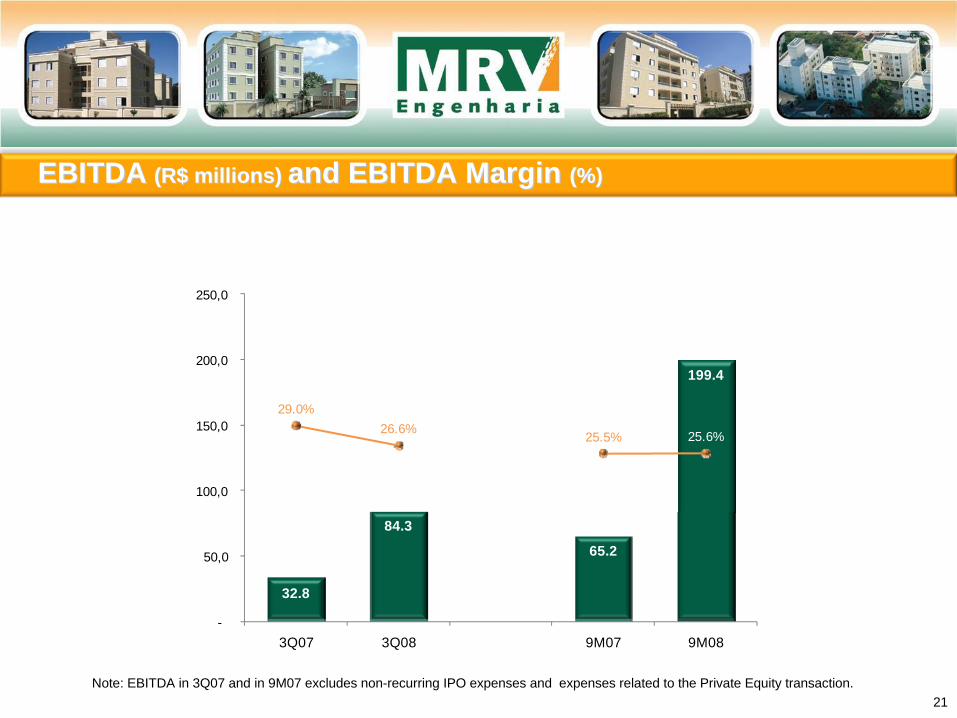
EBITDAEBITDA (R$ millions) (R$ millions) and EBITDA Margin and EBITDA Margin (%)(%)
21Note: EBITDA in 3Q07 and in 9M07 excludes non-recurring IPO expenses and expenses related to the Private Equity transaction.
32.8
84.3
65.2
199.4
29.0%26.6% 25.5% 25.6%
-
50,0
100,0
150,0
200,0
250,0
3Q07 3Q08 9M07 9M08
EBITDA Ajustado R$'MM e EBITDA Ajustado%
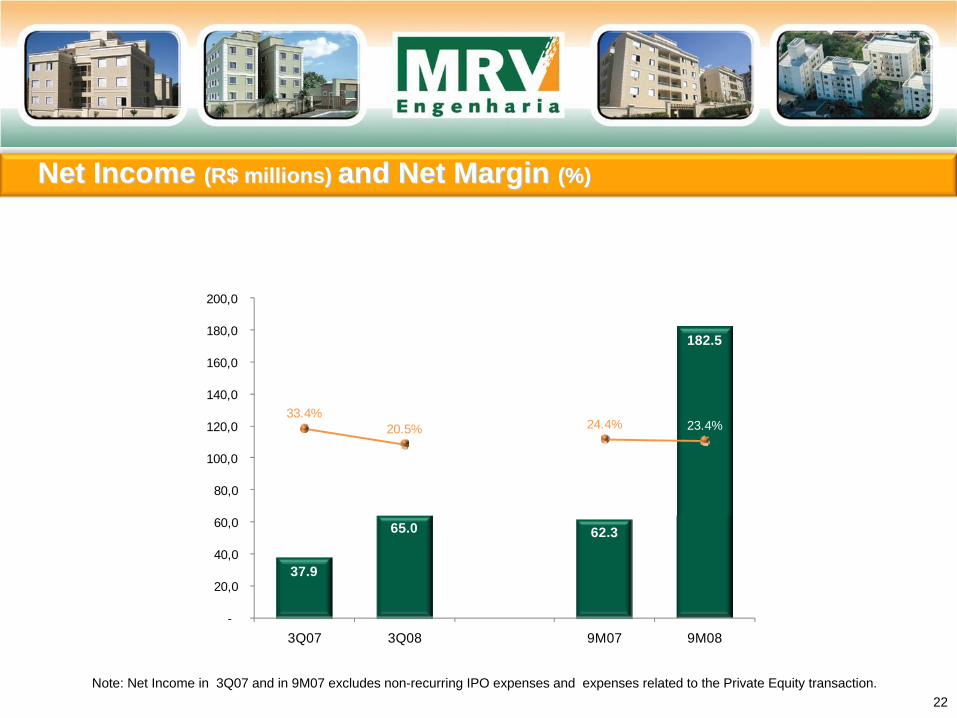
Net Income Net Income (R$ millions)(R$ millions) and Net Margin and Net Margin (%)(%)
22Note: Net Income in 3Q07 and in 9M07 excludes non-recurring IPO expenses and expenses related to the Private Equity transaction.
37.9
65.0 62.3
182.5
33.4%20.5% 24.4% 23.4%
-
20,0
40,0
60,0
80,0
100,0
120,0
140,0
160,0
180,0
200,0
3Q07 3Q08 9M07 9M08
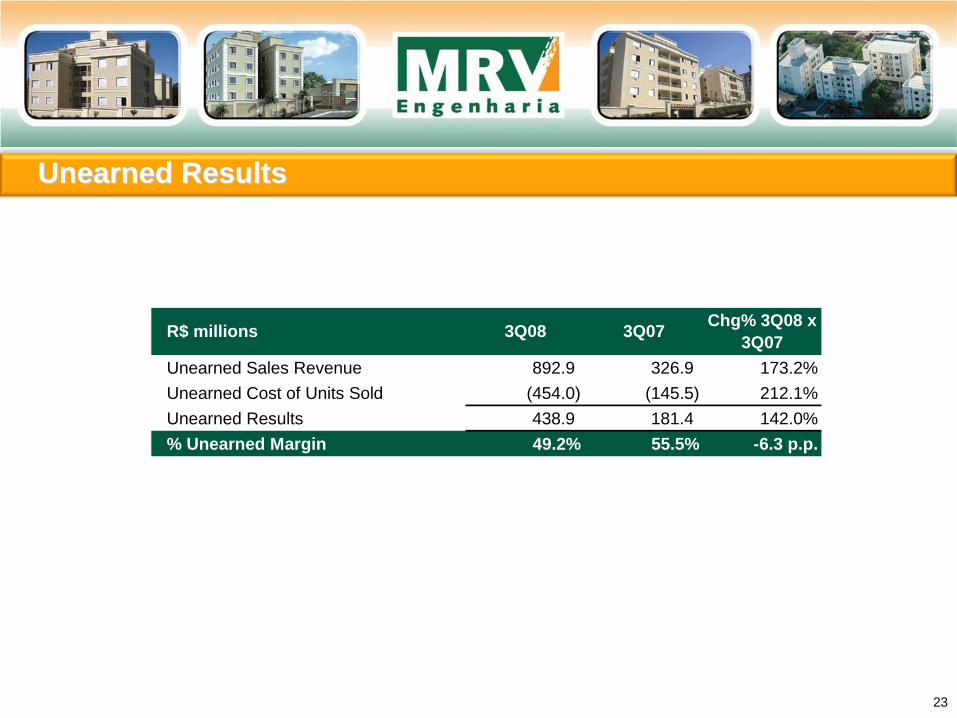
Unearned ResultsUnearned Results
23
R$ millions 3Q08 3Q07 Chg% 3Q08 x 3Q07
Unearned Sales Revenue 892.9 326.9 173.2%Unearned Cost of Units Sold (454.0) (145.5) 212.1%Unearned Results 438.9 181.4 142.0%% Unearned Margin 49.2% 55.5% -6.3 p.p.
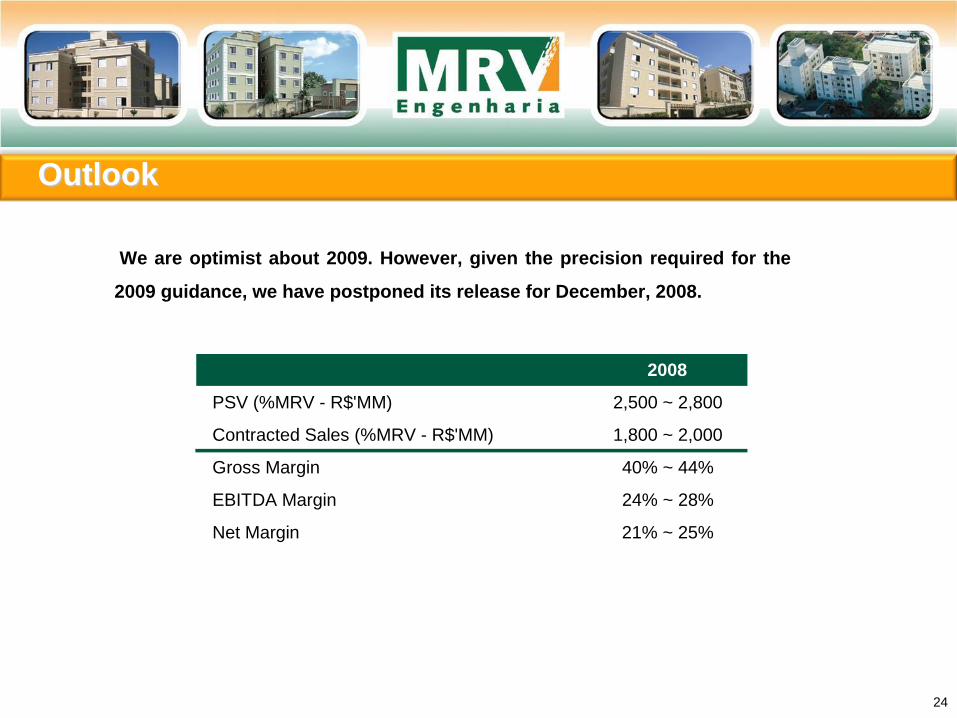
We are optimist about 2009. However, given the precision required for the
2009 guidance, we have postponed its release for December, 2008.
OutlookOutlook
24
2008
PSV (%MRV - R$'MM) 2,500 ~ 2,800
Contracted Sales (%MRV - R$'MM) 1,800 ~ 2,000
Gross Margin 40% ~ 44%
EBITDA Margin 24% ~ 28%
Net Margin 21% ~ 25%
This release contains forward-looking statements that are not merely historical facts but reflect the goals and expectations of MRV Engenharia’s management. Words such as “anticipates”, “believes”, “may”, “will”, “expects”, “intends”, “plans”, “estimates” or similar expressions are forward-looking statements. Though we believe that these forward-looking statements are based on reasonable assumptions, they are subject to risks and uncertainties, and are based on information currently available with MRV Engenharia. This presentation is current as of end 3Q08 and MRV Engenharia takes no responsibility to update it with new information and/or forward-looking statements. MRV Engenharia is not responsible for investments or investment decisions based on information contained in this presentation.
EBITDA, in accordance with CVM Circular Letter 1/2005, may be defined as income before net financial revenue (expense), income tax and social contribution, depreciation and amortization and non-operating results. EBITDA is used as a way of measuring the performance by the Company’s management, and is not a measure adopted by the Brazilian or U.S. Accounting Practices, does not represent the cash flow for the periods presented and should not be considered as a substitute for net income, MRV’s operating performance indicator or cash flow substitute, or liquidity indicator.
MRV’s management believes that EBITDA is a practical measure to assess its operating performance and allow for a comparison with other peer companies. However, it is important to highlight that EBITDA is not a measure established according to the Brazilian Accounting Practices (Corporation Law or BR GAAP) or U.S. Accounting Principles (US GAAP) and may be defined and calculated otherwise by other companies.
DisclaimerDisclaimer
25

ContactsContacts
26
Leonardo Corrêa
Executive Vice President & Chief Officer for Finances and Investor Relations
Mônica SimãoFinancial Director
Telephone: (31) 3348-7171
E-mail: [email protected]
www.mrv.com.br/ri