Embed Size (px)
Citation preview

Earnings Release 1Q10May 07, 2010
2
Earnings Release 1Q10
Rubens Menin
Opening Comments

3
Earnings Release 1Q10
Growth with differentiated margins;
Largest operation in the housing program “Minha Casa, Minha Vida”, with 18% of the contracts under review of CEF;
Decreasing Cash Burn;
Business support – ready to keep growing
Highlights

Net Revenue (R$ million) Gross Profit (R$ million) and Gross Margin (%)
Net Income(R$ million) and Net Margin (%)
EBITDA (R$ million) andMargin EBITDA (%)
Consistency of Financial Results
272.5
568.5
-
100,0
200,0
300,0
400,0
500,0
600,0
1Q09 1Q10
108.7%
60.5
149.6
22.2%
26.3%
-
20,0
40,0
60,0
80,0
100,0
120,0
140,0
160,0
1Q09 1Q10
147.4%
49.0
115.9
18.0%
20.4%
-
20,0
40,0
60,0
80,0
100,0
120,0
140,0
1Q09 1Q10
136.4%
91.7
195.7
33.7%34.4%
-
50,0
100,0
150,0
200,0
250,0
1Q09 1Q10
113.4%
Earnings Release 1Q10
4

Earnings Release 1Q10
Transfers CEF (units)
Real Estate Financing
Increasing volume of units under contracts with CEF
MRV is the largest partner of CEF in the housing program “Minha Casa, Minha Vida”
First homebuilder in Brazil to participate in the Pilot Project of CEF
Status Apr 13-2010
Under Analysis (units) 812,826 61,632 8%
00-03 MW 479,412 0
03-10 MW 333,414 61,632 18%
(VGV R$million) R$ 45,670 R$ 6,016 13%
Approved (units) 53,704
(projects) 289
Contracted (units) 408,674 22,612 6%
00-03 MW 203,997 0
03-10 MW 204,677 22,612 11%
(VGV R$million) R$ 22,800 R$ 2,217 10%
Source : Caixa, O Dia (04/18/2010) and MRV (04/20/2010)
5
1,8422,553
3,709
4,702
697
2,539
5,092
8,801
0
1.000
2.000
3.000
4.000
5.000
6.000
7.000
8.000
9.000
10.000
1Q09 2TQ09 3Q09 4Q09 1Q10
Transfers
YTD

Earnings Release 1Q10
Constant financial discipline and reduction of the cash burn...
Cash Burn
Change in Net Debt
(R$ million)
6
100.6
123.8
0.1
89.8
75.9
1Q09 2Q09 3Q09 4Q09 1Q10

Earnings Release 1Q10
Shared Service Center
MRV Engenharia
Investing in people, processes and information technology....
BPM ECM GED
Cognos (Planning) SAP - BO (Cube) Microsoft (Report)
BI - Business Inteligence
RM - HR Management
Microsoft Dynamics
Microsoft Sharepoint
ECM - Content Management
ERP
Portal Colaboration
SAP ECC 6.0
MRV Obras
CRM
Client Relationship Management
New Organizational Chart
- Opening room for talents
Meritocracy
- New Stock Options Plan
Belo Horizonte Headquarter
- Lower Cost
- Edge on talent attraction
Talents
132 engineers and 315 trainees
Our People
7

8
Land Bank
Launches
Contracted Sales
Inventories at Market Value
Productivity Index
Indebtedness and Net Debt
Unearned Results
Guidance
Operational and Financial Performance 1Q10
Operational and Financial Performance

... On March 31, 2010:
•Land bank of R$10,923.0 million
• 110,238 potential units
• Average price of R$99.1 thousand (focus on low income)
• 367 units per construction site (average)
... by financing source Mar/10
% swap / land cost % land cost/ PSV
9
Operational and Financial Performance
Land Bank (%MRV)
SFH - FGTS91%
SFH - SBPE
9%
Land Bank %MRV (R$ billion)
Swap43%
Cost9%
1Q10

... by price range in 1Q10
Operational and Financial Performance
10
1Q10
... by financing source in 1Q10
... in 1Q10
• Launches of 24 new projects
• PSV of R$606.1 million – 5,829 units
• 81% of the launched units are elegible to MCMV
Launches (%MRV)
SFH - FGTS81%
SFH - SBPE19%
Lançamentos %MRV (em R$ milhões)
268.5
606.1
-
100,0
200,0
300,0
400,0
500,0
600,0
700,0
1Q09 1Q10
125.7%
Below R$130,000
74%
Over R$130,000
26%

11
Operational and Financial Performance 1Q10
Contracted Sales (%MRV)
... in 1Q10
• Total of R$732.7 million with sales
• 6,974 sold units
• Average Sales Speed of 16%
Contracted Sales%MRV (em R$ milhões)
... by price range in 1Q10
... by financing source in 1Q10
SFH - FGTS79%
SFH - SBPE21%
430.1
732.7
1Q09 1Q10
70.4%
Below R$80,000
9%
From R$80,001 to R$130,000
71%
Over R$130,000
20%

12
Inventory distribution of units for saleper construction phase as of Mar/31/09
Inventory at Market Value 03/31/10 = R$ 1.5 billion
Inventory distribution of units for saleper financing source as of Mar/31/09
Operational and Financial Performance 1Q10
Inventory at Market Value (%MRV)
SFH - FGTS85%
SFH - SBPE15%
Construction not initiated
60%
Under costruction
37%
Finished3%

Selling Expenses
(R$ million)
Selling Expenses / Contracted Sales %MRV (%)
and Selling Expenses / Net Revenue (%)
13
Operational and Financial Performance 1Q10
Productivity Index
24.8
35.8
0
5
10
15
20
25
30
35
40
1Q09 1Q10
44.2%
9.1%
6.3%
5.8%4.9%
0,0%
1,0%
2,0%
3,0%
4,0%
5,0%
6,0%
7,0%
8,0%
9,0%
10,0%
1Q09 1Q10
% Net Revenue
% Sales

G&A Expenses
(R$ million)
G&A Expenses / Contracted Sales %MRV (%)
and G&A Expenses / Net Revenue (%)
14
Operational and Financial Performance 1Q10
Productivity Index
7.9%
5.3%
5.0%4.1%
0,0%
1,0%
2,0%
3,0%
4,0%
5,0%
6,0%
7,0%
8,0%
9,0%
1Q09 1Q10
% Net Revenue
% Sales
21.6
30.3
1Q09 1Q10
40.5%
15
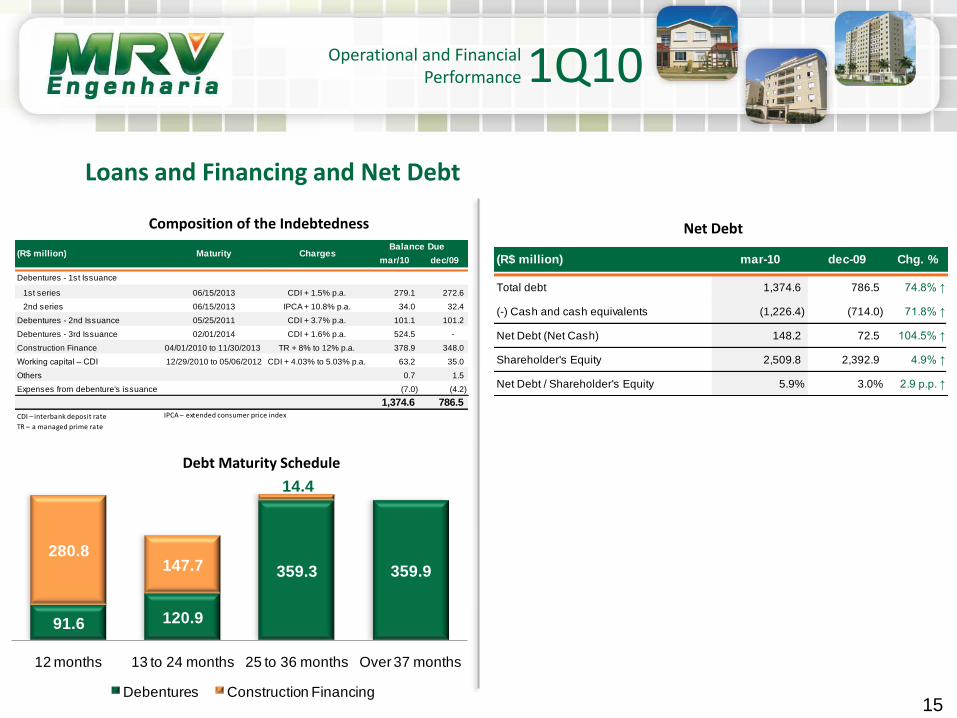
Debt Maturity Schedule
Loans and Financing and Net Debt
Operational and Financial Performance 1Q10
Composition of the Indebtedness Net Debt
(R$ million) mar-10 dec-09 Chg. %
Total debt 1,374.6 786.5 74.8% ↑
(-) Cash and cash equivalents (1,226.4) (714.0) 71.8% ↑
Net Debt (Net Cash) 148.2 72.5 104.5% ↑
Shareholder's Equity 2,509.8 2,392.9 4.9% ↑
Net Debt / Shareholder's Equity 5.9% 3.0% 2.9 p.p. ↑
91.6 120.9
359.3 359.9
280.8147.7
14.4
12 months 13 to 24 months 25 to 36 months Over 37 months
Debentures Construction Financing
mar/10 dec/09
Debentures - 1st Issuance
1st series 06/15/2013 CDI + 1.5% p.a. 279.1 272.6
2nd series 06/15/2013 IPCA + 10.8% p.a. 34.0 32.4
Debentures - 2nd Issuance 05/25/2011 CDI + 3.7% p.a. 101.1 101.2
Debentures - 3rd Issuance 02/01/2014 CDI + 1.6% p.a. 524.5 -
Construction Finance 04/01/2010 to 11/30/2013 TR + 8% to 12% p.a. 378.9 348.0
Working capital – CDI 12/29/2010 to 05/06/2012 CDI + 4.03% to 5.03% p.a. 63.2 35.0
Others 0.7 1.5
Expenses from debenture's issuance (7.0) (4.2)
1,374.6 786.5
CDI – interbank deposit rate
TR – a managed prime rate
IPCA – extended consumer price index
(R$ million) Maturity ChargesBalance Due

16
Unearned Results
Operational and Financial Performance 1Q10
(R$ million) mar-10 dec-09 Chg. %
Unearned Sales Revenues 2,482.6 2,278.0 9.0% ↑
(-) Unearned Costs of Units Sold (1,304.9) (1,230.8) 6.0% ↑
Unearned Results 1,177.7 1,047.2 12.5% ↑
Unearned Results Margin 47.4% 46.0% 1.5 p.p. ↑

17
Guidance 2009 / 2010
Operational and Financial Performance 1Q10
2010 Guidance
Contracted sales (%MRV) - R$ million 3,700 ~ 4,300
EBITDA Margin* 25% ~ 28%
* according to the accounting practices of 2009

18
Disclaimer
Earnings Release 1Q10
The material that follows is a presentation of general background information about MRV Engenharia e Participações S.A. and its
subsidiaries (collectively, “MRV” or the “Company”) as of the date of the presentation. It is information in summary form and does
not purport to be complete. No representation or warranty, express or implied, is made concerning, and no reliance should be
placed on, the accuracy, fairness, or completeness of this information.
This presentation may contain certain forward-looking statements and information relating to MRV that reflect the current views
and/or expectations of the Company and its management with respect to its performance, business and future events. Forward
looking statements include, without limitation, any statement that may predict, forecast, indicate or imply future results,
performance or achievements, and may contain words like “believe,” “anticipate,” “expect,” “envisages,” “will likely result,” or any
other words or phrases of similar meaning. Such statements are subject to a number of risks, uncertainties and assumptions. We
caution you that a number of important factors could cause actual results to differ materially from the plans, objectives,
expectations, estimates and intentions expressed in this presentation. In no event, neither the Company nor any of its affiliates,
directors, officers, agents or employees shall be liable before any third party (including investors) for any investment or business
decision made or action taken in reliance on the information and statements contained in this presentation or for any
consequential, special or similar damages.
This presentation does not constitute an offer, or invitation, or solicitation of an offer to purchase any securities. Neither this
presentation nor anything contained herein shall form the basis of any contract or commitment whatsoever.
The market and competitive position data, including market forecasts, used throughout this presentation was obtained from internal
surveys, market research, publicly available information and industry publications. Although we have no reason to believe that any
of this information or these reports are inaccurate in any material respect, we have not independently verified the competitive
position, market share, market size, market growth or other data provided by third parties or by industry or other publications. MRV
does not make any representation as to the accuracy of such information.
This presentation and its contents are proprietary information and may not be reproduced or otherwise disseminated in whole or in
part without MRV’s prior written consent.
Leonardo CorrêaChief Financial Officer
Mônica SimãoChief Investor Relations Officer
Felipe GonçalvesInvestor Relations Manager
Ph.: (31) 3348-7150
E-mail: [email protected]
www.mrv.com.br/ri
19
Contacts
Earnings Release 1Q10