Embed Size (px)
Citation preview

INVESTOR PRESENTATION
18th Annual ICR Conference
January 2016

2
FORWARD LOOKING STATEMENTS AND NON-GAAP FINANCIAL MEASURES
Denny’s Corporation urges caution in considering its current trends and any outlook on earnings disclosed in this presentation. In addition, certain matters discussed may constitute forward-looking statements. These forward-looking statements, which reflect the Company’s best judgment based on factors currently known, are intended to speak only as of the date such statements are made and involve risks, uncertainties, and other factors that may cause the actual performance of Denny’s Corporation, its subsidiaries and underlying restaurants to be materially different from the performance indicated or implied by such statements. Words such as “expects”, “anticipates”, “believes”, “intends”, “plans”,“hopes”, and variations of such words and similar expressions are intended to identify such forward-looking statements. Except as may be required by law, the Company expressly disclaims any obligation to update these forward-looking statements to reflect events or circumstances after the date of this presentation or to reflect the occurrence of unanticipated events. Factors that could cause actual performance to differ materially from the performance indicated by these forward-looking statements include, among others: the competitive pressures from within the restaurant industry; the level of success of the Company’s operating initiatives, advertising and promotional efforts; adverse publicity; health concerns arising from food-related pandemics, outbreaks of flu viruses, such as avian flu, or other diseases; changes in business strategy or development plans; terms and availability of capital; regional weather conditions; overall changes in the generaleconomy, particularly at the retail level; political environment (including acts of war and terrorism); and other factors from time to time set forth in the Company’s SEC reports, including but not limited to the discussion in Management’s Discussion and Analysis and the risks identified in Item 1A. Risk Factors contained in the Company’s Annual Report on Form 10-K for the year ended December 31, 2014 (and in the Company’s subsequent quarterly reports on Form 10-Q).
The presentation includes references to the Company’s non-GAAP financials measures. The Company believes that, in addition to other financial measures, Adjusted Income Before Taxes, Adjusted EBITDA, Free Cash Flow, Adjusted Net Income and Adjusted Net Income Per Share are appropriate indicators to assist in the evaluation of its operating performance on a period-to-period basis. The Company also uses Adjusted Income Before Taxes, Adjusted EBITDA and Free Cash Flow internally as performance measures for planning purposes, including the preparation of annual operating budgets, and for compensation purposes, including bonuses for certain employees. Adjusted EBITDA is also used to evaluate its ability to service debt because the excluded charges do not have an impact on its prospective debt servicing capability and these adjustments are contemplated in its credit facility for the computation of its debt covenant ratios. Free Cash Flow, defined as Adjusted EBITDA less cash portion of interest expense net of interest income, capital expenditures, and cash taxes, is used to evaluate operating effectiveness and decisions regarding the allocation of resources. However, Adjusted Income Before Taxes, Adjusted EBITDA, Free Cash Flow, Adjusted Net Income and Adjusted Net Income Per Share should be considered as a supplement to, not a substitute for, operating income, net income or other financial performance measures prepared in accordance with U.S. generally accepted accounting principles. See Appendix for non-GAAP reconciliations.

3
DENNY’S INVESTMENT HIGHLIGHTS
* See Appendix for reconciliation of Net Income to Adjusted EBITDA, Adjusted Income Before Taxes, Adjusted Net Income, Adjusted Net Income per Share (also called Earnings per Share) and Free Cash Flow.
1. Based preliminary data for Q4 2015 and full year 2015 ending on December 30, 2015 provided in Press Release dated January 11, 2016.
2. Cumulative growth calculated using high end of annual guidance range for 2015 as provided in Press Releases dated November 3, 2015 and January 11, 2016.
3. Cumulative growth calculated using 2014 data from Press Release dated February 18, 2015.
4. As provided in Press Releases dated November 3, 2015 and January 11, 2016.
5. Cumulative from 2011 to 2015, using high end of annual guidance range for 2015 as provided in Press Releases dated November 3, 2015 and January 11, 2016.
6. Preliminary data as of December 30, 2015, end of Fiscal 2015, including funding of $50 million accelerated share program.
Consistently Growing Same-Store Sales
� System-wide same-store sales growth in 18 of last 19 quarters1
� Highest annual same-store sales growth in over a decade1
Expanding Global Footprint
� 366 new restaurants opened since 2009 (>20% of the system)1
� 40 international locations opened since 2009 (6 new countries)1
Growing Profitability with 90% Franchised
Business
� 19% Adjusted EBITDA* growth since 20102
� 18% Adjusted EPS* growth in 2014; 91% Adjusted EPS* growth since 20103
Strong Free Cash Flow*
Generation
� Over $40M of Free Cash Flow* in 2015, after capital expenditures, cash interest and cash taxes4
� Generated >$230M in Free Cash Flow* over the last 5 years5
Consistently Returning Cash to Shareholders
� Over $100M allocated to repurchase shares in 20156
� $214M allocated to share repurchase program since November 20106

4
Run Restaurants Serving Classic American Comfort Food
at a Good Price Around the Clock
EXECUTION OF BRAND REVITALIZATION STRATEGY DRIVING RESULTS
Drive Profit Growth for All Stakeholders
Growthe Global Franchise
Consistently Operate
Great Restaurants
Deliver a Differentiated
andRelevant Brand
“Become the World’s Largest, Most Admired and Beloved Family of Local Restaurants”
OUR GUIDING PRINCIPLES

5
For unpretentious, loyal, hardworking people
everywhere, Denny’s is always there for you.
Our light is always on and our door is always
open, welcoming you, and the people you care
about, to come inside. Our friendly staff lets
everyone forget about the small stuff, be
themselves and focus on what’s important,
while savoring a varied menu of classic,
comforting American fare, at a fair price.
DELIVERING A DIFFERENTIATED AND RELEVANT BRAND
Food Service
Welcome to America’s Diner
Atmosphere

6
MENU EVOLUTION TO MATCH GUESTS’ NEEDS
FOCUS ON BETTER QUALITY, MORE CRAVE-ABLE PRODUCTS
More Than 50% of the Core Menu Items Changed or Improved Since 2013
Leading to Significant Improvement in Taste and Quality Scores
7
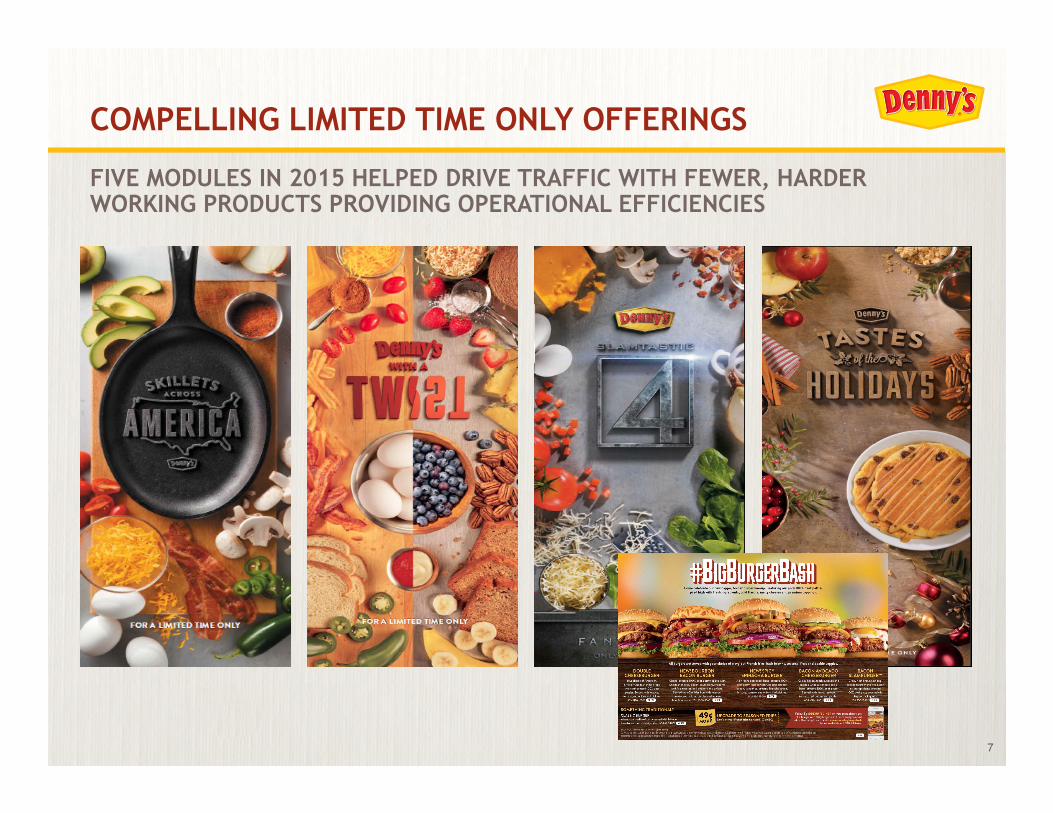
COMPELLING LIMITED TIME ONLY OFFERINGS
FIVE MODULES IN 2015 HELPED DRIVE TRAFFIC WITH FEWER, HARDER WORKING PRODUCTS PROVIDING OPERATIONAL EFFICIENCIES

8
NEWEST LIMITED TIME ONLY OFFERING FURTHER LEVERAGES SKILLET PLATFORM
UTILIZING FRESH INGREDIENTS AND BOLD FLAVORS
Supreme Green Skillet
Crazy Spicy Skillet
Wild Salmon Skillet
Mighty Meatlovers Skillet

9
“Crazy Spicy” Skillet Commercial
https://youtu.be/UDCC1CmCtmI
10
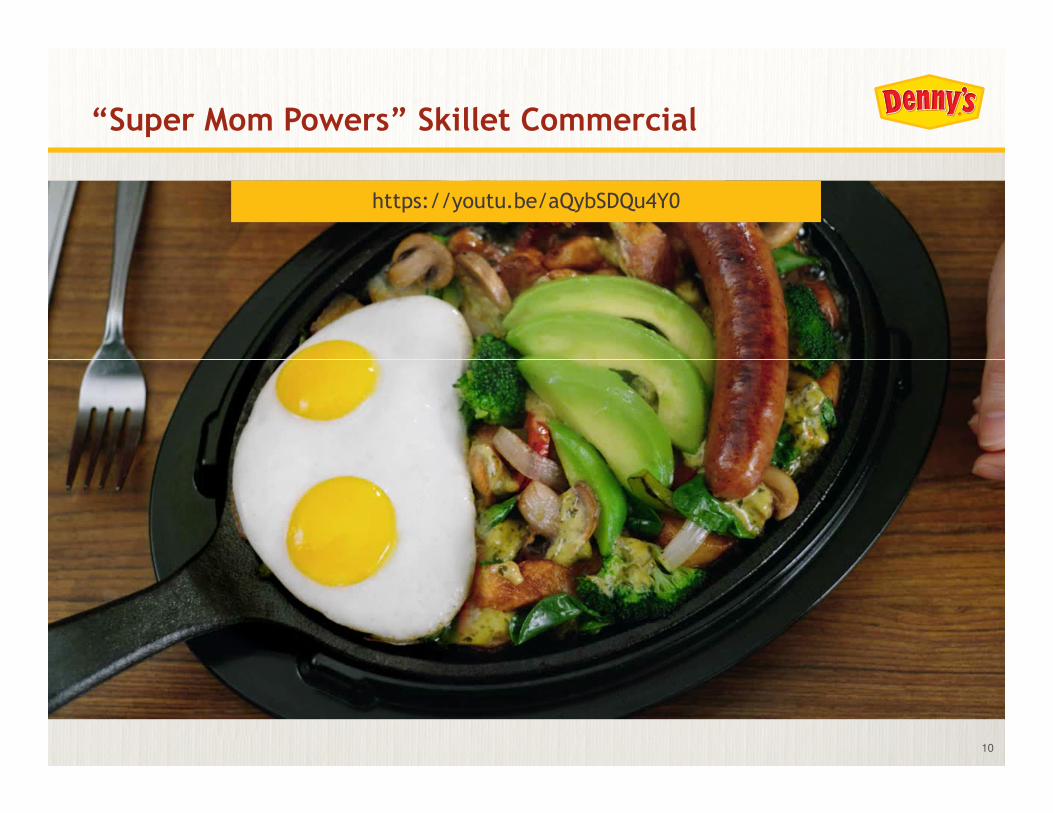
“Super Mom Powers” Skillet Commercial
https://youtu.be/aQybSDQu4Y0

11
Everyday Value Menu Helping to Drive Traffic
� High awareness as 1 in 5 guests say they visit Denny’s because of $2-4-6-8 Value Menu
� Utilize local and national media targeting popular products like $4 Everyday Value Slam
� Changed 50% of the menu in the past 18 months providing more percent margin friendly products
� Incidence rate has declined from over 20% to approximately 16% today, as guests trade into higher priced products

12
“So Much Win” Grand Slam Slugger Commercial
https://youtu.be/74TzL4tF02g

13
“Late Night” Grand Slam Slugger Commercial
https://youtu.be/AyQqqYdU69c

14
ENGAGING KEY CUSTOMER SEGMENTS THROUGH TRADITIONAL AND NEW MEDIA
Boomers
Families with Kids (under 12)
Hispanic
Millennials

15
The Grand Slams “Episode 14 - Sausagefest” Video
https://youtu.be/8_J7MIju580?list=PLSDnZKOk5R3z6Ks_C5LDMW37VlzJN7HfP

16
32% System
79% Company
>70% System
≈45% System
≈100% Company
REMODEL PROGRAM ENHANCING TRAFFIC AND SCORES
THE HERITAGE IMAGE RESTAURANT
End of 2015* By Year End 2016 By End of 2018
* Data as of December 30, 2015, the end of Fiscal 2015. Includes new openings and international restaurants.

17
HERITAGE IMAGE KEY TO REVITALIZING LEGACY BRAND
Lega
cy D
enny’s
New
Denny’s

18
� Investments in training talent, tools and strategies driving improvements in guest satisfaction scores
� Denny’s Pride Review Program introduced in 2014 with new team of coaches evaluating and sharing best practices
� Close collaboration with franchisees executing remodels, improving speed of service and growing margins
� High level of involvement with franchisees planning and executing initiatives through Brand Advisory Councils and Denny’s Franchisee Association (DFA)
FOCUS ON OPERATING GREAT RESTAURANTS LEADING TO SUSTAINED IMPROVEMENT
OVERALL SATISFACTION SCORES HIGHEST SINCE WE STARTED MEASURING

19
CONSISTENTLY GROWING SAME-STORE SALES
(1.9%)
1.6%
0.5%
1.7%2.5%
1.2%0.5%
1.7%
(0.6%)
0.6%1.2% 0.9%
1.8% 1.9%2.4%
4.7%
7.2% 7.3%
6.1%
2.9%
(4.0%)
(2.0%)
0.0%
2.0%
4.0%
6.0%
8.0%
Q12011
Q22011
Q32011
Q42011
Q12012
Q22012
Q32012
Q42012
Q12013
Q22013
Q32013
Q42013
Q12014
Q22014
Q32014
Q42014
Q12015
Q22015
Q32015
Q42015*
Denny’s System-Wide Same-Store Sales (Domestic)*
Positive System-Wide Same-Store Sales in 18 of Last 19 Quarters
Achieved Highest Annual Domestic Same-Store Sales Growth in Over a Decade
* Preliminary data for Fourth Quarter and Full Year 2015 provided in Press Release dated January 11, 2016.

20
EXPANDING GLOBAL FOOTPRINT
* Preliminary data for Fourth Quarter and Full Year 2015 provided in Press Release dated January 11, 2016.
** Excludes acquisitions, refranchising and relocations. Includes total of 123 Flying J Travel Center conversion openings with 100 opened in 2010 and 23 opened in 2011.
Growth Initiatives Enabled More Than 360 New Restaurant Openings Since 2009 with 90% Opened by Franchisees
40
136
61
4046
3845
10
107
27
3 12
2 8
(20)
20
60
100
140
2009 2010 2011 2012 2013 2014 2015*
New Restaurant Openings Net Restaurant Growth**

21
399
3
6
24
45
190
2781
35
11
4
4
2925
15
8
5
3
415
2
41
9
4
5 7 21
138
17
286
24
54
16
21
37 4239
328
53
7
925 1
23
11 47
2
DOMESTIC EXPANSION OPPORTUNITY
TOP 10 U.S. MARKETS*
DMA UNITS
Los Angeles 186
Phoenix 64
Houston 60
Sacramento/Stockton 52
Dallas/Ft. Worth 50
San Francisco/San Jose 44
Orlando 44
San Diego 41
Miami 37
Chicago 34
Nearly 1,600 Restaurants in the U.S.* with Strongest Presence in West Coast, Southwest, Texas and Florida
* Data as of December 30, 2015, the end of Fiscal 2015.
22
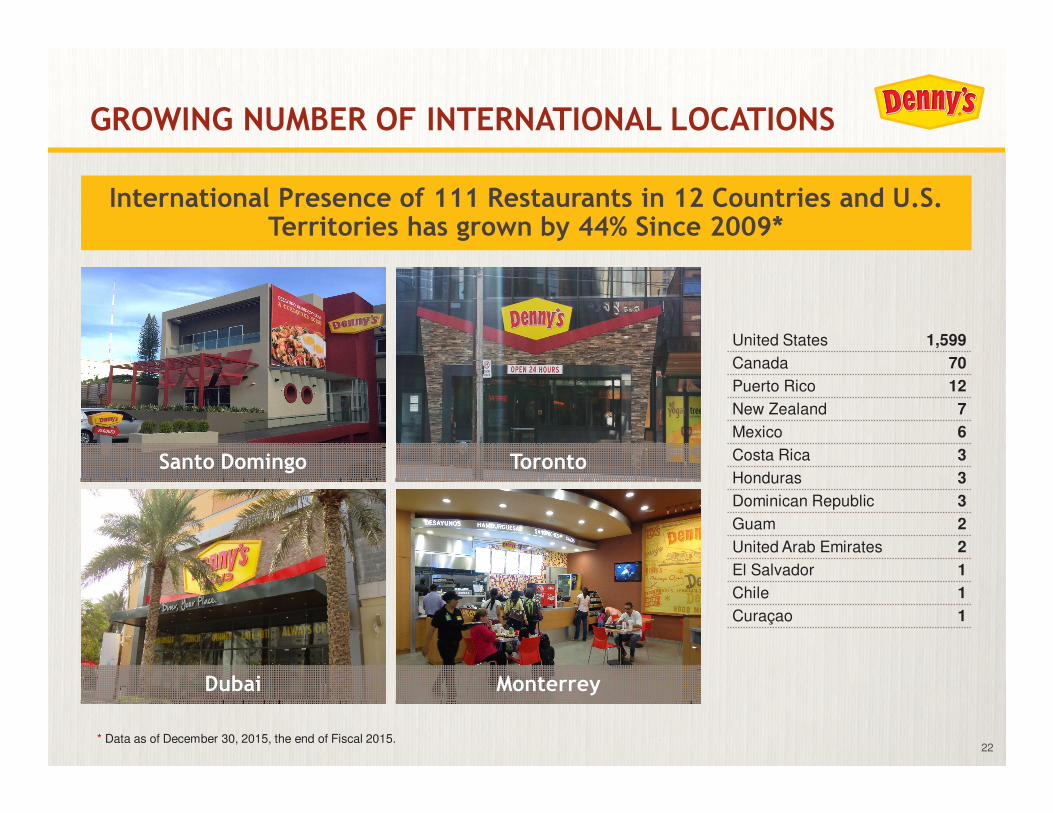
GROWING NUMBER OF INTERNATIONAL LOCATIONS
United States 1,599
Canada 70
Puerto Rico 12
New Zealand 7
Mexico 6
Costa Rica 3
Honduras 3
Dominican Republic 3
Guam 2
United Arab Emirates 2
El Salvador 1
Chile 1
Curaçao 1
International Presence of 111 Restaurants in 12 Countries and U.S. Territories has grown by 44% Since 2009*
Santo Domingo
Dubai
Toronto
Monterrey
* Data as of December 30, 2015, the end of Fiscal 2015.

23
GROWING BASE OF NON-TRADITIONAL LOCATIONS
Pilot Flying J Travel Center
UNC Charlotte
Leading Full-Service Brand in Travel Centers including New Partnership with Kwik Trip® Convenience Stores
Non-Traditional Locations at Universities and Military Bases
Kwik Trip Travel Center
University of Alabama Birmingham

24
GROWING EARNINGS PER SHARE*
Highly Franchised Business Provides Lower Risk with More Upsidefrom Meaningful Base of High Volume Company Restaurants
$19.5
$25.2
$29.2 $32.9
$0.20
$0.26
$0.31
$0.37
$0
$10
$20
$30
$40
$50
$0.00
$0.10
$0.20
$0.30
$0.40
2011 2012 2013 2014
Ad
juste
d N
et In
co
me
*
($ M
illion
s)
Ad
juste
d N
et
Inco
me
*
per
Sh
are
Adjusted Net Income* Adjusted Net Income per Share*
* See Appendix for non-GAAP financial reconciliations of Net Income to Adjusted EBITDA, Adjusted Income Before Taxes, Adjusted Net Income, Adjusted Net Income per Share (also called Earnings per Share) and Free Cash Flow.

25
STRONG FREE CASH FLOW* GENERATION
* See Appendix for non-GAAP financial reconciliations of Net Income to Adjusted EBITDA, Adjusted Income Before Taxes, Adjusted Net Income, Adjusted Net Income per Share and Free Cash Flow.
** Cumulative from 2011 to 2015, using high end of annual guidance range for 2015 as provided in Press Releases dated November 3, 2015 and January 11, 2016.
*** As provided in Press Releases dated November 3, 2015 and January 11, 2016.
Over $230 Million in Free Cash Flow* Generated Over Last 5 Years**
2015 Investments include Accelerating Remodels and Franchised Acquisitions
$17.0 $11.6 $9.1
$8.1
$1.1 $2.0
$2.8 $3.8
$16.1 $15.6
$20.8 $22.1
$81.8 $77.9 $76.9
$82.5
$47.6 $48.8 $44.2
$48.5
$0
$20
$40
$60
$80
$100
2011 2012 2013 2014 2015Guidance***
$ M
illio
ns
Cash Capital Cash Taxes Cash Interest Adjusted EBITDA* Free Cash Flow*
$86 to $88
$40 to $42
Expect 2015 Adjusted
EBITDA* and Free Cash
Flow* to be at High End of Guidance Ranges***

26
SOLID BALANCE SHEET WITH FLEXIBILITY
Growing Adjusted EBITDA* Enables Higher Leverage while Maintaining Financial Flexibility to Make Investments and Return Cash to Shareholders
0.0x
0.5x
1.0x
1.5x
2.0x
2.5x
3.0x
3.5x
4.0x
2010 2011 2012 2013 2014 Q32015
$0
$100
$200
$300
$400
$500
$600
To
tal
Deb
t /
Ad
juste
d E
BIT
DA
*To
tal D
eb
t *($
Millio
ns)
Total Debt* Total Debt / Adjusted EBITDA*
2x to 3x Total Debt to Adjusted EBITDA*
Ratio Target
* See Appendix for non-GAAP financial reconciliations of Net Income to Adjusted EBITDA, Adjusted Income Before Taxes, Adjusted Net Income, Adjusted Net Income per Share (also called Earnings per Share) and Free Cash Flow. Total Debt is Gross Debt including Capital Lease Obligations.

27
� Over $100 million allocated to repurchase shares in 2015, including $50 million accelerated share repurchase program*
� $214 million allocated to repurchase shares since November 2010*
� $38 million remaining in share repurchase authorization program*
CONSISTENTLY RETURNING CASH TO SHAREHOLDERS
$3.9 $21.6 $22.2 $24.7
$36.0
$105.8
Q4 '10 2011 2012 2013 2014 2015*
SHARE REPURCHASES ($ Millions)
OVER $200 MILLION ALLOCATED TOWARDS SHARE REPURCHASES SINCE WE STARTED TO RETURN CASH TO SHAREHOLDERS IN 2010*
* Preliminary data as of December 30, 2015, the end of Fiscal 2015, and includes the funding of a $50 million accelerated share repurchase program.
28
� Consistently growing same-store sales through brand revitalization strategies to enhance food, service and atmosphere
� Expanding global footprint with traditional and non-traditional distribution points
� Growing profitability with 90% franchised business provides lower risk profile with upside from operating meaningful base of high volume restaurants
� Strong Free Cash Flow* generation supported by solid balance sheet with significant flexibility to support brand investments
� Consistently returning cash to shareholders through share repurchase program
DENNY’S INVESTMENT HIGHLIGHTS
* See Appendix for non-GAAP financial reconciliations of Net Income to Adjusted EBITDA, Adjusted Income Before Taxes, Adjusted Net Income, Adjusted Net Income per Share (also called Earnings per Share) and Free Cash Flow.
APPENDIX

30
NON-GAAP FINANCIAL RECONCILIATIONS
1. Includes 53 operating weeks.
2. YTD through third quarter.
3. In the fourth quarter of 2011, we recorded an $89 million net deferred tax benefit from the release of a substantial portion of the valuation allowance on certain deferred tax assets. This release was primarily based on our improved historical and projected pre-tax income.
4. Tax adjustments for YTD 2014 and YTD 2015 uses YTD effective tax rate of 33.2% and 34.0%, respectively. Tax adjustments for full year 2013 and 2014 use full year effective tax rate of 31.9% and 32.9%, respectively. Tax adjustments for full year 2011 and 2012 are calculated using the Company's full year 2012 effective tax rate of 36.4%.
5. Adjusted provision for income taxes based on effective income tax rate of 36.4% for full year ended Dec. 27, 2012 and excludes impact of net deferred tax benefit.
$ Millions 2005 2006 2007 20081 2009 2010 2011 2012 2013 20141YTD
20142YTD
20152
Net Income (loss) ($7.3) $28.5 $29.5 $12.7 $41.6 $22.7 $112.3 $22.3 $24.6 $32.7 $23.0 $27.2
Provision for Income Taxes3 1.2 16.3 6.7 3.5 1.4 1.4 (84.0) 12.8 11.5 16.0 11.5 14.0
Operating Gains, Losses and Other Charges, Net 3.1 (47.9) (31.1) (6.4) (14.5) (4.9) 2.1 0.5 7.1 1.3 1.0 1.7
Other Non-Operating Expense, Net (0.6) 8.0 0.7 9.2 (3.1) 5.3 2.6 7.9 1.1 (0.6) (0.5) 0.5
Share‐Based Compensation 7.8 7.6 4.8 4.1 4.7 2.8 4.2 3.5 4.9 5.8 3.0 5.5
Adjusted Income Before Taxes $4.2 $12.5 $10.5 $23.2 $30.0 $27.3 $37.3 $47.0 $49.2 $55.3 $38.1 $49.0
Interest Expense, Net 55.2 57.7 43.0 35.5 32.6 25.8 20.0 13.4 10.3 9.2 6.9 6.7
Depreciation and Amortization 56.1 55.3 49.3 39.8 32.3 29.6 28.0 22.3 21.5 21.2 15.7 15.8
Cash Payments for Restructuring Charges & Exit Cost (6.7) (5.1) (9.1) (9.1) (7.5) (7.0) (2.7) (3.8) (2.8) (2.0) (1.6) (1.2)
Cash Payments for Share‐Based Compensation (1.2) (0.9) (0.9) (1.0) (2.4) (1.9) (0.8) (1.0) (1.2) (1.1) (1.1) (3.4)
Adjusted EBITDA $107.6 $119.5 $92.9 $88.4 $85.0 $73.8 $81.8 $77.9 $76.9 $82.5 $58.0 $66.8
Adjusted EBITDA Margin % 11.0% 12.0% 9.9% 11.6% 14.0% 13.5% 15.2% 16.0% 16.6% 17.5% 16.9% 18.2%
Cash Interest Expense (48.2) (50.9) (38.5) (31.6) (29.3) (23.1) (17.0) (11.6) (9.1) (8.1) (6.1) (6.0)
Cash Taxes (1.3) (1.3) (2.3) (1.1) (0.6) (0.9) (1.1) (2.0) (2.8) (3.8) (3.1) (4.9)
Capital Expenditures (47.2) (33.1) (33.1) (27.9) (18.4) (27.4) (16.1) (15.6) (20.8) (22.1) (17.9) (20.8)
Free Cash Flow $11.0 $34.3 $19.0 $27.9 $36.7 $22.4 $47.6 $48.8 $44.2 $48.5 $31.0 $35.2
Net Income (loss) $112.3 $22.3 $24.6 $32.7 $23.0 $27.2
Gains on Sales of Assets and Other, Net (3.2) (7.1) (0.1) (0.1) (0.1) (0.0)
Impairment Charges 4.1 3.7 5.7 0.4 0.3 0.7
Early Extinguishment of Debt 1.4 7.9 1.2 0.0 0.0 0.3
Tax Effect of Adjustments4 (0.8) (1.6) (2.2) (0.1) (0.1) (0.3)
Adjusted Provision for Income Taxes5 (94.3)
Adjusted Net Income $19.5 $25.2 $29.3 $32.9 $23.2 $27.8
Adjusted Net Income Per Share $0.20 $0.26 $0.31 $0.37 $0.26 $0.32


![Present continuous denn[1]](https://img.pdfslide.us/doc/110x75/54bebeec4a79593d138b4640/present-continuous-denn1.jpg)