Embed Size (px)
Citation preview
1©2015. CYREN Ltd. All Rights Reserved. Proprietary and Confidential. This document and the contents therein are the sole property of CYREN and may not be transmitted or reproduced without CYREN’s express written permission.
INVESTOR PRESENTATION
January 2015
NASDAQ: CYRN
2
Safe Harbor and Forward Looking Statements
This presentation contains forward-looking statements, including projections about our business, within the meaning ofSection 27A of the Securities Act of 1933 and Section 21E of the Securities Exchange Act of 1934. For example, statements inthe future tense, and statements including words such as "expect," "plan," "estimate," "anticipate," or "believe" are forward-looking statements. These statements are based on information available to us at the time of the presentation; we assume noobligation to update any of them. The statements in this presentation are not guarantees of future performance and actualresults could differ materially from our current expectations as a result of numerous factors, including business conditions andgrowth or deterioration in the Internet market, commerce and the general economy, both domestic as well as international;fewer than expected new-partner relationships; competitive factors, including pricing pressures; technological developments,and products offered by competitors; the ability of our OEM partners to successfully penetrate markets with productsintegrated with CYREN technology; a slower than expected acceptance rate for our newer product offerings; availability ofqualified staff; and technological difficulties and resource constraints encountered in developing new products, as well as thoserisks described in the text of this presentation and the company's Annual Reports on Form 20-F and reports on Form 6-K, whichare available through www.sec.gov.
© 2015 CYREN. All rights reserved. CYREN, Recurrent Pattern Detection, RPD, Zero-Hour and GlobalView are trademarks, andAuthentium, Command Antivirus and Command AntiMalware are registered trademarks of CYREN. U.S. Patent No. 6,330,590is owned by CYREN. All other marks are the property of their respective companies.
3
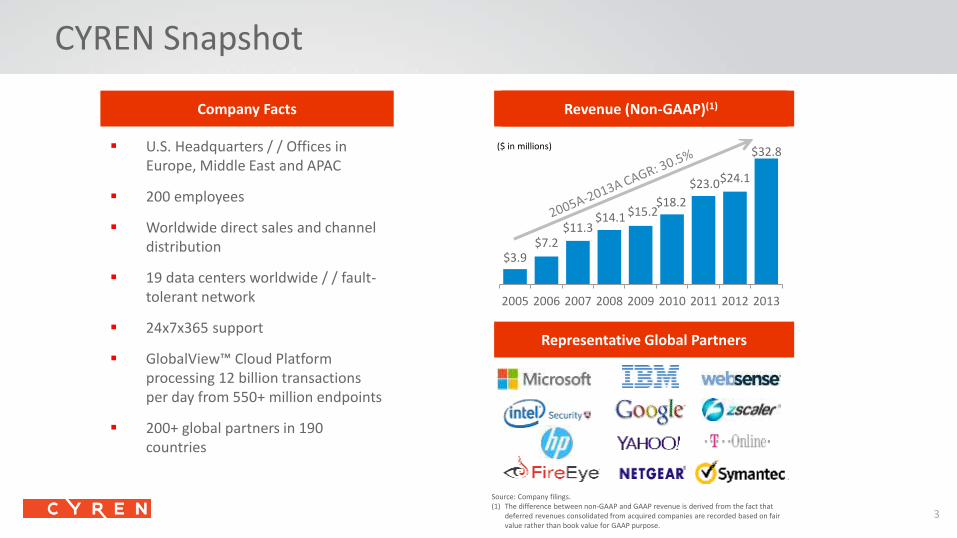
CYREN Snapshot
U.S. Headquarters / / Offices in Europe, Middle East and APAC
200 employees
Worldwide direct sales and channel distribution
19 data centers worldwide / / fault-tolerant network
24x7x365 support
GlobalView™ Cloud Platform processing 12 billion transactions per day from 550+ million endpoints
200+ global partners in 190 countries
Company Facts Revenue
$3.9$7.2
$11.3$14.1 $15.2
$18.2
$23.0$24.1
$32.8
2005 2006 2007 2008 2009 2010 2011 2012 2013
($ in millions)
Revenue (Non-GAAP)(1)
Representative Global Partners
Source: Company filings.(1) The difference between non-GAAP and GAAP revenue is derived from the fact that
deferred revenues consolidated from acquired companies are recorded based on fair value rather than book value for GAAP purpose.
44
Business OverviewCYREN brings the next generation of cloud-based security technology and services to global businesses by leveraging its real-time global threat data.
5
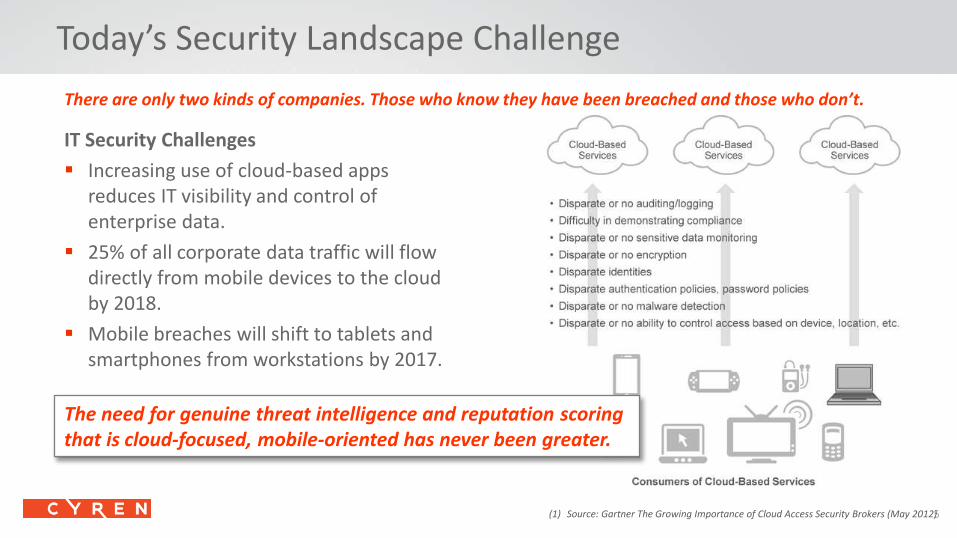
Today’s Security Landscape Challenge
There are only two kinds of companies. Those who know they have been breached and those who don’t.
IT Security Challenges
Increasing use of cloud-based apps reduces IT visibility and control of enterprise data.
25% of all corporate data traffic will flow directly from mobile devices to the cloud by 2018.
Mobile breaches will shift to tablets and smartphones from workstations by 2017.
The need for genuine threat intelligence and reputation scoring that is cloud-focused, mobile-oriented has never been greater.
(1) Source: Gartner The Growing Importance of Cloud Access Security Brokers (May 2012)
6
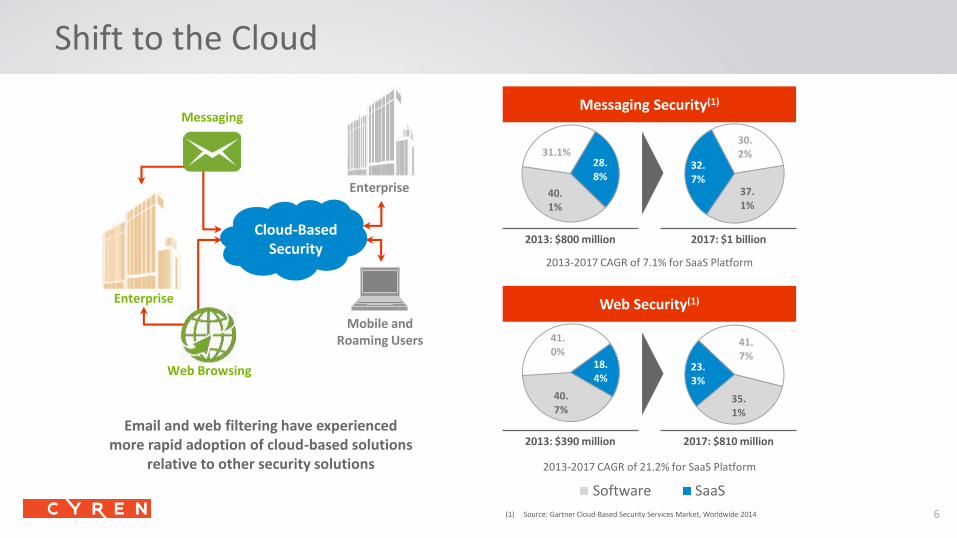
30.2%
37.1%
32.7%
40.1%
31.1%28.8%
Shift to the Cloud
Messaging Security(1)
Mobile andRoaming Users
Enterprise
Messaging
Cloud-Based Security
Web Browsing
2013: $800 million 2017: $1 billion
(1) Source: Gartner Cloud-Based Security Services Market, Worldwide 2014
Web Security(1)
Email and web filtering have experienced more rapid adoption of cloud-based solutions
relative to other security solutions
40.7%
41.0%
18.4%
41.7%
35.1%
23.3%
2013: $390 million 2017: $810 million
2013-2017 CAGR of 7.1% for SaaS Platform
2013-2017 CAGR of 21.2% for SaaS Platform
Software SaaS
Enterprise
7
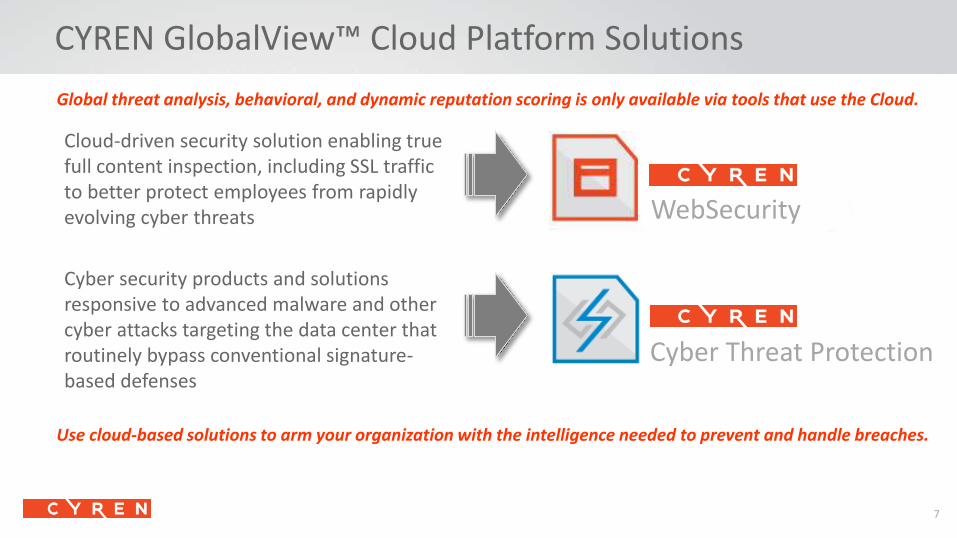
CYREN GlobalView™ Cloud Platform Solutions
Global threat analysis, behavioral, and dynamic reputation scoring is only available via tools that use the Cloud.
Cloud-driven security solution enabling true full content inspection, including SSL traffic to better protect employees from rapidly evolving cyber threats
Cyber security products and solutions responsive to advanced malware and other cyber attacks targeting the data center that routinely bypass conventional signature-based defenses
Use cloud-based solutions to arm your organization with the intelligence needed to prevent and handle breaches.
Cyber Threat Protection
WebSecurity
8
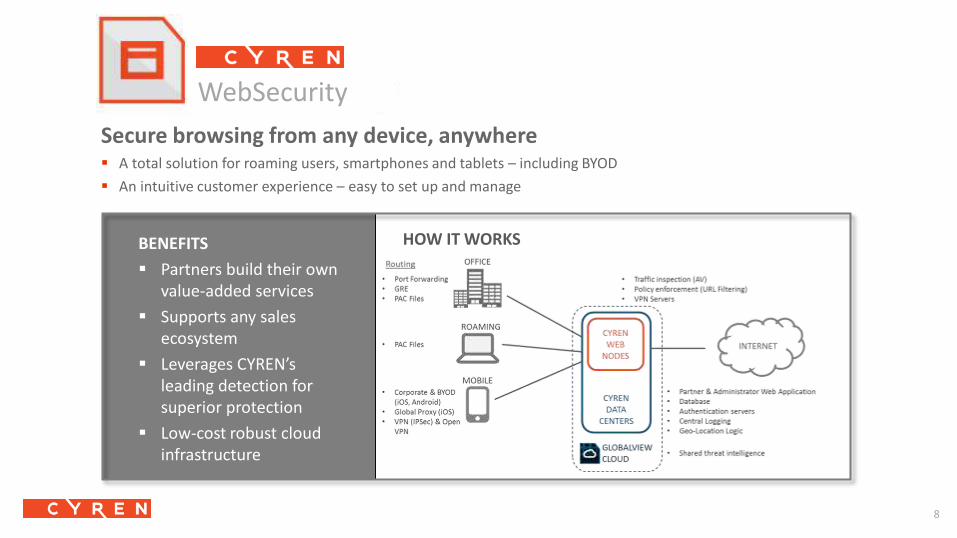
Secure browsing from any device, anywhere A total solution for roaming users, smartphones and tablets – including BYOD
An intuitive customer experience – easy to set up and manage
HOW IT WORKSBENEFITS
Partners build their own value-added services
Supports any sales ecosystem
Leverages CYREN’s leading detection for superior protection
Low-cost robust cloud infrastructure
WebSecurity
9
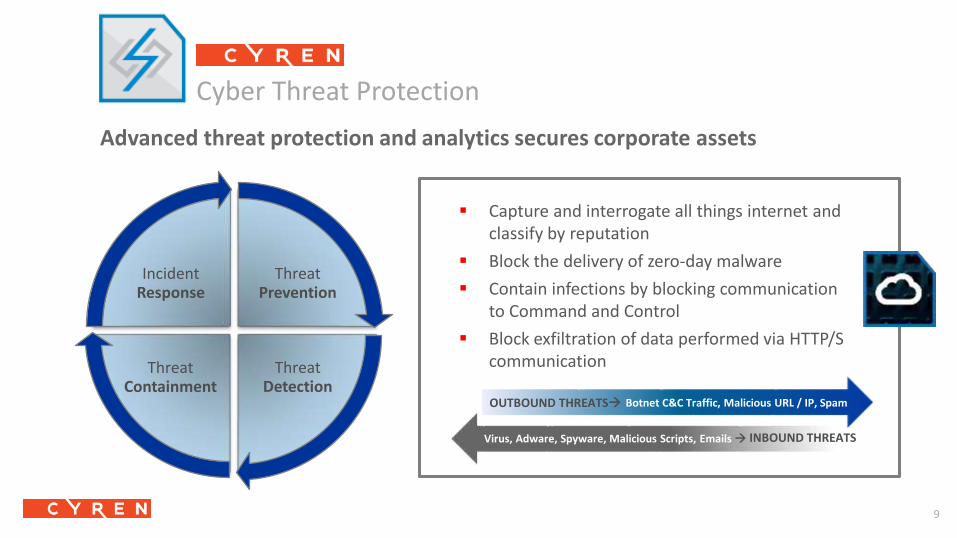
Capture and interrogate all things internet and classify by reputation
Block the delivery of zero-day malware
Contain infections by blocking communication to Command and Control
Block exfiltration of data performed via HTTP/S communication
OUTBOUND THREATS Botnet C&C Traffic, Malicious URL / IP, Spam
Virus, Adware, Spyware, Malicious Scripts, Emails INBOUND THREATS
Threat Prevention
Threat Detection
Threat Containment
Incident Response
Advanced threat protection and analytics secures corporate assets
Cyber Threat Protection
10
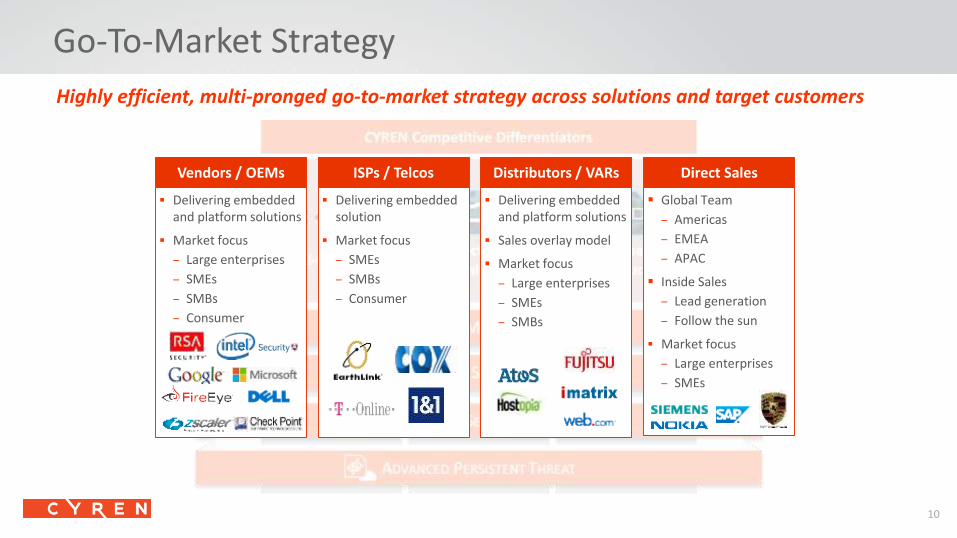
Go-To-Market Strategy
Highly efficient, multi-pronged go-to-market strategy across solutions and target customers
Distributors / VARsVendors / OEMs ISPs / Telcos Direct Sales
Global Team
‒ Americas
‒ EMEA
‒ APAC
Inside Sales
‒ Lead generation
‒ Follow the sun
Market focus
‒ Large enterprises
‒ SMEs
Delivering embedded and platform solutions
Sales overlay model
Market focus
‒ Large enterprises
‒ SMEs
‒ SMBs
Delivering embedded solution
Market focus
‒ SMEs
‒ SMBs
‒ Consumer
Delivering embedded and platform solutions
Market focus
‒ Large enterprises
‒ SMEs
‒ SMBs
‒ Consumer
11
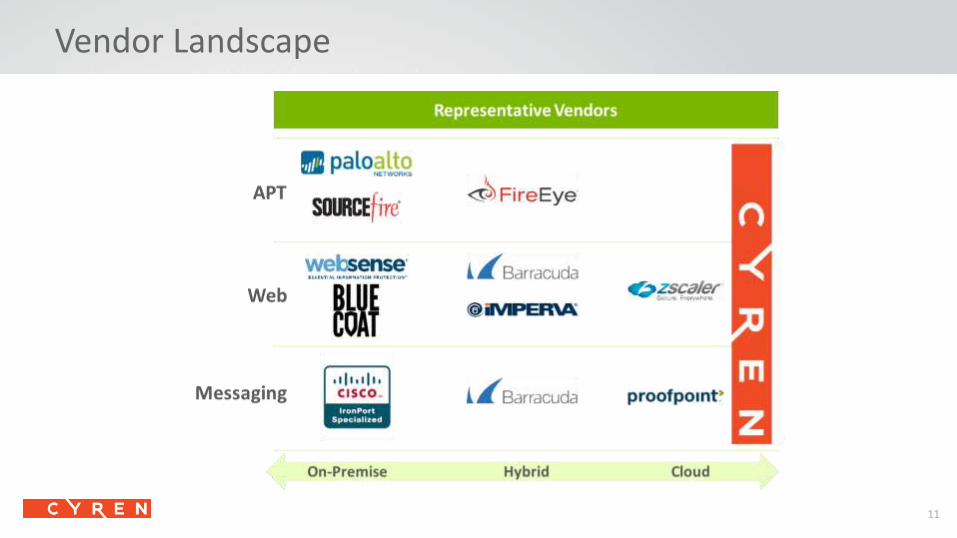
Vendor Landscape

1212
Financial OverviewProtect your company’s mostcritical information assets on any device, any location, all the time
13
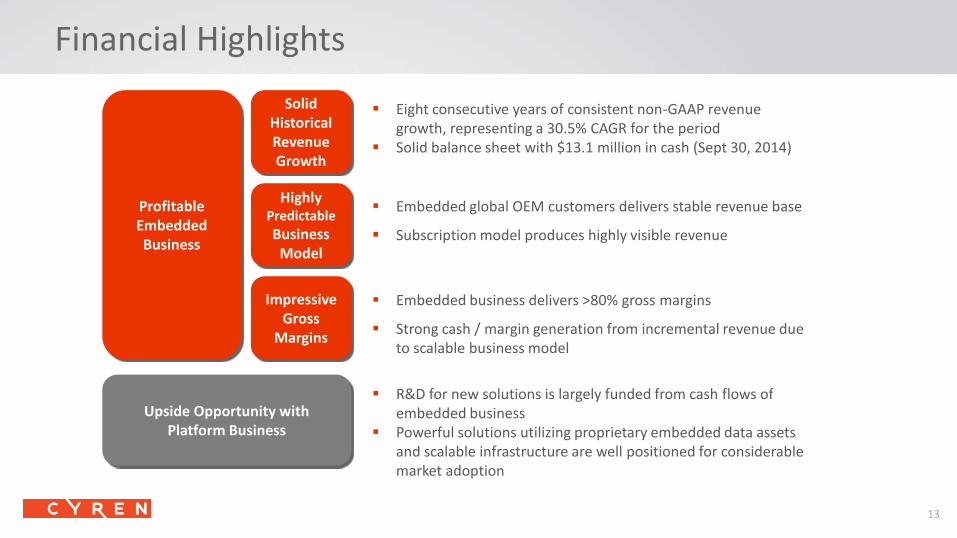
Financial Highlights
Upside Opportunity with Platform Business
Highly Predictable
Business Model
Profitable Embedded Business
Impressive Gross
Margins
Solid Historical Revenue Growth
Eight consecutive years of consistent non-GAAP revenue growth, representing a 30.5% CAGR for the period
Solid balance sheet with $13.1 million in cash (Sept 30, 2014)
Embedded global OEM customers delivers stable revenue base
Subscription model produces highly visible revenue
Embedded business delivers >80% gross margins
Strong cash / margin generation from incremental revenue due to scalable business model
R&D for new solutions is largely funded from cash flows of embedded business
Powerful solutions utilizing proprietary embedded data assets and scalable infrastructure are well positioned for considerable market adoption
14
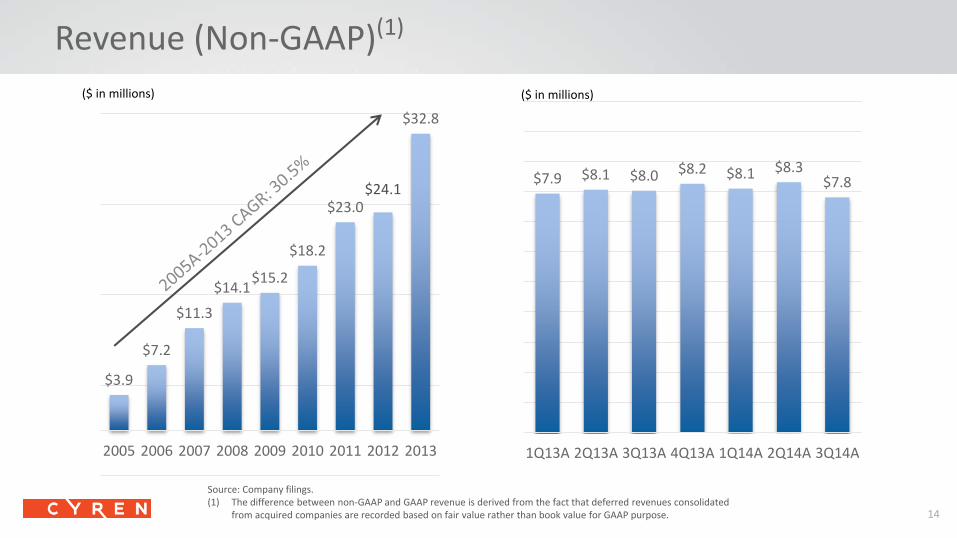
Revenue (Non-GAAP)(1)
Source: Company filings.(1) The difference between non-GAAP and GAAP revenue is derived from the fact that deferred revenues consolidated
from acquired companies are recorded based on fair value rather than book value for GAAP purpose.
$7.9 $8.1 $8.0 $8.2 $8.1 $8.3$7.8
1Q13A 2Q13A 3Q13A 4Q13A 1Q14A 2Q14A 3Q14A
$3.9
$7.2
$11.3
$14.1$15.2
$18.2
$23.0$24.1
$32.8
2005 2006 2007 2008 2009 2010 2011 2012 2013
($ in millions)($ in millions)
15
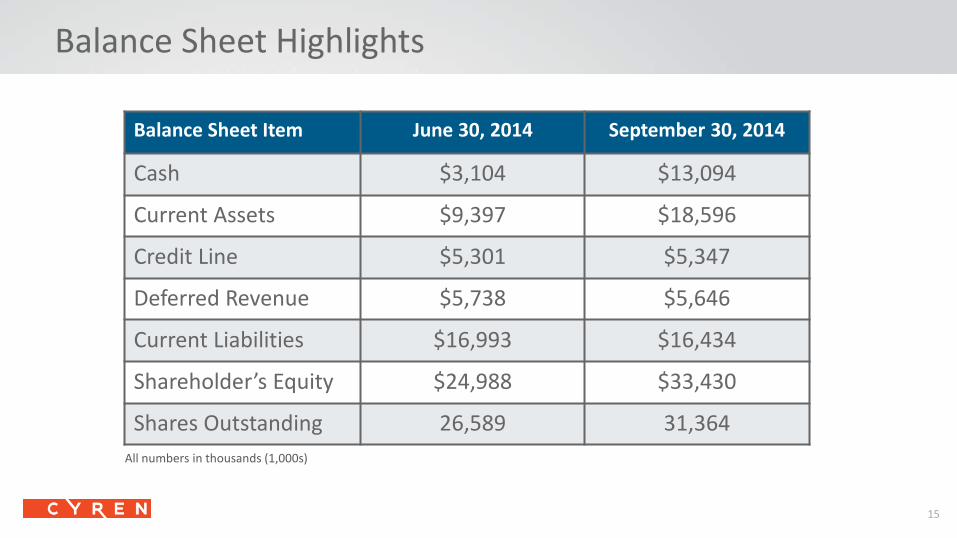
Balance Sheet Highlights
Balance Sheet Item June 30, 2014 September 30, 2014
Cash $3,104 $13,094
Current Assets $9,397 $18,596
Credit Line $5,301 $5,347
Deferred Revenue $5,738 $5,646
Current Liabilities $16,993 $16,434
Shareholder’s Equity $24,988 $33,430
Shares Outstanding 26,589 31,364
All numbers in thousands (1,000s)
16
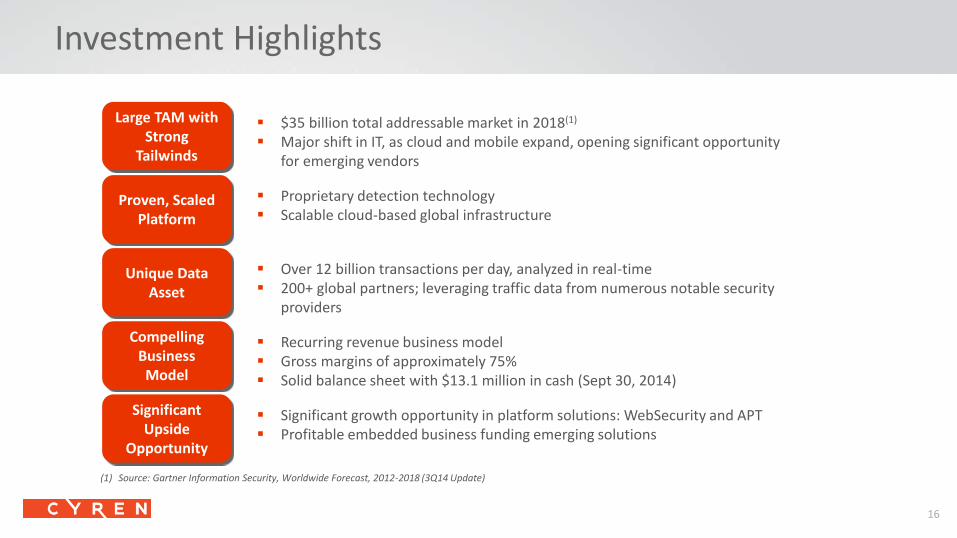
Investment Highlights
Large TAM with Strong
Tailwinds
Unique Data Asset
Compelling Business Model
Proven, Scaled Platform
Significant Upside
Opportunity
$35 billion total addressable market in 2018(1)
Major shift in IT, as cloud and mobile expand, opening significant opportunity for emerging vendors
Proprietary detection technology Scalable cloud-based global infrastructure
Over 12 billion transactions per day, analyzed in real-time 200+ global partners; leveraging traffic data from numerous notable security
providers
Recurring revenue business model Gross margins of approximately 75% Solid balance sheet with $13.1 million in cash (Sept 30, 2014)
Significant growth opportunity in platform solutions: WebSecurity and APT Profitable embedded business funding emerging solutions
(1) Source: Gartner Information Security, Worldwide Forecast, 2012-2018 (3Q14 Update)
17©2015. CYREN Ltd. All Rights Reserved. Proprietary and Confidential. This document and the contents therein are the sole property of CYREN and may not be transmitted or reproduced without CYREN’s express written permission.
Thank you.www.cyren.com