Embed Size (px)
Citation preview
Corporate OverviewThird Quarter 2016
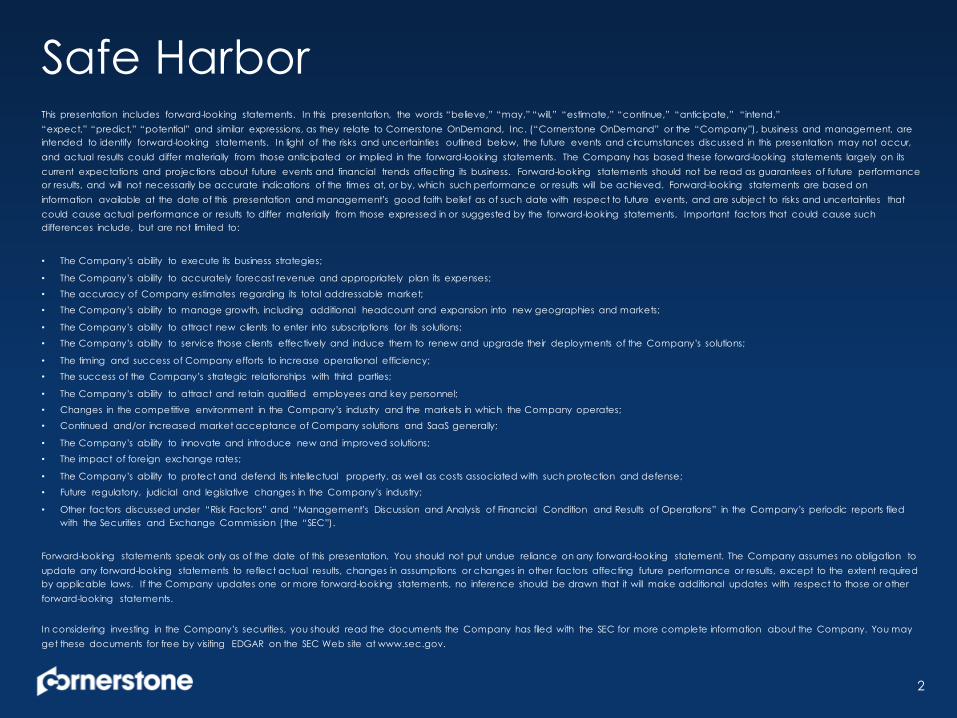
Safe HarborThis presentation includes forward-looking statements. In this presentation, the words “believe,” “may,” “will,” “estimate,” “continue,” “anticipate,” “intend,” “expect,” “predict,” “potential” and similar expressions, as they relate to Cornerstone OnDemand, Inc. (“Cornerstone OnDemand” or the “Company”), business and management, are intended to identify forward-looking statements. In light of the risks and uncertainties outlined below, the future events and circumstances discussed in this presentation may not occur, and actual results could differ materially from those anticipated or implied in the forward-looking statements. The Company has based these forward-looking statements largely on its current expectations and projections about future events and financial trends affecting its business. Forward-looking statements should not be read as guarantees of future performance or results, and will not necessarily be accurate indications of the times at, or by, which such performance or results will be achieved. Forward-looking statements are based on information available at the date of this presentation and management’s good faith belief as of such date with respect to future events, and are subject to risks and uncertainties that could cause actual performance or results to differ materially from those expressed in or suggested by the forward-looking statements. Important factors that could cause such differences include, but are not limited to:
• The Company’s ability to execute its business strategies;
• The Company’s ability to accurately forecast revenue and appropriately plan its expenses;
• The accuracy of Company estimates regarding its total addressable market;
• The Company’s ability to manage growth, including additional headcount and expansion into new geographies and markets;
• The Company’s ability to attract new clients to enter into subscriptions for its solutions;
• The Company’s ability to service those clients effectively and induce them to renew and upgrade their deployments of the Company’s solutions;
• The timing and success of Company efforts to increase operational efficiency;
• The success of the Company’s strategic relationships with third parties;
• The Company’s ability to attract and retain qualified employees and key personnel;
• Changes in the competitive environment in the Company’s industry and the markets in which the Company operates;
• Continued and/or increased market acceptance of Company solutions and SaaS generally;
• The Company’s ability to innovate and introduce new and improved solutions;
• The impact of foreign exchange rates;
• The Company’s ability to protect and defend its intellectual property, as well as costs associated with such protection and defense;
• Future regulatory, judicial and legislative changes in the Company’s industry;
• Other factors discussed under “Risk Factors” and “Management’s Discussion and Analysis of Financial Condition and Results of Operations” in the Company’s periodic reports filed with the Securities and Exchange Commission (the “SEC”).
Forward-looking statements speak only as of the date of this presentation. You should not put undue reliance on any forward-looking statement. The Company assumes no obligation to update any forward-looking statements to reflect actual results, changes in assumptions or changes in other factors affecting future performance or results, except to the extent required by applicable laws. If the Company updates one or more forward-looking statements, no inference should be drawn that it will make additional updates with respect to those or other forward-looking statements.
In considering investing in the Company’s securities, you should read the documents the Company has filed with the SEC for more complete information about the Company. You may get these documents for free by visiting EDGAR on the SEC Web site at www.sec.gov.
2
Cornerstone Today
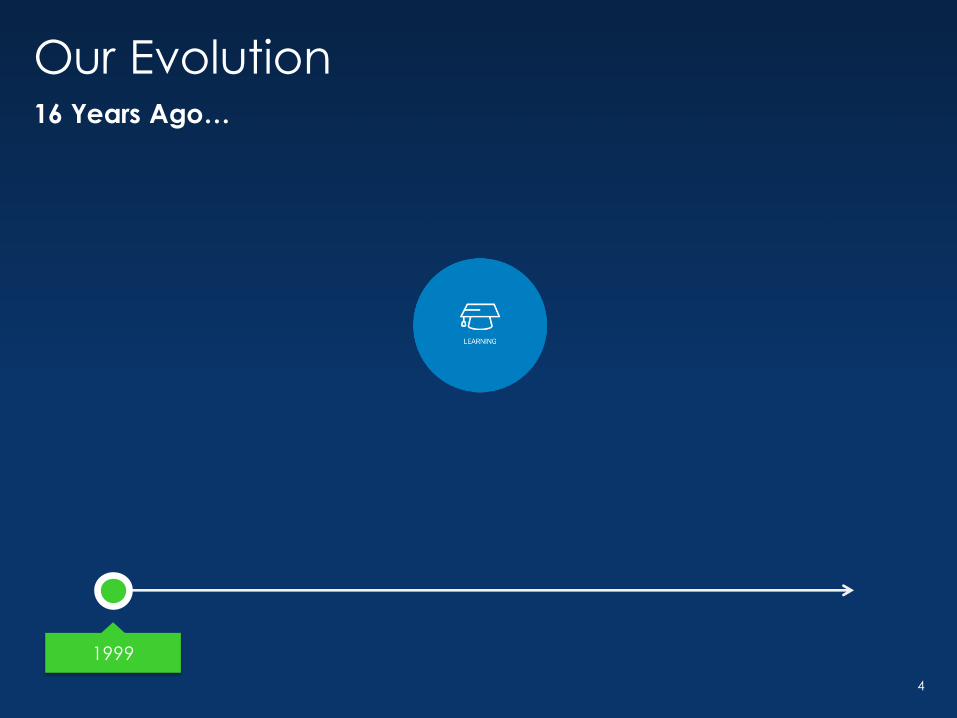
1999
Our Evolution16 Years Ago…
4
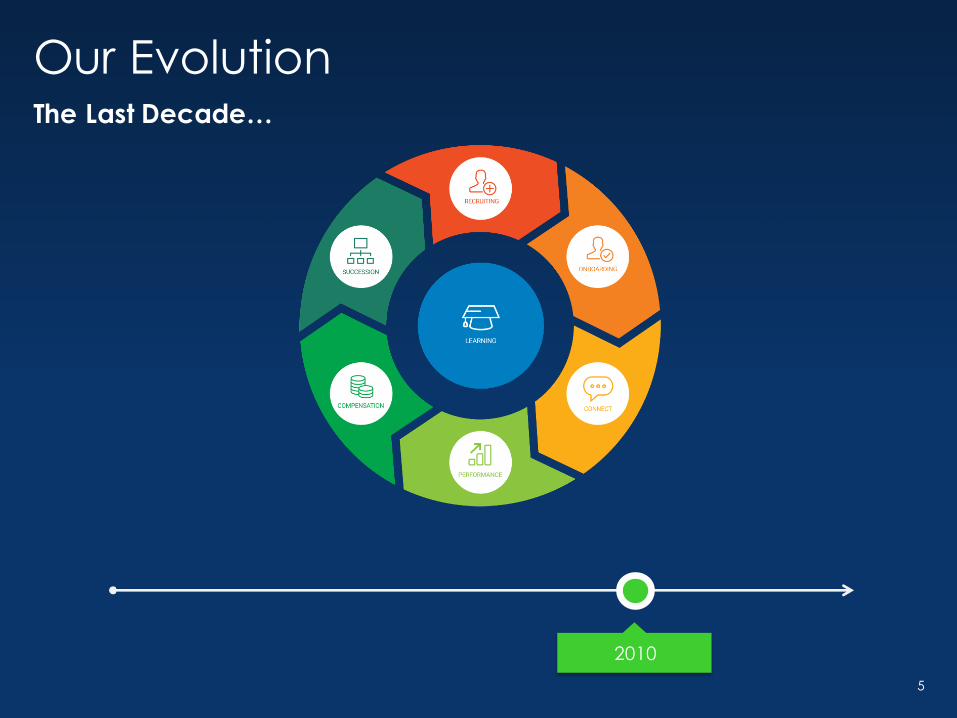
2010
Our EvolutionThe Last Decade…
5
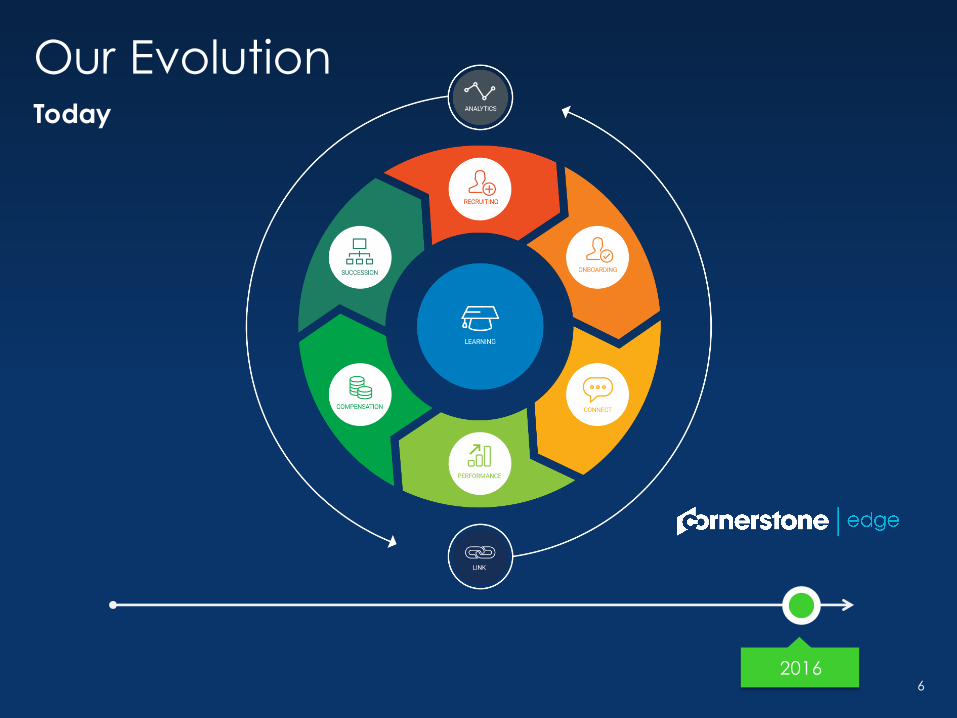
2016
Our EvolutionToday
6
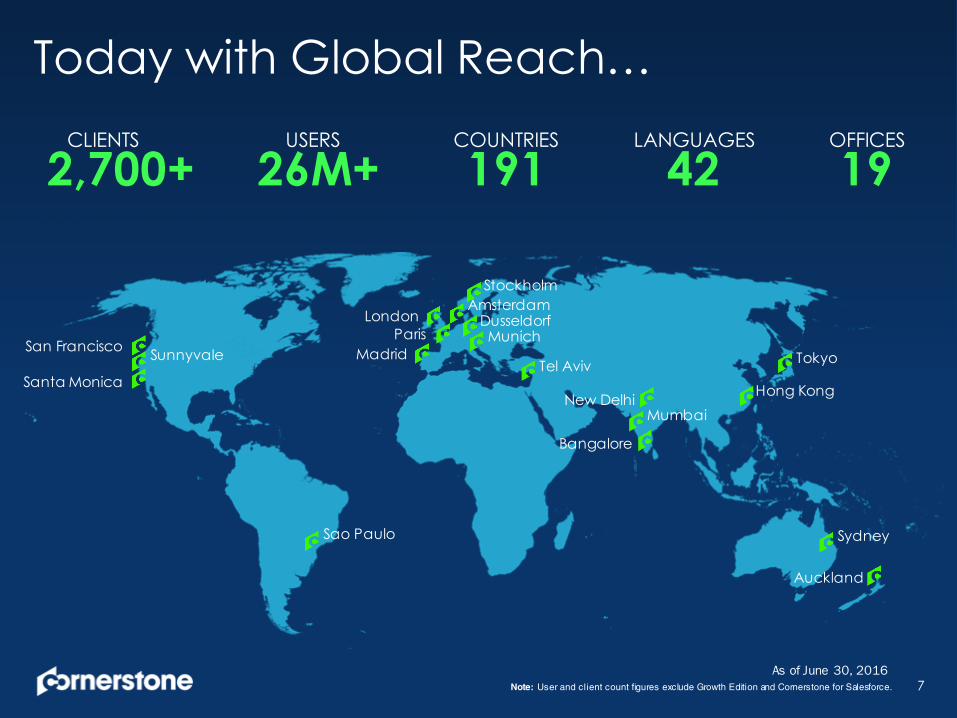
7Note: User and client count figures exclude Growth Edition and Cornerstone for Salesforce.
CLIENTS
2,700+USERS
26M+COUNTRIES
191LANGUAGES
42OFFICES
19
San Francisco
Santa Monica
Sunnyvale
Sao Paulo
MadridParis
LondonAmsterdam
Stockholm
DusseldorfMunich
Tel Aviv
Bangalore
MumbaiHong Kong
Tokyo
Sydney
Auckland
Today with Global Reach…
As of June 30, 2016
New Delhi
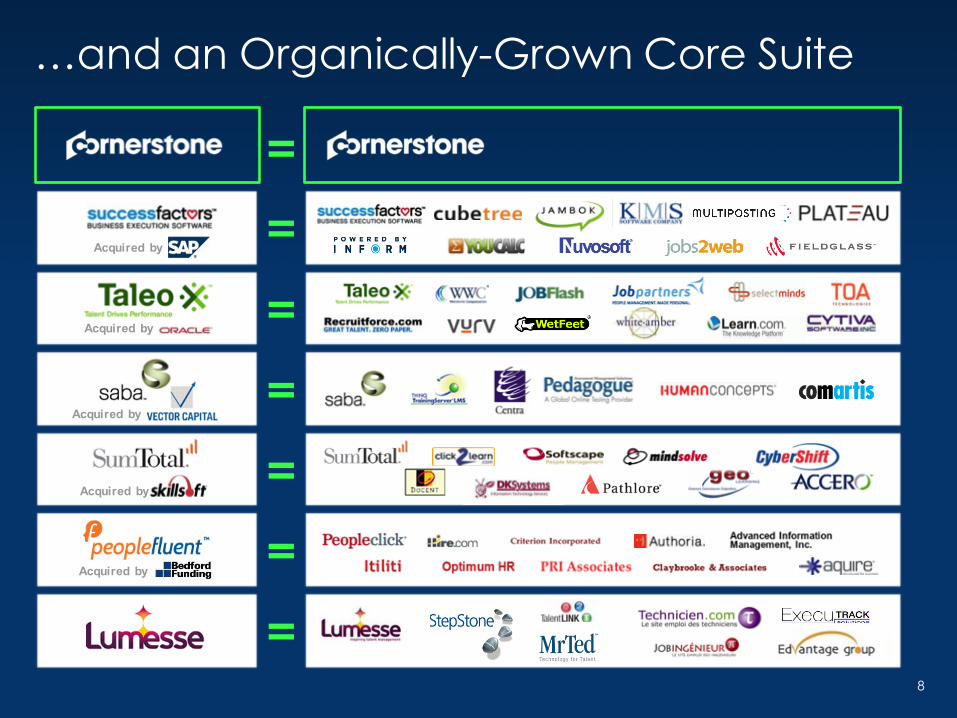
Acquired by
Acquired by
Acquired by
Acquired by
Acquired by
8
…and an Organically-Grown Core Suite
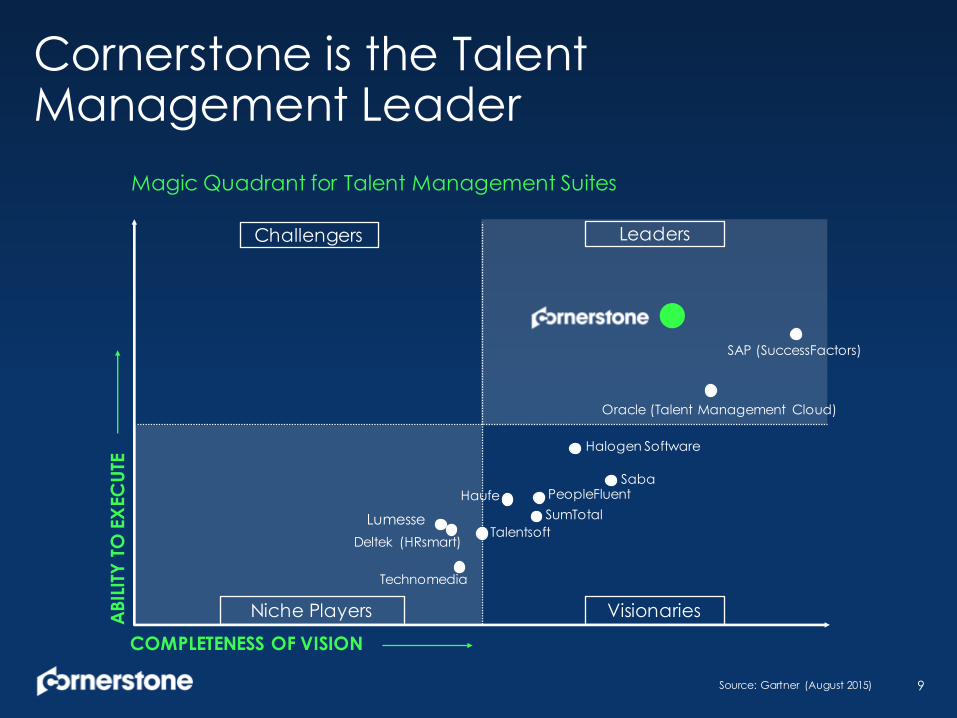
Cornerstone is the Talent Management Leader
9
Niche Players Visionaries
Challengers Leaders
Magic Quadrant for Talent Management Suites
Lumesse
COMPLETENESS OF VISION
ABI
LITY
TO E
XEC
UTE
Source: Gartner (August 2015)
Deltek (HRsmart)
Technomedia
Haufe PeopleFluentSumTotal
Halogen Software
Saba
Oracle (Talent Management Cloud)
SAP (SuccessFactors)
Talentsoft
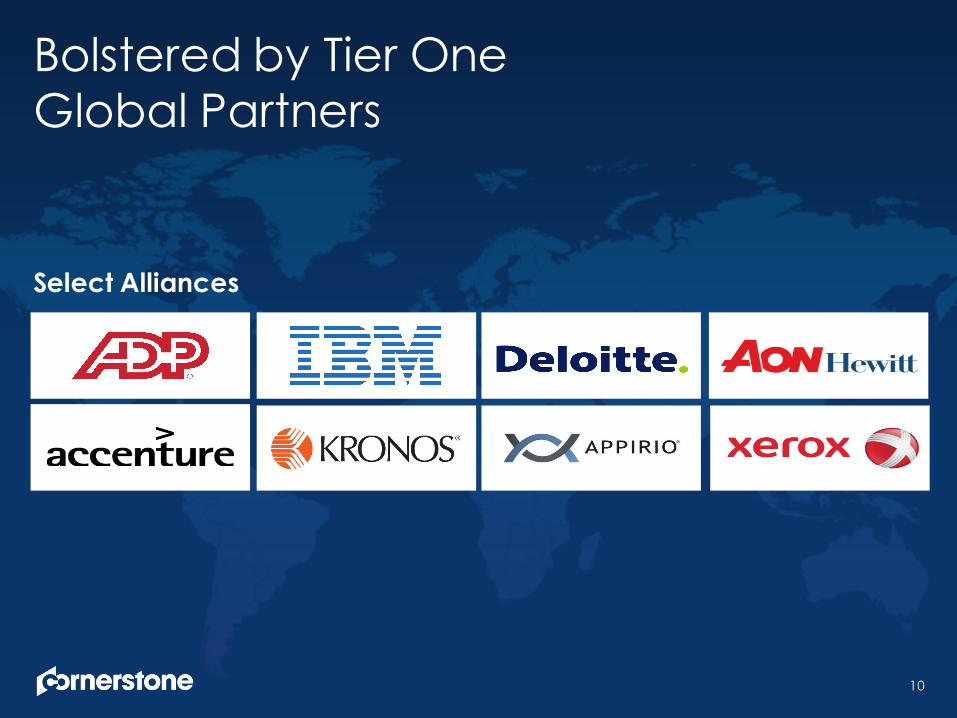
Bolstered by Tier One Global Partners
10
Select Alliances
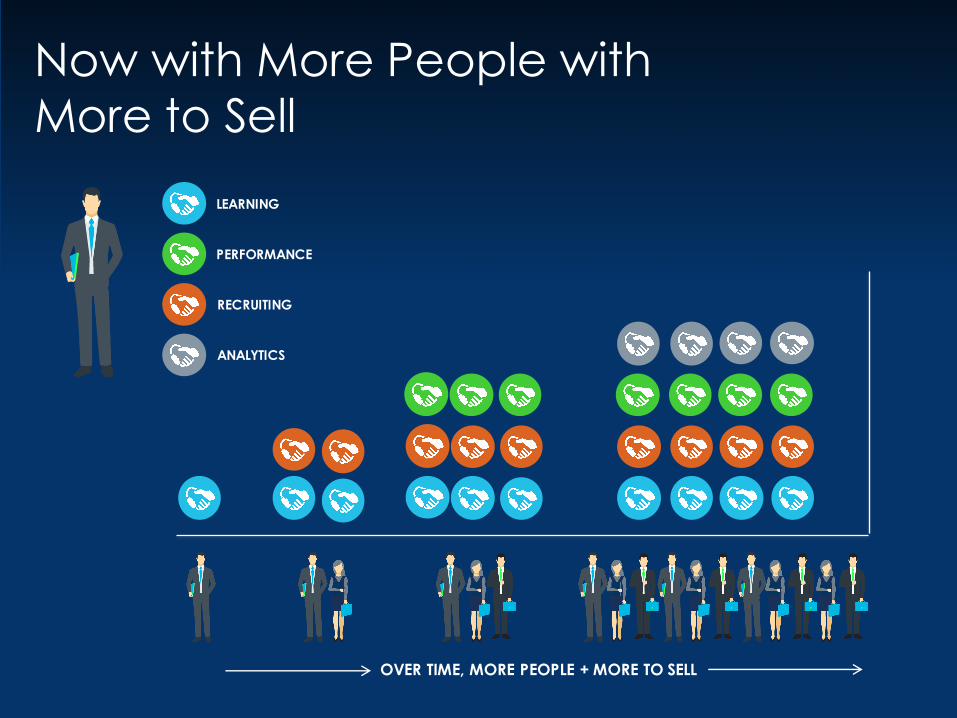
OVER TIME, MORE PEOPLE + MORE TO SELL
LEARNING
PERFORMANCE
RECRUITING
ANALYTICS
Now with More People with More to Sell
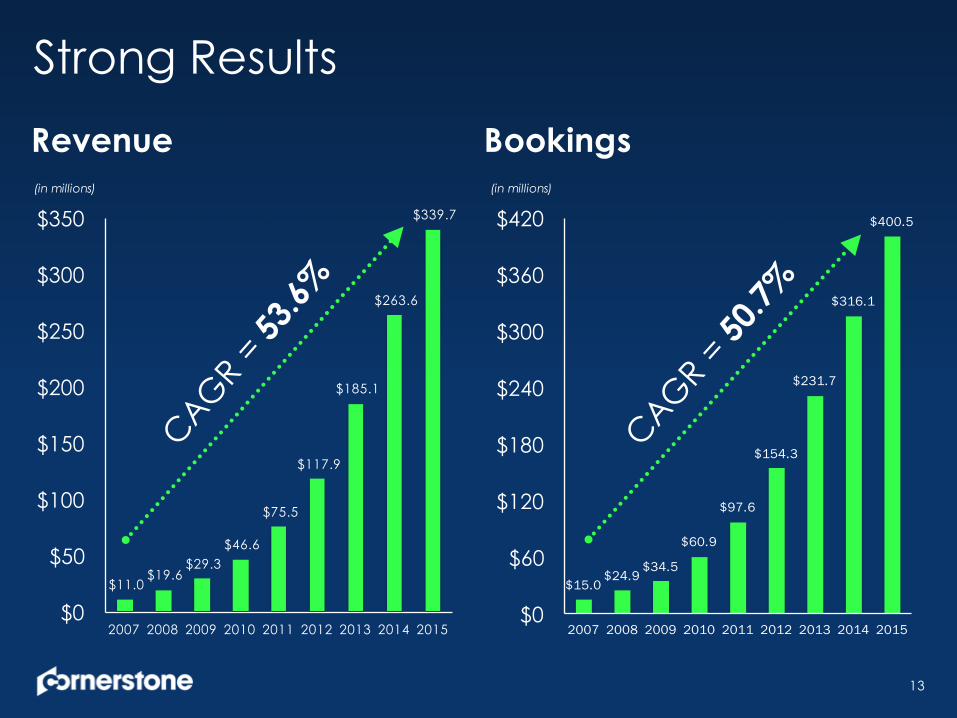
Strong Results
13
$11.0 $19.6
$29.3 $46.6
$75.5
$117.9
$185.1
$263.6
$339.7
$0
$50
$100
$150
$200
$250
$300
$350
2007 2008 2009 2010 2011 2012 2013 2014 2015
$15.0 $24.9
$34.5
$60.9
$97.6
$154.3
$231.7
$316.1
$400.5
$0
$60
$120
$180
$240
$300
$360
$420
2007 2008 2009 2010 2011 2012 2013 2014 2015
(in millions) (in millions)
Revenue Bookings
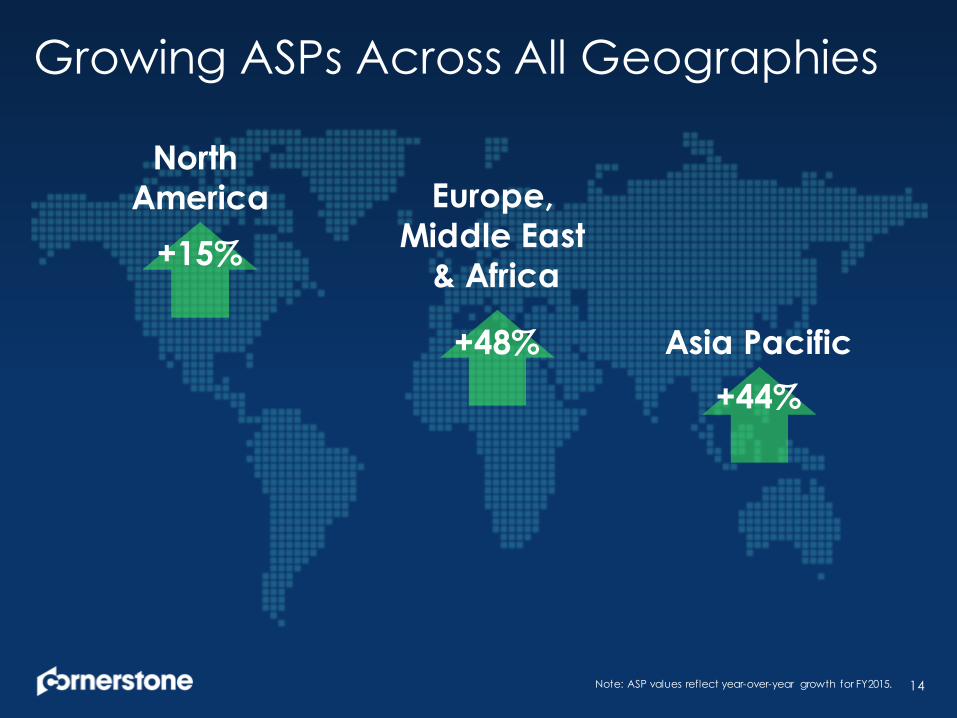
Growing ASPs Across All Geographies
14
+48%
+15%
+44%
North America Europe,
Middle East & Africa
Asia Pacific
Note: ASP values reflect year-over-year growth for FY2015.
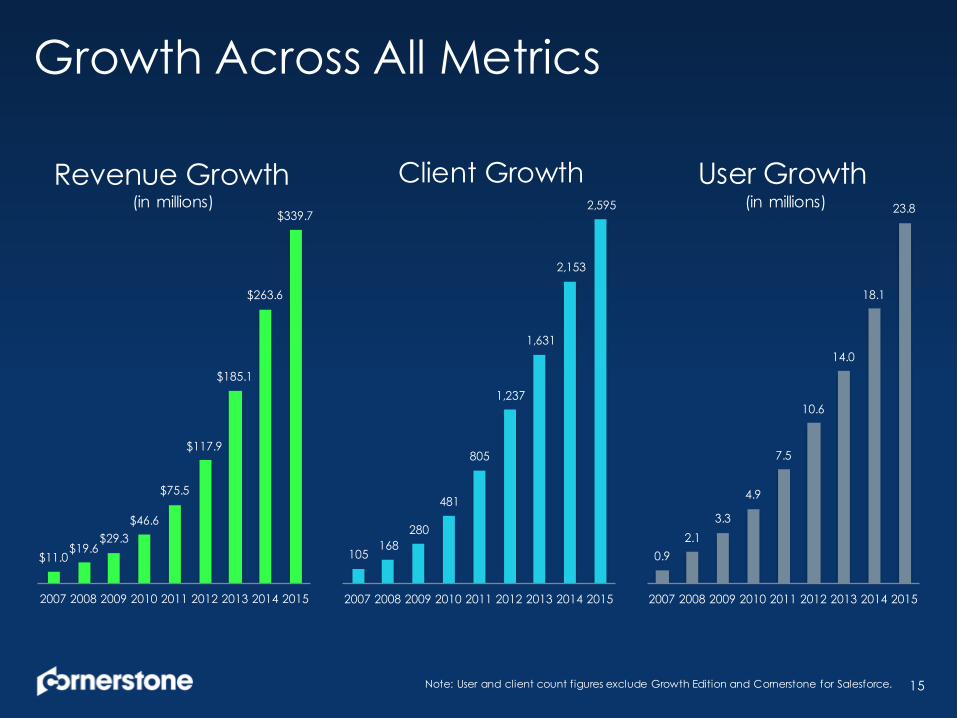
Growth Across All Metrics
15
$11.0$19.6
$29.3$46.6
$75.5
$117.9
$185.1
$263.6
$339.7
2007 2008 2009 2010 2011 2012 2013 2014 2015
Revenue Growth
105 168
280
481
805
1,237
1,631
2,153
2,595
2007 2008 2009 2010 2011 2012 2013 2014 2015
Client Growth
0.92.1
3.3
4.9
7.5
10.6
14.0
18.1
23.8
2007 2008 2009 2010 2011 2012 2013 2014 2015
User Growth(in millions) (in millions)
Note: User and client count figures exclude Growth Edition and Cornerstone for Salesforce.
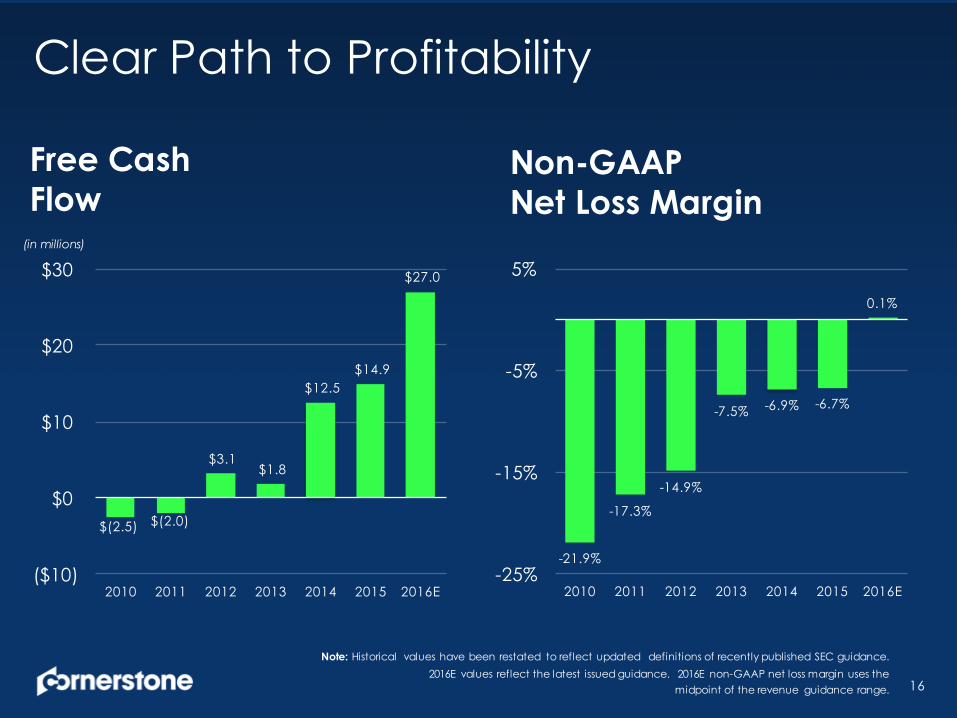
Clear Path to Profitability
16
$(2.5) $(2.0)
$3.1 $1.8
$12.5 $14.9
$27.0
($10)
$0
$10
$20
$30
2010 2011 2012 2013 2014 2015 2016E
(in millions)
-21.9%
-17.3%
-14.9%
-7.5% -6.9% -6.7%
0.1%
-25%
-15%
-5%
5%
2010 2011 2012 2013 2014 2015 2016E
Free Cash Flow
Non-GAAP Net Loss Margin
Note: Historical values have been restated to reflect updated definitions of recently published SEC guidance. 2016E values reflect the latest issued guidance. 2016E non-GAAP net loss margin uses the
midpoint of the revenue guidance range.
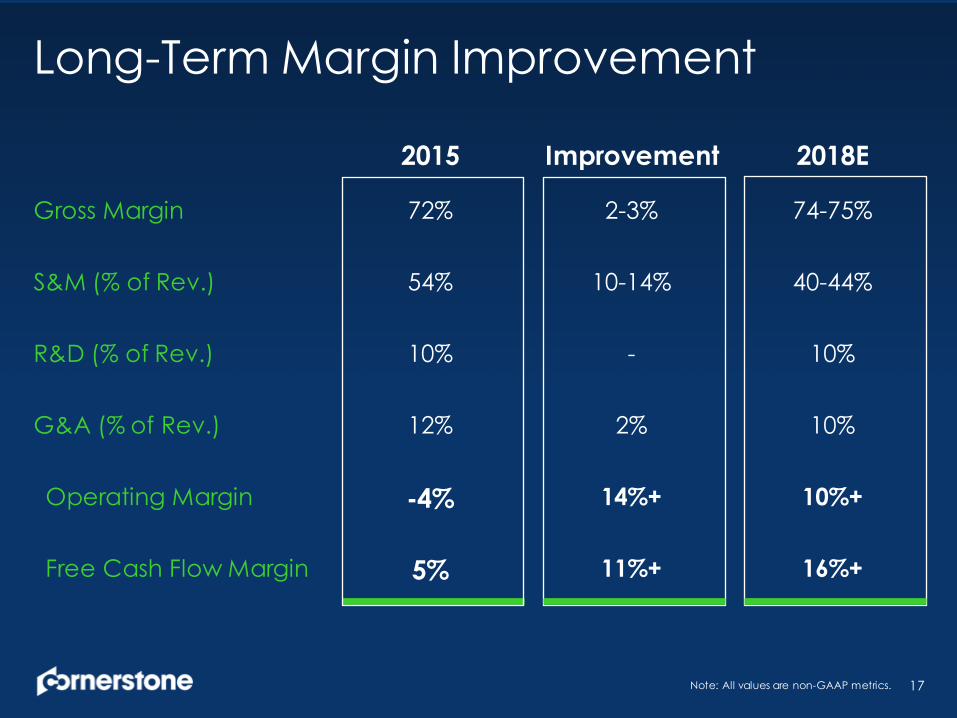
Long-Term Margin Improvement
17
2015 Improvement 2018E
Gross Margin 72% 2-3% 74-75%
S&M (% of Rev.) 54% 10-14% 40-44%
R&D (% of Rev.) 10% - 10%
G&A (% of Rev.) 12% 2% 10%
Operating Margin -4% 14%+ 10%+
Free Cash Flow Margin 5% 11%+ 16%+
Note: All values are non-GAAP metrics.
Our OpportunityMarching to $1 Billion
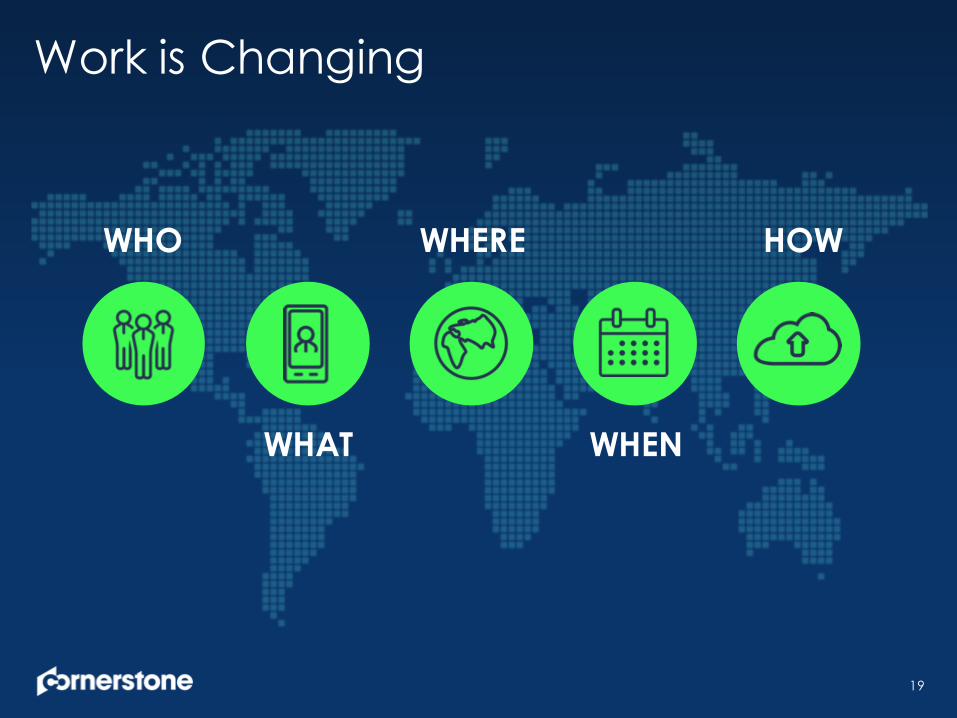
Work is Changing
19
WHO
WHAT
WHERE
WHEN
HOW
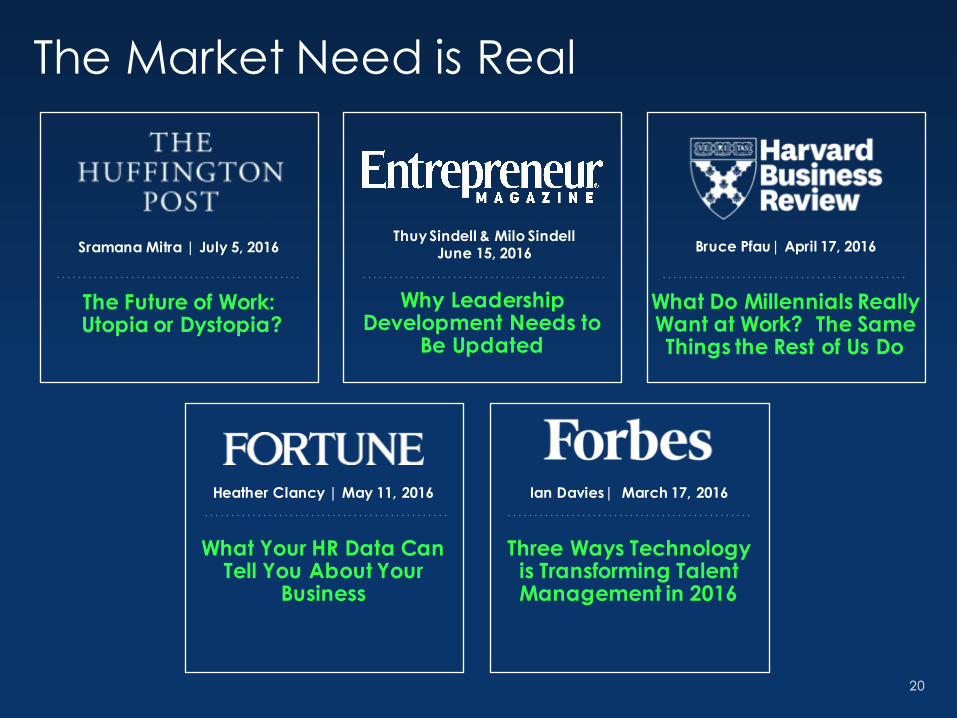
The Market Need is Real
20
Thuy Sindell & Milo Sindell June 15, 2016
Why Leadership Development Needs to
Be Updated
Bruce Pfau| April 17, 2016
What Do Millennials Really Want at Work? The Same Things the Rest of Us Do
Heather Clancy | May 11, 2016
What Your HR Data Can Tell You About Your
Business
Ian Davies| March 17, 2016
Three Ways Technology is Transforming Talent Management in 2016
Sramana Mitra | July 5, 2016
The Future of Work:Utopia or Dystopia?
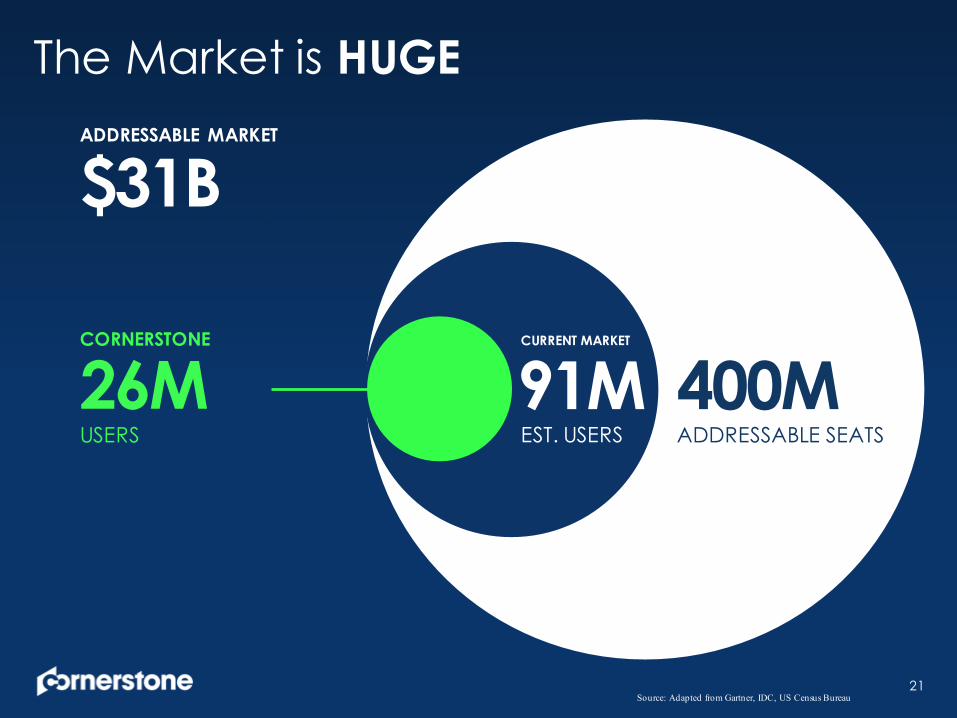
The Market is HUGE
21
26MUSERS
ADDRESSABLE MARKET
$31B
91MEST. USERS
CURRENT MARKET
400MADDRESSABLE SEATS
CORNERSTONE
Source: Adapted from Gartner, IDC, US Census Bureau
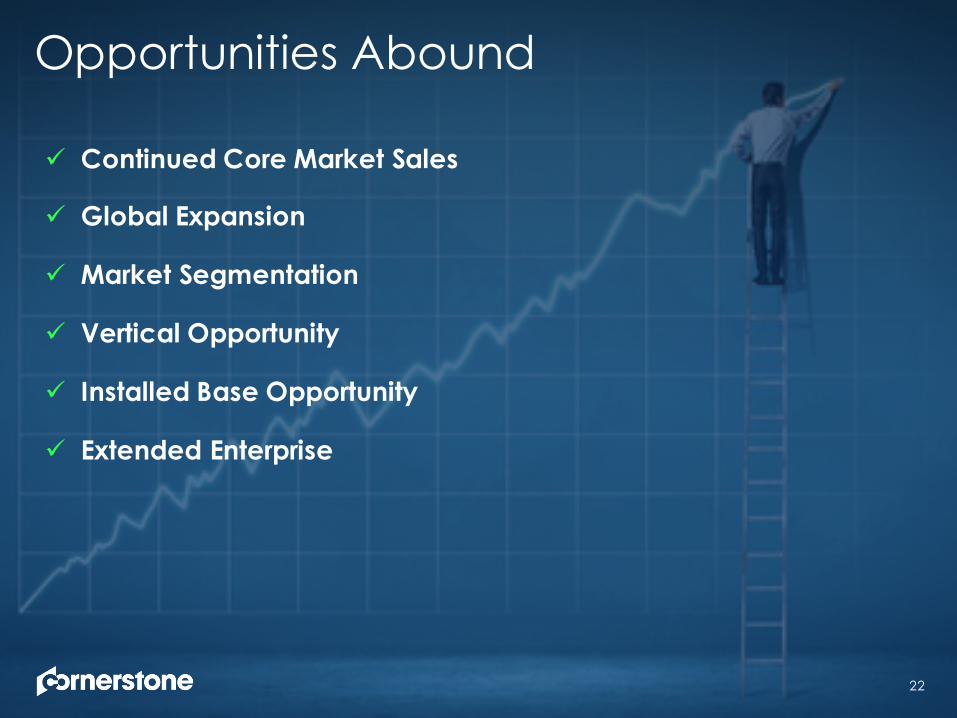
Opportunities Abound
ü Continued Core Market Sales
ü Global Expansion
ü Market Segmentation
ü Vertical Opportunity
ü Installed Base Opportunity
ü Extended Enterprise
22
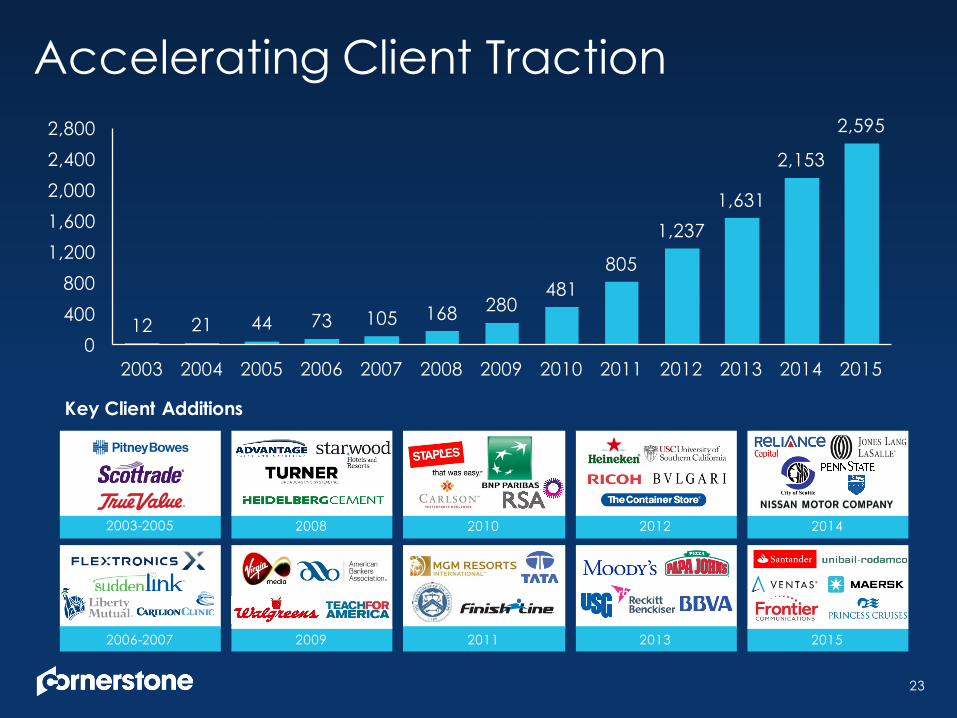
Accelerating Client Traction
23
2003-2005 2010 2012 20142008
2009 2011 2013 20152006-2007
Key Client Additions
12 21 44 73 105 168 280481
805
1,2371,631
2,153
2,595
0400800
1,2001,6002,0002,4002,800
2003 2004 2005 2006 2007 2008 2009 2010 2011 2012 2013 2014 2015
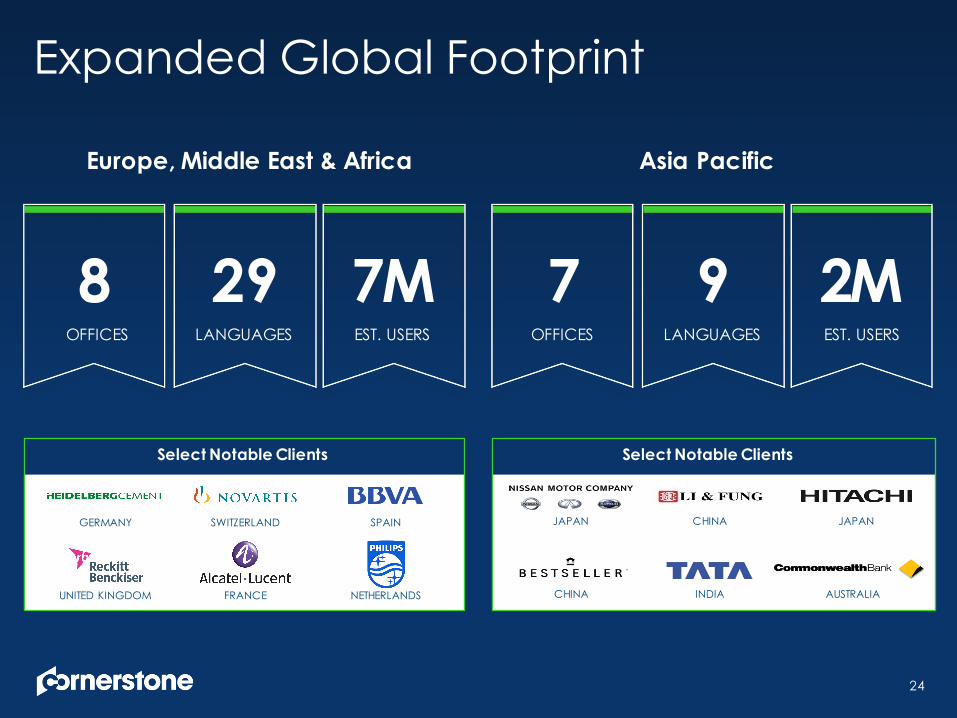
Expanded Global Footprint
24
Europe, Middle East & Africa
Select Notable Clients Select Notable Clients
JAPAN CHINA
AUSTRALIA
JAPAN
INDIACHINA
Asia Pacific
SWITZERLAND SPAIN
NETHERLANDSFRANCEUNITED KINGDOM
GERMANY
8 29OFFICES LANGUAGES EST. USERS
7 9 2MOFFICES LANGUAGES EST. USERS
7M
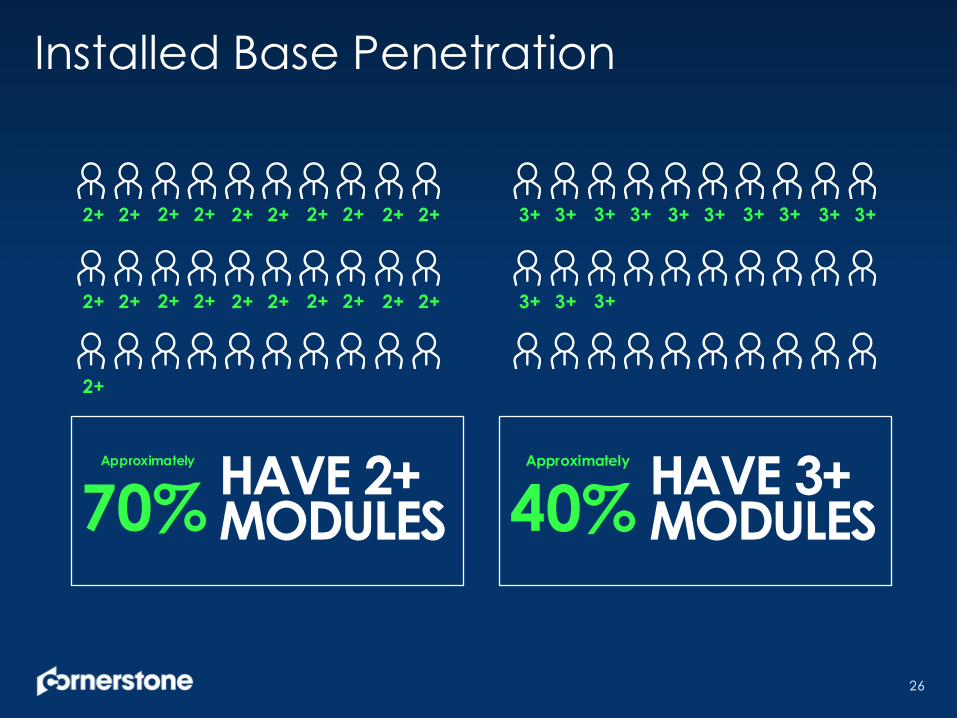
HAVE 2+ MODULES
Approximately
70%
Installed Base Penetration
2+ 2+ 2+ 2+ 2+ 2+ 2+ 2+ 2+ 2+
2+ 2+ 2+ 2+ 2+ 2+ 2+ 2+ 2+ 2+
3+ 3+ 3+ 3+ 3+ 3+ 3+ 3+ 3+ 3+
3+ 3+ 3+
HAVE 3+ MODULES
26
2+
Approximately
40%
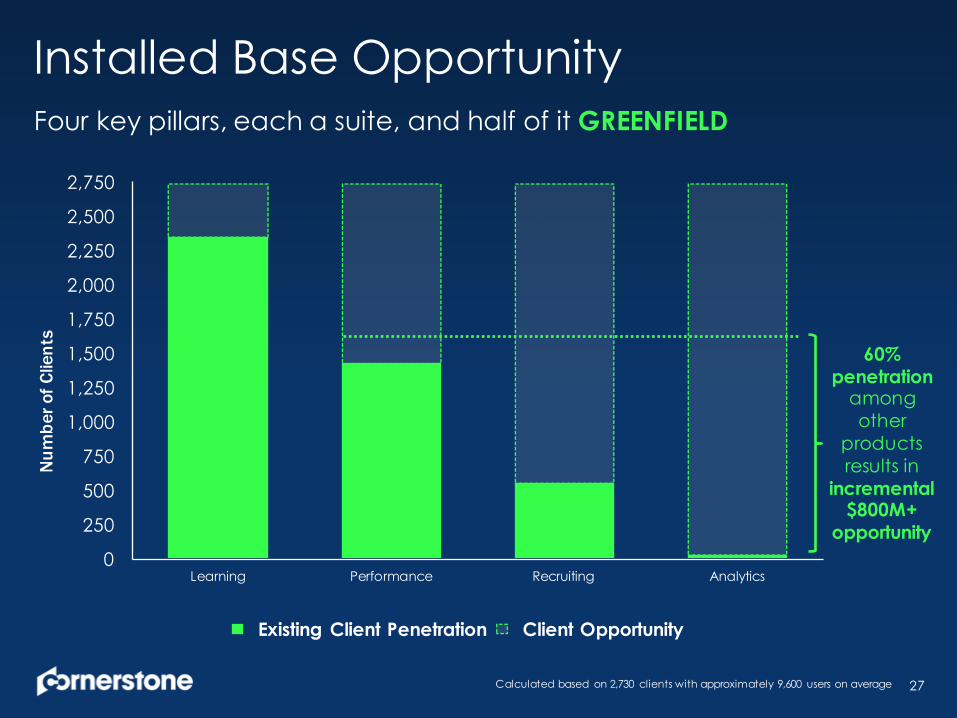
Installed Base Opportunity
27
0
250
500
750
1,000
1,250
1,500
1,750
2,000
2,250
2,500
2,750
Learning Performance Recruiting Analytics
Existing Client Penetration Client Opportunity
Num
ber o
f Clie
nts
Four key pillars, each a suite, and half of it GREENFIELD
Calculated based on 2,730 clients with approximately 9,600 users on average
60% penetration
among other
products results in
incremental $800M+
opportunity
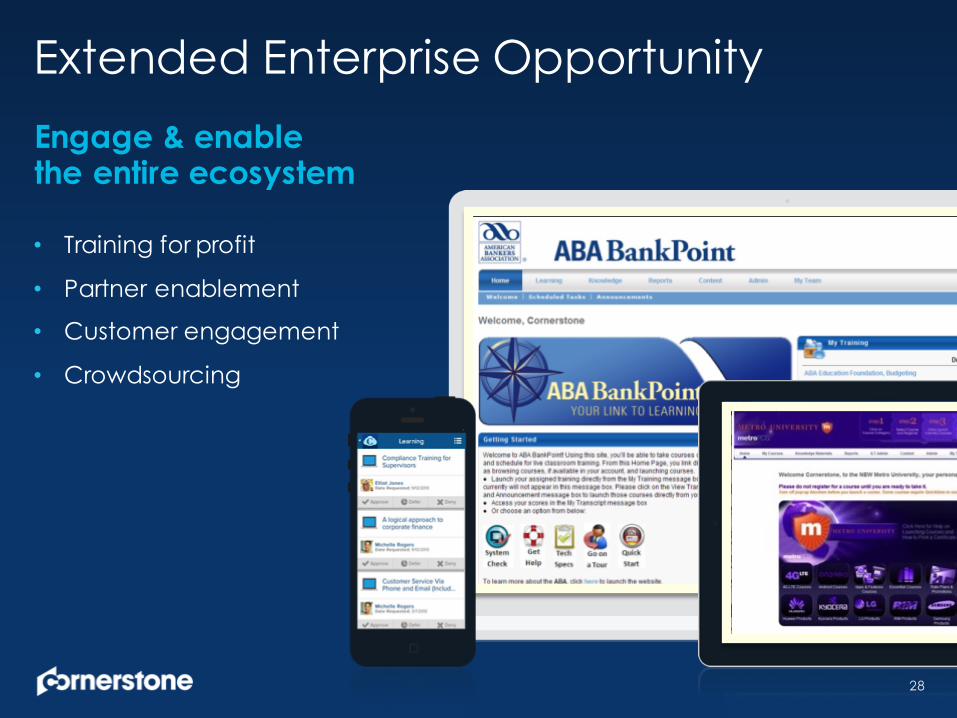
Extended Enterprise Opportunity
28
Engage & enable the entire ecosystem
• Training for profit
• Partner enablement
• Customer engagement
• Crowdsourcing
The FutureBeyond 2016
30
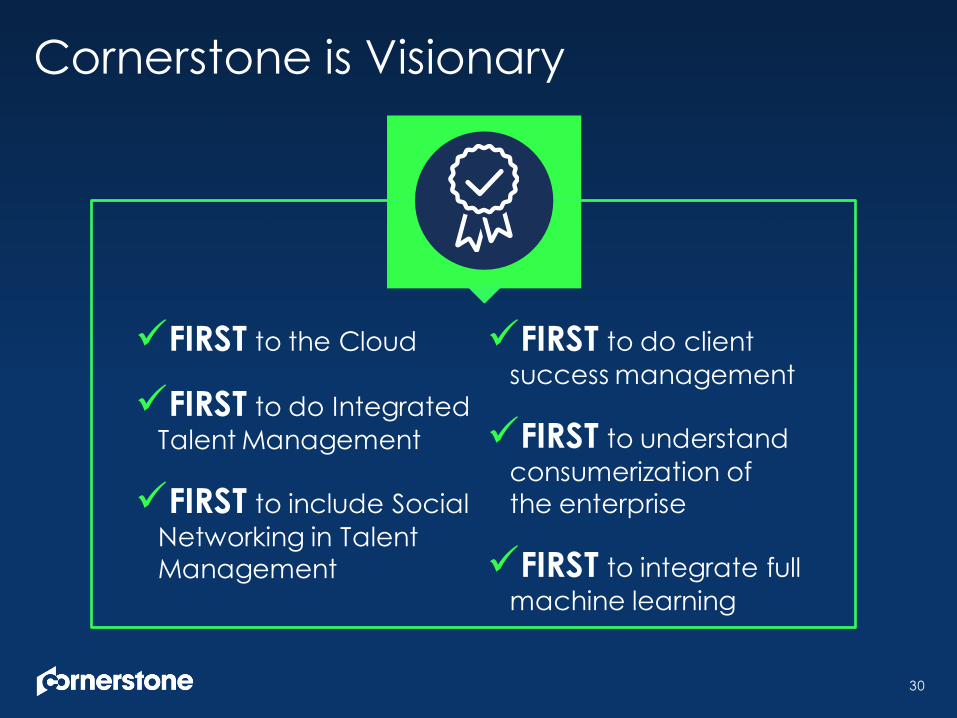
üFIRST to the Cloud
üFIRST to do Integrated Talent Management
üFIRST to include SocialNetworking in TalentManagement
üFIRST to do client success management
üFIRST to understand consumerization of the enterprise
üFIRST to integrate full machine learning
Cornerstone is Visionary
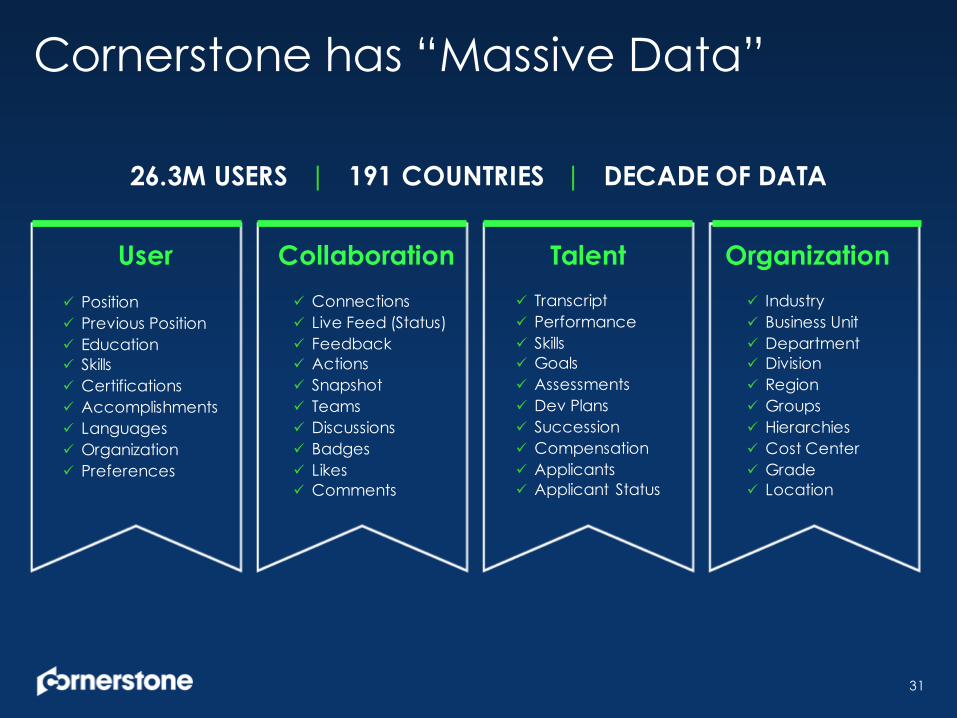
Cornerstone has “Massive Data”
31
Userü Positionü Previous Positionü Educationü Skillsü Certificationsü Accomplishmentsü Languagesü Organizationü Preferences
Collaborationü Connectionsü Live Feed (Status)ü Feedbackü Actionsü Snapshotü Teamsü Discussionsü Badgesü Likesü Comments
Talent Organizationü Transcriptü Performanceü Skills ü Goalsü Assessmentsü Dev Plansü Successionü Compensationü Applicantsü Applicant Status
ü Industryü Business Unitü Departmentü Divisionü Regionü Groupsü Hierarchiesü Cost Centerü Gradeü Location
26.3M USERS | 191 COUNTRIES | DECADE OF DATA
32
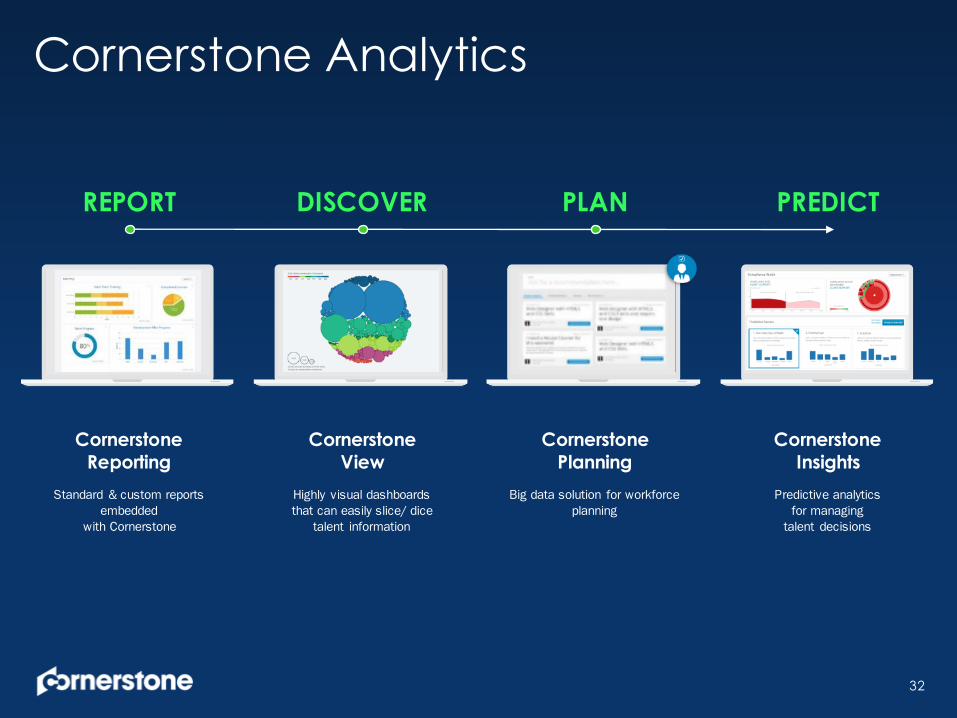
REPORT
Cornerstone Reporting
Standard & custom reports embedded
with Cornerstone
DISCOVER
Cornerstone View
Highly visual dashboards that can easily slice/ dice
talent information
PLAN
Cornerstone Planning
Big data solution for workforce planning
PREDICT
Cornerstone Insights
Predictive analytics for managing
talent decisions
Cornerstone Analytics
32
33
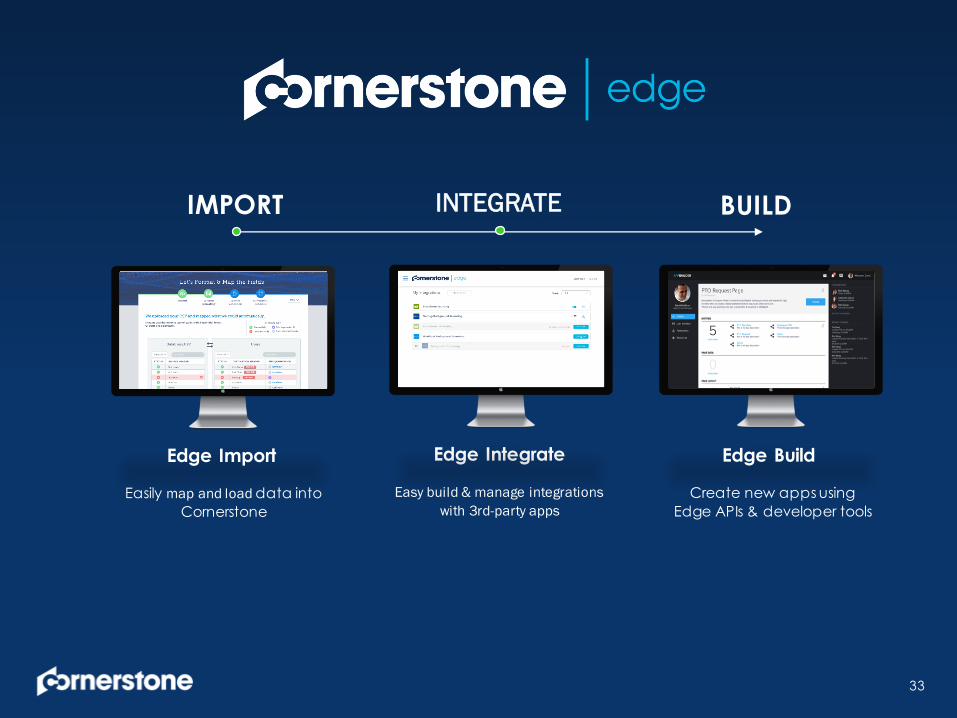
IMPORT INTEGRATE
Edge Import
Easily map and load data into Cornerstone
Edge Integrate
Easy build & manage integrations with 3rd-party apps
BUILD
Edge Build
Create new apps using Edge APIs & developer tools
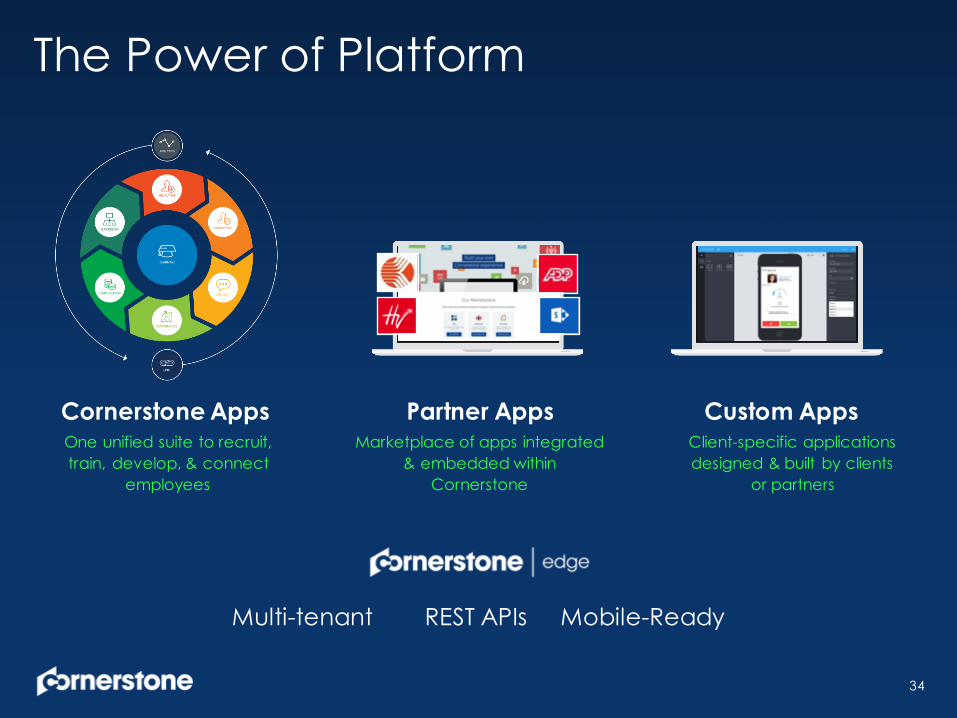
The Power of Platform
34
Multi-tenant REST APIs Mobile-Ready
Cornerstone Apps Partner Apps Custom AppsOne unified suite to recruit, train, develop, & connect
employees
Marketplace of apps integrated & embedded within
Cornerstone
Client-specific applications designed & built by clients
or partners
Thank You!