Embed Size (px)
Citation preview
Company OverviewFebruary 2017

FORWARD-LOOKING STATEMENTS
This presentation contains forward-looking statements within the meaning of Section 27A of the Securities Act of 1933 and Section 21E of the Securities Exchange Act of 1934. All statements, other than statements of historical facts, included in this presentation that address activities, events or developments that Antero Resources Corporation and its subsidiaries (collectively, the “Company” or “Antero”) expects, believes or anticipates will or may occur in the future are forward-looking statements. The words “believe,” “expect,” “anticipate,” “plan,” “intend,” “estimate,” “project,” “foresee,” “should,” “would,” “could,” or other similar expressions are intended to identify forward-looking statements. However, the absence of these words does not mean that the statements are not forward-looking. Without limiting the generality of the foregoing, forward-looking statements contained in this presentation specifically include estimates of the Company’s reserves, expectations of plans, strategies, objectives and anticipated financial and operating results of the Company, including as to the Company’s drilling program, production, hedging activities, capital expenditure levels and other guidance included in this presentation. These statements are based on certain assumptions made by the Company based on management’s experience and perception of historical trends, current conditions, anticipated future developments and other factors believed to be appropriate. Such statements are subject to a number of assumptions, risks and uncertainties, many of which are beyond the control of the Company, which may cause actual results to differ materially from those implied or expressed by the forward-looking statements. These include the factors discussed or referenced under the heading “Item 1A. Risk Factors” in our Annual Report on Form 10-K for the year ended December 31, 2015 and in the Company’s subsequent filings with the SEC.
The Company cautions you that these forward-looking statements are subject to all of the risks and uncertainties, most of which are difficult to predict and many of which are beyond our control, incident to the exploration for and development, production, gathering and sale of natural gas and oil. These risks include, but are not limited to, commodity price volatility, inflation, lack of availability of drilling and production equipment and services, environmental risks, drilling and other operating risks, regulatory changes, the uncertainty inherent in estimating natural gas and oil reserves and in projecting future rates of production, cash flow and access to capital, the timing of development expenditures, and the other risks described under the heading “Risk Factors” in our Annual Report on Form 10-K for the year ended December 31, 2015 and in the Company’s subsequent filings with the SEC.
Any forward-looking statement speaks only as of the date on which such statement is made and the Company undertakes no obligation to correct or update any forward-looking statement, whether as a result of new information, future events or otherwise, except as required by applicable law.
1
Antero Resources Corporation is denoted as “AR” and Antero Midstream Partners LP is denoted as “AM” in the presentation, which are their respective New York Stock Exchange ticker symbols.

ANTERO PROFILE
2
Market Cap………………....
Enterprise Value(1)(2)…......…
LTM EBITDAX………......….
Net Debt/LTM EBITDAX(2)…
Net Production (3Q 2016)…
% Liquids..........................
3P Reserves(3)………..…....
% Natural Gas………......
Net Acres(4)………….…...…
1. Based on market cap as of 2/3/2017 plus net debt plus minority interest ($1.4 billion) on a consolidated basis. 2. Pro forma for $175 million AR PIPE transaction on 10/3/2016 and $170 million AR acreage divestiture that closed on 12/16/2016. 3. 3P reserves as of 12/31/2016, assuming ethane rejection. 4. Net acres as of 12/31/2016 pro forma for additional leasing and acquisitions.
$8.2 billion
$14.1 billion
$1.4 billion
3.2x
1,875 MMcfe/d
26%
46.4 Tcfe
71%
624,000
At IPO (October 2013)
1. Represents 2Q 2013 and 3Q 2016 net production, respectively. 2. Represents LTM EBITDAX as of 6/30/13 and 9/30/16, respectively.3. 3P reserves are as of 12/31/2016, assuming ethane rejection.
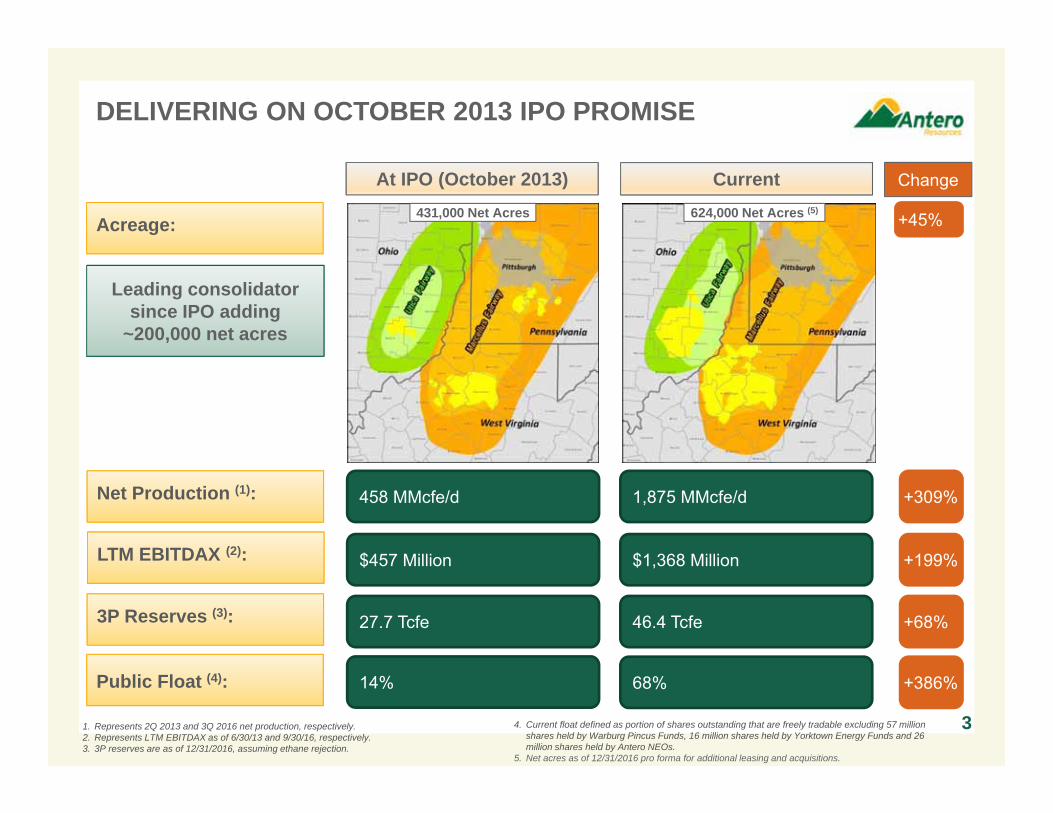
DELIVERING ON OCTOBER 2013 IPO PROMISE
3
Net Production (1): 458 MMcfe/d 1,875 MMcfe/d
Acreage:
27.7 Tcfe 46.4 Tcfe3P Reserves (3):
Current
$457 Million $1,368 MillionLTM EBITDAX (2):
14% 68%Public Float (4):
431,000 Net Acres
+309%
+199%
+68%
+386%
624,000 Net Acres (5)+45%
Leading consolidator since IPO adding
~200,000 net acres
4. Current float defined as portion of shares outstanding that are freely tradable excluding 57 million shares held by Warburg Pincus Funds, 16 million shares held by Yorktown Energy Funds and 26 million shares held by Antero NEOs.
5. Net acres as of 12/31/2016 pro forma for additional leasing and acquisitions.
Change
4
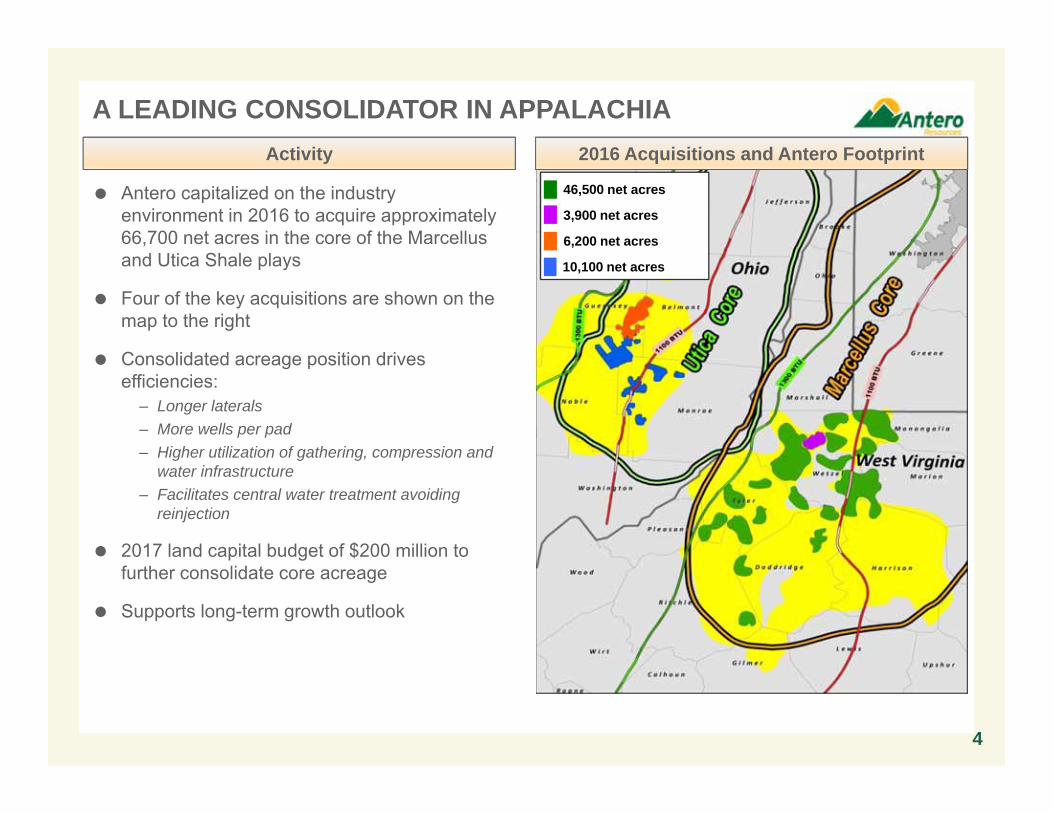
A LEADING CONSOLIDATOR IN APPALACHIA
46,500 net acres
3,900 net acres
6,200 net acres
10,100 net acres
Antero capitalized on the industry environment in 2016 to acquire approximately 66,700 net acres in the core of the Marcellus and Utica Shale plays
Four of the key acquisitions are shown on the map to the right
Consolidated acreage position drives efficiencies:
– Longer laterals– More wells per pad– Higher utilization of gathering, compression and
water infrastructure– Facilitates central water treatment avoiding
reinjection
2017 land capital budget of $200 million to further consolidate core acreage
Supports long-term growth outlook
2016 Acquisitions and Antero FootprintActivity
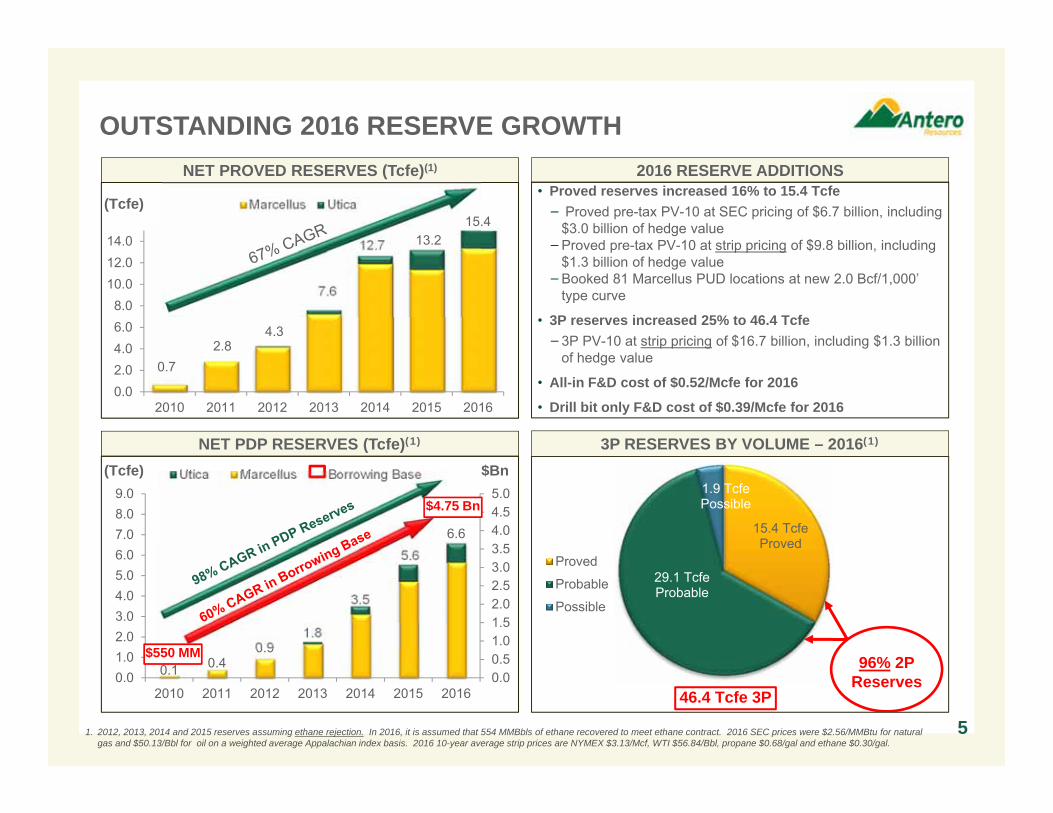
15.4 TcfeProved
29.1 TcfeProbable
1.9 TcfePossible
Proved
Probable
Possible
46.4 Tcfe 3P
96% 2P Reserves
0.1 0.40.9
1.8
3.5
0.00.51.01.52.02.53.03.54.04.55.0
0.01.02.03.04.05.06.07.08.09.0
2010 2011 2012 2013 2014 2015 2016
Utica Marcellus Borrowing Base
5.66.6
OUTSTANDING 2016 RESERVE GROWTH
1. 2012, 2013, 2014 and 2015 reserves assuming ethane rejection. In 2016, it is assumed that 554 MMBbls of ethane recovered to meet ethane contract. 2016 SEC prices were $2.56/MMBtu for natural gas and $50.13/Bbl for oil on a weighted average Appalachian index basis. 2016 10-year average strip prices are NYMEX $3.13/Mcf, WTI $56.84/Bbl, propane $0.68/gal and ethane $0.30/gal.
5
3P RESERVES BY VOLUME – 2016(1)NET PDP RESERVES (Tcfe)(1)
NET PROVED RESERVES (Tcfe)(1) 2016 RESERVE ADDITIONS• Proved reserves increased 16% to 15.4 Tcfe− Proved pre-tax PV-10 at SEC pricing of $6.7 billion, including
$3.0 billion of hedge value−Proved pre-tax PV-10 at strip pricing of $9.8 billion, including
$1.3 billion of hedge value−Booked 81 Marcellus PUD locations at new 2.0 Bcf/1,000’
type curve
• 3P reserves increased 25% to 46.4 Tcfe−3P PV-10 at strip pricing of $16.7 billion, including $1.3 billion
of hedge value
• All-in F&D cost of $0.52/Mcfe for 2016
• Drill bit only F&D cost of $0.39/Mcfe for 20160.02.04.06.08.0
10.012.014.0
2010 2011 2012 2013 2014 2015 2016
Marcellus Utica
0.72.8
4.3
7.6
12.7
(Tcfe)
13.215.4
(Tcfe) $Bn
$550 MM
$4.75 Bn

1.8 2.2
0.0
0.5
1.0
1.5
2.0
2.5
3.0
3.5
4.0
2016E 2017E 2018E 2019E 2020E
Net
Dai
ly P
rodu
ctio
n
2017 Guidance
2017 GUIDANCE AND LONG TERM OUTLOOK
6
D&C Capital: $1.3 Billion Modest annual increases within Cash Flow from Operations
Production Growth:
In line with D&C capital Doubling by 2020Consolidated Cash Flow from Operations(1):
3.0x to 3.5x Declining to mid-2s by 2018Leverage(1):
96% Hedged at $3.47/Mcfe 58% Hedged at $3.76/McfeHedging:
2018 ‐ 2020 Long Term Targets
(Bcfe/d)
1. Assuming 12/31/2016 4-year strip pricing averaging $3.12/MMBtu for natural gas and $56.23/Bbl for oil. Consolidated cash flow from operations includes realized hedge gains.
$4.04$3.47 $3.91
$3.70
$3.66
Hedged VolumeHedged Price ($/Mcfe)
GuidanceLong Term Targets
$
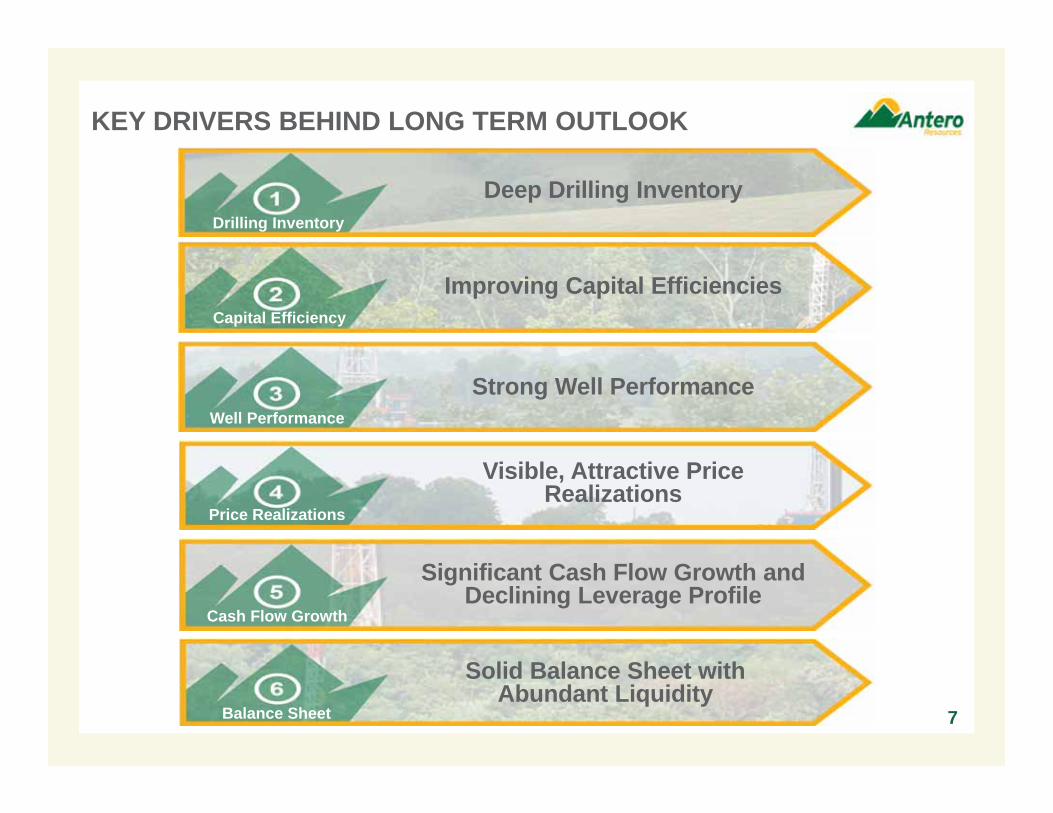
KEY DRIVERS BEHIND LONG TERM OUTLOOK
Deep Drilling Inventory
Improving Capital Efficiencies
Strong Well Performance
Visible, Attractive Price Realizations
Significant Cash Flow Growth and Declining Leverage Profile
7
Drilling Inventory
Capital Efficiency
Well Performance
Price Realizations
Cash Flow Growth
Solid Balance Sheet with Abundant Liquidity
Balance Sheet
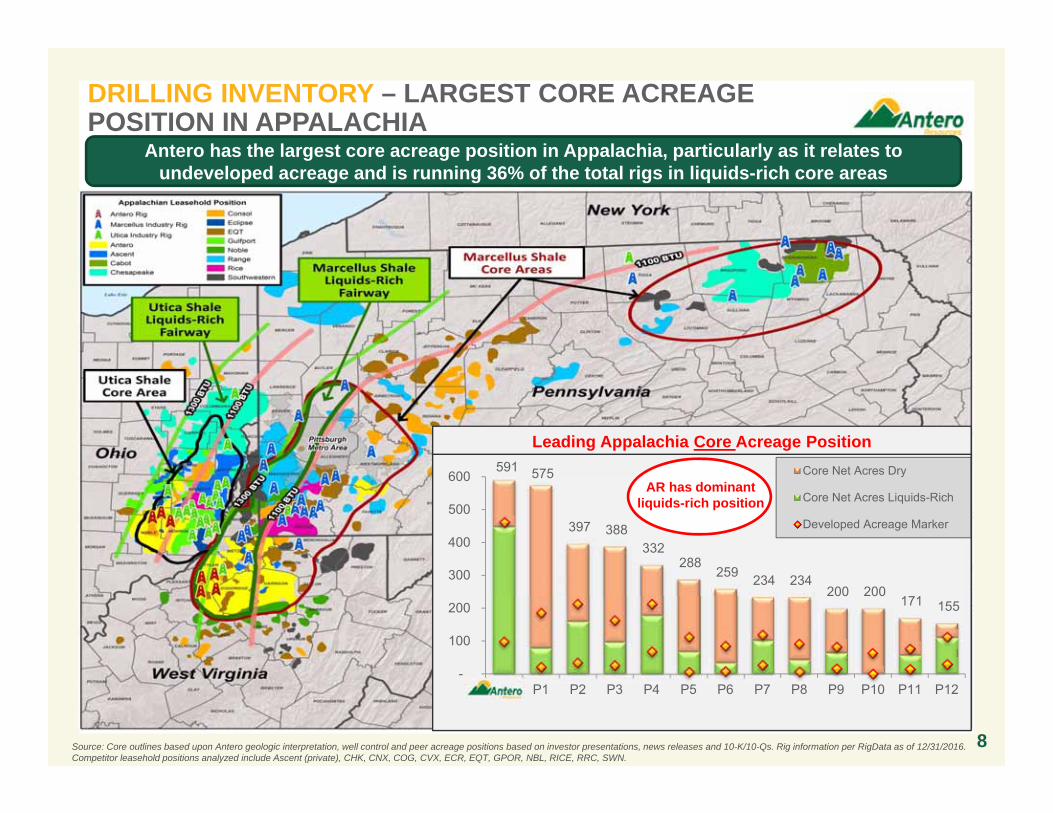
Source: Core outlines based upon Antero geologic interpretation, well control and peer acreage positions based on investor presentations, news releases and 10-K/10-Qs. Rig information per RigData as of 12/31/2016.Competitor leasehold positions analyzed include Ascent (private), CHK, CNX, COG, CVX, ECR, EQT, GPOR, NBL, RICE, RRC, SWN.
DRILLING INVENTORY – LARGEST CORE ACREAGE POSITION IN APPALACHIA
Leading Appalachia Core Acreage Position
Antero has the largest core acreage position in Appalachia, particularly as it relates to undeveloped acreage and is running 36% of the total rigs in liquids-rich core areas
8
591 575
397 388 332
288 259 234 234
200 200 171 155
-
100
200
300
400
500
600
AR P1 P2 P3 P4 P5 P6 P7 P8 P9 P10 P11 P12
Core Net Acres Dry
Core Net Acres Liquids-Rich
Developed Acreage Marker
AR has dominant liquids-rich position
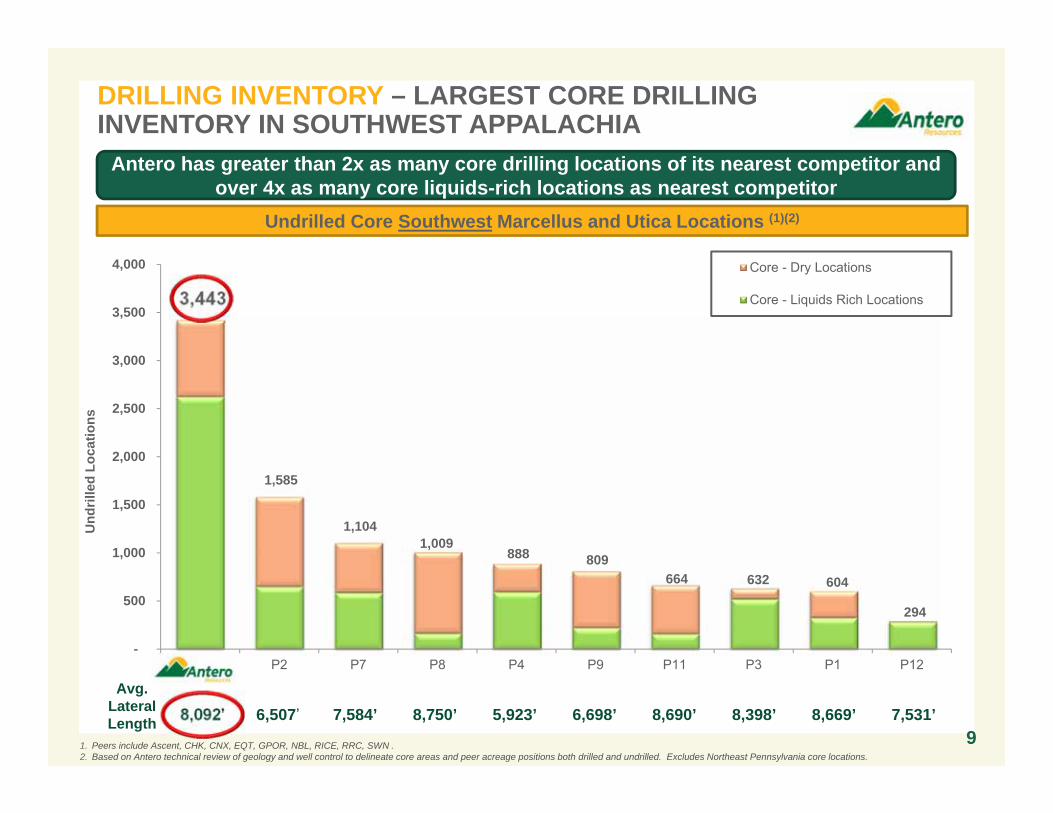
3,443
1,585
1,104 1,009
888 809 664 632 604
294
-
500
1,000
1,500
2,000
2,500
3,000
3,500
4,000
AR P2 P7 P8 P4 P9 P11 P3 P1 P12
Core - Dry Locations
Core - Liquids Rich Locations
DRILLING INVENTORY – LARGEST CORE DRILLING INVENTORY IN SOUTHWEST APPALACHIA
1. Peers include Ascent, CHK, CNX, EQT, GPOR, NBL, RICE, RRC, SWN .2. Based on Antero technical review of geology and well control to delineate core areas and peer acreage positions both drilled and undrilled. Excludes Northeast Pennsylvania core locations.
9
Undrilled Core Southwest Marcellus and Utica Locations (1)(2)
Antero has greater than 2x as many core drilling locations of its nearest competitor and over 4x as many core liquids-rich locations as nearest competitor
Avg. Lateral Length 8,092’ 6,507’ 7,584’ 8,750’ 5,923’ 6,698’ 8,690’ 8,398’ 7,531’
Und
rille
dLo
catio
ns
8,669’
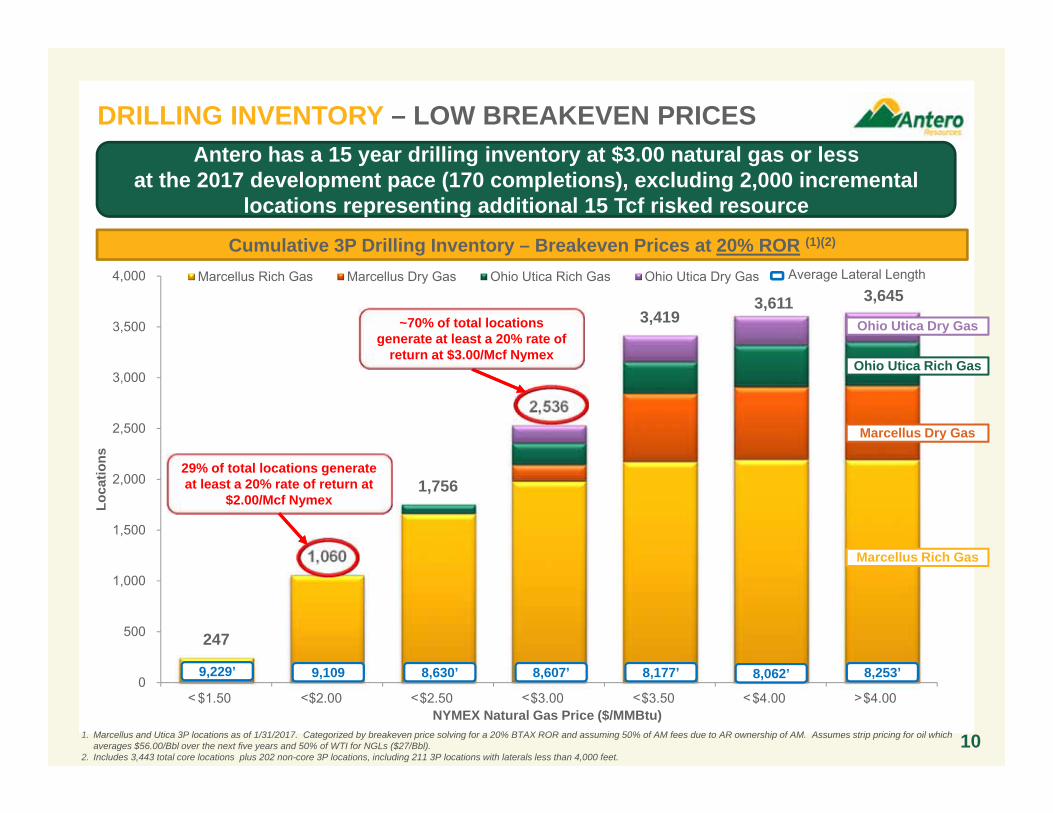
247
1,060
1,756
2,536
3,419 3,611 3,645
0
500
1,000
1,500
2,000
2,500
3,000
3,500
4,000
$1.50 $2.00 $2.50 $3.00 $3.50 $4.00 $4.00
Loca
tions
Marcellus Rich Gas Marcellus Dry Gas Ohio Utica Rich Gas Ohio Utica Dry Gas
DRILLING INVENTORY – LOW BREAKEVEN PRICES
1. Marcellus and Utica 3P locations as of 1/31/2017. Categorized by breakeven price solving for a 20% BTAX ROR and assuming 50% of AM fees due to AR ownership of AM. Assumes strip pricing for oil which averages $56.00/Bbl over the next five years and 50% of WTI for NGLs ($27/Bbl).
2. Includes 3,443 total core locations plus 202 non-core 3P locations, including 211 3P locations with laterals less than 4,000 feet.10
Cumulative 3P Drilling Inventory – Breakeven Prices at 20% ROR (1)(2)
Marcellus Rich Gas
Marcellus Dry Gas
Ohio Utica Rich Gas
< << << <
<
Antero has a 15 year drilling inventory at $3.00 natural gas or less at the 2017 development pace (170 completions), excluding 2,000 incremental
locations representing additional 15 Tcf risked resource
~70% of total locations generate at least a 20% rate of
return at $3.00/Mcf Nymex
29% of total locations generate at least a 20% rate of return at
$2.00/Mcf Nymex
8,253’8,062’8,177’8,607’8,630’9,1099,229’
Average Lateral Length
Ohio Utica Dry Gas
NYMEX Natural Gas Price ($/MMBtu)
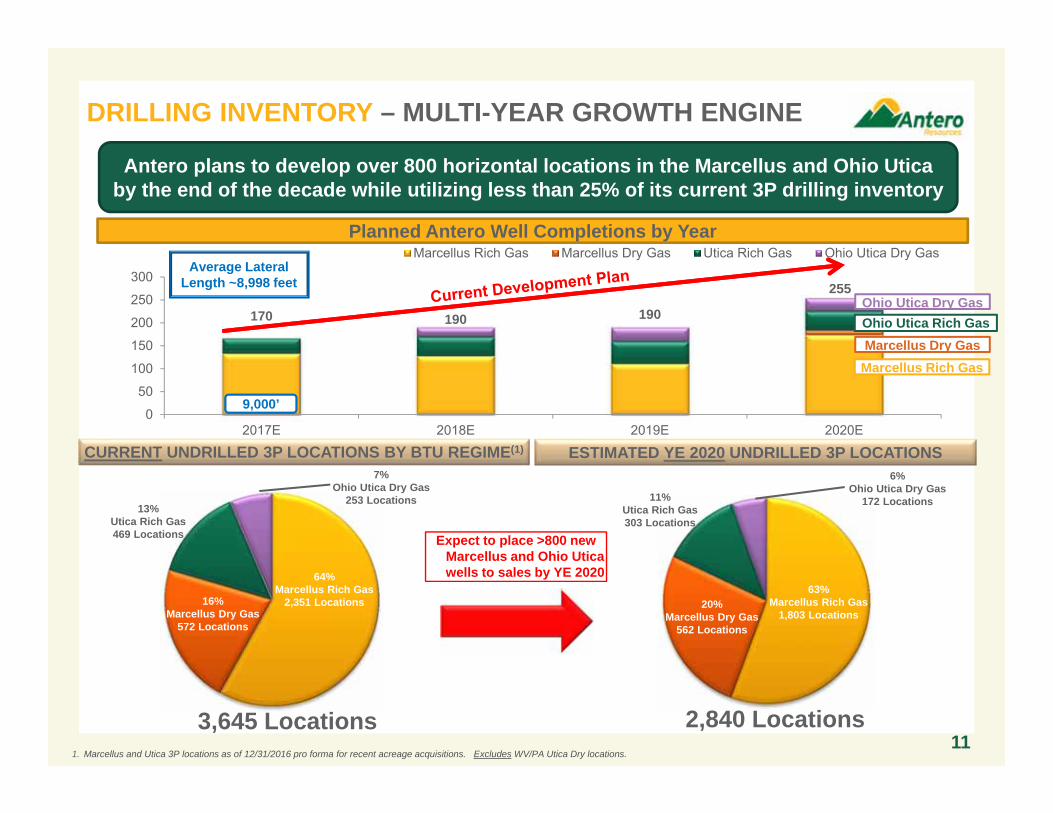
170 190 190
255
0
50
100
150
200
250
300
2017E 2018E 2019E 2020E
Marcellus Rich Gas Marcellus Dry Gas Utica Rich Gas Ohio Utica Dry Gas
DRILLING INVENTORY – MULTI-YEAR GROWTH ENGINE
3,645 Locations 2,840 Locations
Expect to place >800 new Marcellus and Ohio Utica wells to sales by YE 2020
1. Marcellus and Utica 3P locations as of 12/31/2016 pro forma for recent acreage acquisitions. Excludes WV/PA Utica Dry locations.
Average Lateral Length ~8,998 feet
11
CURRENT UNDRILLED 3P LOCATIONS BY BTU REGIME(1) ESTIMATED YE 2020 UNDRILLED 3P LOCATIONS
Antero plans to develop over 800 horizontal locations in the Marcellus and Ohio Utica by the end of the decade while utilizing less than 25% of its current 3P drilling inventory
Planned Antero Well Completions by Year
Marcellus Rich Gas
Ohio Utica Rich GasOhio Utica Dry Gas
Marcellus Dry Gas
6%Ohio Utica Dry Gas
172 Locations 11%Utica Rich Gas 303 Locations
20% Marcellus Dry Gas
562 Locations
63%Marcellus Rich Gas
1,803 Locations 16%
Marcellus Dry Gas 572 Locations
64%Marcellus Rich Gas
2,351 Locations
13%Utica Rich Gas 469 Locations
7%Ohio Utica Dry Gas
253 Locations
9,000’
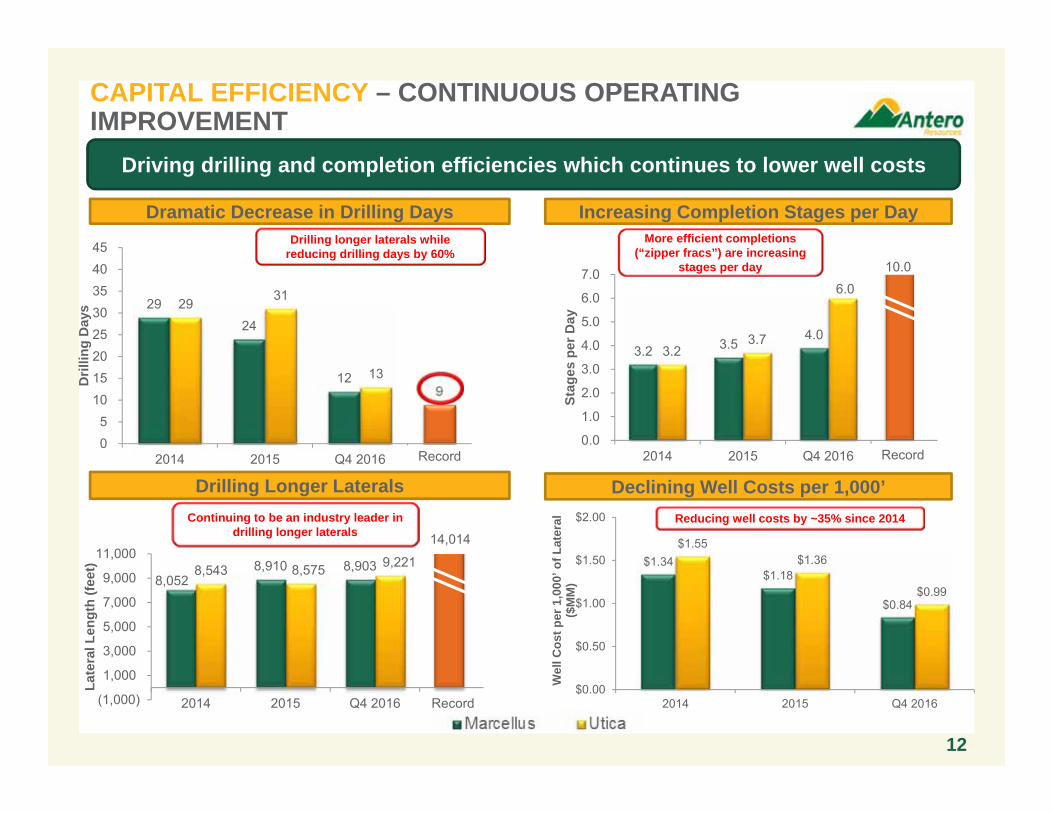
3.2 3.5 4.0
3.2 3.7
6.0
0.0
1.0
2.0
3.0
4.0
5.0
6.0
7.0
2014 2015 Q4 2016 Record
Stag
es p
er D
ay8,052
8,910 8,9038,543 8,575 9,221
(1,000)
1,000
3,000
5,000
7,000
9,000
11,000
2014 2015 Q4 2016 Record
Late
ral L
engt
h (fe
et)
29 24
12 9
29 31
13
05
1015202530354045
2014 2015 Q4 2016 Record
Dril
ling
Day
s
$1.34$1.18
$0.84
$1.55 $1.36
$0.99
$0.00
$0.50
$1.00
$1.50
$2.00
2014 2015 Q4 2016
Wel
l Cos
t per
1,0
00’ o
f Lat
eral
($
MM
)
12
CAPITAL EFFICIENCY – CONTINUOUS OPERATING IMPROVEMENT
Increasing Completion Stages per Day
Drilling Longer Laterals
Dramatic Decrease in Drilling Days
Declining Well Costs per 1,000’
Drilling longer laterals while reducing drilling days by 60%
More efficient completions (“zipper fracs”) are increasing
stages per day
Reducing well costs by ~35% since 2014 Continuing to be an industry leader in drilling longer laterals
Driving drilling and completion efficiencies which continues to lower well costs
Record
Record
14,014
Record
10.0
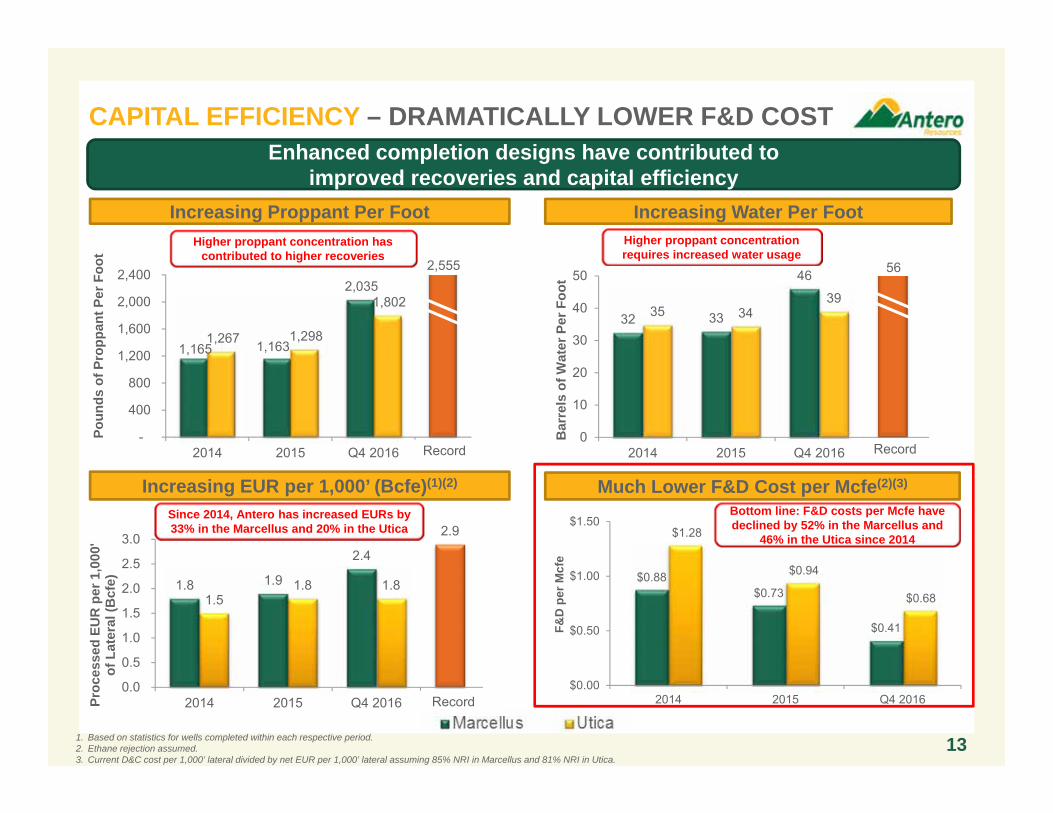
32 33
46
35 3439
0
10
20
30
40
50
2014 2015 Q4 2016
Bar
rels
of W
ater
Per
Foo
t
1,165 1,163
2,035
1,267 1,298
1,802
-
400
800
1,200
1,600
2,000
2,400
2014 2015 Q4 2016
Poun
ds o
f Pro
ppan
t Per
Foo
t
$0.88$0.73
$0.41
$1.28
$0.94
$0.68
$0.00
$0.50
$1.00
$1.50
2014 2015 Q4 2016
F&D
per
Mcf
e
1. Based on statistics for wells completed within each respective period.2. Ethane rejection assumed.3. Current D&C cost per 1,000’ lateral divided by net EUR per 1,000’ lateral assuming 85% NRI in Marcellus and 81% NRI in Utica.
13
CAPITAL EFFICIENCY – DRAMATICALLY LOWER F&D COST
Increasing Water Per Foot
Much Lower F&D Cost per Mcfe(2)(3)
Increasing Proppant Per Foot
Increasing EUR per 1,000’ (Bcfe)(1)(2)
Higher proppant concentration has contributed to higher recoveries
Higher proppant concentration requires increased water usage
Since 2014, Antero has increased EURs by 33% in the Marcellus and 20% in the Utica
Bottom line: F&D costs per Mcfe have declined by 52% in the Marcellus and
46% in the Utica since 2014
Enhanced completion designs have contributed to improved recoveries and capital efficiency
Record Record
562,555
1.8 1.9
2.4
2.9
1.51.8 1.8
0.0
0.5
1.0
1.5
2.0
2.5
3.0
2014 2015 Q4 2016Proc
esse
d EU
R p
er 1
,000
' of
Lat
eral
(Bcf
e)
Record
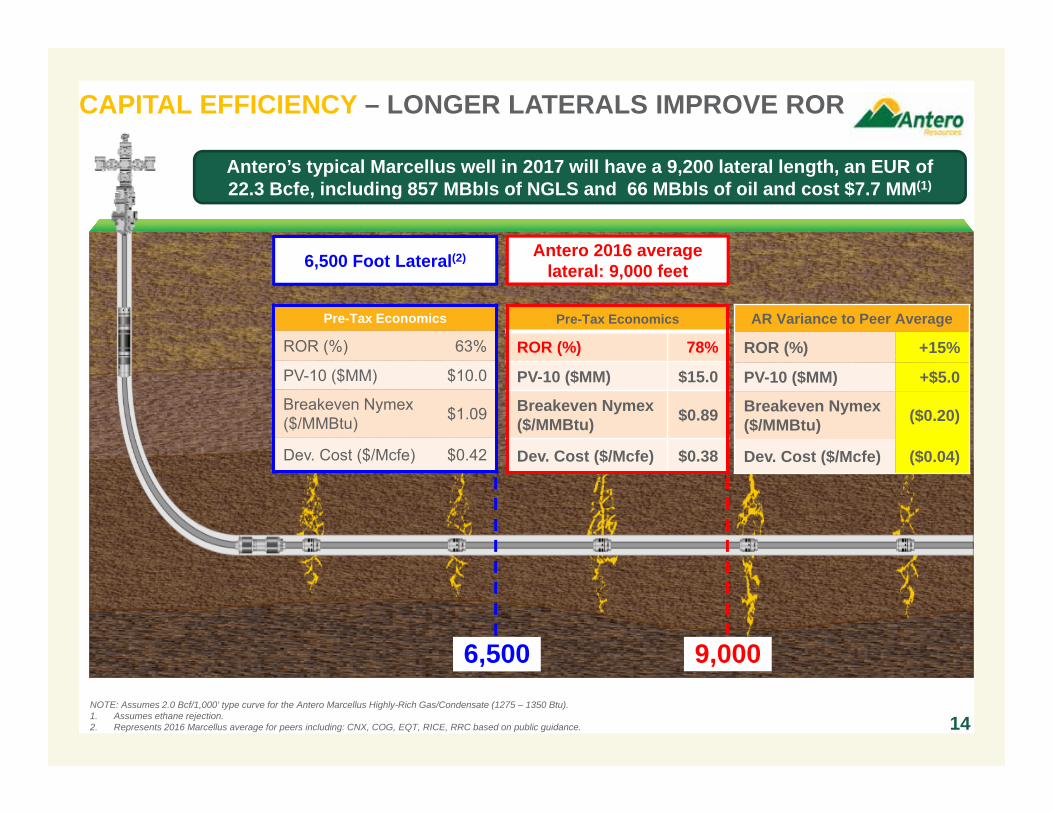
6,500 Foot Lateral(2)
9,000
Antero 2016 average lateral: 9,000 feet
NOTE: Assumes 2.0 Bcf/1,000’ type curve for the Antero Marcellus Highly-Rich Gas/Condensate (1275 – 1350 Btu).1. Assumes ethane rejection.2. Represents 2016 Marcellus average for peers including: CNX, COG, EQT, RICE, RRC based on public guidance.
Pre-Tax Economics
ROR (%) 63%
PV-10 ($MM) $10.0
Breakeven Nymex($/MMBtu) $1.09
Dev. Cost ($/Mcfe) $0.42
Pre-Tax Economics
ROR (%) 78%
PV-10 ($MM) $15.0
Breakeven Nymex($/MMBtu) $0.89
Dev. Cost ($/Mcfe) $0.38
14
CAPITAL EFFICIENCY – LONGER LATERALS IMPROVE ROR
6,500
Antero’s typical Marcellus well in 2017 will have a 9,200 lateral length, an EUR of 22.3 Bcfe, including 857 MBbls of NGLS and 66 MBbls of oil and cost $7.7 MM(1)
AR Variance to Peer Average
ROR (%) +15%
PV-10 ($MM) +$5.0
Breakeven Nymex($/MMBtu) ($0.20)
Dev. Cost ($/Mcfe) ($0.04)
$753
$569
$440
$341 $301
$395
$315 $300
$199
$351
$239 $246
$170
$340
$239
$327
1,265
1,485 1,484 1,506 1,497
1,758 1,7621,875
0
200
400
600
800
1,000
1,200
1,400
1,600
1,800
2,000
$0
$100
$200
$300
$400
$500
$600
$700
$800
4Q14 1Q15 2Q15 3Q15 4Q15 1Q16 2Q16 3Q16
Prod
uctio
n (M
Mcf
e/d)
$MM
D&C Capital Consolidated Cash Flow From Operations Production (MMcfe/d)
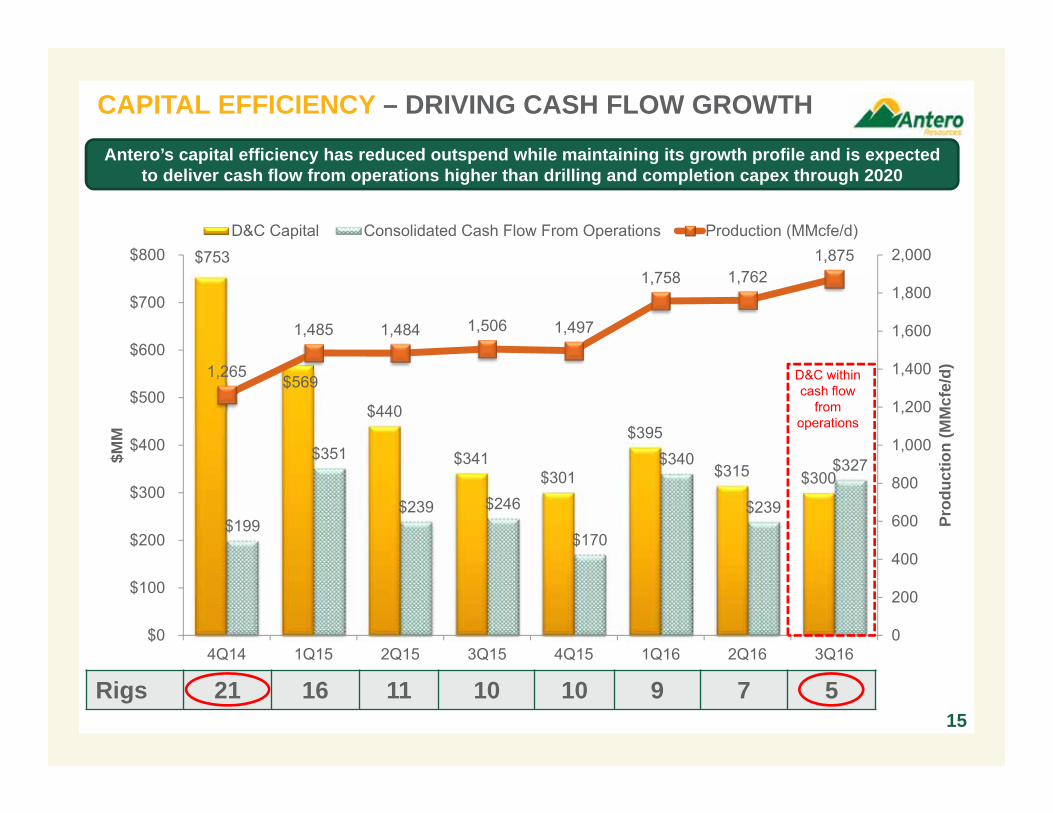
CAPITAL EFFICIENCY – DRIVING CASH FLOW GROWTH
Rigs 21 16 11 10 10 9 7 5
D&C within cash flow
from operations
Antero’s capital efficiency has reduced outspend while maintaining its growth profile and is expected to deliver cash flow from operations higher than drilling and completion capex through 2020
15
16
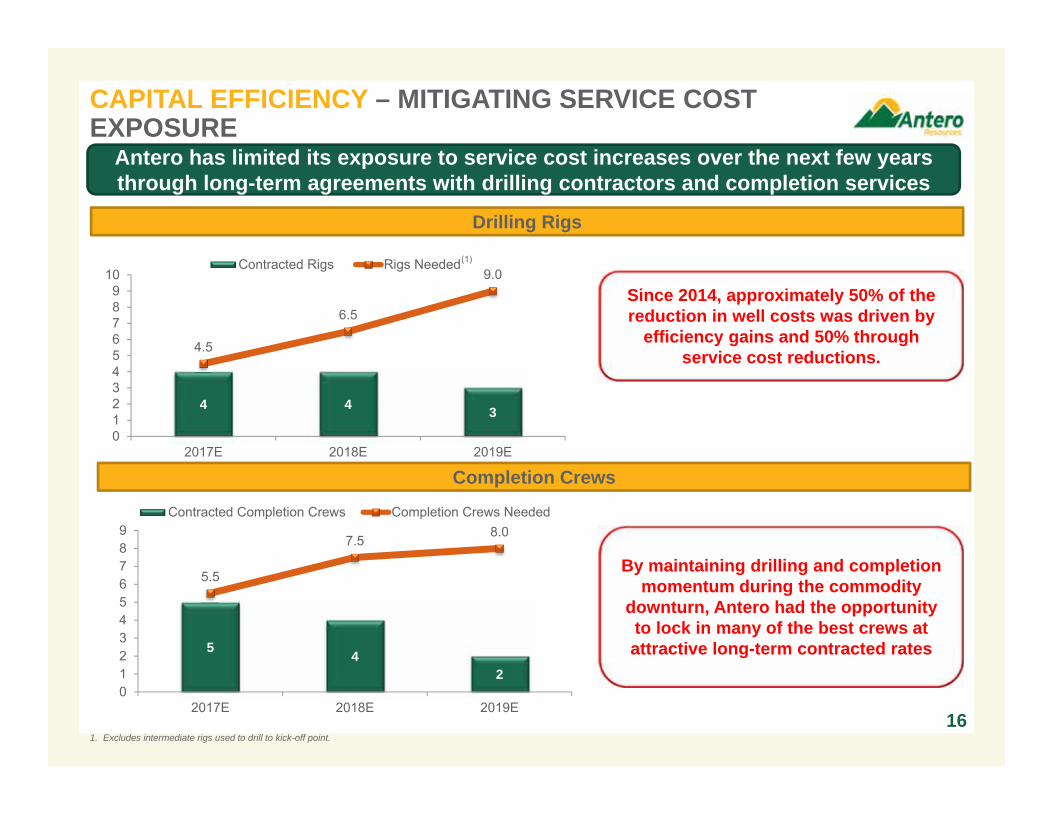
CAPITAL EFFICIENCY – MITIGATING SERVICE COST EXPOSURE
Antero has limited its exposure to service cost increases over the next few years through long-term agreements with drilling contractors and completion services
Drilling Rigs
Completion Crews
Since 2014, approximately 50% of the reduction in well costs was driven by
efficiency gains and 50% through service cost reductions.
By maintaining drilling and completion momentum during the commodity
downturn, Antero had the opportunity to lock in many of the best crews at attractive long-term contracted rates
4 4 3
4.5
6.5
9.0
0123456789
10
2017E 2018E 2019E
Contracted Rigs Rigs Needed
5 42
5.5
7.58.0
0123456789
2017E 2018E 2019E
Contracted Completion Crews Completion Crews Needed
1. Excludes intermediate rigs used to drill to kick-off point.
(1)

0
500
1,000
1,500
2,000
2,500
3,000
3,500
4,000
4,500
5,000
Cum
ulat
ive
Wel
lhea
d G
as P
rodu
ctio
n (M
Mcf
)
Days
WELL PERFORMANCE – OPTIMIZING WELL RECOVERIES WITH HIGHER INTENSITY COMPLETIONS
17
Vintage 2013 2014-15 2016E ChangeStage Length (Feet) 280 196 189 (33)%Proppant (lb/ft) 913 1,146 1,500 64%Water (Bbl/ft) 26 33 40 54%Wellhead EUR/1,000' 1.5 1.7 2.0 33%
Marcellus Cumulative Natural Gas Production Curves (Normalized to 9,000’ Lateral)
1.5
1.7
2.0
WellheadEUR/1,000’
2016 Advanced Completions – Cumulative Natural Gas Production(1)
Year 1Year 2
2.0 Bcf/1,000’ at the wellhead equates to 2.5 Bcfe/1,000’ after
processing assuming 1275 Btu gas, and 3.2 Bcfe/1,000’ processed assuming full ethane recovery
1. Includes condensate at 6:1 gas/condensate ratio.
500
750
1,000
1,250
1,500
1,750
2,000
2,250
2,500
2,750
3,000
Ant
ero
Com
plet
ion
Size
(lbs
/ft)
Completion Start Date
Testing higher proppant loads in 2017 –EUR impact to come
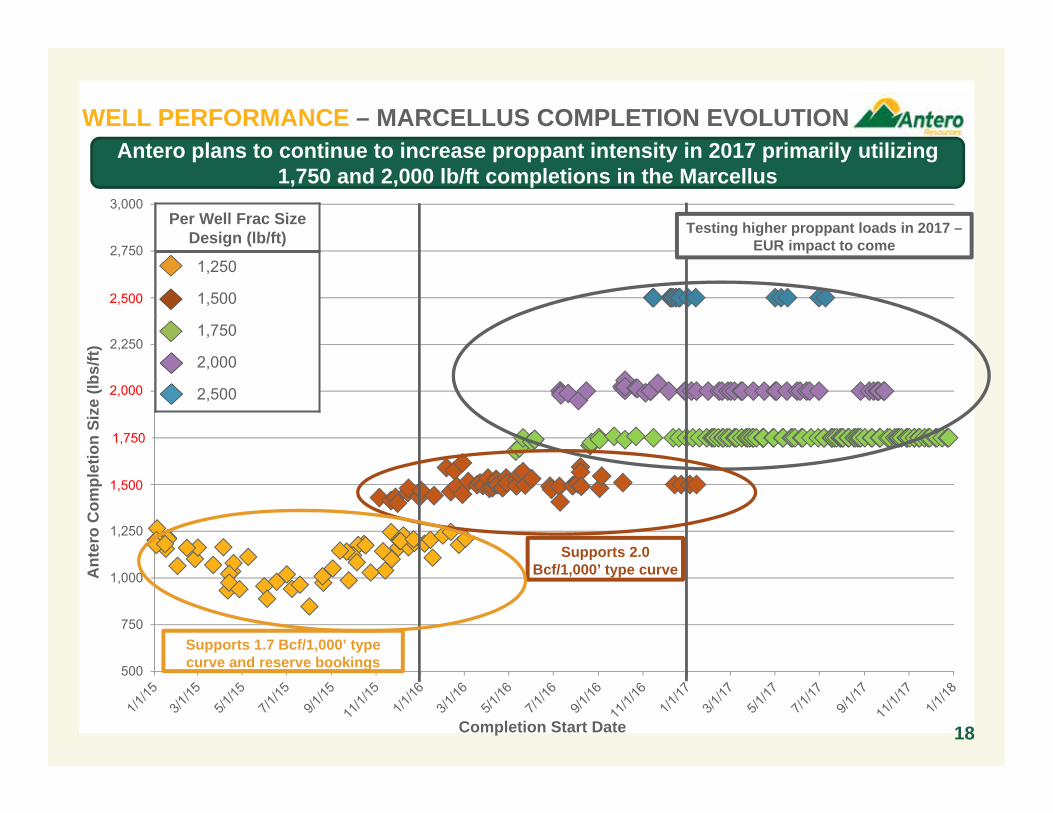
WELL PERFORMANCE – MARCELLUS COMPLETION EVOLUTION
Supports 2.0 Bcf/1,000’ type curve
Supports 1.7 Bcf/1,000’ type curve and reserve bookings
2,500
2,000
1,750
1,500
18
Antero plans to continue to increase proppant intensity in 2017 primarily utilizing 1,750 and 2,000 lb/ft completions in the Marcellus
Per Well Frac Size Design (lb/ft)
1,250
1,500
1,750
2,000
2,500
$7.1
$9.7 $12.3
41%
57%
75%
0%
20%
40%
60%
80%
100%
120%
$0.0
$5.0
$10.0
$15.0
$20.0
1.72.1
2.02.5
2.32.8
Pre-
Tax
RO
R
Pre-
Tax
PV-1
0
Pre-Tax PV-10 Pre-Tax ROR
$11.5$15.0
$18.467%
93%
122%
0%
20%
40%
60%
80%
100%
120%
140%
$0.0
$5.0
$10.0
$15.0
$20.0
1.72.3
2.02.7
2.33.1
Pre-
Tax
PV-1
0
Pre-Tax PV-10 Pre-Tax ROR
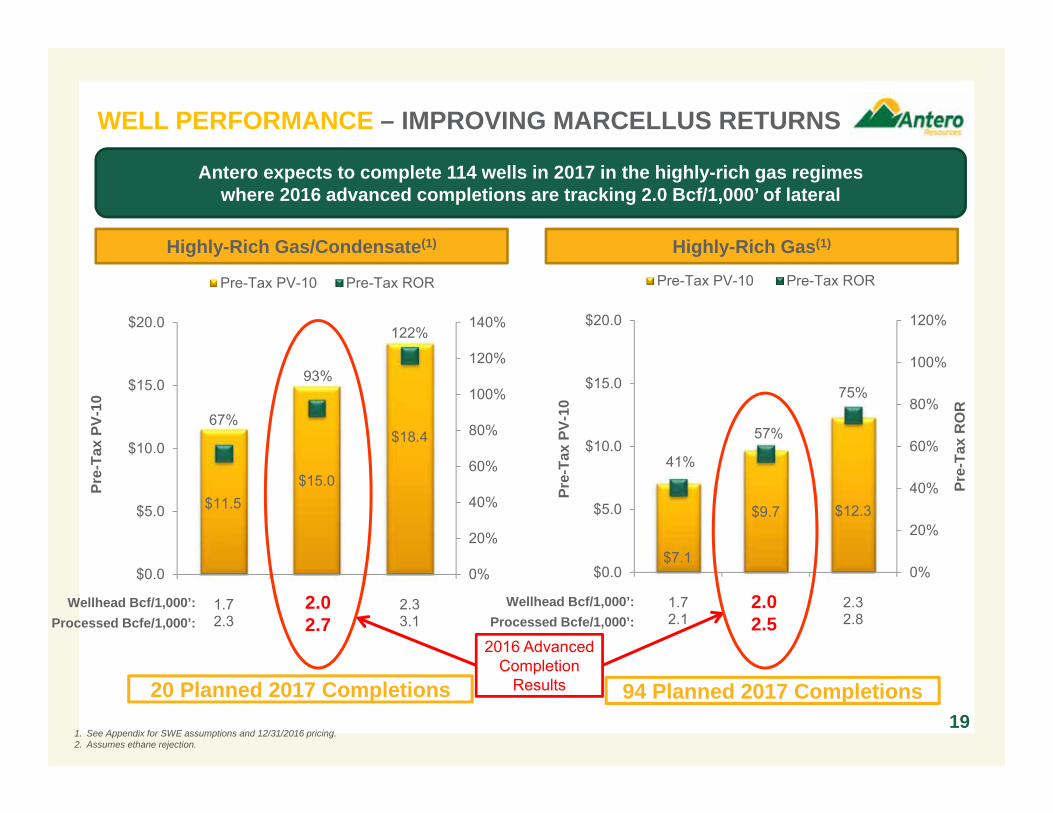
191. See Appendix for SWE assumptions and 12/31/2016 pricing.2. Assumes ethane rejection.
Highly-Rich Gas/Condensate(1)
Wellhead Bcf/1,000’:Processed Bcfe/1,000’:
Antero expects to complete 114 wells in 2017 in the highly-rich gas regimes where 2016 advanced completions are tracking 2.0 Bcf/1,000’ of lateral
2.02.7
2.02.5
20 Planned 2017 Completions
WELL PERFORMANCE – IMPROVING MARCELLUS RETURNS
Wellhead Bcf/1,000’:Processed Bcfe/1,000’:
Highly-Rich Gas(1)
94 Planned 2017 Completions
2016 Advanced Completion
Results
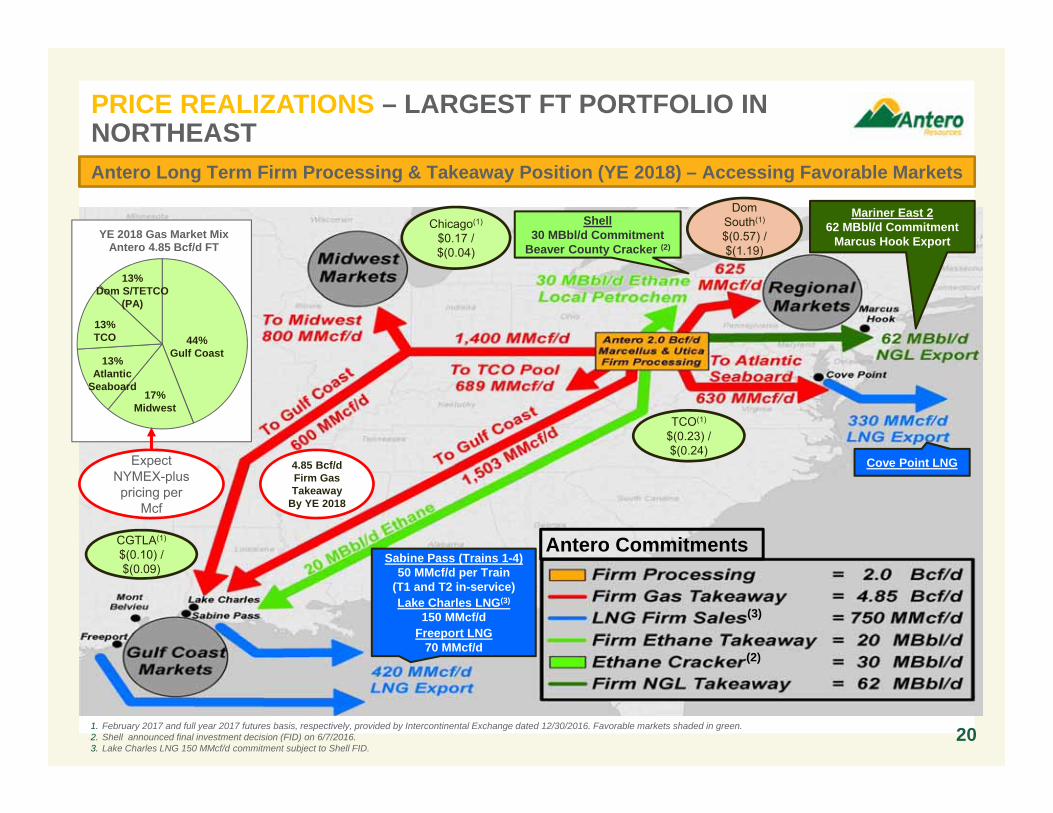
Antero Long Term Firm Processing & Takeaway Position (YE 2018) – Accessing Favorable Markets
Mariner East 262 MBbl/d Commitment
Marcus Hook ExportShell
30 MBbl/d CommitmentBeaver County Cracker (2)
Sabine Pass (Trains 1-4)50 MMcf/d per Train
(T1 and T2 in-service)Lake Charles LNG(3)
150 MMcf/dFreeport LNG
70 MMcf/d
1. February 2017 and full year 2017 futures basis, respectively, provided by Intercontinental Exchange dated 12/30/2016. Favorable markets shaded in green. 2. Shell announced final investment decision (FID) on 6/7/2016.3. Lake Charles LNG 150 MMcf/d commitment subject to Shell FID.
Chicago(1)
$0.17 / $(0.04)
CGTLA(1)
$(0.10) / $(0.09)
TCO(1)
$(0.23) / $(0.24)
20
Cove Point LNG4.85 Bcf/dFirm GasTakeaway
By YE 2018
YE 2018 Gas Market MixAntero 4.85 Bcf/d FT
44%Gulf Coast
17%Midwest
13%Atlantic
Seaboard
13%Dom S/TETCO
(PA)
13%TCO
Expect NYMEX-plus pricing per
Mcf
Antero Commitments
(3)
(2)
Dom South(1)
$(0.57) / $(1.19)
PRICE REALIZATIONS – LARGEST FT PORTFOLIO IN NORTHEAST
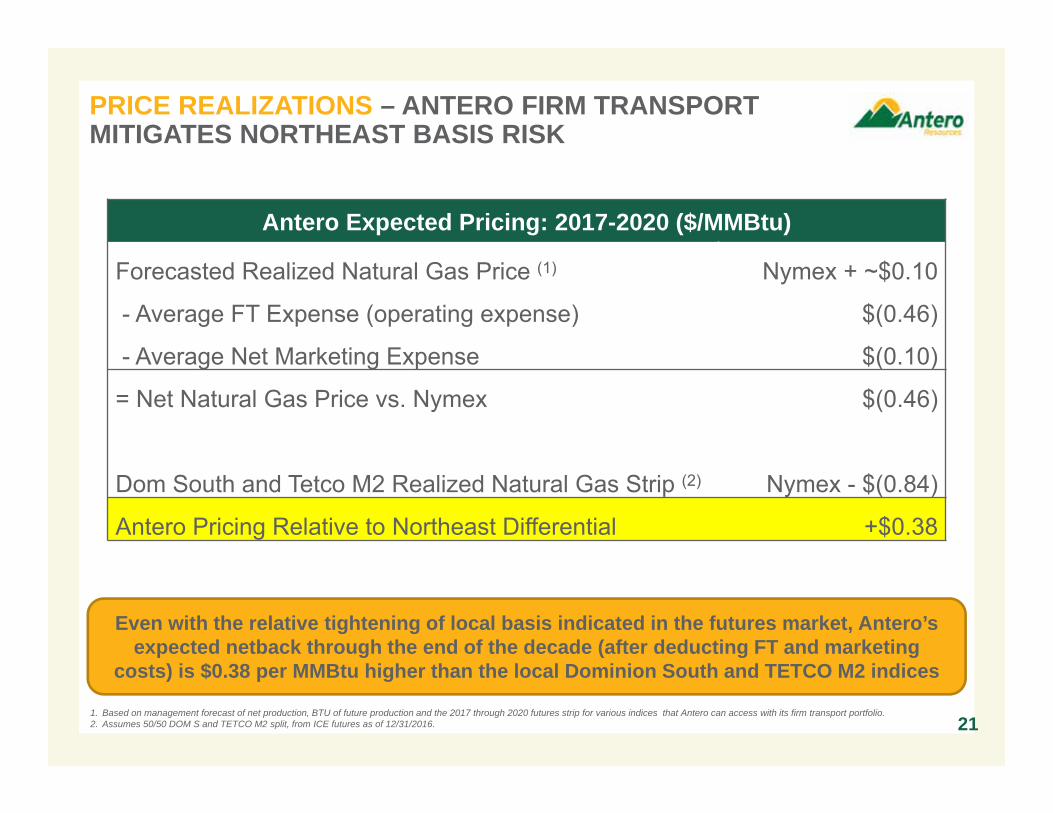
1. Based on management forecast of net production, BTU of future production and the 2017 through 2020 futures strip for various indices that Antero can access with its firm transport portfolio. 2. Assumes 50/50 DOM S and TETCO M2 split, from ICE futures as of 12/31/2016.
Antero Expected Pricing: 2017-2020 ($/MMBtu)
Forecasted Realized Natural Gas Price (1) Nymex + ~$0.10
- Average FT Expense (operating expense) $(0.46)
- Average Net Marketing Expense $(0.10)
= Net Natural Gas Price vs. Nymex $(0.46)
Dom South and Tetco M2 Realized Natural Gas Strip (2) Nymex - $(0.84)
Antero Pricing Relative to Northeast Differential +$0.38
21
Even with the relative tightening of local basis indicated in the futures market, Antero’s expected netback through the end of the decade (after deducting FT and marketing
costs) is $0.38 per MMBtu higher than the local Dominion South and TETCO M2 indices
PRICE REALIZATIONS – ANTERO FIRM TRANSPORT MITIGATES NORTHEAST BASIS RISK
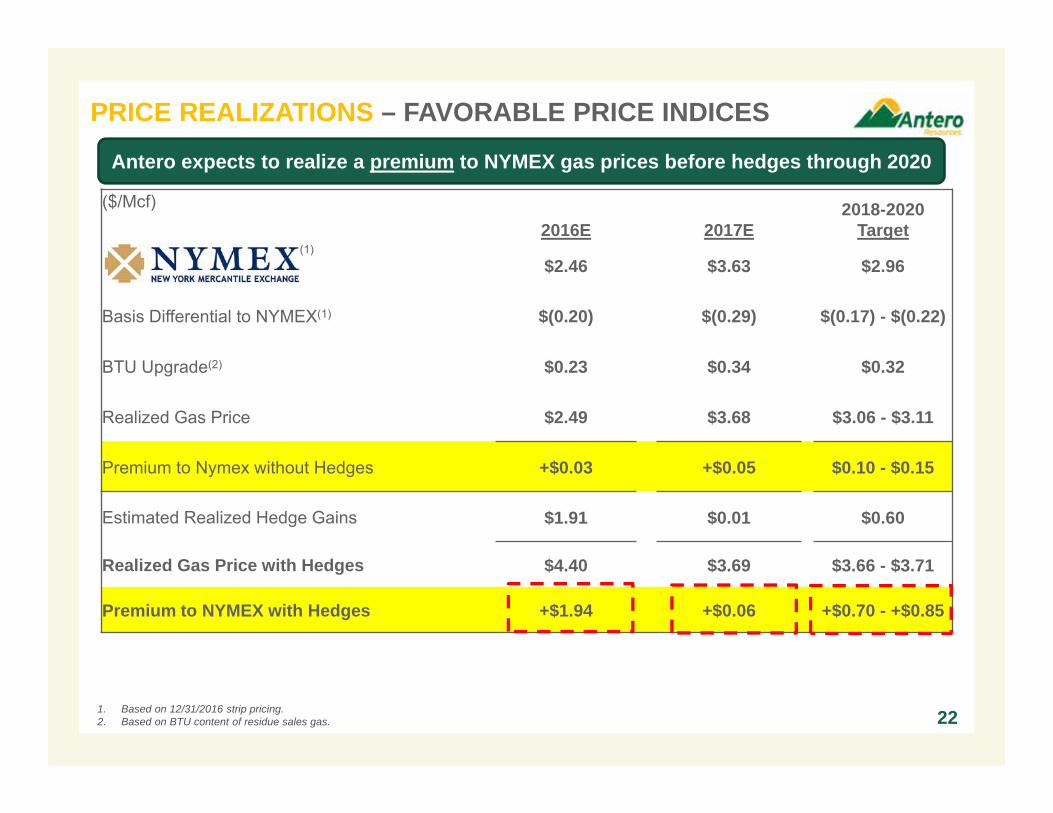
($/Mcf)2016E 2017E
2018-2020Target
(1)$2.46 $3.63 $2.96
Basis Differential to NYMEX(1) $(0.20) $(0.29) $(0.17) - $(0.22)
BTU Upgrade(2) $0.23 $0.34 $0.32
Realized Gas Price $2.49 $3.68 $3.06 - $3.11
Premium to Nymex without Hedges +$0.03 +$0.05 $0.10 - $0.15
Estimated Realized Hedge Gains $1.91 $0.01 $0.60
Realized Gas Price with Hedges $4.40 $3.69 $3.66 - $3.71
Premium to NYMEX with Hedges +$1.94 +$0.06 +$0.70 - +$0.85
PRICE REALIZATIONS – FAVORABLE PRICE INDICES
221. Based on 12/31/2016 strip pricing.2. Based on BTU content of residue sales gas.
Antero expects to realize a premium to NYMEX gas prices before hedges through 2020
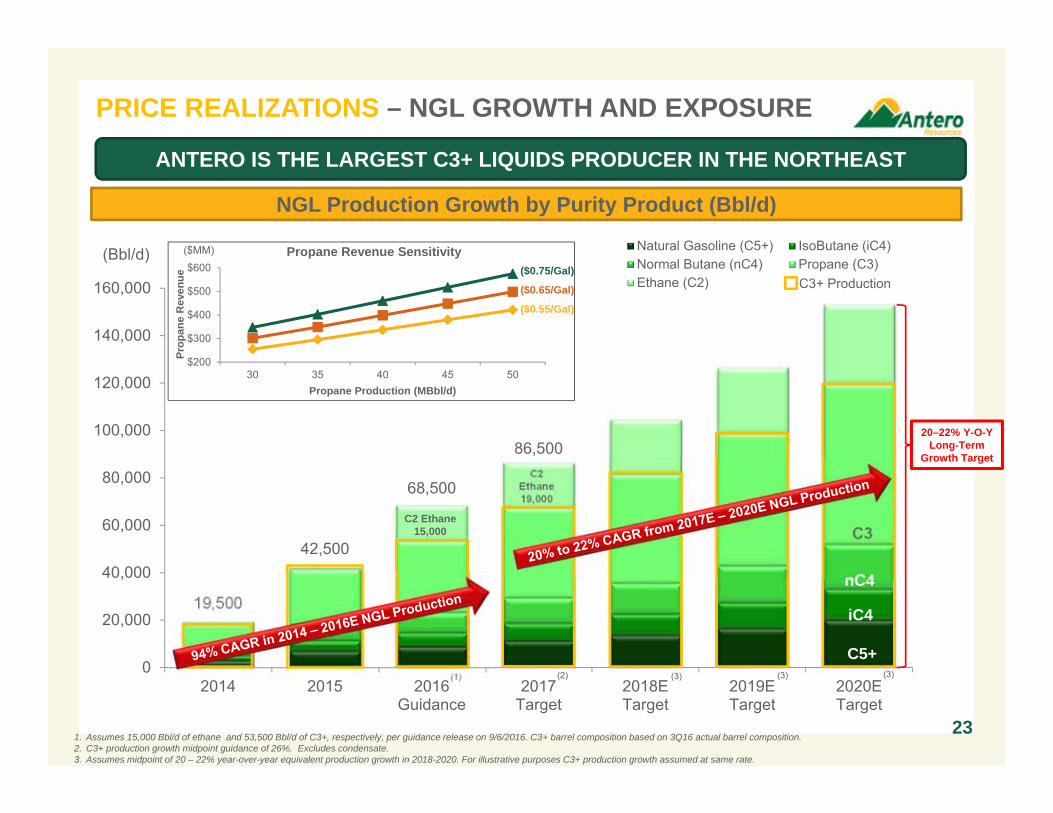
19,500
42,500
68,500
86,500
0
20,000
40,000
60,000
80,000
100,000
120,000
140,000
160,000
2014 2015 2016Guidance
2017Target
2018ETarget
2019ETarget
2020ETarget
Natural Gasoline (C5+) IsoButane (iC4)Normal Butane (nC4) Propane (C3)Ethane (C2)
1. Assumes 15,000 Bbl/d of ethane and 53,500 Bbl/d of C3+, respectively, per guidance release on 9/6/2016. C3+ barrel composition based on 3Q16 actual barrel composition.2. C3+ production growth midpoint guidance of 26%. Excludes condensate.3. Assumes midpoint of 20 – 22% year-over-year equivalent production growth in 2018-2020. For illustrative purposes C3+ production growth assumed at same rate.
(1)
C3+ Production
(2)
23
(Bbl/d)
C5+
iC4
nC4
C3C2 Ethane
15,000
C2Ethane19,000
NGL Production Growth by Purity Product (Bbl/d)
ANTERO IS THE LARGEST C3+ LIQUIDS PRODUCER IN THE NORTHEAST
PRICE REALIZATIONS – NGL GROWTH AND EXPOSURE
(3) (3) (3)
$200
$300
$400
$500
$600
30 35 40 45 50
Prop
ane
Rev
enue
Propane Production (MBbl/d)
Propane Revenue Sensitivity
20–22% Y-O-Y Long-Term
Growth Target
($MM)
($0.75/Gal)
($0.65/Gal)
($0.55/Gal)
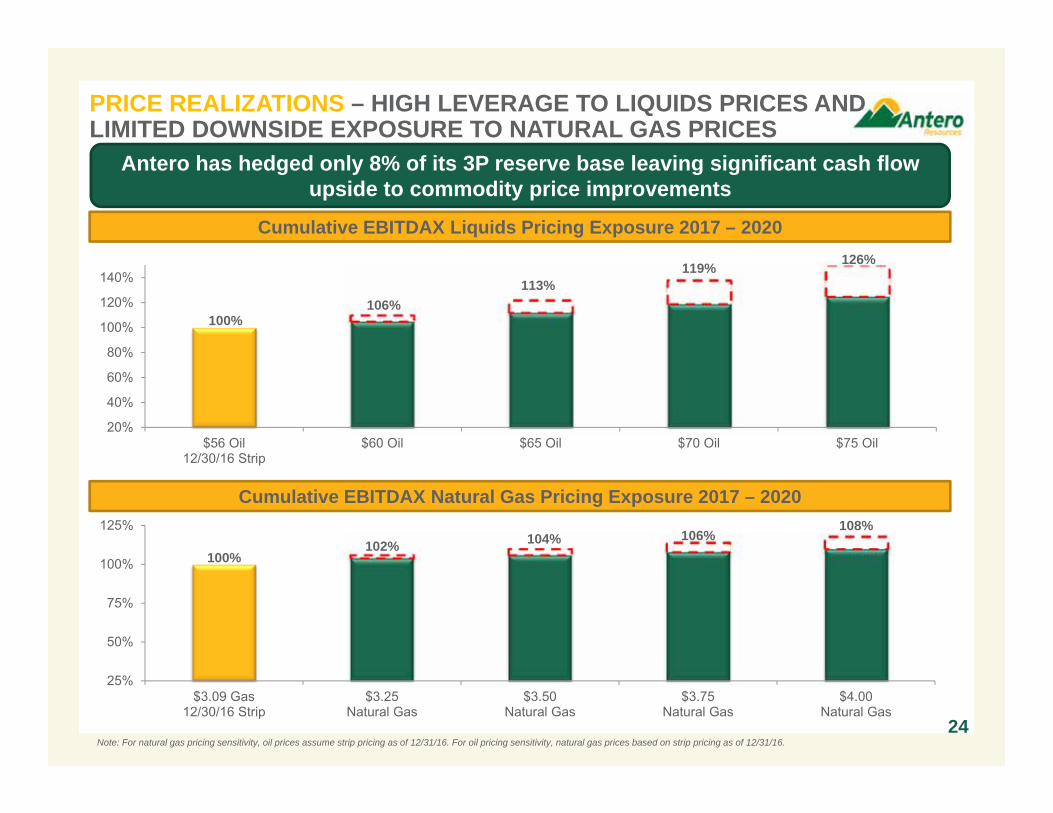
100%102% 104% 106%
108%
25%
50%
75%
100%
125%
$3.09 Gas12/30/16 Strip
$3.25Natural Gas
$3.50Natural Gas
$3.75Natural Gas
$4.00Natural Gas
Cumulative EBITDAX Natural Gas Pricing Exposure 2017 – 2020
PRICE REALIZATIONS – HIGH LEVERAGE TO LIQUIDS PRICES AND LIMITED DOWNSIDE EXPOSURE TO NATURAL GAS PRICES
24
Antero has hedged only 8% of its 3P reserve base leaving significant cash flow upside to commodity price improvements
Cumulative EBITDAX Liquids Pricing Exposure 2017 – 2020
100%106%
113%119% 126%
20%
40%
60%
80%
100%
120%
140%
$56 Oil12/30/16 Strip
$60 Oil $65 Oil $70 Oil $75 Oil
Note: For natural gas pricing sensitivity, oil prices assume strip pricing as of 12/31/16. For oil pricing sensitivity, natural gas prices based on strip pricing as of 12/31/16.
$1.86
AR P6 P1 P3 P4 P2 P5
$2.03
AR P6 P2 P1 P3 P4 P5
$2.03
P6 AR P3 P2 P1 P5 P4
$1.97
$0.00
$0.50
$1.00
$1.50
$2.00
$2.50
$3.00
P6 AR P3 P5 P4 P2 P1
$332
AR P2 P6 P3 P4 P5 P1
$355
AR P2 P5 P6 P3 P1 P4
$308
P2 AR P5 P3 P4 P6 P1
$291
$0
$100
$200
$300
$400
$500
P5 AR P2 P3 P4 P6 P1
$373
AR P2 P5 P3 P6 P4 P1 P7
$1.91
AR P6 P2 P7 P3 P1 P4 P53Q 2015
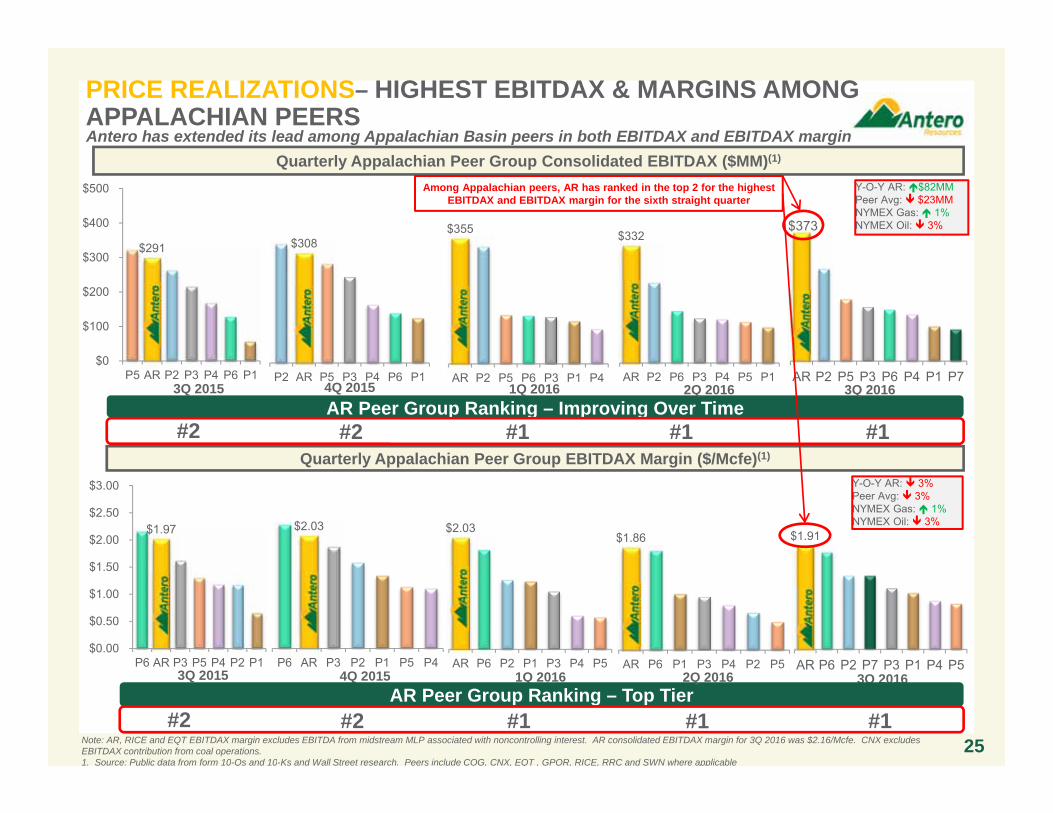
Quarterly Appalachian Peer Group EBITDAX Margin ($/Mcfe)(1)
Quarterly Appalachian Peer Group Consolidated EBITDAX ($MM)(1)
Note: AR, RICE and EQT EBITDAX margin excludes EBITDA from midstream MLP associated with noncontrolling interest. AR consolidated EBITDAX margin for 3Q 2016 was $2.16/Mcfe. CNX excludes EBITDAX contribution from coal operations. 1. Source: Public data from form 10-Qs and 10-Ks and Wall Street research. Peers include COG, CNX, EQT , GPOR, RICE, RRC and SWN where applicable
4Q 2015 1Q 2016 3Q 2016AR Peer Group Ranking – Top Tier
#2 #2 #1 #1 #1
AR Peer Group Ranking – Improving Over Time#2 #2 #1 #1 #1
Y-O-Y AR: $82MMPeer Avg: $23MMNYMEX Gas: 1%NYMEX Oil: 3%
Y-O-Y AR: 3%Peer Avg: 3%NYMEX Gas: 1%NYMEX Oil: 3%
25
3Q 2015
Among Appalachian peers, AR has ranked in the top 2 for the highest EBITDAX and EBITDAX margin for the sixth straight quarter
4Q 2015 1Q 2016
Antero has extended its lead among Appalachian Basin peers in both EBITDAX and EBITDAX margin
2Q 2016
2Q 2016
3Q 2016
PRICE REALIZATIONS– HIGHEST EBITDAX & MARGINS AMONG APPALACHIAN PEERS
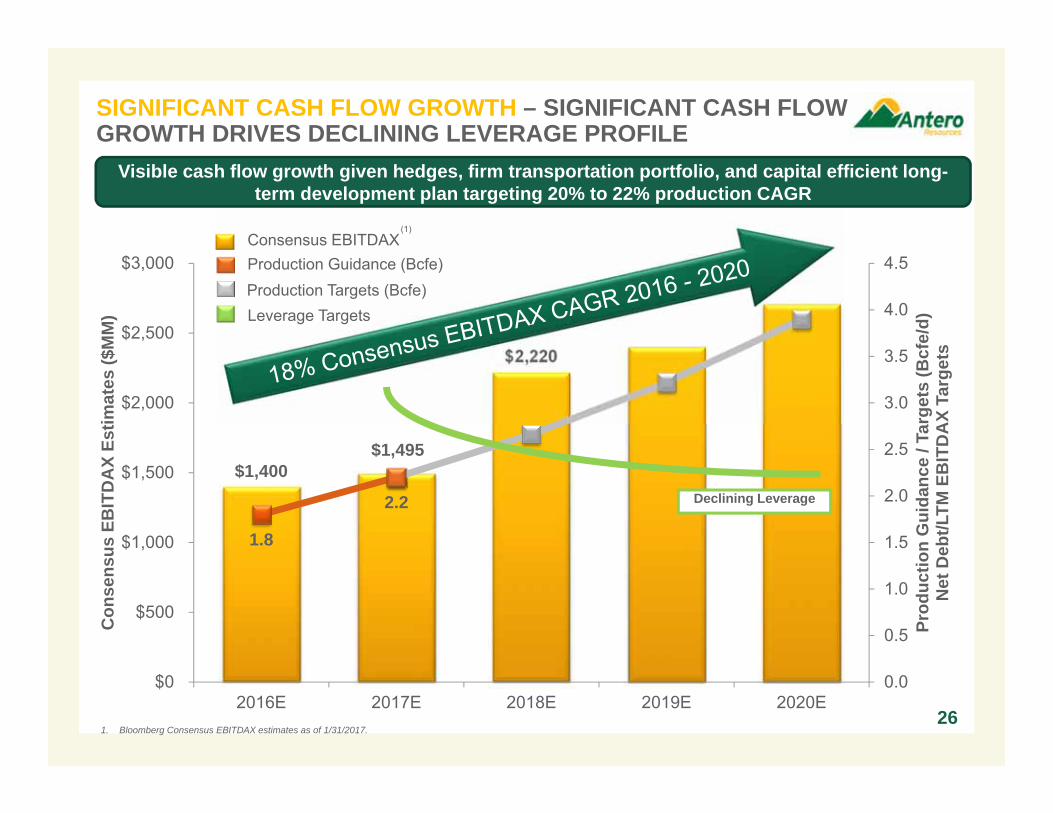
SIGNIFICANT CASH FLOW GROWTH – SIGNIFICANT CASH FLOW GROWTH DRIVES DECLINING LEVERAGE PROFILE
26
$1,400 $1,495
$2,220
1.8
2.2
0.0
0.5
1.0
1.5
2.0
2.5
3.0
3.5
4.0
4.5
$0
$500
$1,000
$1,500
$2,000
$2,500
$3,000
2016E 2017E 2018E 2019E 2020E
Prod
uctio
n G
uida
nce
/ Tar
gets
(Bcf
e/d)
Net
Deb
t/LTM
EB
ITD
AX
Targ
ets
Con
sens
us E
BIT
DA
X Es
timat
es ($
MM
)
Visible cash flow growth given hedges, firm transportation portfolio, and capital efficient long-term development plan targeting 20% to 22% production CAGR
Consensus EBITDAXProduction Guidance (Bcfe)Production Targets (Bcfe)
1. Bloomberg Consensus EBITDAX estimates as of 1/31/2017.
Leverage Targets
Declining Leverage
(1)
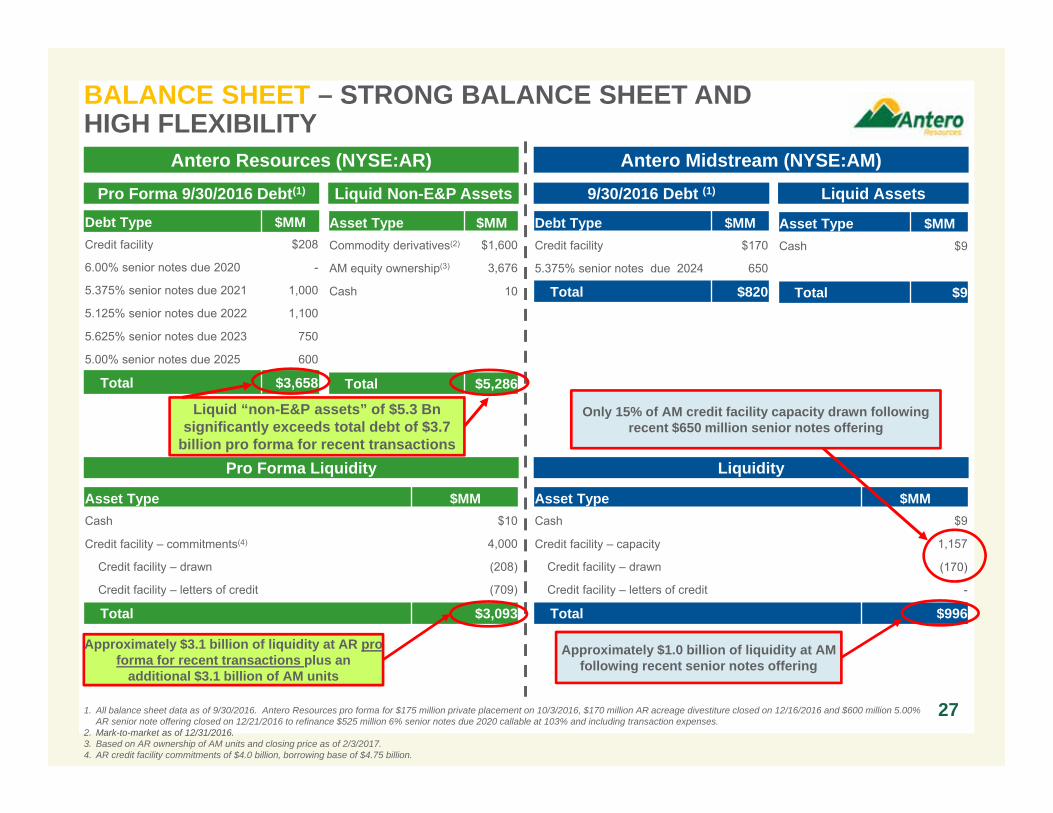
Liquid “non-E&P assets” of $5.3 Bnsignificantly exceeds total debt of $3.7
billion pro forma for recent transactionsPro Forma Liquidity
Antero Resources (NYSE:AR) Antero Midstream (NYSE:AM)
Pro Forma 9/30/2016 Debt(1) Liquid Non-E&P Assets 9/30/2016 Debt (1) Liquid Assets
Debt Type $MMCredit facility $208
6.00% senior notes due 2020 -
5.375% senior notes due 2021 1,000
5.125% senior notes due 2022 1,100
5.625% senior notes due 2023 750
5.00% senior notes due 2025 600
Total $3,658
Asset Type $MMCommodity derivatives(2) $1,600
AM equity ownership(3) 3,676
Cash 10
Total $5,286
Asset Type $MMCash $10
Credit facility – commitments(4) 4,000
Credit facility – drawn (208)
Credit facility – letters of credit (709)
Total $3,093
Debt Type $MMCredit facility $170
5.375% senior notes due 2024 650
Total $820
Asset Type $MMCash $9
Total $9
Liquidity
Asset Type $MMCash $9
Credit facility – capacity 1,157
Credit facility – drawn (170)
Credit facility – letters of credit -
Total $996
Approximately $3.1 billion of liquidity at AR pro forma for recent transactions plus an
additional $3.1 billion of AM units
Approximately $1.0 billion of liquidity at AM following recent senior notes offering
27
Only 15% of AM credit facility capacity drawn following recent $650 million senior notes offering
1. All balance sheet data as of 9/30/2016. Antero Resources pro forma for $175 million private placement on 10/3/2016, $170 million AR acreage divestiture closed on 12/16/2016 and $600 million 5.00% AR senior note offering closed on 12/21/2016 to refinance $525 million 6% senior notes due 2020 callable at 103% and including transaction expenses.
2. Mark-to-market as of 12/31/2016.3. Based on AR ownership of AM units and closing price as of 2/3/2017.4. AR credit facility commitments of $4.0 billion, borrowing base of $4.75 billion.
BALANCE SHEET – STRONG BALANCE SHEET AND HIGH FLEXIBILITY
Antero Midstream (NYSE: AM)
Asset Overview
28
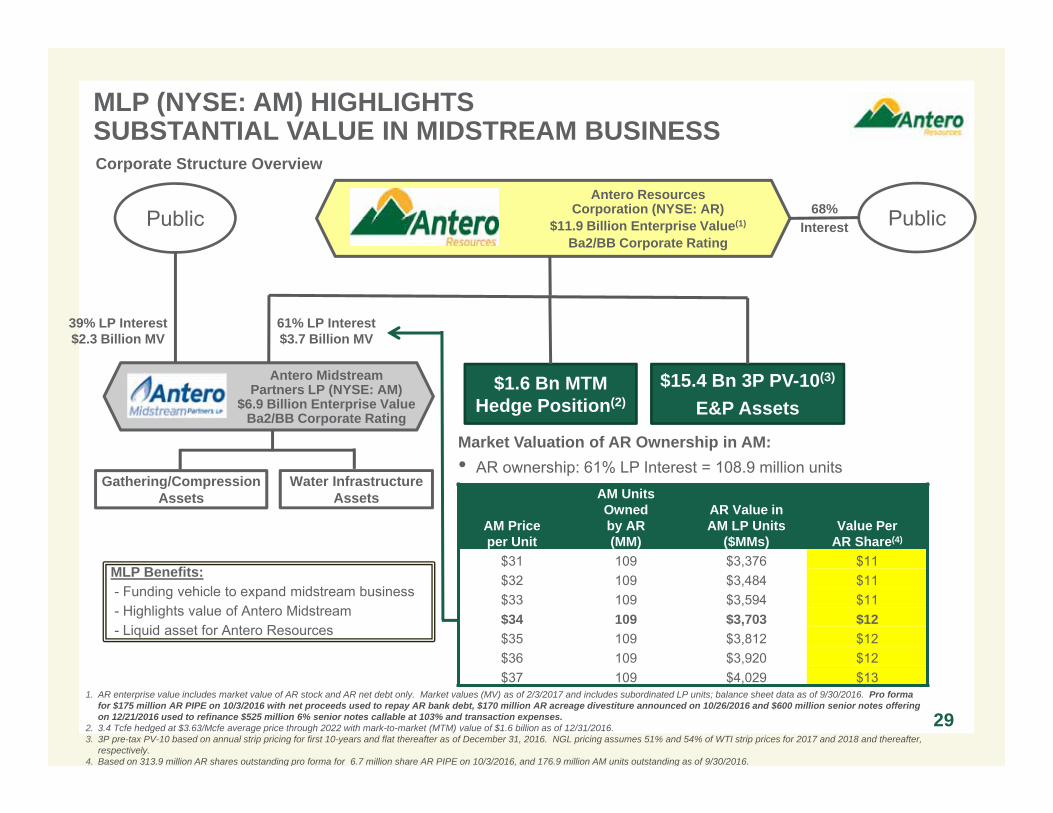
Antero ResourcesCorporation (NYSE: AR)
$11.9 Billion Enterprise Value(1)
Ba2/BB Corporate Rating
Antero MidstreamPartners LP (NYSE: AM)
$6.9 Billion Enterprise ValueBa2/BB Corporate Rating
61% LP Interest$3.7 Billion MV
$15.4 Bn 3P PV-10(3)
E&P Assets
Gathering/Compression Assets
1. AR enterprise value includes market value of AR stock and AR net debt only. Market values (MV) as of 2/3/2017 and includes subordinated LP units; balance sheet data as of 9/30/2016. Pro forma for $175 million AR PIPE on 10/3/2016 with net proceeds used to repay AR bank debt, $170 million AR acreage divestiture announced on 10/26/2016 and $600 million senior notes offering on 12/21/2016 used to refinance $525 million 6% senior notes callable at 103% and transaction expenses.
2. 3.4 Tcfe hedged at $3.63/Mcfe average price through 2022 with mark-to-market (MTM) value of $1.6 billion as of 12/31/2016. 3. 3P pre-tax PV-10 based on annual strip pricing for first 10-years and flat thereafter as of December 31, 2016. NGL pricing assumes 51% and 54% of WTI strip prices for 2017 and 2018 and thereafter,
respectively. 4. Based on 313.9 million AR shares outstanding pro forma for 6.7 million share AR PIPE on 10/3/2016, and 176.9 million AM units outstanding as of 9/30/2016.
29
Corporate Structure Overview
Market Valuation of AR Ownership in AM:• AR ownership: 61% LP Interest = 108.9 million units
AM Priceper Unit
AM UnitsOwnedby AR(MM)
AR Value in AM LP Units
($MMs)Value Per
AR Share(4)
$31 109 $3,376 $11$32 109 $3,484 $11$33 109 $3,594 $11$34 109 $3,703 $12$35 109 $3,812 $12$36 109 $3,920 $12$37 109 $4,029 $13
Water Infrastructure Assets
MLP Benefits:- Funding vehicle to expand midstream business- Highlights value of Antero Midstream- Liquid asset for Antero Resources
Public
39% LP Interest$2.3 Billion MV
$1.6 Bn MTM Hedge Position(2)
MLP (NYSE: AM) HIGHLIGHTSSUBSTANTIAL VALUE IN MIDSTREAM BUSINESS
Public68%Interest
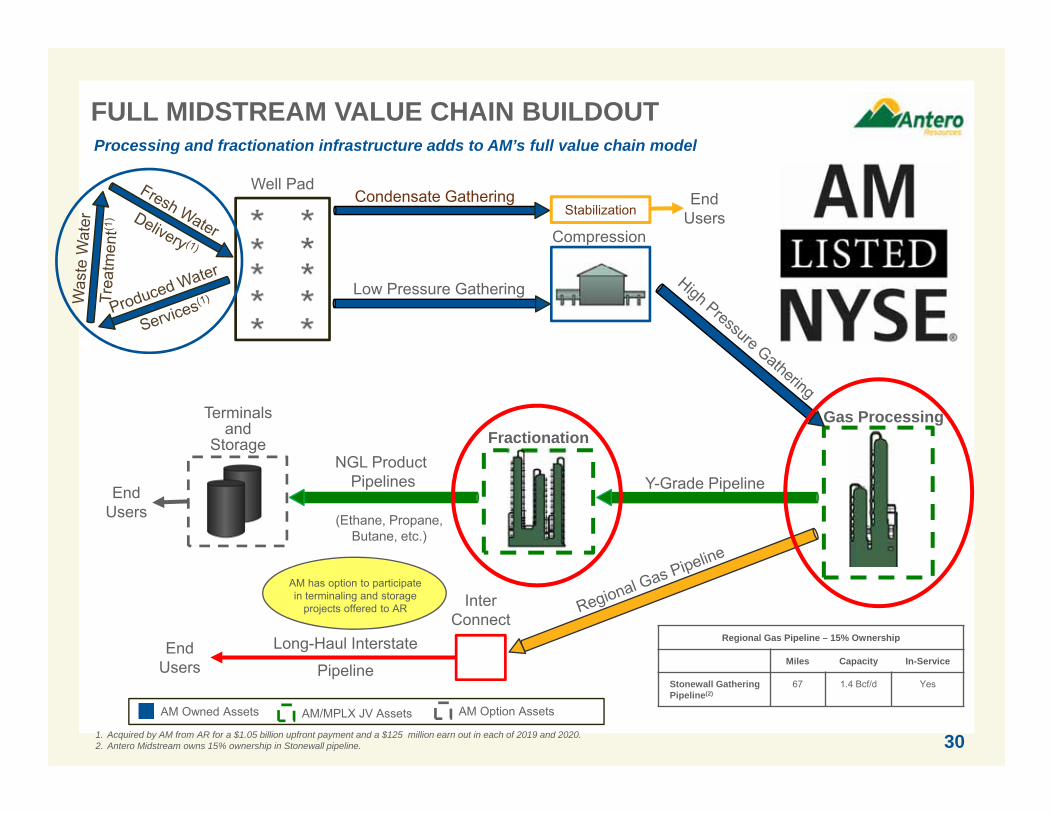
Regional Gas Pipeline – 15% Ownership
Miles Capacity In-Service
Stonewall Gathering Pipeline(2)
67 1.4 Bcf/d Yes
1. Acquired by AM from AR for a $1.05 billion upfront payment and a $125 million earn out in each of 2019 and 2020.2. Antero Midstream owns 15% ownership in Stonewall pipeline.
EndUsers
EndUsers
Gas Processing
Y-Grade Pipeline
Long-Haul Interstate
Pipeline
InterConnect
NGL Product Pipelines
Fractionation
Compression
Low Pressure Gathering
Well Pad
Terminalsand
Storage
AM has option to participate in terminaling and storage
projects offered to AR
AM Owned Assets
Condensate GatheringStabilization
EndUsers
(Ethane, Propane, Butane, etc.)
30
FULL MIDSTREAM VALUE CHAIN BUILDOUT
AM/MPLX JV Assets
Processing and fractionation infrastructure adds to AM’s full value chain model
AM Option Assets
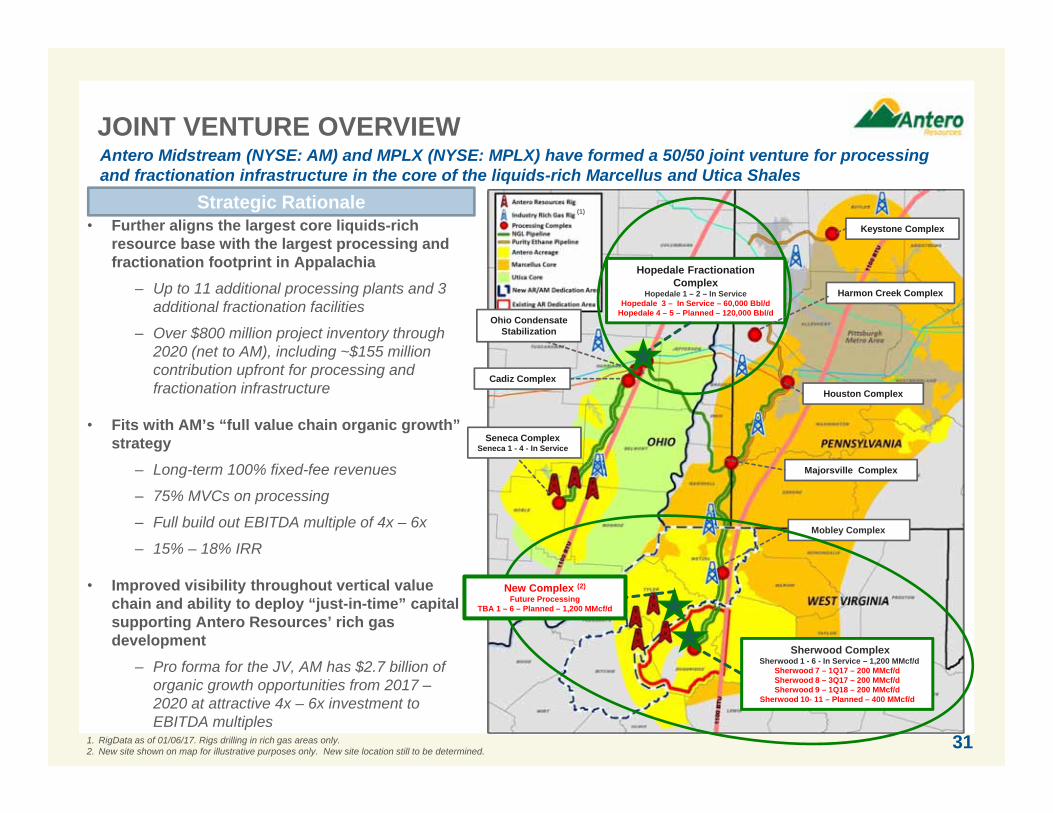
JOINT VENTURE OVERVIEW
31
Antero Midstream (NYSE: AM) and MPLX (NYSE: MPLX) have formed a 50/50 joint venture for processing and fractionation infrastructure in the core of the liquids-rich Marcellus and Utica Shales
Majorsville Complex
Mobley Complex
Houston Complex
Keystone Complex
Harmon Creek Complex
Hopedale Fractionation Complex
Hopedale 1 – 2 – In ServiceHopedale 3 – In Service – 60,000 Bbl/d
Hopedale 4 – 5 – Planned – 120,000 Bbl/d
Cadiz Complex
Seneca ComplexSeneca 1 - 4 - In Service
Ohio Condensate Stabilization
Strategic Rationale• Further aligns the largest core liquids-rich
resource base with the largest processing and fractionation footprint in Appalachia
‒ Up to 11 additional processing plants and 3 additional fractionation facilities
‒ Over $800 million project inventory through 2020 (net to AM), including ~$155 million contribution upfront for processing and fractionation infrastructure
• Fits with AM’s “full value chain organic growth” strategy
‒ Long-term 100% fixed-fee revenues
‒ 75% MVCs on processing
‒ Full build out EBITDA multiple of 4x – 6x
‒ 15% – 18% IRR
• Improved visibility throughout vertical value chain and ability to deploy “just-in-time” capital supporting Antero Resources’ rich gas development
‒ Pro forma for the JV, AM has $2.7 billion of organic growth opportunities from 2017 –2020 at attractive 4x – 6x investment to EBITDA multiples
Sherwood ComplexSherwood 1 - 6 - In Service – 1,200 MMcf/d
Sherwood 7 – 1Q17 – 200 MMcf/dSherwood 8 – 3Q17 – 200 MMcf/dSherwood 9 – 1Q18 – 200 MMcf/d
Sherwood 10- 11 – Planned – 400 MMcf/d
1. RigData as of 01/06/17. Rigs drilling in rich gas areas only.2. New site shown on map for illustrative purposes only. New site location still to be determined.
(1)
New Complex (2)
Future ProcessingTBA 1 – 6 – Planned – 1,200 MMcf/d
32
Gathering and Compression Assets
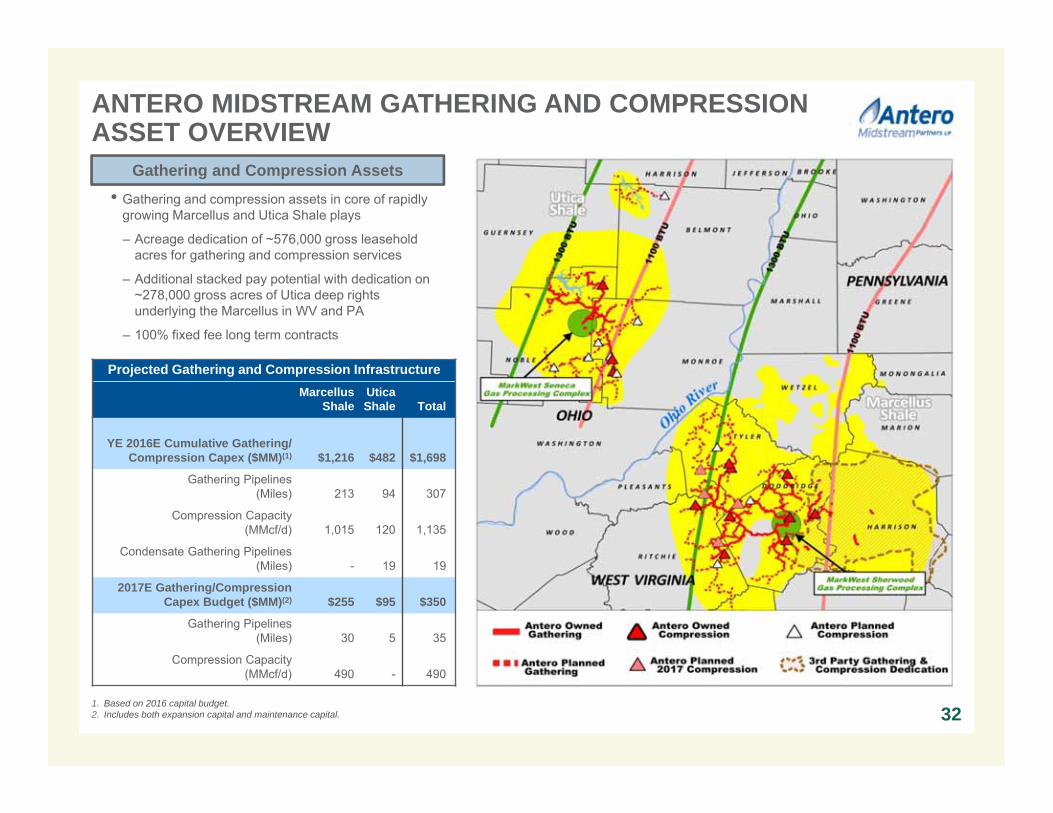
ANTERO MIDSTREAM GATHERING AND COMPRESSION ASSET OVERVIEW
1. Based on 2016 capital budget.2. Includes both expansion capital and maintenance capital.
• Gathering and compression assets in core of rapidly growing Marcellus and Utica Shale plays
– Acreage dedication of ~576,000 gross leasehold acres for gathering and compression services
– Additional stacked pay potential with dedication on ~278,000 gross acres of Utica deep rights underlying the Marcellus in WV and PA
– 100% fixed fee long term contracts
Projected Gathering and Compression InfrastructureMarcellus
ShaleUtica Shale Total
YE 2016E Cumulative Gathering/ Compression Capex ($MM)(1) $1,216 $482 $1,698
Gathering Pipelines(Miles) 213 94 307
Compression Capacity(MMcf/d) 1,015 120 1,135
Condensate Gathering Pipelines (Miles) - 19 19
2017E Gathering/Compression Capex Budget ($MM)(2) $255 $95 $350
Gathering Pipelines (Miles) 30 5 35
Compression Capacity(MMcf/d) 490 - 490
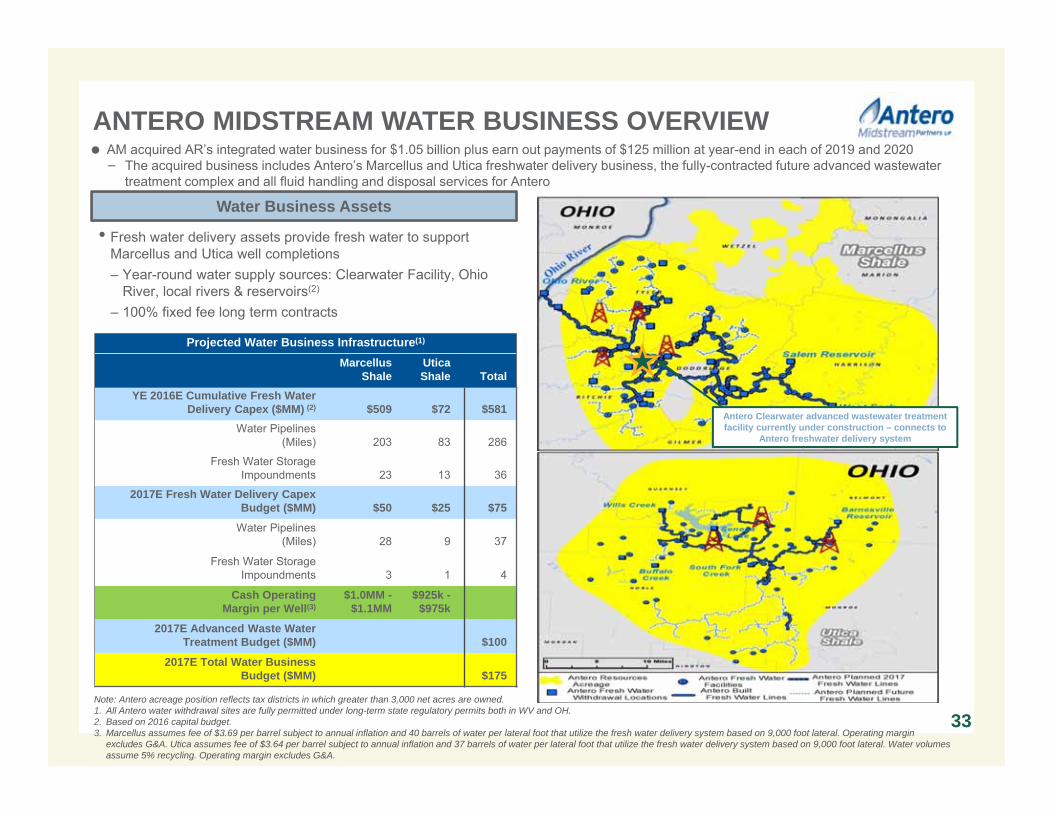
ANTERO MIDSTREAM WATER BUSINESS OVERVIEW
Water Business Assets
AM acquired AR’s integrated water business for $1.05 billion plus earn out payments of $125 million at year-end in each of 2019 and 2020− The acquired business includes Antero’s Marcellus and Utica freshwater delivery business, the fully-contracted future advanced wastewater
treatment complex and all fluid handling and disposal services for Antero
• Fresh water delivery assets provide fresh water to support Marcellus and Utica well completions– Year-round water supply sources: Clearwater Facility, Ohio
River, local rivers & reservoirs(2)
– 100% fixed fee long term contracts
Note: Antero acreage position reflects tax districts in which greater than 3,000 net acres are owned.1. All Antero water withdrawal sites are fully permitted under long-term state regulatory permits both in WV and OH. 2. Based on 2016 capital budget. 3. Marcellus assumes fee of $3.69 per barrel subject to annual inflation and 40 barrels of water per lateral foot that utilize the fresh water delivery system based on 9,000 foot lateral. Operating margin
excludes G&A. Utica assumes fee of $3.64 per barrel subject to annual inflation and 37 barrels of water per lateral foot that utilize the fresh water delivery system based on 9,000 foot lateral. Water volumes assume 5% recycling. Operating margin excludes G&A.
Antero Clearwater advanced wastewater treatment facility currently under construction – connects to
Antero freshwater delivery system
Projected Water Business Infrastructure(1)
Marcellus Shale
Utica Shale Total
YE 2016E Cumulative Fresh WaterDelivery Capex ($MM) (2) $509 $72 $581
Water Pipelines(Miles) 203 83 286
Fresh Water StorageImpoundments 23 13 36
2017E Fresh Water Delivery Capex Budget ($MM) $50 $25 $75
Water Pipelines(Miles) 28 9 37
Fresh Water StorageImpoundments 3 1 4
Cash Operating Margin per Well(3)
$1.0MM -$1.1MM
$925k -$975k
2017E Advanced Waste Water Treatment Budget ($MM) $100
2017E Total Water Business Budget ($MM) $175
33
$8 $11$19
$28$36 $41
$55
$83 $80$88
$111
$0
$20
$40
$60
$80
$100
$120
$140 EBITDA
36 41116
222358
454 435 478606 658
777
0
200
400
600
800
1,000
1,200
126266
531
9081,134 1,197 1,216 1,195 1,222 1,253
1,351
0200400600800
1,0001,2001,4001,6001,8002,000
331 386532
738935 965 1,038 1,124
1,303 1,353 1,431
0200400600800
1,0001,2001,4001,6001,8002,000
Low Pressure Gathering (MMcf/d)
Compression (MMcf/d)
High Pressure Gathering (MMcf/d)
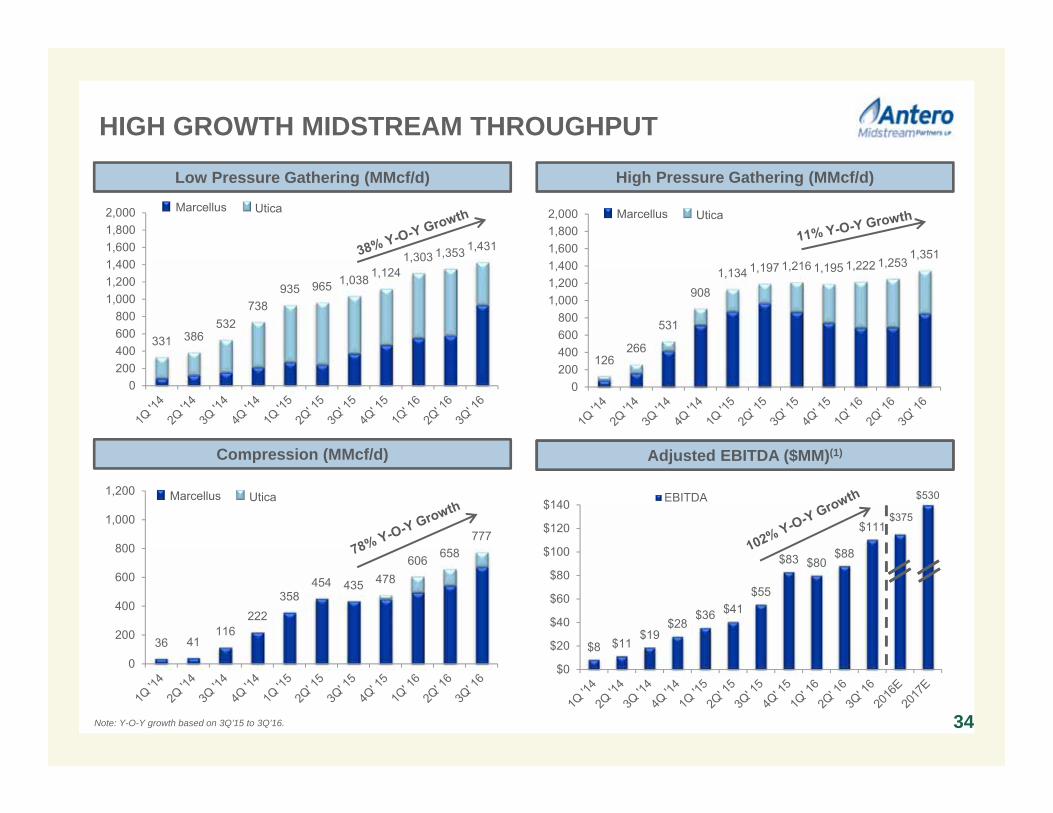
Note: Y-O-Y growth based on 3Q’15 to 3Q’16.
HIGH GROWTH MIDSTREAM THROUGHPUT
Fresh Water Delivery (MBbl/d)
Marcellus Utica
Marcellus Utica
Marcellus Utica
Adjusted EBITDA ($MM)(1)
$530
$375
34
2.2x
0.0x
0.5x
1.0x
1.5x
2.0x
2.5x
3.0x
3.5x
4.0x
Peer 1 Peer 2 Peer 3 Peer 4 Peer 5 Peer 6 Peer 7
Net
Deb
t / L
TM E
BIT
DA
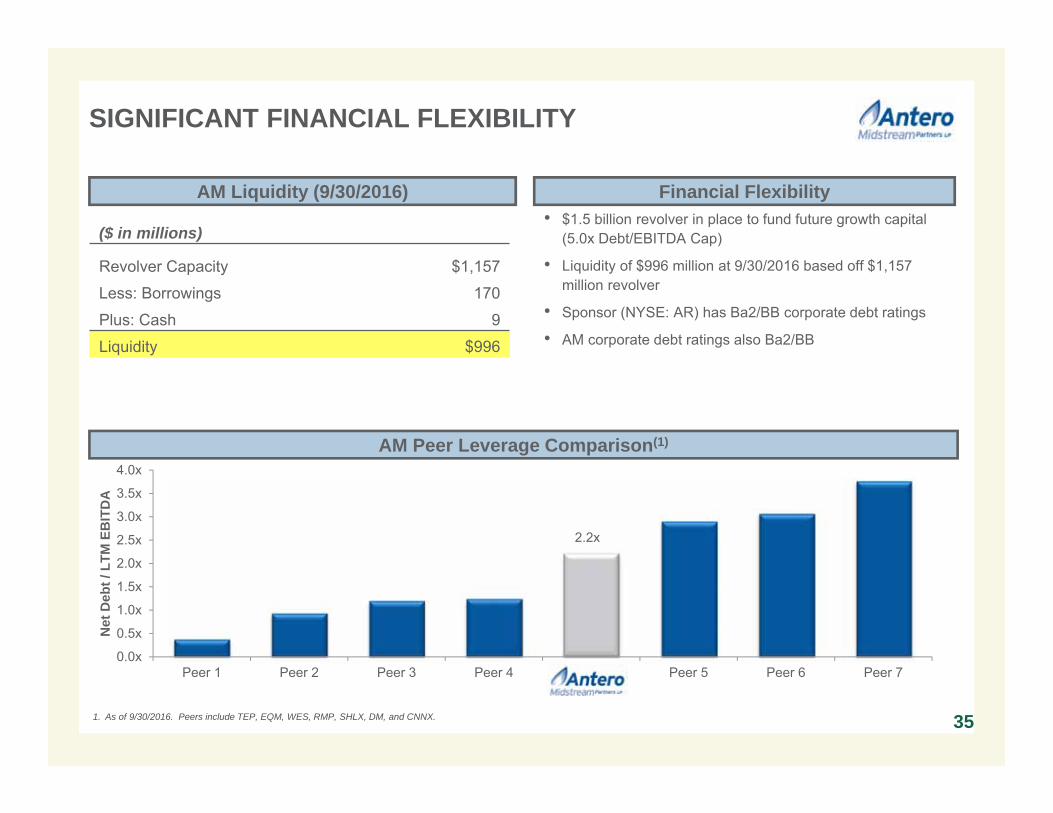
• $1.5 billion revolver in place to fund future growth capital (5.0x Debt/EBITDA Cap)
• Liquidity of $996 million at 9/30/2016 based off $1,157 million revolver
• Sponsor (NYSE: AR) has Ba2/BB corporate debt ratings
• AM corporate debt ratings also Ba2/BB
AM Liquidity (9/30/2016)
AM Peer Leverage Comparison(1)
($ in millions)
Revolver Capacity $1,157
Less: Borrowings 170
Plus: Cash 9
Liquidity $996
1. As of 9/30/2016. Peers include TEP, EQM, WES, RMP, SHLX, DM, and CNNX.
Financial Flexibility
SIGNIFICANT FINANCIAL FLEXIBILITY
35
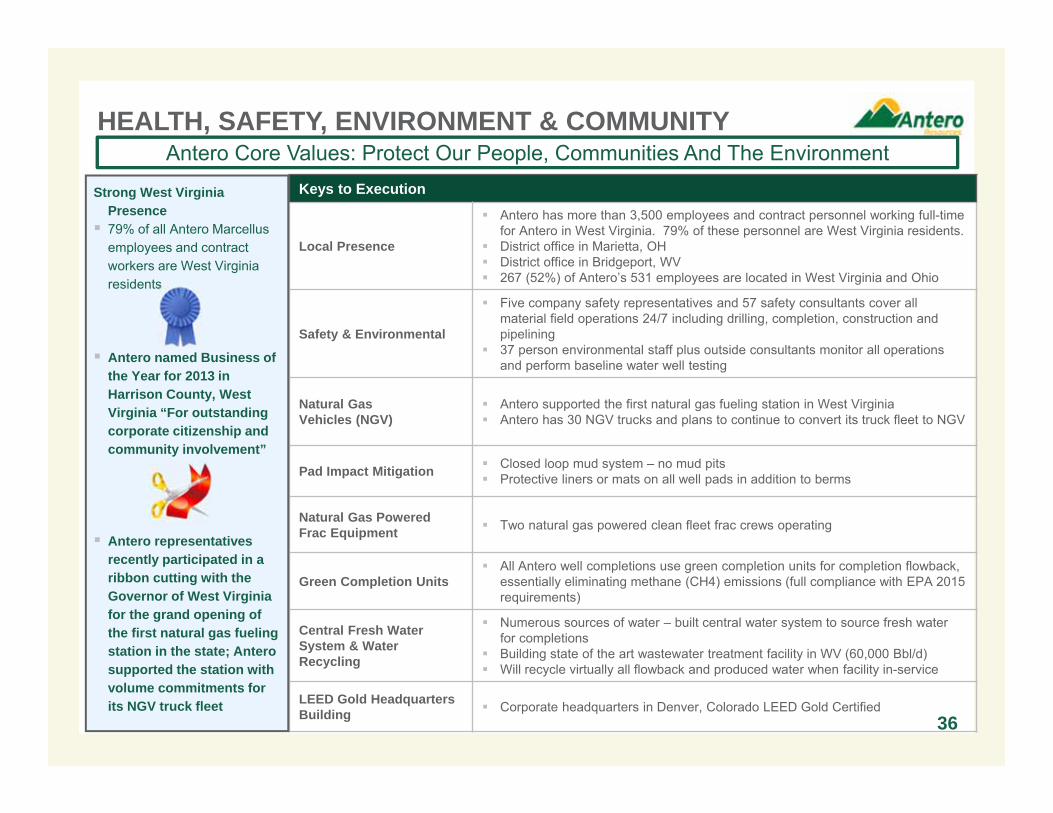
Keys to Execution
Local Presence
Antero has more than 3,500 employees and contract personnel working full-time for Antero in West Virginia. 79% of these personnel are West Virginia residents.
District office in Marietta, OH District office in Bridgeport, WV 267 (52%) of Antero’s 531 employees are located in West Virginia and Ohio
Safety & Environmental
Five company safety representatives and 57 safety consultants cover all material field operations 24/7 including drilling, completion, construction and pipelining
37 person environmental staff plus outside consultants monitor all operations and perform baseline water well testing
Natural Gas Vehicles (NGV)
Antero supported the first natural gas fueling station in West Virginia Antero has 30 NGV trucks and plans to continue to convert its truck fleet to NGV
Pad Impact Mitigation Closed loop mud system – no mud pits Protective liners or mats on all well pads in addition to berms
Natural Gas PoweredFrac Equipment Two natural gas powered clean fleet frac crews operating
Green Completion Units All Antero well completions use green completion units for completion flowback,
essentially eliminating methane (CH4) emissions (full compliance with EPA 2015requirements)
Central Fresh Water System & Water Recycling
Numerous sources of water – built central water system to source fresh water for completions
Building state of the art wastewater treatment facility in WV (60,000 Bbl/d) Will recycle virtually all flowback and produced water when facility in-service
LEED Gold Headquarters Building Corporate headquarters in Denver, Colorado LEED Gold Certified
HEALTH, SAFETY, ENVIRONMENT & COMMUNITYAntero Core Values: Protect Our People, Communities And The Environment
Strong West Virginia Presence 79% of all Antero Marcellus
employees and contract workers are West Virginia residents
Antero named Business of the Year for 2013 in Harrison County, West Virginia “For outstanding corporate citizenship and community involvement”
Antero representatives recently participated in a ribbon cutting with the Governor of West Virginia for the grand opening of the first natural gas fueling station in the state; Antero supported the station with volume commitments for its NGV truck fleet
36
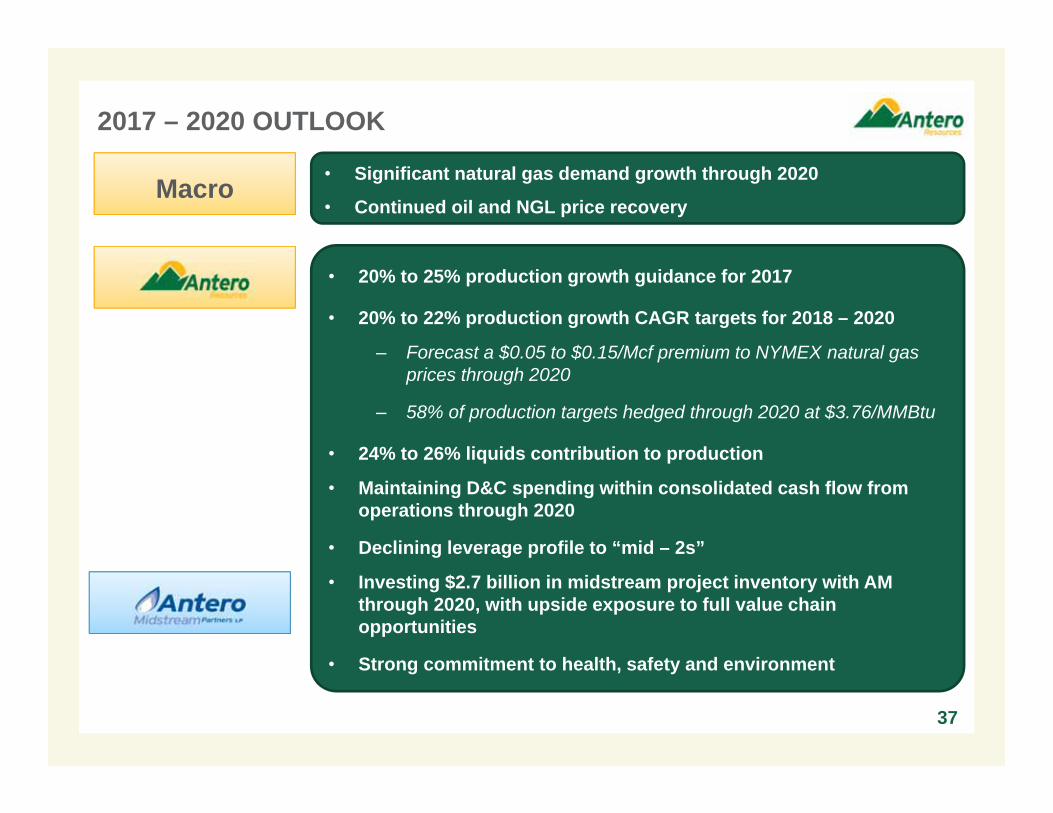
2017 – 2020 OUTLOOK
37
Macro • Significant natural gas demand growth through 2020
• Continued oil and NGL price recovery
• 20% to 25% production growth guidance for 2017
• 20% to 22% production growth CAGR targets for 2018 – 2020
‒ Forecast a $0.05 to $0.15/Mcf premium to NYMEX natural gas prices through 2020
‒ 58% of production targets hedged through 2020 at $3.76/MMBtu
• 24% to 26% liquids contribution to production
• Maintaining D&C spending within consolidated cash flow from operations through 2020
• Declining leverage profile to “mid – 2s”
• Investing $2.7 billion in midstream project inventory with AM through 2020, with upside exposure to full value chain opportunities
• Strong commitment to health, safety and environment
38
APPENDIX
38
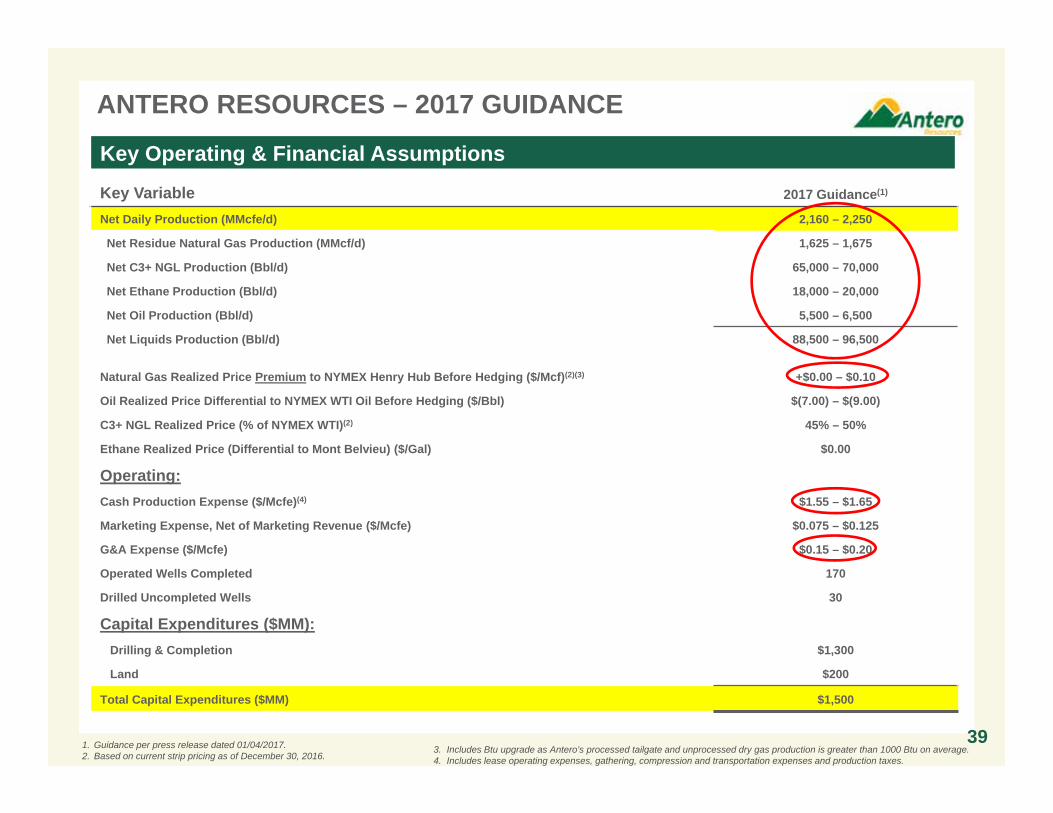
ANTERO RESOURCES – 2017 GUIDANCE
Key Variable 2017 Guidance(1)
Net Daily Production (MMcfe/d) 2,160 – 2,250
Net Residue Natural Gas Production (MMcf/d) 1,625 – 1,675
Net C3+ NGL Production (Bbl/d) 65,000 – 70,000
Net Ethane Production (Bbl/d) 18,000 – 20,000
Net Oil Production (Bbl/d) 5,500 – 6,500
Net Liquids Production (Bbl/d) 88,500 – 96,500
Natural Gas Realized Price Premium to NYMEX Henry Hub Before Hedging ($/Mcf)(2)(3) +$0.00 – $0.10
Oil Realized Price Differential to NYMEX WTI Oil Before Hedging ($/Bbl) $(7.00) – $(9.00)
C3+ NGL Realized Price (% of NYMEX WTI)(2) 45% – 50%
Ethane Realized Price (Differential to Mont Belvieu) ($/Gal) $0.00
Operating:Cash Production Expense ($/Mcfe)(4) $1.55 – $1.65
Marketing Expense, Net of Marketing Revenue ($/Mcfe) $0.075 – $0.125
G&A Expense ($/Mcfe) $0.15 – $0.20
Operated Wells Completed 170
Drilled Uncompleted Wells 30
Capital Expenditures ($MM):Drilling & Completion $1,300
Land $200
Total Capital Expenditures ($MM) $1,500
Key Operating & Financial Assumptions
3. Includes Btu upgrade as Antero’s processed tailgate and unprocessed dry gas production is greater than 1000 Btu on average. 4. Includes lease operating expenses, gathering, compression and transportation expenses and production taxes.
1. Guidance per press release dated 01/04/2017. 2. Based on current strip pricing as of December 30, 2016.
39
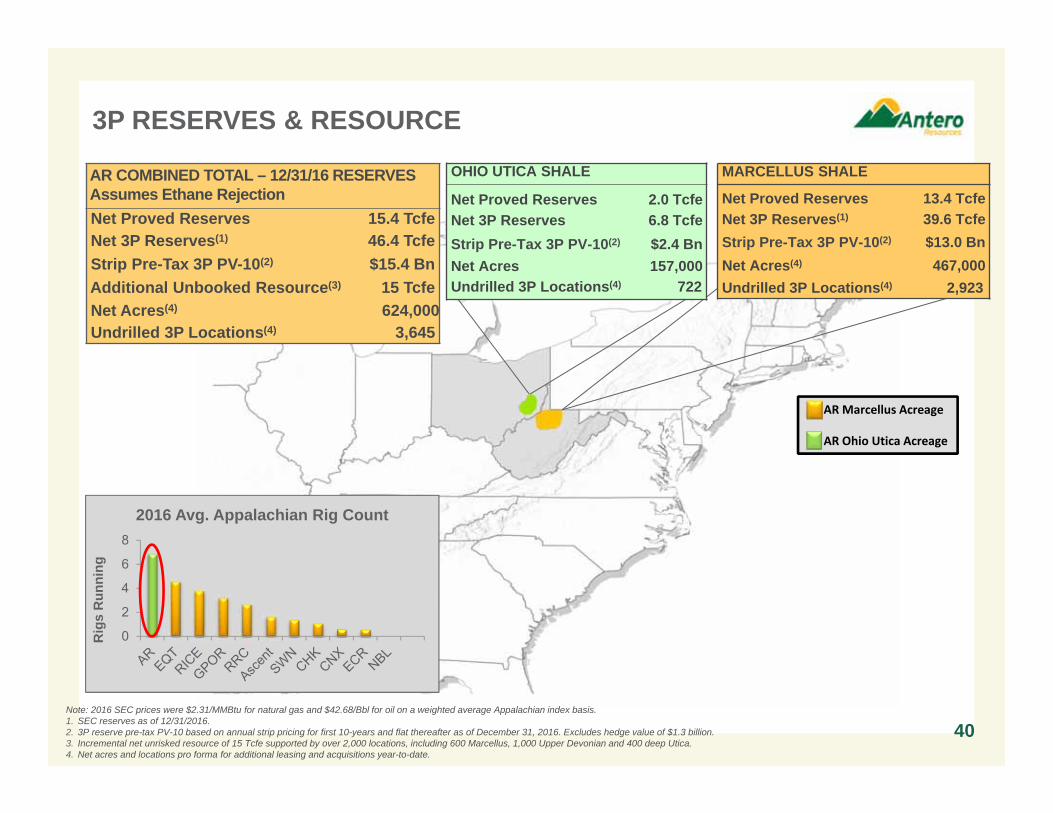
Note: 2016 SEC prices were $2.31/MMBtu for natural gas and $42.68/Bbl for oil on a weighted average Appalachian index basis. 1. SEC reserves as of 12/31/2016. 2. 3P reserve pre-tax PV-10 based on annual strip pricing for first 10-years and flat thereafter as of December 31, 2016. Excludes hedge value of $1.3 billion.3. Incremental net unrisked resource of 15 Tcfe supported by over 2,000 locations, including 600 Marcellus, 1,000 Upper Devonian and 400 deep Utica. 4. Net acres and locations pro forma for additional leasing and acquisitions year-to-date.
40
3P RESERVES & RESOURCE
AR Marcellus Acreage
AR Ohio Utica Acreage
0
2
4
6
8
Rig
s R
unni
ng
2016 Avg. Appalachian Rig Count
OHIO UTICA SHALE
Net Proved Reserves 2.0 TcfeNet 3P Reserves 6.8 TcfeStrip Pre-Tax 3P PV-10(2) $2.4 BnNet Acres 157,000Undrilled 3P Locations(4) 722
MARCELLUS SHALE
Net Proved Reserves 13.4 TcfeNet 3P Reserves(1) 39.6 TcfeStrip Pre-Tax 3P PV-10(2) $13.0 BnNet Acres(4) 467,000Undrilled 3P Locations(4) 2,923
AR COMBINED TOTAL – 12/31/16 RESERVESAssumes Ethane RejectionNet Proved Reserves 15.4 TcfeNet 3P Reserves(1) 46.4 TcfeStrip Pre-Tax 3P PV-10(2) $15.4 BnAdditional Unbooked Resource(3) 15 TcfeNet Acres(4) 624,000Undrilled 3P Locations(4) 3,645
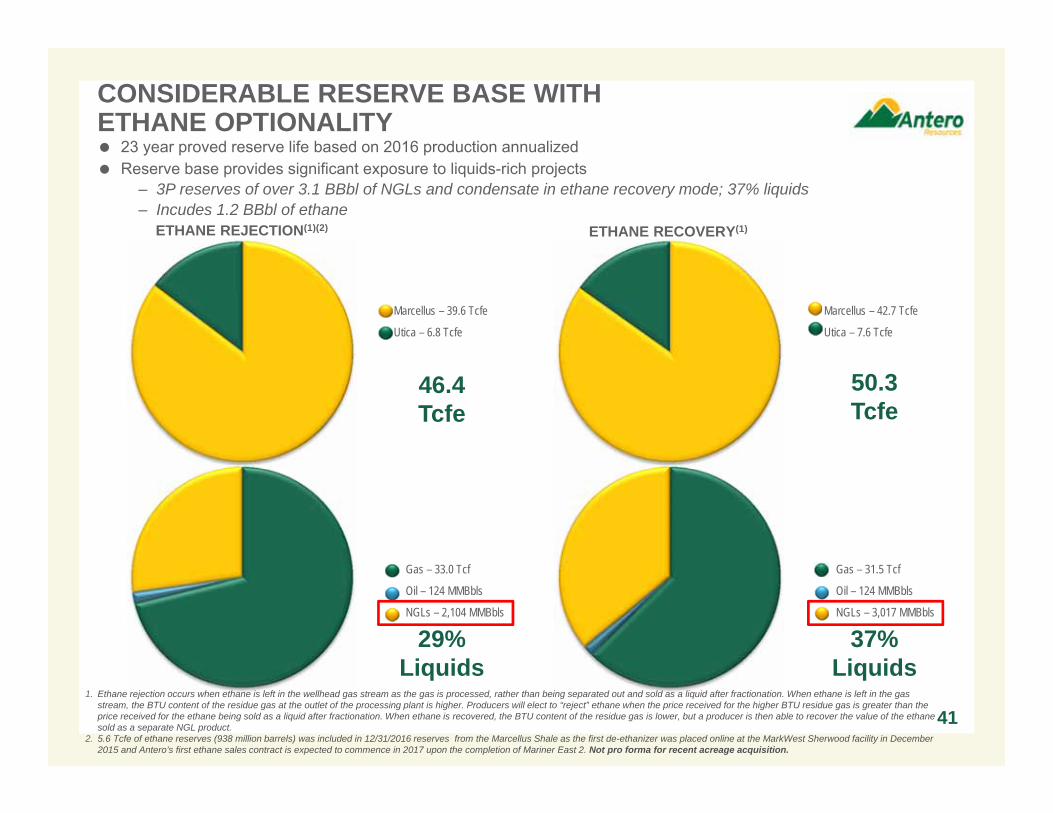
Gas – 31.5 Tcf
Oil – 124 MMBbls
NGLs – 3,017 MMBbls
Gas – 33.0 Tcf
Oil – 124 MMBbls
NGLs – 2,104 MMBbls
CONSIDERABLE RESERVE BASE WITH ETHANE OPTIONALITY 23 year proved reserve life based on 2016 production annualized Reserve base provides significant exposure to liquids-rich projects
– 3P reserves of over 3.1 BBbl of NGLs and condensate in ethane recovery mode; 37% liquids– Incudes 1.2 BBbl of ethane
1. Ethane rejection occurs when ethane is left in the wellhead gas stream as the gas is processed, rather than being separated out and sold as a liquid after fractionation. When ethane is left in the gas stream, the BTU content of the residue gas at the outlet of the processing plant is higher. Producers will elect to “reject” ethane when the price received for the higher BTU residue gas is greater than the price received for the ethane being sold as a liquid after fractionation. When ethane is recovered, the BTU content of the residue gas is lower, but a producer is then able to recover the value of the ethane sold as a separate NGL product.
2. 5.6 Tcfe of ethane reserves (938 million barrels) was included in 12/31/2016 reserves from the Marcellus Shale as the first de-ethanizer was placed online at the MarkWest Sherwood facility in December 2015 and Antero’s first ethane sales contract is expected to commence in 2017 upon the completion of Mariner East 2. Not pro forma for recent acreage acquisition.
ETHANE REJECTION(1)(2) ETHANE RECOVERY(1)
41
Marcellus – 39.6 Tcfe
Utica – 6.8 Tcfe
46.4Tcfe
Marcellus – 42.7 Tcfe
Utica – 7.6 Tcfe
50.3Tcfe
29%Liquids
37%Liquids
$5.3 $4.6 $5.3 $4.7 $4.7 $4.7 $4.0 $3.9 $3.6
$8.7 $7.8 $7.6
$7.1 $7.1 $5.6
$5.4 $5.2 $5.3
$14.0 $12.4 $12.9
$11.8 $11.8 $10.3
$9.4 $9.1 $8.9
$-
$2.0
$4.0
$6.0
$8.0
$10.0
$12.0
$14.0
$16.0
Q4 2014 Q1 2015 Q2 2015 Q3 2015 Q4 2015 Q1 2016 Q2 2016 Q3 2016 Q4 2016
($M
M)
COMPLETION COST DRILLING COST
$4.0 $3.8 $3.4 $3.2 $3.2 $3.1 $2.8 $2.6 $2.6
$8.3 $7.3 $7.4 $7.0 $7.0
$5.4 $5.3 $5.2 $5.0
$12.3
$11.1 $10.8 $10.2 $10.2
$8.5 $8.1 $7.8 $7.6
$-
$2.0
$4.0
$6.0
$8.0
$10.0
$12.0
$14.0
Q4 2014 Q1 2015 Q2 2015 Q3 2015 Q4 2015 Q1 2016 Q2 2016 Q3 2016 Q4 2016
($M
M)
COMPLETION COST DRILLING COST
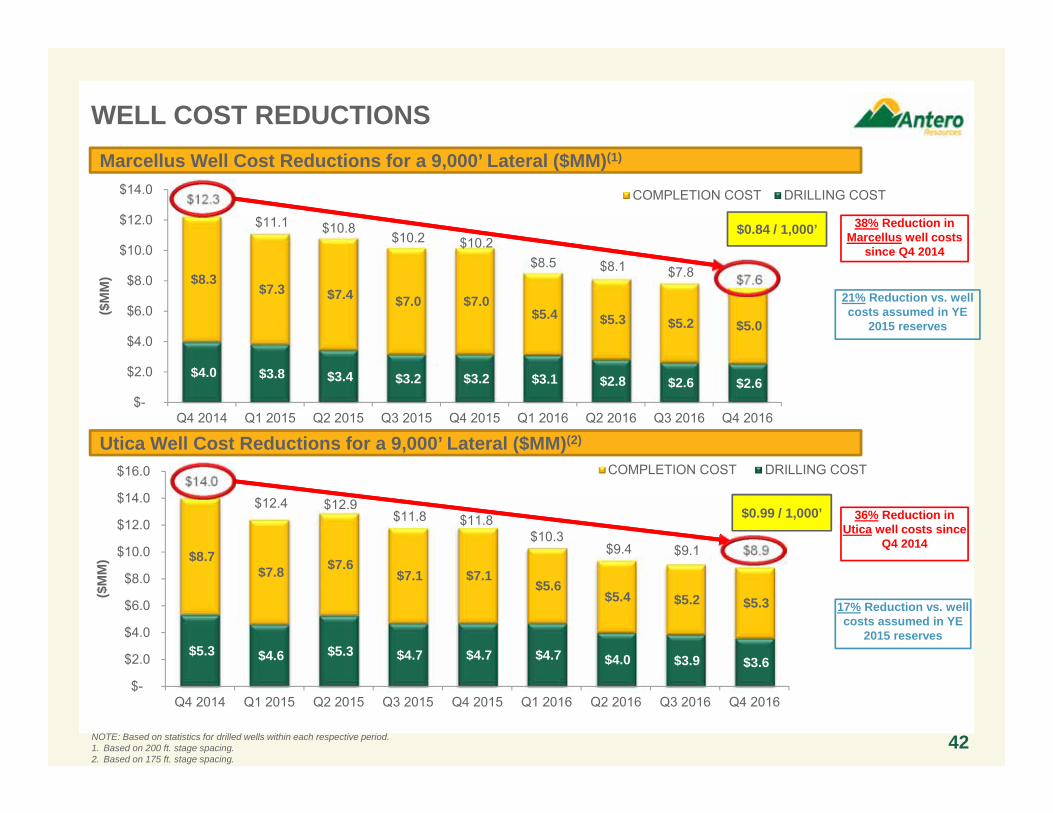
WELL COST REDUCTIONS
42NOTE: Based on statistics for drilled wells within each respective period.1. Based on 200 ft. stage spacing.2. Based on 175 ft. stage spacing.
36% Reduction in Utica well costs since
Q4 2014
38% Reduction in Marcellus well costs
since Q4 2014
21% Reduction vs. well costs assumed in YE
2015 reserves
17% Reduction vs. well costs assumed in YE
2015 reserves
$0.84 / 1,000’
$0.99 / 1,000’
Marcellus Well Cost Reductions for a 9,000’ Lateral ($MM)(1)
Utica Well Cost Reductions for a 9,000’ Lateral ($MM)(2)
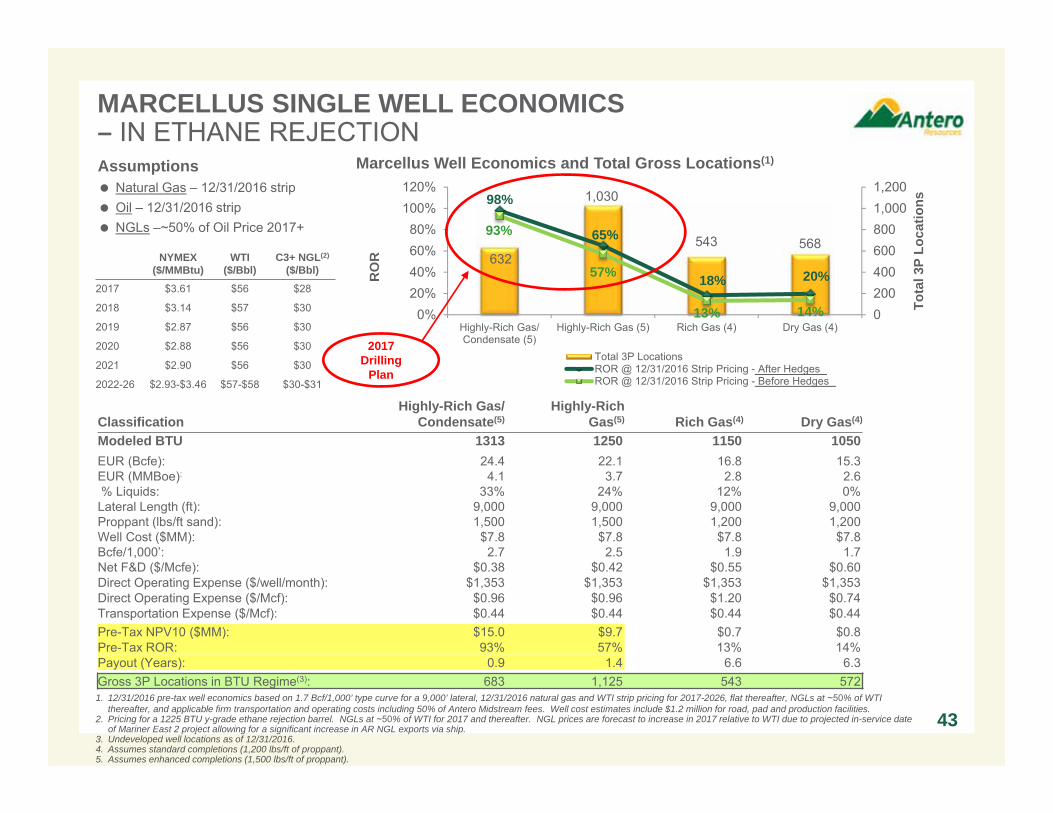
1. 12/31/2016 pre-tax well economics based on 1.7 Bcf/1,000’ type curve for a 9,000’ lateral, 12/31/2016 natural gas and WTI strip pricing for 2017-2026, flat thereafter, NGLs at ~50% of WTI thereafter, and applicable firm transportation and operating costs including 50% of Antero Midstream fees. Well cost estimates include $1.2 million for road, pad and production facilities.
2. Pricing for a 1225 BTU y-grade ethane rejection barrel. NGLs at ~50% of WTI for 2017 and thereafter. NGL prices are forecast to increase in 2017 relative to WTI due to projected in-service date of Mariner East 2 project allowing for a significant increase in AR NGL exports via ship.
3. Undeveloped well locations as of 12/31/2016. 4. Assumes standard completions (1,200 lbs/ft of proppant).5. Assumes enhanced completions (1,500 lbs/ft of proppant).
632
1,030
543 568
98%
65%
18% 20%
93%
57%
13% 14% 02004006008001,0001,200
0%20%40%60%80%
100%120%
Highly-Rich Gas/Condensate (5)
Highly-Rich Gas (5) Rich Gas (4) Dry Gas (4)
Tota
l 3P
Loca
tions
RO
RTotal 3P LocationsROR @ 12/31/2016 Strip Pricing - After HedgesROR @ 12/31/2016 Strip Pricing - Before Hedges
MARCELLUS SINGLE WELL ECONOMICS – IN ETHANE REJECTION
43
DRY GAS LOCATIONS RICH GAS LOCATIONS
HIGHLY RICH GAS
LOCATIONS
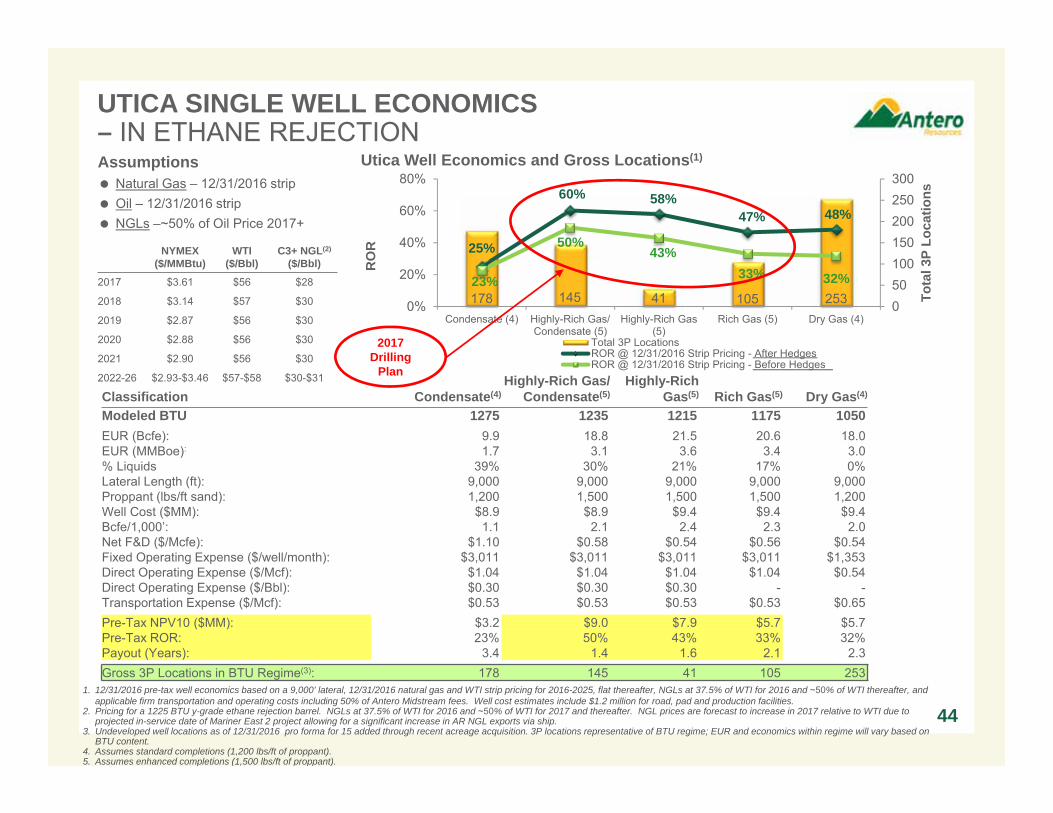
Assumptions Natural Gas – 12/31/2016 strip Oil – 12/31/2016 strip NGLs –~50% of Oil Price 2017+
NYMEX($/MMBtu)
WTI($/Bbl)
C3+ NGL(2)
($/Bbl)
2017 $3.61 $56 $28
2018 $3.14 $57 $30
2019 $2.87 $56 $30
2020 $2.88 $56 $30
2021 $2.90 $56 $30
2022-26 $2.93-$3.46 $57-$58 $30-$31
Marcellus Well Economics and Total Gross Locations(1)
ClassificationHighly-Rich Gas/
Condensate(5)Highly-Rich
Gas(5) Rich Gas(4) Dry Gas(4)
Modeled BTU 1313 1250 1150 1050EUR (Bcfe): 24.4 22.1 16.8 15.3EUR (MMBoe): 4.1 3.7 2.8 2.6% Liquids: 33% 24% 12% 0%
Lateral Length (ft): 9,000 9,000 9,000 9,000Proppant (lbs/ft sand): 1,500 1,500 1,200 1,200Well Cost ($MM): $7.8 $7.8 $7.8 $7.8Bcfe/1,000’: 2.7 2.5 1.9 1.7Net F&D ($/Mcfe): $0.38 $0.42 $0.55 $0.60Direct Operating Expense ($/well/month): $1,353 $1,353 $1,353 $1,353Direct Operating Expense ($/Mcf): $0.96 $0.96 $1.20 $0.74Transportation Expense ($/Mcf): $0.44 $0.44 $0.44 $0.44Pre-Tax NPV10 ($MM): $15.0 $9.7 $0.7 $0.8Pre-Tax ROR: 93% 57% 13% 14%Payout (Years): 0.9 1.4 6.6 6.3Gross 3P Locations in BTU Regime(3): 683 1,125 543 572
2017Drilling
Plan
178 145 41 105 253
25%
60% 58%47% 48%
23%
50%43%
33% 32%
050100150200250300
0%
20%
40%
60%
80%
Condensate (4) Highly-Rich Gas/Condensate (5)
Highly-Rich Gas(5)
Rich Gas (5) Dry Gas (4)
Tota
l 3P
Loca
tions
RO
R
Total 3P LocationsROR @ 12/31/2016 Strip Pricing - After HedgesROR @ 12/31/2016 Strip Pricing - Before Hedges
UTICA SINGLE WELL ECONOMICS – IN ETHANE REJECTION
44
DRY GAS LOCATIONS RICH GAS LOCATIONS
HIGHLY RICH GAS
LOCATIONS
Utica Well Economics and Gross Locations(1)
Classification Condensate(4)Highly-Rich Gas/
Condensate(5)Highly-Rich
Gas(5) Rich Gas(5) Dry Gas(4)
Modeled BTU 1275 1235 1215 1175 1050EUR (Bcfe): 9.9 18.8 21.5 20.6 18.0EUR (MMBoe): 1.7 3.1 3.6 3.4 3.0% Liquids 39% 30% 21% 17% 0%Lateral Length (ft): 9,000 9,000 9,000 9,000 9,000Proppant (lbs/ft sand): 1,200 1,500 1,500 1,500 1,200Well Cost ($MM): $8.9 $8.9 $9.4 $9.4 $9.4Bcfe/1,000’: 1.1 2.1 2.4 2.3 2.0Net F&D ($/Mcfe): $1.10 $0.58 $0.54 $0.56 $0.54Fixed Operating Expense ($/well/month): $3,011 $3,011 $3,011 $3,011 $1,353Direct Operating Expense ($/Mcf): $1.04 $1.04 $1.04 $1.04 $0.54Direct Operating Expense ($/Bbl): $0.30 $0.30 $0.30 - -Transportation Expense ($/Mcf): $0.53 $0.53 $0.53 $0.53 $0.65Pre-Tax NPV10 ($MM): $3.2 $9.0 $7.9 $5.7 $5.7Pre-Tax ROR: 23% 50% 43% 33% 32%Payout (Years): 3.4 1.4 1.6 2.1 2.3Gross 3P Locations in BTU Regime(3): 178 145 41 105 253
1. 12/31/2016 pre-tax well economics based on a 9,000’ lateral, 12/31/2016 natural gas and WTI strip pricing for 2016-2025, flat thereafter, NGLs at 37.5% of WTI for 2016 and ~50% of WTI thereafter, and applicable firm transportation and operating costs including 50% of Antero Midstream fees. Well cost estimates include $1.2 million for road, pad and production facilities.
2. Pricing for a 1225 BTU y-grade ethane rejection barrel. NGLs at 37.5% of WTI for 2016 and ~50% of WTI for 2017 and thereafter. NGL prices are forecast to increase in 2017 relative to WTI due to projected in-service date of Mariner East 2 project allowing for a significant increase in AR NGL exports via ship.
3. Undeveloped well locations as of 12/31/2016 pro forma for 15 added through recent acreage acquisition. 3P locations representative of BTU regime; EUR and economics within regime will vary based on BTU content.
4. Assumes standard completions (1,200 lbs/ft of proppant).5. Assumes enhanced completions (1,500 lbs/ft of proppant).
2017Drilling
Plan
Assumptions Natural Gas – 12/31/2016 strip Oil – 12/31/2016 strip NGLs –~50% of Oil Price 2017+
NYMEX($/MMBtu)
WTI($/Bbl)
C3+ NGL(2)
($/Bbl)
2017 $3.61 $56 $28
2018 $3.14 $57 $30
2019 $2.87 $56 $30
2020 $2.88 $56 $30
2021 $2.90 $56 $30
2022-26 $2.93-$3.46 $57-$58 $30-$31
$4 $5$25 $34 $29 $28 $26 $12 $16 $17 $28 $29 $19 $25 $43
$80 $83$59 $49 $48
$14$47 $54
$1
$58$78
$185 $196 $206
$270
$324$293
$197 $190
($2.00)($1.00)$0.00$1.00$2.00$3.00$4.00
$0.0
$70.0
$140.0
$210.0
$280.0
$350.0
2,163 2,015 2,330 1,378 660 760
$3.51$3.91 $3.70 $3.66 $3.35 $3.21
$3.61$3.14 $2.87 $2.88 $2.90 $2.93
$0.00
$1.00
$2.00
$3.00
$4.00
$5.00
$6.00
0
400
800
1,200
1,600
2,000
2,400
2017 2018 2019 2020 2021 2022
BBtu/d $/MMBtuAverage Index Hedge Price(1)Hedged Volume Current NYMEX Strip(2)
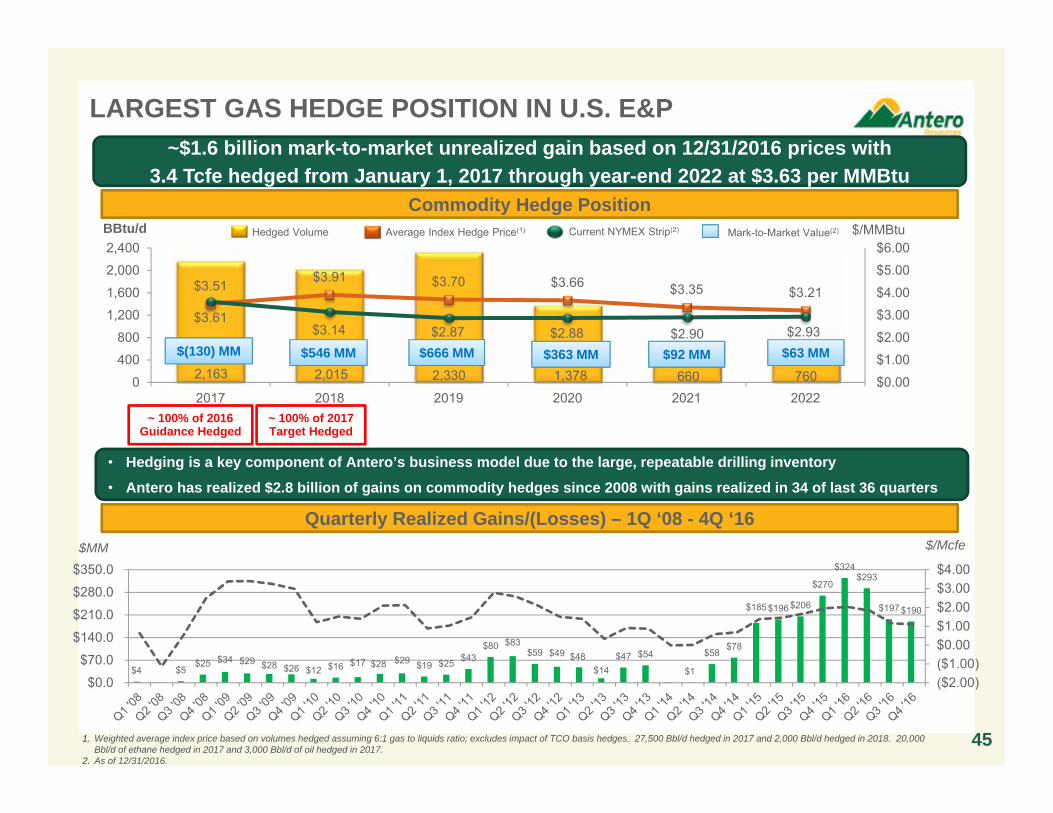
Commodity Hedge Position
$(130) MM $546 MM $666 MM $363 MM $92 MM
Mark-to-Market Value(2)
LARGEST GAS HEDGE POSITION IN U.S. E&P
~ 100% of 2016 Guidance Hedged
451. Weighted average index price based on volumes hedged assuming 6:1 gas to liquids ratio; excludes impact of TCO basis hedges. 27,500 Bbl/d hedged in 2017 and 2,000 Bbl/d hedged in 2018. 20,000 Bbl/d of ethane hedged in 2017 and 3,000 Bbl/d of oil hedged in 2017.
2. As of 12/31/2016.
$/Mcfe
$63 MM
~ 100% of 2017 Target Hedged
~$1.6 billion mark-to-market unrealized gain based on 12/31/2016 prices with3.4 Tcfe hedged from January 1, 2017 through year-end 2022 at $3.63 per MMBtu
• Hedging is a key component of Antero’s business model due to the large, repeatable drilling inventory
• Antero has realized $2.8 billion of gains on commodity hedges since 2008 with gains realized in 34 of last 36 quarters
Quarterly Realized Gains/(Losses) – 1Q ‘08 - 4Q ‘16$MM
$0.00
$1.00
$2.00
$3.00
$4.00
$5.00
$6.00
($50)
$0
$50
$100
$150
$200
$250
$300
$MM
46
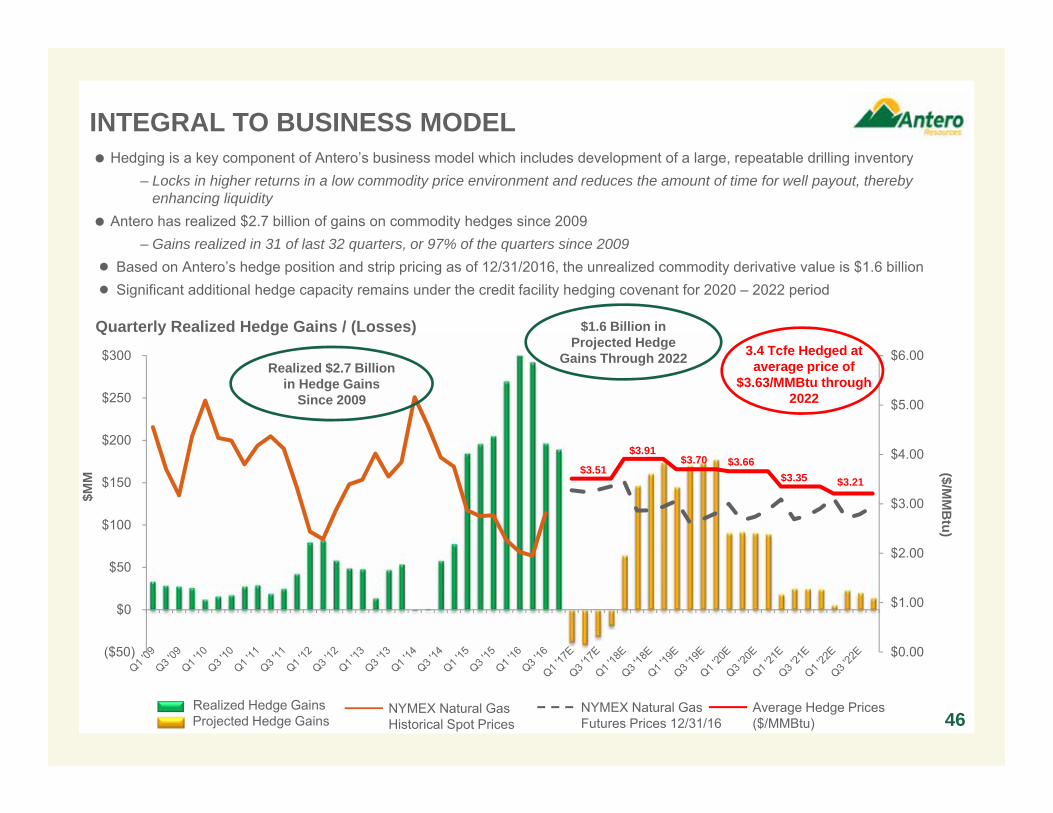
Hedging is a key component of Antero’s business model which includes development of a large, repeatable drilling inventory– Locks in higher returns in a low commodity price environment and reduces the amount of time for well payout, thereby
enhancing liquidity Antero has realized $2.7 billion of gains on commodity hedges since 2009
– Gains realized in 31 of last 32 quarters, or 97% of the quarters since 2009● Based on Antero’s hedge position and strip pricing as of 12/31/2016, the unrealized commodity derivative value is $1.6 billion● Significant additional hedge capacity remains under the credit facility hedging covenant for 2020 – 2022 period
Quarterly Realized Hedge Gains / (Losses)
Realized Hedge GainsProjected Hedge Gains
NYMEX Natural Gas Historical Spot Prices
($/MM
Btu)
NYMEX Natural Gas Futures Prices 12/31/16
3.4 Tcfe Hedged at average price of
$3.63/MMBtu through 2022
Average Hedge Prices ($/MMBtu)
$3.35$3.51
$3.91$3.70 $3.66
$3.21
$1.6 Billion in Projected Hedge
Gains Through 2022Realized $2.7 Billion
in Hedge Gains Since 2009
INTEGRAL TO BUSINESS MODEL
$1,000 $1,100
$750 $650 $600
$0
$200
$400
$600
$800
$1,000
$1,200
2016 2017 2018 2019 2020 2021 2022 2023 2024 2025
($ in
Mill
ions
)
$1,157 $996
($170) $0 $9
$0
$300
$600
$900
$1,200
$1,500
Credit Facility9/30/2016
Bank Debt9/30/2016
L/CsOutstanding9/30/2016
Cash9/30/2016
Liquidity9/30/2016
47
$4,000$3,093
($208)($709) $10
$0
$1,000
$2,000
$3,000
$4,000
Credit Facility9/30/2016
Bank Debt9/30/2016
L/Cs Outstanding9/30/2016
Cash9/30/2016
Liquidity9/30/2016
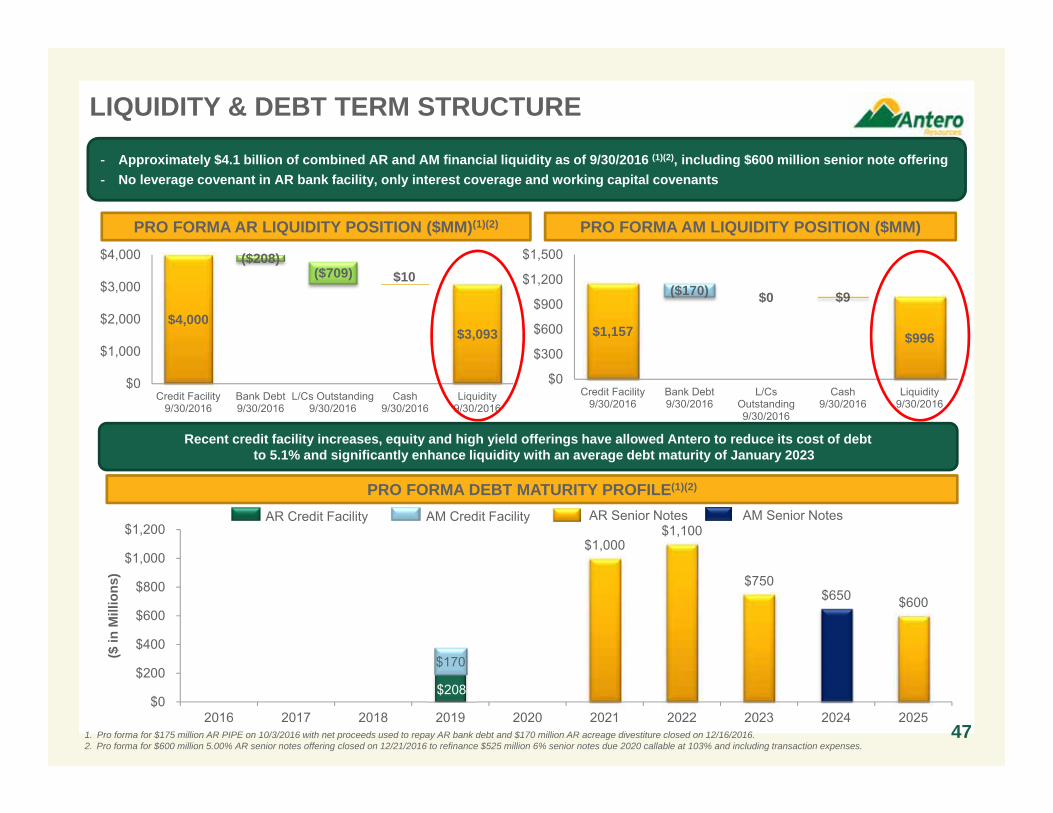
PRO FORMA AR LIQUIDITY POSITION ($MM)(1)(2) PRO FORMA AM LIQUIDITY POSITION ($MM)
AR Credit Facility AR Senior Notes
PRO FORMA DEBT MATURITY PROFILE(1)(2)
AM Credit Facility
$170
1. Pro forma for $175 million AR PIPE on 10/3/2016 with net proceeds used to repay AR bank debt and $170 million AR acreage divestiture closed on 12/16/2016.2. Pro forma for $600 million 5.00% AR senior notes offering closed on 12/21/2016 to refinance $525 million 6% senior notes due 2020 callable at 103% and including transaction expenses.
AM Senior Notes
LIQUIDITY & DEBT TERM STRUCTURE
- Approximately $4.1 billion of combined AR and AM financial liquidity as of 9/30/2016 (1)(2), including $600 million senior note offering - No leverage covenant in AR bank facility, only interest coverage and working capital covenants
Recent credit facility increases, equity and high yield offerings have allowed Antero to reduce its cost of debt to 5.1% and significantly enhance liquidity with an average debt maturity of January 2023
$208
$17.15 $16.29
$26.60
$0.00
$10.00
$20.00
$30.00
$40.00
$50.00
$60.00
2015 2016 YTD 2017 Guidance
C3+
Liq
uids
Pric
e pe
r Bbl
Realized C3+ NGL Price WTI
$100
$200
$300
$400
$500
$600
30 35 40 45 50
Prop
ane
Rev
enue
Propane Production (MBbl/d)
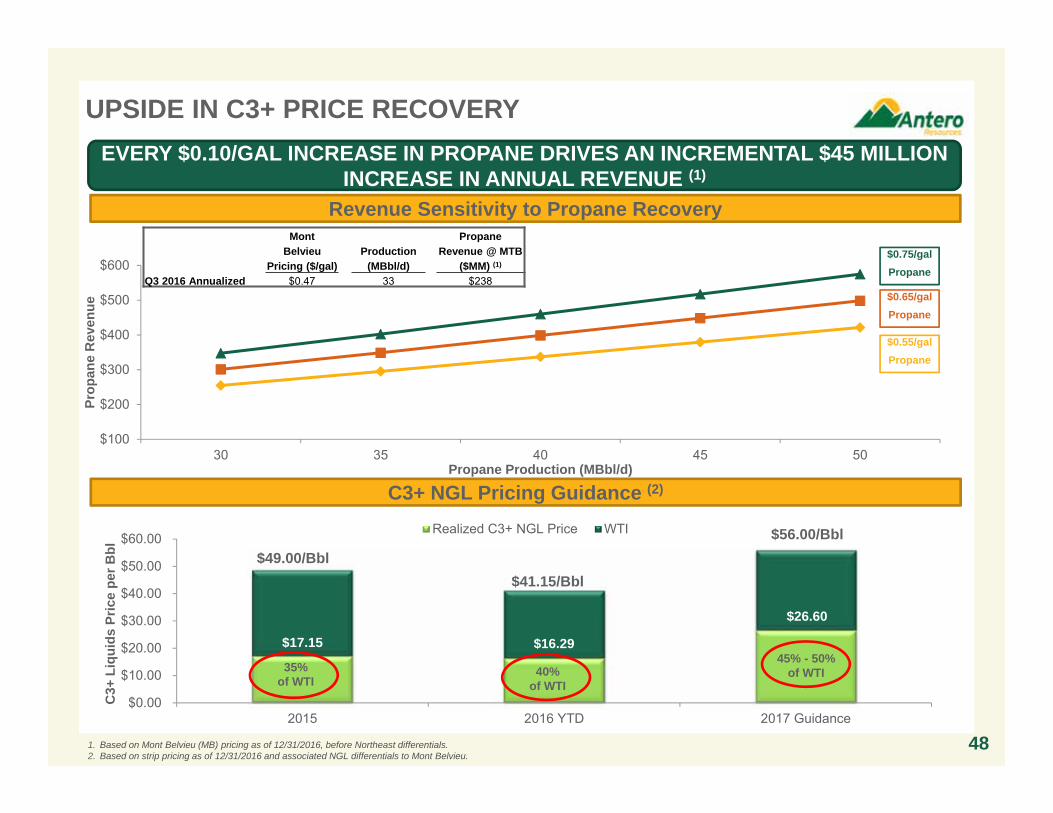
481. Based on Mont Belvieu (MB) pricing as of 12/31/2016, before Northeast differentials. 2. Based on strip pricing as of 12/31/2016 and associated NGL differentials to Mont Belvieu.
UPSIDE IN C3+ PRICE RECOVERY
35% of WTI
45% - 50% of WTI
$49.00/Bbl$41.15/Bbl
40% of WTI
$56.00/Bbl
Revenue Sensitivity to Propane Recovery
EVERY $0.10/GAL INCREASE IN PROPANE DRIVES AN INCREMENTAL $45 MILLION INCREASE IN ANNUAL REVENUE (1)
Mont PropaneBelvieu Production Revenue @ MTB
Pricing ($/gal) (MBbl/d) ($MM) (1)
Q3 2016 Annualized $0.47 33 $238
$0.75/galPropane
$0.65/galPropane
$0.55/galPropane
C3+ NGL Pricing Guidance (2)
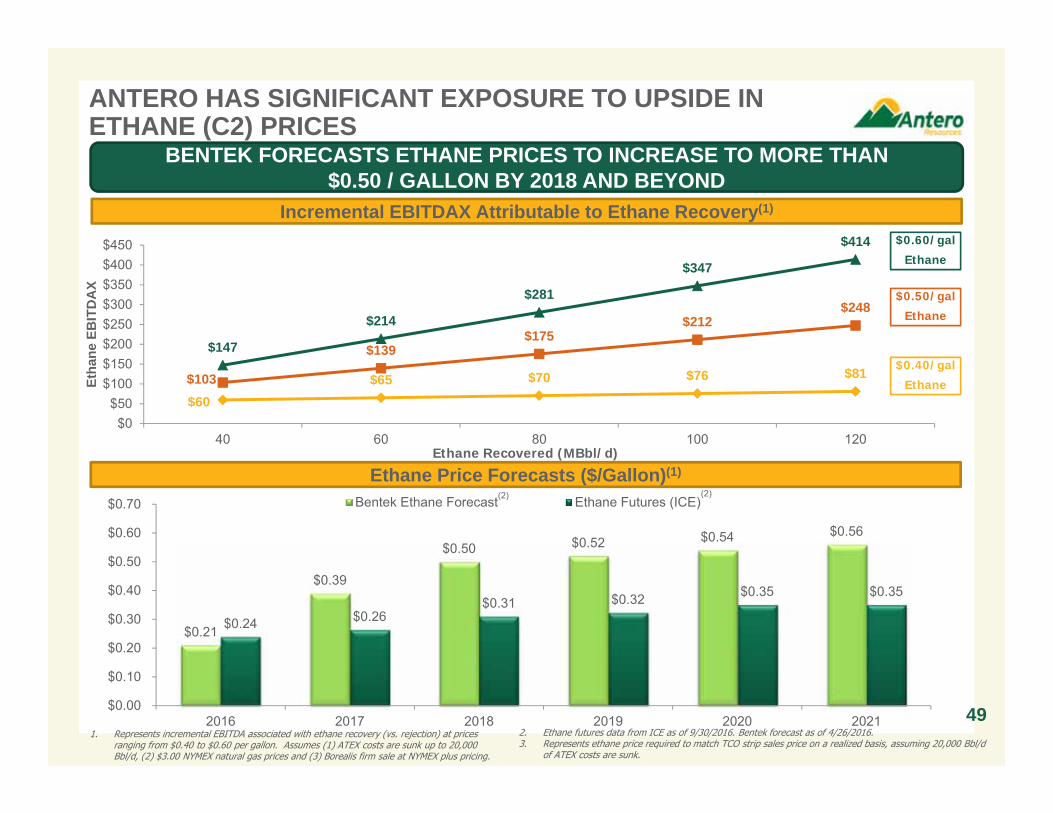
$60$65 $70 $76 $81$103
$139$175
$212$248
$147
$214
$281
$347
$414
$0$50
$100$150$200$250$300$350$400$450
40 60 80 100 120
Etha
ne E
BIT
DA
XANTERO HAS SIGNIFICANT EXPOSURE TO UPSIDE IN ETHANE (C2) PRICES
2. Ethane futures data from ICE as of 9/30/2016. Bentek forecast as of 4/26/2016.3. Represents ethane price required to match TCO strip sales price on a realized basis, assuming 20,000 Bbl/d
of ATEX costs are sunk.
ATEX FT
Ethane Recovered (MBbl/d)
$0.60/gal
Ethane
$0.50/gal
Ethane
$0.40/gal
Ethane
1. Represents incremental EBITDA associated with ethane recovery (vs. rejection) at prices ranging from $0.40 to $0.60 per gallon. Assumes (1) ATEX costs are sunk up to 20,000 Bbl/d, (2) $3.00 NYMEX natural gas prices and (3) Borealis firm sale at NYMEX plus pricing.
49
Ethane Price Forecasts ($/Gallon)(1)
Incremental EBITDAX Attributable to Ethane Recovery(1)
BENTEK FORECASTS ETHANE PRICES TO INCREASE TO MORE THAN $0.50 / GALLON BY 2018 AND BEYOND
$0.21
$0.39
$0.50 $0.52 $0.54 $0.56
$0.24 $0.26 $0.31 $0.32 $0.35 $0.35
$0.00
$0.10
$0.20
$0.30
$0.40
$0.50
$0.60
$0.70
2016 2017 2018 2019 2020 2021
Bentek Ethane Forecast Ethane Futures (ICE)(2) (2)

50
INCREMENTAL ANTERO TAKEAWAY CAPACITY
1. Antero has contracted for downstream capacity of 800 MMcf/d that connects to Rover ince placed in service. 2. Represents 700 MMcf/d of capacity on TCO Mountaineer that can be sold into TCO pool and 183 MMcf/d of capacity available on CGT Gulf Xpress to the Gulf Coast markets.
3.1 Bcf/d
4.8 Bcf/d
800 MMcf/d 200 MMcf/d
700 MMcf/d
0.0
1.0
2.0
3.0
4.0
5.0
6.0
Current Gross FirmTransportation /
Firm SalesCapacity
ET Rover(2Q 2017)
TGP Expansion(2Q 2018)
TCO Mountaineer / CGTGulf Xpress(4Q 2018)
YE 2018E Gross FirmTransportation /
Firm SalesCapacity
(2)
Approximately 65% of Antero’s expected firm transportation capacity is in service today
Antero Capacity on Northeast Takeaway Projects
Chicago / Gulf Coast
Gulf CoastTCO /
Gulf Coast
Tennessee Gas Expansion(2Q 2018)
ET Rover(3Q 2017) (1)
51
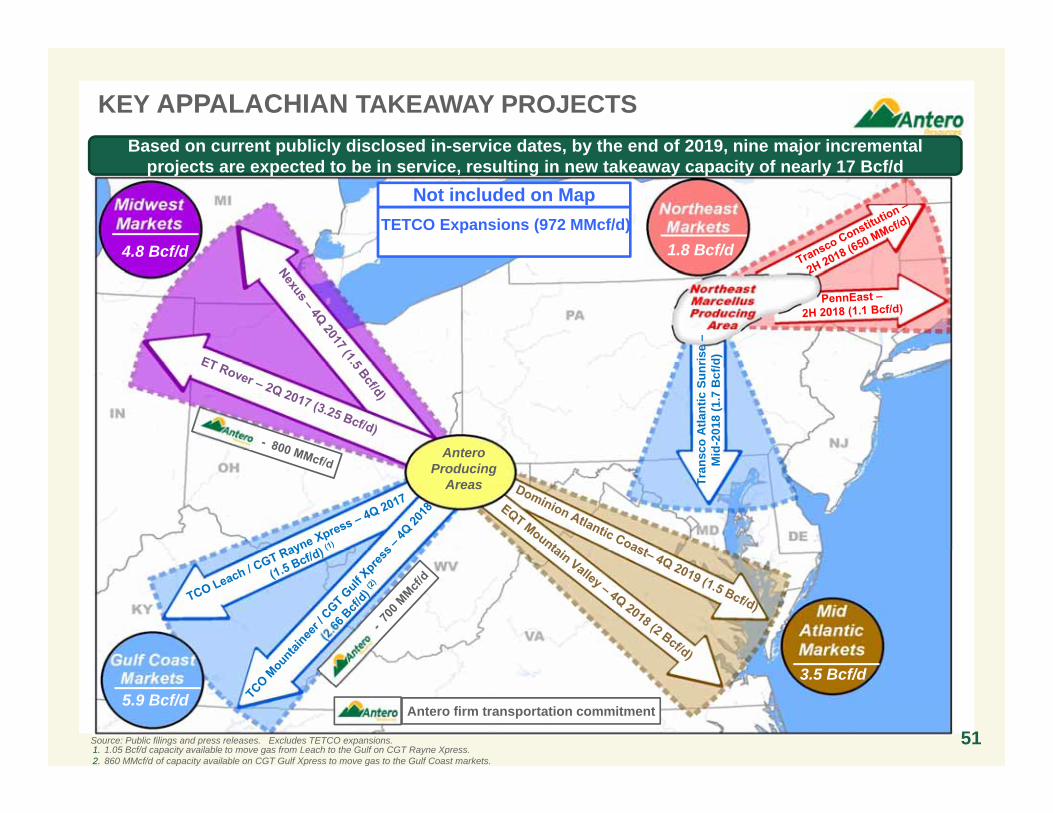
KEY APPALACHIAN TAKEAWAY PROJECTS
Tran
sco
Atla
ntic
Sun
rise
–M
id-2
018
(1.7
Bcf
/d)
4.8 Bcf/d
5.9 Bcf/d3.5 Bcf/d
1.8 Bcf/d
Antero Producing
Areas
Source: Public filings and press releases. Excludes TETCO expansions. 1. 1.05 Bcf/d capacity available to move gas from Leach to the Gulf on CGT Rayne Xpress. 2. 860 MMcf/d of capacity available on CGT Gulf Xpress to move gas to the Gulf Coast markets.
Antero firm transportation commitment
Based on current publicly disclosed in-service dates, by the end of 2019, nine major incremental projects are expected to be in service, resulting in new takeaway capacity of nearly 17 Bcf/d
Not included on MapTETCO Expansions (972 MMcf/d)
Moody's S&P
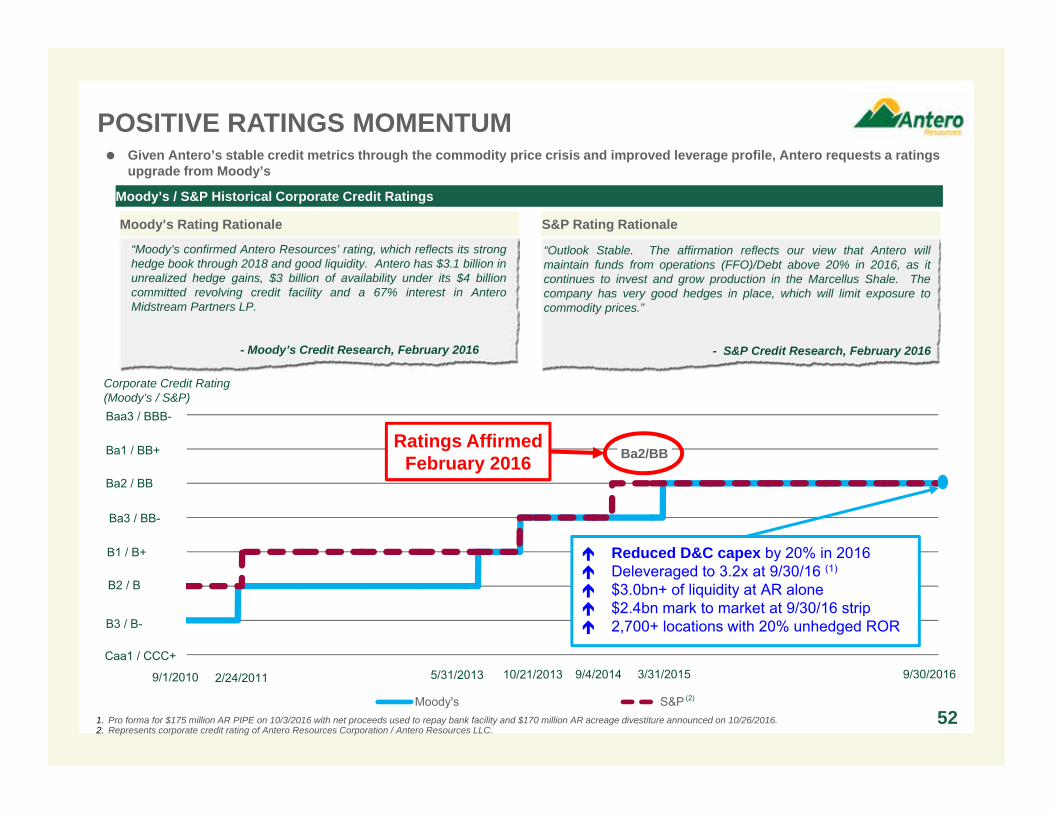
POSITIVE RATINGS MOMENTUM
Moody’s / S&P Historical Corporate Credit Ratings
“Outlook Stable. The affirmation reflects our view that Antero willmaintain funds from operations (FFO)/Debt above 20% in 2016, as itcontinues to invest and grow production in the Marcellus Shale. Thecompany has very good hedges in place, which will limit exposure tocommodity prices.”
- S&P Credit Research, February 2016
“Moody’s confirmed Antero Resources’ rating, which reflects its stronghedge book through 2018 and good liquidity. Antero has $3.1 billion inunrealized hedge gains, $3 billion of availability under its $4 billioncommitted revolving credit facility and a 67% interest in AnteroMidstream Partners LP.
- Moody’s Credit Research, February 2016
Corporate Credit Rating (Moody’s / S&P)
Ba3 / BB-
B1 / B+
B2 / B
B3 / B-
2/24/2011 10/21/2013 9/4/20145/31/2013
Ba2 / BB
Ba1 / BB+
Caa1 / CCC+
(2)
1. Pro forma for $175 million AR PIPE on 10/3/2016 with net proceeds used to repay bank facility and $170 million AR acreage divestiture announced on 10/26/2016. 2. Represents corporate credit rating of Antero Resources Corporation / Antero Resources LLC.
Baa3 / BBB-
Moody’s Rating Rationale S&P Rating Rationale
52
3/31/2015
Ba2/BB
9/30/20169/1/2010
Ratings AffirmedFebruary 2016
Given Antero’s stable credit metrics through the commodity price crisis and improved leverage profile, Antero requests a ratingsupgrade from Moody’s
Reduced D&C capex by 20% in 2016 Deleveraged to 3.2x at 9/30/16 (1)
$3.0bn+ of liquidity at AR alone $2.4bn mark to market at 9/30/16 strip 2,700+ locations with 20% unhedged ROR
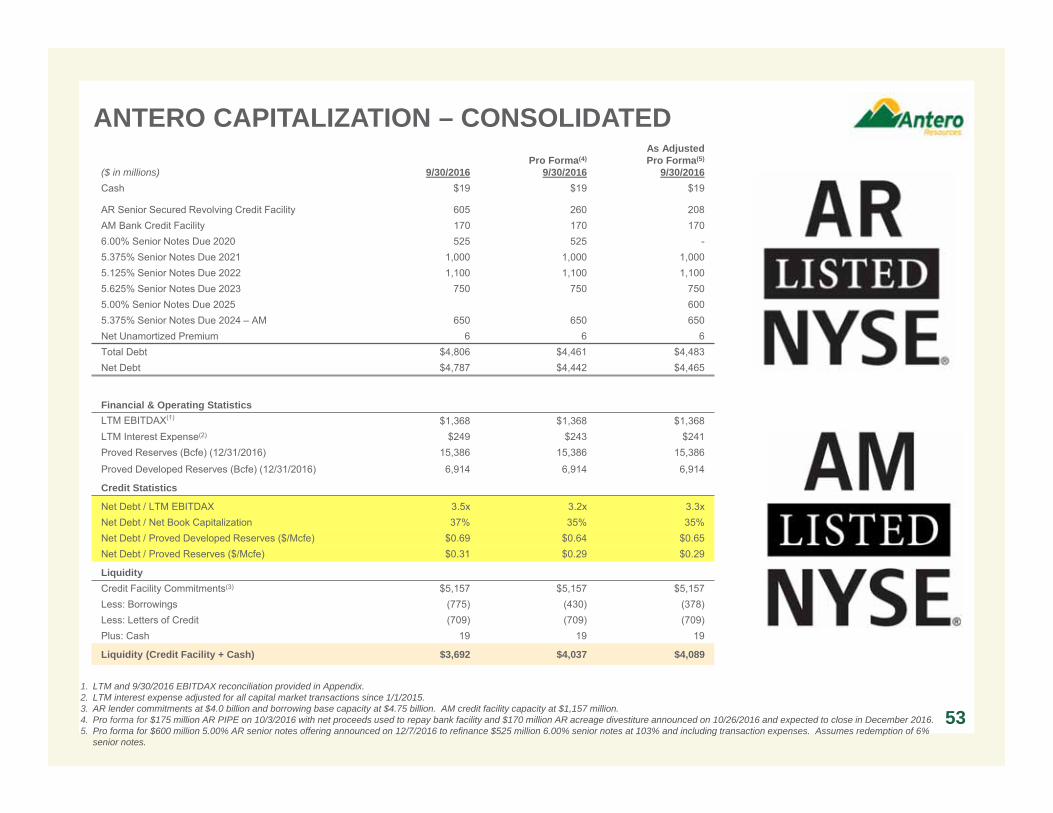
($ in millions) 9/30/2016 Pro Forma(4)
9/30/2016
As AdjustedPro Forma(5)
9/30/2016 Cash $19 $19 $19
AR Senior Secured Revolving Credit Facility 605 260 208AM Bank Credit Facility 170 170 1706.00% Senior Notes Due 2020 525 525 -5.375% Senior Notes Due 2021 1,000 1,000 1,0005.125% Senior Notes Due 2022 1,100 1,100 1,1005.625% Senior Notes Due 2023 750 750 7505.00% Senior Notes Due 2025 6005.375% Senior Notes Due 2024 – AM 650 650 650Net Unamortized Premium 6 6 6Total Debt $4,806 $4,461 $4,483Net Debt $4,787 $4,442 $4,465
Financial & Operating StatisticsLTM EBITDAX(1) $1,368 $1,368 $1,368LTM Interest Expense(2) $249 $243 $241Proved Reserves (Bcfe) (12/31/2016) 15,386 15,386 15,386
Proved Developed Reserves (Bcfe) (12/31/2016) 6,914 6,914 6,914
Credit Statistics
Net Debt / LTM EBITDAX 3.5x 3.2x 3.3xNet Debt / Net Book Capitalization 37% 35% 35%Net Debt / Proved Developed Reserves ($/Mcfe) $0.69 $0.64 $0.65Net Debt / Proved Reserves ($/Mcfe) $0.31 $0.29 $0.29
LiquidityCredit Facility Commitments(3) $5,157 $5,157 $5,157Less: Borrowings (775) (430) (378)Less: Letters of Credit (709) (709) (709)Plus: Cash 19 19 19
Liquidity (Credit Facility + Cash) $3,692 $4,037 $4,089
ANTERO CAPITALIZATION – CONSOLIDATED
1. LTM and 9/30/2016 EBITDAX reconciliation provided in Appendix.2. LTM interest expense adjusted for all capital market transactions since 1/1/2015.3. AR lender commitments at $4.0 billion and borrowing base capacity at $4.75 billion. AM credit facility capacity at $1,157 million.4. Pro forma for $175 million AR PIPE on 10/3/2016 with net proceeds used to repay bank facility and $170 million AR acreage divestiture announced on 10/26/2016 and expected to close in December 2016. 5. Pro forma for $600 million 5.00% AR senior notes offering announced on 12/7/2016 to refinance $525 million 6.00% senior notes at 103% and including transaction expenses. Assumes redemption of 6%
senior notes.
53
8.9
4.8
3.2
1.0 (1.1)
(2.00)
0.00
2.00
4.00
6.00
8.00
10.00
LNG Export Power Mexico Export Industrial Residential/Commercial
0.0
10.0
20.0
30.0
40.0
50.0
60.0
70.0
80.0
90.0
100.0
2015 2016E 2017E 2018E 2019E 2020E
Other/Associated Gas Barnett Pinedale Fayetteville Haynesville Piceance Marcellus Utica
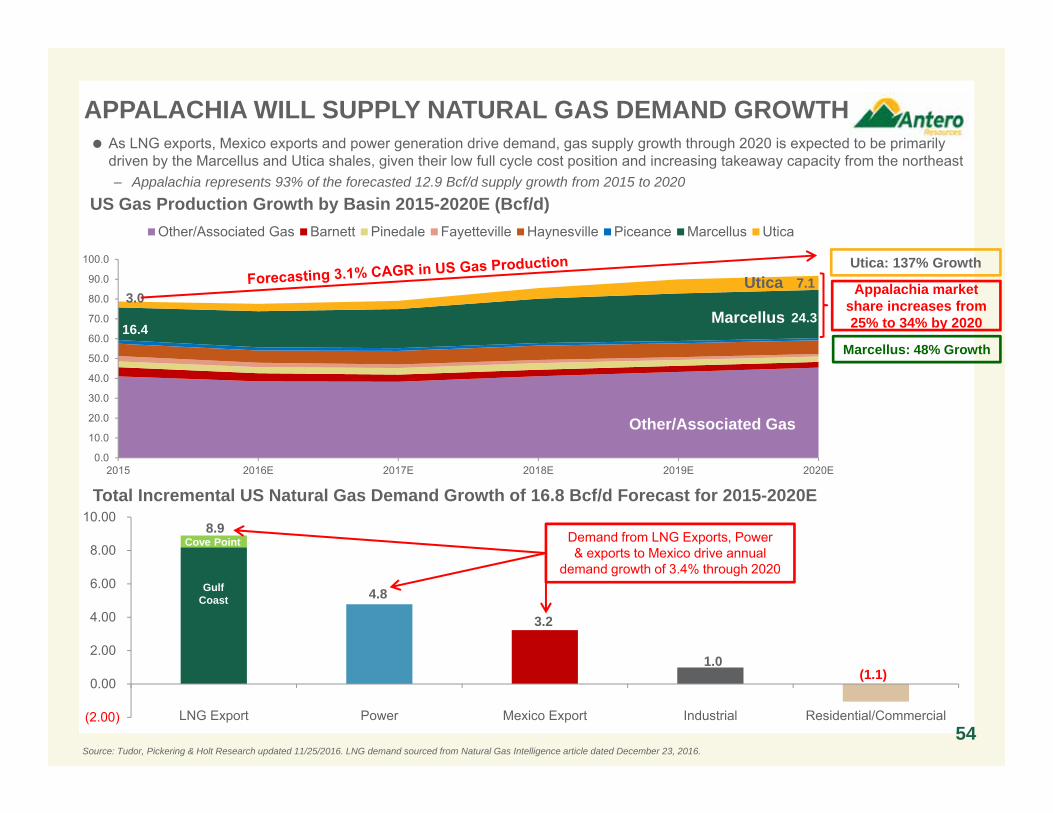
APPALACHIA WILL SUPPLY NATURAL GAS DEMAND GROWTH
US Gas Production Growth by Basin 2015-2020E (Bcf/d)
Source: Tudor, Pickering & Holt Research updated 11/25/2016. LNG demand sourced from Natural Gas Intelligence article dated December 23, 2016.
Total Incremental US Natural Gas Demand Growth of 16.8 Bcf/d Forecast for 2015-2020E
Appalachia market share increases from 25% to 34% by 2020
Demand from LNG Exports, Power & exports to Mexico drive annual
demand growth of 3.4% through 2020
As LNG exports, Mexico exports and power generation drive demand, gas supply growth through 2020 is expected to be primarily driven by the Marcellus and Utica shales, given their low full cycle cost position and increasing takeaway capacity from the northeast– Appalachia represents 93% of the forecasted 12.9 Bcf/d supply growth from 2015 to 2020
Utica
Marcellus
Gulf Coast
Cove Point
Other/Associated Gas
Utica: 137% Growth
Marcellus: 48% Growth
Utica
24.3
7.1
16.4
3.0
54

3
4 4
9
13
17
-8.0
-4.0
0.0
4.0
8.0
12.0
16.0
20.0
2015 2016E 2017E 2018E 2019E 2020E
Residential/Commercial IndustrialPower Mexico ExportLNG Export Total Yearly Change
17 BCF/D OF INCREMENTAL GAS DEMAND BY 2020 Significant demand growth expected for U.S.
natural gas
More than 70% of the ~17 Bcf/d in incremental gas demand forecast by 2020 is expected to be generated from exports:− LNG: 8.9 Bcf/d (~53%)− Mexico: 3.2 Bcf/d (~19%)
Of the 8.9 Bcf/d of expected incremental demand from LNG export projects, over 70% of the projects have secured the necessary DOE and FERC permits
55
Incremental Demand Growth Through 2020 by Category
Projected Incremental Natural Gas Demand Through 2020
Source: Tudor, Pickering & Holt Research updated 11/25/2016.
Sherwood 7
8.9 Bcf/d of the 16.8 Bcf/d of incremental demand is expected to come from
LNG exports
(Bcf/d)
LNG
Exports
Power Gen
Industrial
LNG Export50%
Power27%
Mexico Export18%
Industrial5%
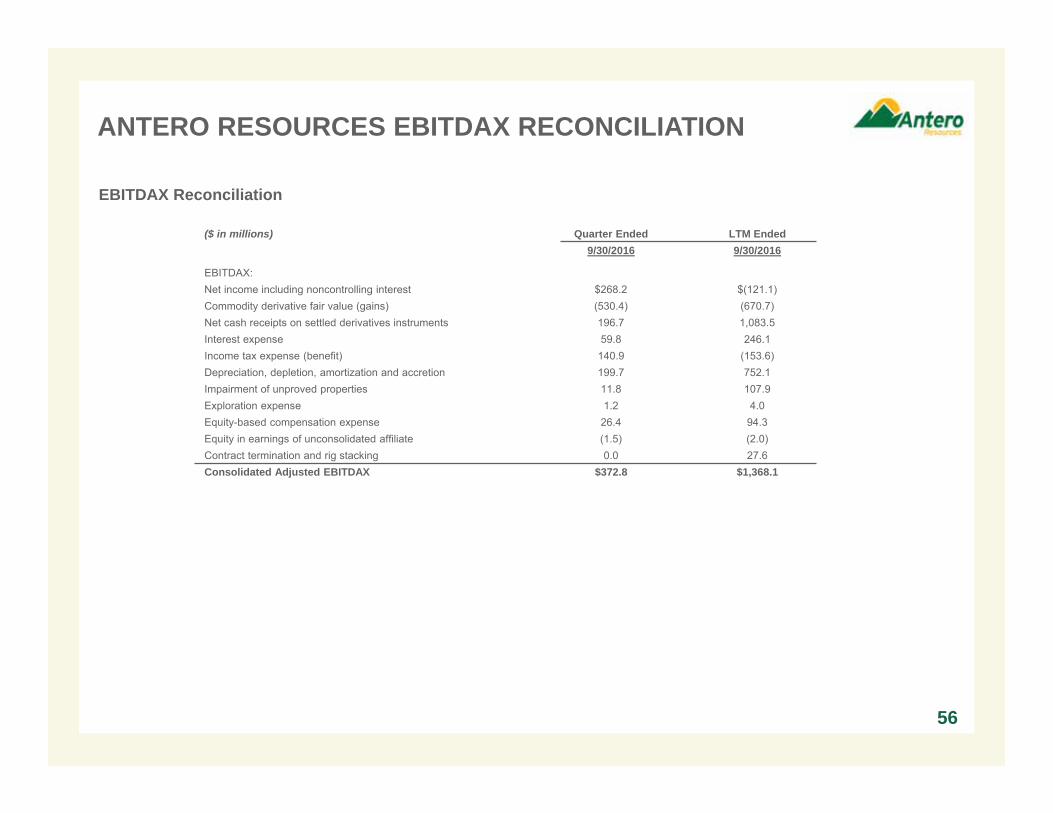
ANTERO RESOURCES EBITDAX RECONCILIATION
56
EBITDAX Reconciliation
($ in millions) Quarter Ended LTM Ended9/30/2016 9/30/2016
EBITDAX:Net income including noncontrolling interest $268.2 $(121.1)Commodity derivative fair value (gains) (530.4) (670.7)Net cash receipts on settled derivatives instruments 196.7 1,083.5Interest expense 59.8 246.1Income tax expense (benefit) 140.9 (153.6)Depreciation, depletion, amortization and accretion 199.7 752.1Impairment of unproved properties 11.8 107.9Exploration expense 1.2 4.0Equity-based compensation expense 26.4 94.3Equity in earnings of unconsolidated affiliate (1.5) (2.0)Contract termination and rig stacking 0.0 27.6Consolidated Adjusted EBITDAX $372.8 $1,368.1
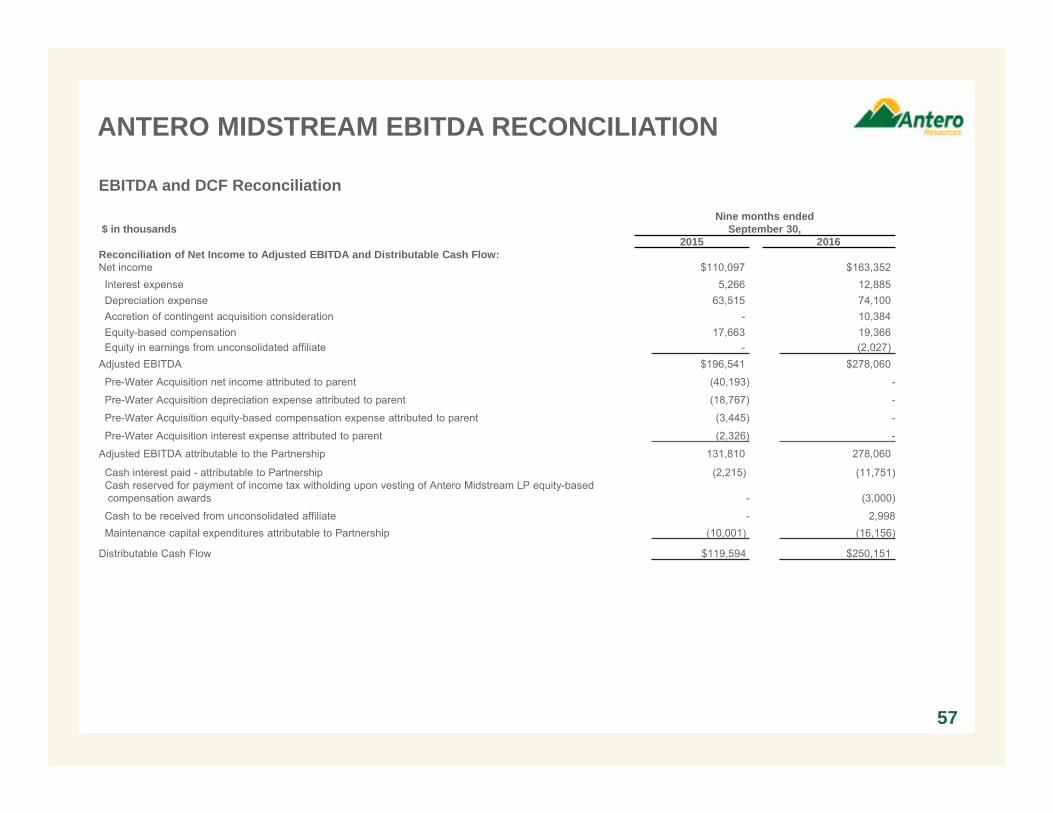
ANTERO MIDSTREAM EBITDA RECONCILIATION
57
EBITDA and DCF Reconciliation
$ in thousandsNine months ended
September 30,2015 2016
Reconciliation of Net Income to Adjusted EBITDA and Distributable Cash Flow: Net income $110,097 $163,352
Interest expense 5,266 12,885Depreciation expense 63,515 74,100Accretion of contingent acquisition consideration - 10,384Equity-based compensation 17,663 19,366Equity in earnings from unconsolidated affiliate - (2,027)
Adjusted EBITDA $196,541 $278,060
Pre-Water Acquisition net income attributed to parent (40,193) -
Pre-Water Acquisition depreciation expense attributed to parent (18,767) -
Pre-Water Acquisition equity-based compensation expense attributed to parent (3,445) -
Pre-Water Acquisition interest expense attributed to parent (2,326) -
Adjusted EBITDA attributable to the Partnership 131,810 278,060
Cash interest paid - attributable to Partnership (2,215) (11,751)Cash reserved for payment of income tax witholding upon vesting of Antero Midstream LP equity-basedcompensation awards - (3,000)
Cash to be received from unconsolidated affiliate - 2,998Maintenance capital expenditures attributable to Partnership (10,001) (16,156)
Distributable Cash Flow $119,594 $250,151
CAUTIONARY NOTE
The SEC permits oil and gas companies, in their filings with the SEC, to disclose only proved, probable and possible reserve estimates (collectively, “3P”). Antero has provided internally generated estimates for proved, probable and possible reserves in this presentation in accordance with SEC guidelines and definitions. The estimates of proved, probable and possible reserves as of December 31, 2016 included in this presentation have been audited by Antero’s third-party engineers. Unless otherwise noted, reserve estimates as of December 31, 2016 assume ethane rejection and strip pricing.
Actual quantities that may be ultimately recovered from Antero’s interests may differ substantially from the estimates in this presentation. Factors affecting ultimate recovery include the scope of Antero’s ongoing drilling program, which will be directly affected by commodity prices, the availability of capital, drilling and production costs, availability of drilling services and equipment, drilling results, lease expirations, transportation constraints, regulatory approvals and other factors; and actual drilling results, including geological and mechanical factors affecting recovery rates.
In this presentation:
“3P reserves” refer to Antero’s estimated aggregate proved, probable and possible reserves as of December 31, 2016. The SEC prohibits companies from aggregating proved, probable and possible reserves in filings with the SEC due to the different levels of certainty associated with each reserve category.
“EUR,” or “Estimated Ultimate Recovery,” refers to Antero’s internal estimates of per well hydrocarbon quantities that may be potentially recovered from a hypothetical future well completed as a producer in the area. These quantities do not necessarily constitute or represent reserves within the meaning of the Society of Petroleum Engineer’s Petroleum Resource Management System or the SEC’s oil and natural gas disclosure rules.
“Condensate” refers to gas having a heat content between 1250 BTU and 1300 BTU in the Utica Shale.
“Highly-Rich Gas/Condensate” refers to gas having a heat content between 1275 BTU and 1350 BTU in the Marcellus Shale and 1225 BTU and 1250 BTU in the Utica Shale.
“Highly-Rich Gas” refers to gas having a heat content between 1200 BTU and 1275 BTU in the Marcellus Shale and 1200 BTU and 1225 BTU in the Utica Shale.
“Rich Gas” refers to gas having a heat content of between 1100 BTU and 1200 BTU.
“Dry Gas” refers to gas containing insufficient quantities of hydrocarbons heavier than methane to allow their commercial extraction or to require their removal in order to render the gas suitable for fuel use.
Regarding Hydrocarbon Quantities
58