Embed Size (px)
Citation preview
INVESTOR PRESENTATION
Calgary
May 26, 2016
Scott Thomson, President and CEO
This report contains statements about the Company’s business outlook, objectives, plans, strategic priorities and other statements that are not historical facts. A
statement Finning makes is forward-looking when it uses what the Company knows and expects today to make a statement about the future. Forward-looking
statements may include words such as aim, anticipate, assumption, believe, could, expect, goal, guidance, intend, may, objective, outlook, plan, project, seek, should,
strategy, strive, target, and will. Forward-looking statements in this report include, but are not limited to, statements with respect to: expectations with respect to the
economy and associated impact on the Company’s financial results; workforce reductions; distribution network and goodwill impairment charges; facility closures;
expected revenue; expected free cash flow; EBIT margin; expected profitability levels; expected range of the effective tax rate; ROIC; market share growth; expected
results from service excellence action plans; anticipated asset utilization; inventory turns and parts service levels; the expected target range of the Company’s net debt
to invested capital ratio; and the expected financial impact from acquisitions. All such forward-looking statements are made pursuant to the ‘safe harbour’ provisions of
applicable Canadian securities laws.
Unless otherwise indicated by us, forward-looking statements in this report reflect Finning’s expectations at May 26, 2016. Except as may be required by Canadian
securities laws, Finning does not undertake any obligation to update or revise any forward-looking statement, whether as a result of new information, future events, or
otherwise.
Forward-looking statements, by their very nature, are subject to numerous risks and uncertainties and are based on several assumptions which give rise to the
possibility that actual results could differ materially from the expectations expressed in or implied by such forward-looking statements and that Finning’s business
outlook, objectives, plans, strategic priorities and other statements that are not historical facts may not be achieved. As a result, Finning cannot guarantee that any
forward-looking statement will materialize. Factors that could cause actual results or events to differ materially from those expressed in or implied by these forward-
looking statements include: general economic and market conditions; foreign exchange rates; commodity prices; the level of customer confidence and spending, and
the demand for, and prices of, Finning’s products and services; Finning’s dependence on the continued market acceptance of products and timely supply of parts and
equipment; Finning’s ability to continue to improve productivity and operational efficiencies while continuing to maintain customer service; Finning’s ability to manage
cost pressures as growth in revenue occurs; Finning’s ability to reduce costs in response to slowing activity levels; Finning’s ability to attract sufficient skilled labour
resources as market conditions, business strategy or technologies change; Finning’s ability to negotiate and renew collective bargaining agreements with satisfactory
terms for Finning’s employees and the Company; the intensity of competitive activity; Finning’s ability to raise the capital needed to implement its business plan;
regulatory initiatives or proceedings, litigation and changes in laws or regulations; stock market volatility; changes in political and economic environments for
operations; the integrity, reliability, availability and benefits from information technology and the data processed by that technology. Forward-looking statements are
provided in this report for the purpose of giving information about management’s current expectations and plans and allowing investors and others to get a better
understanding of Finning’s operating environment. However, readers are cautioned that it may not be appropriate to use such forward-looking statements for any other
purpose.
Forward-looking statements made in this report are based on a number of assumptions that Finning believed were reasonable on the day the Company made the
forward-looking statements. Refer in particular to the Outlook section of this MD&A. Some of the assumptions, risks, and other factors which could cause results to
differ materially from those expressed in the forward-looking statements contained in this report are discussed in Section 4 of the Company’s current AIF and in the
annual MD&A for the financial risks.
Finning cautions readers that the risks described in the MD&A and the AIF are not the only ones that could impact the Company. Additional risks and uncertainties not
currently known to the Company or that are currently deemed to be immaterial may also have a material adverse effect on Finning’s business, financial condition, or
results of operations.
Except as otherwise indicated, forward-looking statements do not reflect the potential impact of any non-recurring or other unusual items or of any dispositions,
mergers, acquisitions, other business combinations or other transactions that may be announced or that may occur after the date hereof. The financial impact of these
transactions and non-recurring and other unusual items can be complex and depends on the facts particular to each of them. Finning therefore cannot describe the
expected impact in a meaningful way or in the same way Finning presents known risks affecting its business.
Forward Looking Information
2
Monetary amounts are in Canadian dollars and from continuing operations unless noted otherwise
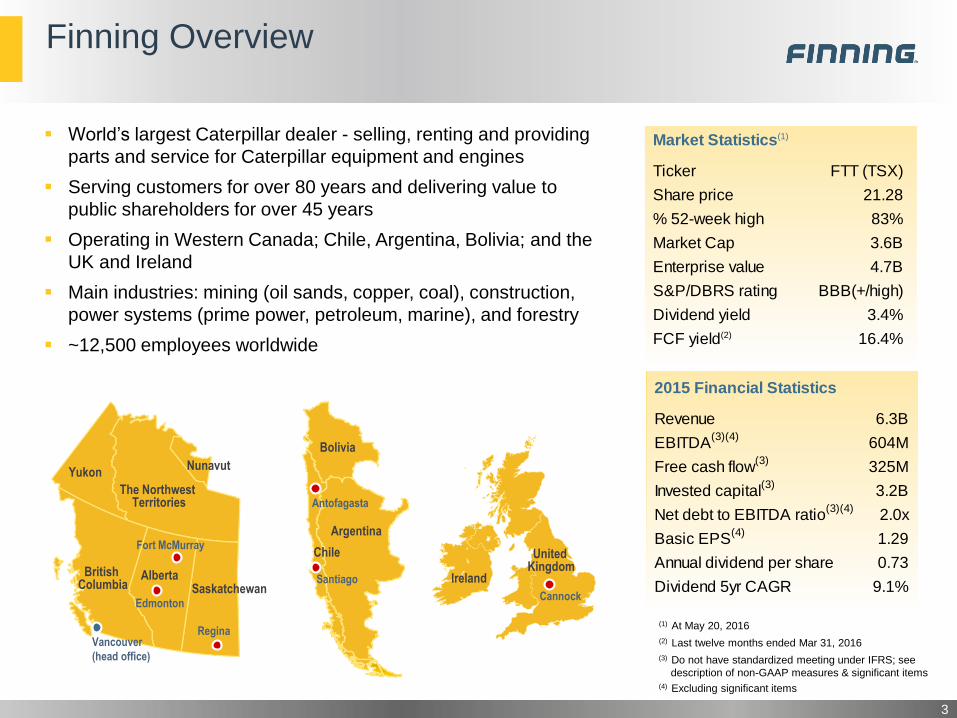
Finning Overview
World’s largest Caterpillar dealer - selling, renting and providing
parts and service for Caterpillar equipment and engines
Serving customers for over 80 years and delivering value to
public shareholders for over 45 years
Operating in Western Canada; Chile, Argentina, Bolivia; and the
UK and Ireland
Main industries: mining (oil sands, copper, coal), construction,
power systems (prime power, petroleum, marine), and forestry
~12,500 employees worldwide
3
(1) At May 20, 2016
(2) Last twelve months ended Mar 31, 2016
(4) Excluding significant items
Santiago
Antofagasta
Bolivia
Argentina
Chile
Cannock
United Kingdom
IrelandBritish
ColumbiaAlberta
Yukon
Edmonton
Vancouver
(head office)
Fort McMurray
Regina
The Northwest Territories
Saskatchewan
Nunavut
(3) Do not have standardized meeting under IFRS; see
description of non-GAAP measures & significant items
2015 Financial Statistics
Revenue 6.3B
EBITDA(3)(4)
604M
Free cash flow(3)
325M
Invested capital(3)
3.2B
Net debt to EBITDA ratio(3)(4)
2.0x
Basic EPS(4)
1.29
Annual dividend per share 0.73
Dividend 5yr CAGR 9.1%
Market Statistics(1)
Ticker FTT (TSX)
Share price 21.28
% 52-week high 83%
Market Cap 3.6B
Enterprise value 4.7B
S&P/DBRS rating BBB(+/high)
Dividend yield 3.4%
FCF yield(2) 16.4%
Compelling Value Proposition
4
Great products and territories
Aligned with Caterpillar – world’s best heavy equipment company
Operating in high-quality regions with significant long-term growth opportunities
Customer diversification across many sectors
Resilient business model and reduced cost structure support consistent EBITDA margin
Machine population drives stable product support business
Cost discipline and decisive actions to navigate through market downturn
Advancing operational priorities to transform the business for sustainable profitability
Significant free cash flow
Committed to maintaining strong free cash flow conversion through the cycle
Solid balance sheet provides financial flexibility
Safe dividend, attractive yield
Committed to improving return on invested capital over time
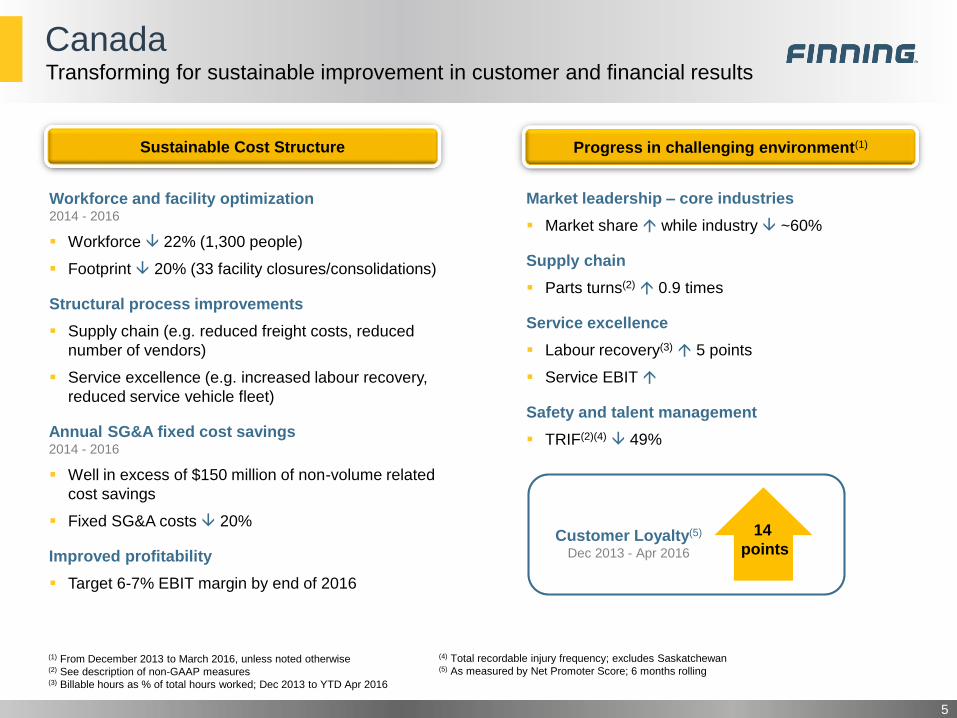
Canada
5
Transforming for sustainable improvement in customer and financial results
Workforce and facility optimization2014 - 2016
Workforce 22% (1,300 people)
Footprint 20% (33 facility closures/consolidations)
Structural process improvements
Supply chain (e.g. reduced freight costs, reduced
number of vendors)
Service excellence (e.g. increased labour recovery,
reduced service vehicle fleet)
Annual SG&A fixed cost savings2014 - 2016
Well in excess of $150 million of non-volume related
cost savings
Fixed SG&A costs 20%
Improved profitability
Target 6-7% EBIT margin by end of 2016
Market leadership – core industries
Market share while industry ~60%
Supply chain
Parts turns(2) 0.9 times
Service excellence
Labour recovery(3) 5 points
Service EBIT
Safety and talent management
TRIF(2)(4) 49%
Sustainable Cost Structure Progress in challenging environment(1)
(1) From December 2013 to March 2016, unless noted otherwise(2) See description of non-GAAP measures(3) Billable hours as % of total hours worked; Dec 2013 to YTD Apr 2016
14
pointsCustomer Loyalty(5)
Dec 2013 - Apr 2016
(4) Total recordable injury frequency; excludes Saskatchewan(5) As measured by Net Promoter Score; 6 months rolling
South America
6
Successfully managing through challenging market conditions
Chile – difficult macro-economic landscape
New wave of cost reductions from mining customers in early 2016
Step down in product support volumes
Lower parts consumption due to reduced fleet utilization
Service revenues impacted by in-sourcing of labour and weaker
Chilean peso relative to US dollar
Argentina – encouraging macro-economic developments
Fewer trade restrictions provide opportunity for new equipment sales
Vaca Muerta shale has large upside
Successfully navigating prolonged market downturn
Proactively managing costs
Workforce 20% since peak (July 2013)
9 facility closures / consolidations
Improving operating efficiencies
Capturing equipment and product support opportunities
Maintaining solid profitability levels
10
pointsCustomer Loyalty(1)
Dec 2013 - Apr 2016
(1) As measured by Net Promoter Score; 6 months rolling
UK and Ireland
7
Macro-economic landscape
Key markets softened significantly, particularly coal, steel, and oil & gas
Slow start to construction in 2016
Brexit uncertainty impacting business confidence
Reshaping the business to lower the cost to serve customers
New and energized leadership team; executing with urgency
Streamlining organizational structure
Workforce 10% since 2014
Optimizing facility footprint
Increasing supply chain velocity
Improving project execution in power systems
Target return to historic profitability levels by end of 2016
Reshaping the business to lower the cost to serve
4
pointsCustomer Loyalty(1)
Dec 2013 - Apr 2016
(1) As measured by Net Promoter Score; 6 months rolling
Resilient Business Model
8
Relatively consistent EBITDA(1) and strong cash flows conversion
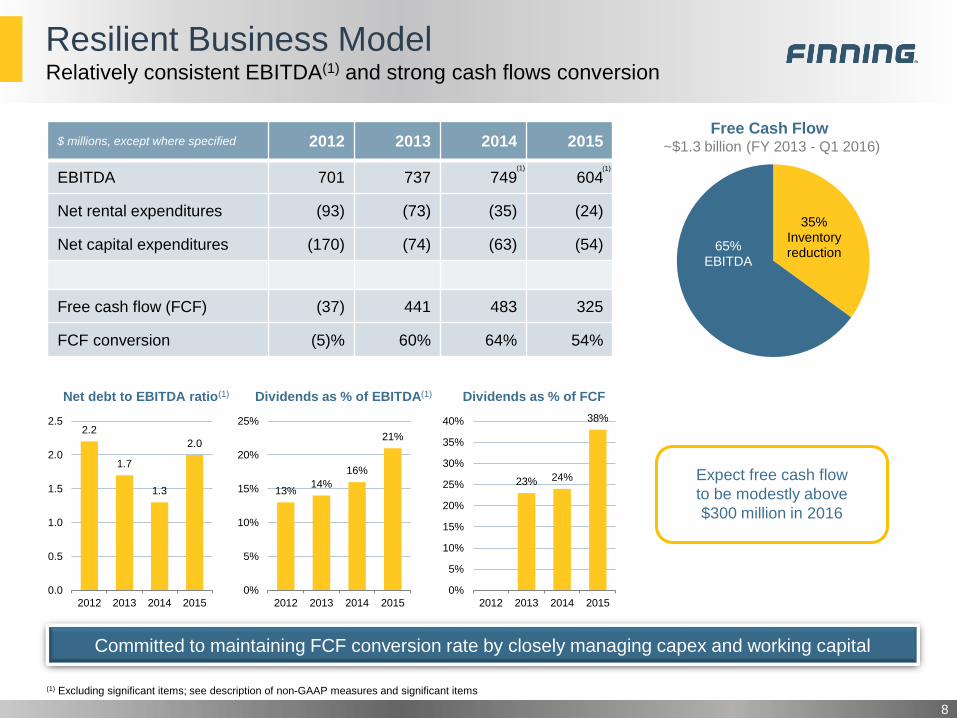
$ millions, except where specified 2012 2013 2014 2015
EBITDA 701 737 749 604
Net rental expenditures (93) (73) (35) (24)
Net capital expenditures (170) (74) (63) (54)
Free cash flow (FCF) (37) 441 483 325
FCF conversion (5)% 60% 64% 54%
13%14%
16%
21%
0%
5%
10%
15%
20%
25%
2012 2013 2014 2015
Dividends as % of EBITDA(1)
23% 24%
38%
0%
5%
10%
15%
20%
25%
30%
35%
40%
2012 2013 2014 2015
Dividends as % of FCF
2.2
1.7
1.3
2.0
0.0
0.5
1.0
1.5
2.0
2.5
2012 2013 2014 2015
Net debt to EBITDA ratio(1)
(1) Excluding significant items; see description of non-GAAP measures and significant items
Committed to maintaining FCF conversion rate by closely managing capex and working capital
Expect free cash flow
to be modestly above
$300 million in 2016
(1) (1)
Free Cash Flow ~$1.3 billion (FY 2013 - Q1 2016)
35%Inventory reduction
65%EBITDA
Capital Discipline
9
Strong balance sheet provides financial flexibility
Increased capital discipline
Rental investment flexible to market demand
Increase in capex is discretionary, based on market outlook and cash flow from working capital
Focus on working capital management
Continued reduction of surplus inventory - timing and amount tied to market activity
Inventory purchases tightly managed to market demand
Supply chain improvements increase inventory turns
Significant free cash flow allows to capture strategic and financial opportunities
Acquired Saskatchewan dealership in Q3 2015 – accretive to earnings and free cash flow
Secure dividend provides attractive yield
Share repurchase program in place (repurchased over $90 million worth of shares in 2015)
Key Takeaways
10
Successfully managing through difficult market environment
Embraced the downturn to advance operational excellence agenda
Acted decisively to right-size the business
Winning important deals and capturing market share
Supporting our customers through the trough - customer loyalty scores improving in all regions
Transformation initiatives and reduced cost structure will drive improved profitability and return on
invested capital when business conditions normalize
Committed to maintaining solid free cash flow conversion through the cycle
Strong balance sheet provides financial flexibility
Secure dividend
Focus on innovation agenda going forward
APPENDIX
Calgary
May 26, 2016

Non-GAAP Measures and Significant Items
12
EBIT: earnings before finance costs and income taxes
EBITDA: earnings before finance costs, income taxes, depreciation and amortization; EBITDA is commonly regarded as an indirect
measure of operating cash flow
Free cash flow (FCF): cash flow provided by (used in) operating activities less net additions to property, plant, and equipment and
intangible assets
Free cash flow conversion: free cash flow divided by EBITDA
Inventory turns: annualized cost of goods sold for the last six months divided by average inventory, based on an average of the last two
quarters
Invested capital: total assets less total liabilities, excluding net debt
Net debt: short and long term debt, net of cash
Parts turns: annualized cost of goods related to parts sold for the last six months divided by average parts inventory, based on an
average of the last six months
TRIF: total recordable injury frequency, calculated as the number of recordable injuries x 200,000 and divided by exposure hours
Significant items impacting EBITDA - $ millions 2014 2015
EBITDA – reported 720 126
Impairment of distribution network and goodwill - 338
Facility closure and restructuring costs - 53
Severance costs 17 48
Inventory and other asset impairments - 42
FX and tax impact on devaluation of Argentine peso - 12
ERP costs write-off in South America 12 -
Acquisition and disposal of businesses, net - (5)
Significant items recorded in depreciation and amortization - (10)
EBITDA - excluding significant items 749 604