Embed Size (px)
Citation preview

1 I 2Q 2015 EARNINGS 8/5/2015
2Q 2015 EARNINGSAugust 5, 2015
2 I 2Q 2015 EARNINGS 8/5/2015
FORWARD-LOOKING STATEMENTS
• This presentation includes "forward-looking statements” within the meaning of Section 27A of the Securities Act of 1933 and Section 21E of the Securities Exchange Act of 1934. Forward-looking statements are statements other than statements of historical fact that give our current expectations or forecasts of future events. They include production forecasts, improved operational performance, estimates of operating costs, assumptions regarding future natural gas and liquids prices, planned drilling activity, volume curtailments, estimates of future capital expenditures, estimates of recoverable resources, projected rates of return and expected efficiency gains, as well as projected cash flow, inventory levels and capital efficiency, business strategy and other plans and objectives for future operations. Although we believe the expectations and forecasts reflected in the forward-looking statements are reasonable, we can give no assurance they will prove to have been correct. They can be affected by inaccurate or changed assumptions or by known or unknown risks and uncertainties.
• Factors that could cause actual results to differ materially from expected results include those described under "Risk Factors” in Item 1A of our annual report on Form 10-K and any updates to those factors set forth in Chesapeake's subsequent Quarterly Reports on Form 10-Q or Current Reports on Form 8-K (available at http://www.chk.com/investors/sec-filings). These risk factors include: the volatility of oil, natural gas and NGL prices; write-downs of our oil and natural gas carrying values due to declines in prices; the availability of operating cash flow and other funds to finance reserve replacement costs; our ability to replace reserves and sustain production; uncertainties inherent in estimating quantities of oil, natural gas and NGL reserves and projecting future rates of production and the amount and timing of development expenditures; our ability to generate profits or achieve targeted results in drilling and well operations; leasehold terms expiring before production can be established; commodity derivative activities resulting in lower prices realized on oil, natural gas and NGL sales; the need to secure derivative liabilities and the inability of counterparties to satisfy their obligations; adverse developments or losses from pending or future litigation and regulatory proceedings, including royalty claims; the limitations our level of indebtedness may have on our financial flexibility; charges incurred in response to market conditions and in connection with actions to reduce financial leverage and complexity; drilling and operating risks and resulting liabilities; effects of environmental protection laws and regulation on our business; legislative and regulatory initiatives further regulating hydraulic fracturing; our need to secure adequate supplies of water for our drilling operations and to dispose of or recycle the water used; federal and state tax proposals affecting our industry; potential OTC derivatives regulation limiting our ability to hedge against commodity price fluctuations; impacts of potential legislative and regulatory actions addressing climate change; competition in the oil and gas exploration and production industry; a deterioration in general economic, business or industry conditions; negative public perceptions of our industry; limited control over properties we do not operate; pipeline and gathering system capacity constraints and transportation interruptions; cyber attacks adversely impacting our operations; and interruption in operations at our headquarters due to a catastrophic event.
• Disclosures concerning the estimated contribution of derivative contracts to our future results of operations are based upon market information as of a specific date. These estimates and underlying market prices are subject to significant volatility. Our production forecasts are dependent upon many assumptions, including estimates of production decline rates from existing wells and the outcome of future drilling activity. Expected asset sales may not be completed in the time frame anticipated or at all. References to “EUR” (estimated ultimate recovery) and “resources” include estimates of quantities of natural gas, oil and NGL we believe will ultimately be produced, but that are not yet classified as “proved reserves,” as defined in SEC regulations. Estimates of unproved resources are by their nature more speculative than estimates of proved reserves and accordingly are subject to substantially greater risk of actually being realized by Chesapeake. We believe our estimates of unproved resources are reasonable, but our estimates have not been reviewed by independent engineers. Estimates of unproved resources may change significantly as development provides additional data, and actual quantities that are ultimately recovered may differ substantially from prior estimates.
• We caution you not to place undue reliance on our forward-looking statements, which speak only as of the date of this presentation, and we undertake no obligation to update any of the information provided in this presentation, except as required by applicable law.
3 I 2Q 2015 EARNINGS 8/5/2015
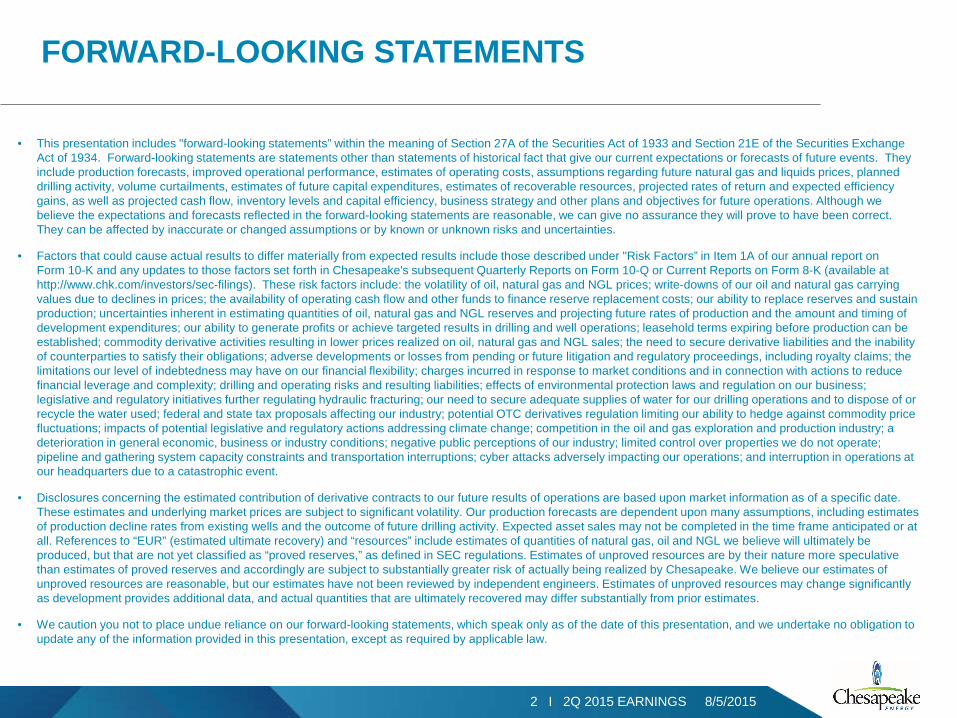
2Q’15 FINANCIAL & OPERATIONAL RESULTS
PROD. and G&A EXP.ADJ. EARNINGS/FDS ADJ. EBITDA
8% YOY
$5.40/boe(1)
$ 600 mm($ 0.11)
(1) Includes stock-based compensation(2) Adjusted for asset sales(3) Oil and NGLs collectively referred to as “Liquids”Note: Reconciliation of non-GAAP measures to comparable GAAP measures appear on pages 21-22
13% YOY(2)
703 mboe/d
LIQUIDS MIX(3) ADJ. OIL PRODUCTION
28% 11% YOY(2)
119.5 mbo/d
of Total Production
ADJ. PRODUCTION
4 I 2Q 2015 EARNINGS 8/5/2015
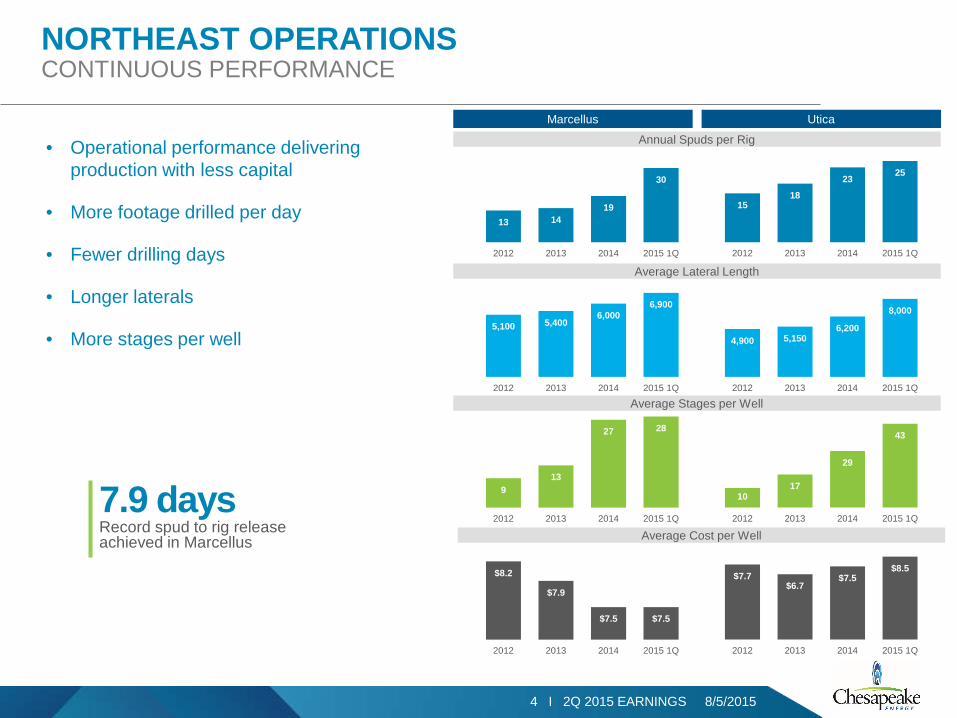
NORTHEAST OPERATIONSCONTINUOUS PERFORMANCE
• Operational performance delivering production with less capital
• More footage drilled per day
• Fewer drilling days
• Longer laterals
• More stages per well
15 18
23 25
2012 2013 2014 2015 1Q
13 14 19
30
2012 2013 2014 2015 1Q
Annual Spuds per Rig
Marcellus Utica
$7.7$6.7
$7.5$8.5
2012 2013 2014 2015 1Q
$8.2
$7.9
$7.5 $7.5
2012 2013 2014 2015 1Q
Average Cost per Well
4,900 5,150 6,200
8,000
2012 2013 2014 2015 1Q
5,100 5,400 6,000
6,900
2012 2013 2014 2015 1Q
Average Lateral Length
10 17
29
43
2012 2013 2014 2015 1Q
9 13
27 28
2012 2013 2014 2015 1Q
Average Stages per Well
7.9 daysRecord spud to rig release achieved in Marcellus
5 I 2Q 2015 EARNINGS 8/5/2015
0
100
200
300
400
500
600
700
800
900
Jan-15 Feb-15 Mar-15 Apr-15 May-15 Jun-15 Jul-15 Aug-15 Sep-15 Oct-15 Nov-15 Dec-15
Dek
athe
rm (D
TH)
Daily Spot Sales
TETCO OPEN
TGP Utica BH Short Term FT
DTI Natrium to Market
MPP
TGP Utica BH
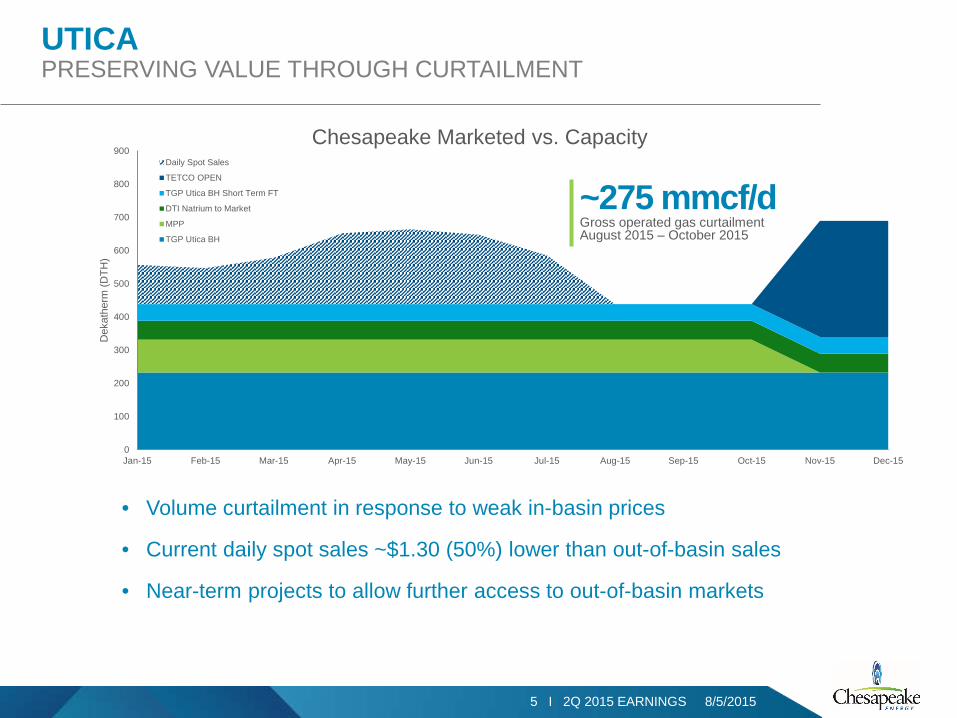
UTICAPRESERVING VALUE THROUGH CURTAILMENT
• Volume curtailment in response to weak in-basin prices
• Current daily spot sales ~$1.30 (50%) lower than out-of-basin sales
• Near-term projects to allow further access to out-of-basin markets
~275 mmcf/dGross operated gas curtailmentAugust 2015 – October 2015
Chesapeake Marketed vs. Capacity
6 I 2Q 2015 EARNINGS 8/5/2015
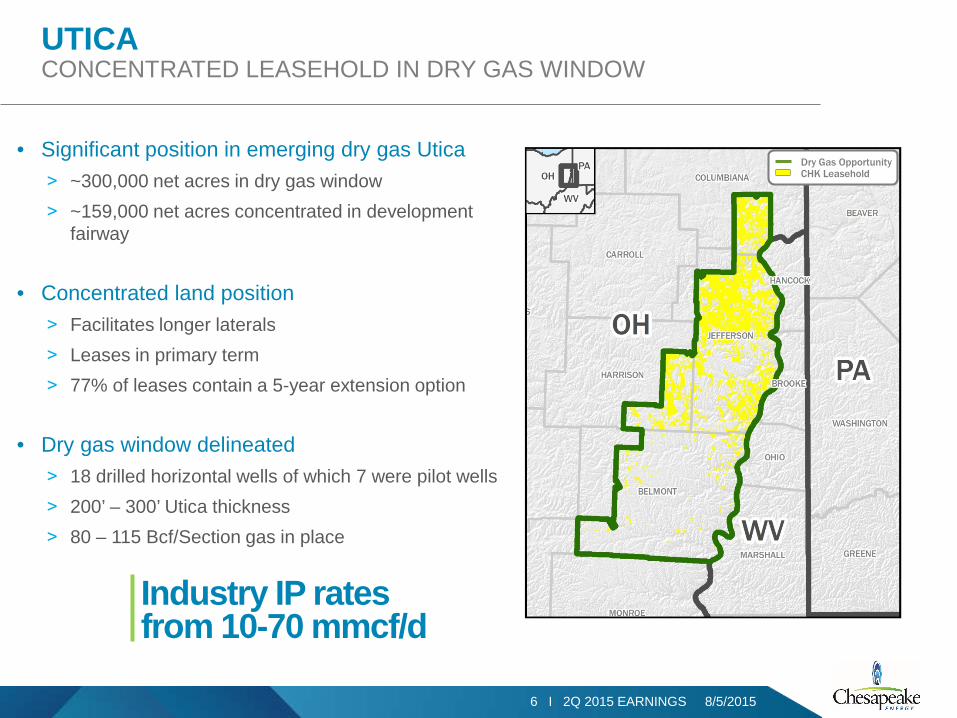
UTICACONCENTRATED LEASEHOLD IN DRY GAS WINDOW
• Significant position in emerging dry gas Utica˃ ~300,000 net acres in dry gas window˃ ~159,000 net acres concentrated in development
fairway
• Concentrated land position˃ Facilitates longer laterals˃ Leases in primary term˃ 77% of leases contain a 5-year extension option
• Dry gas window delineated˃ 18 drilled horizontal wells of which 7 were pilot wells˃ 200’ – 300’ Utica thickness˃ 80 – 115 Bcf/Section gas in place
Dry Gas OpportunityCHK Leasehold
Industry IP rates from 10-70 mmcf/d
7 I 2Q 2015 EARNINGS 8/5/2015
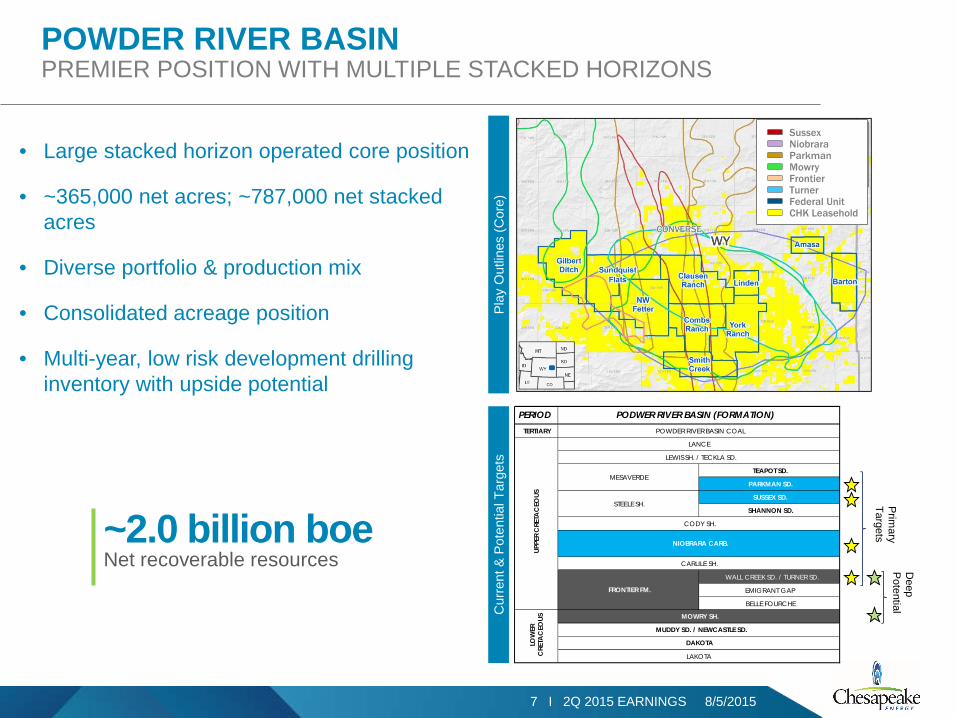
POWDER RIVER BASINPREMIER POSITION WITH MULTIPLE STACKED HORIZONS
• Large stacked horizon operated core position
• ~365,000 net acres; ~787,000 net stacked acres
• Diverse portfolio & production mix
• Consolidated acreage position
• Multi-year, low risk development drilling inventory with upside potential
Play
Out
lines
(Cor
e)
Deep
Potential
Prim
ary Targets
PERIODTERTIARY
TEAPOT SD.
PARKMAN SD.
SUSSEX SD.
SHANNON SD.
WALL CREEK SD. / TURNER SD.
EMIGRANT GAP
BELLE FOURCHE
PODWER RIVER BASIN (FORMATION)POWDER RIVER BASIN COAL
UPPE
R C
RETA
CEO
US
LANCE
LEWIS SH. / TECKLA SD.
MESAVERDE
STEELE SH.
CODY SH.
NIOBRARA CARB.
CARLILE SH.
FRONTIER FM.
MUDDY SD. / NEWCASTLE SD.
DAKOTALOW
ER
CRE
TAC
EOUS MOWRY SH.
LAKOTA
Cur
rent
& P
oten
tial T
arge
ts
~2.0 billion boeNet recoverable resources
SussexNiobraraParkmanMowryFrontierTurnerFederal UnitCHK Leasehold
8 I 2Q 2015 EARNINGS 8/5/2015
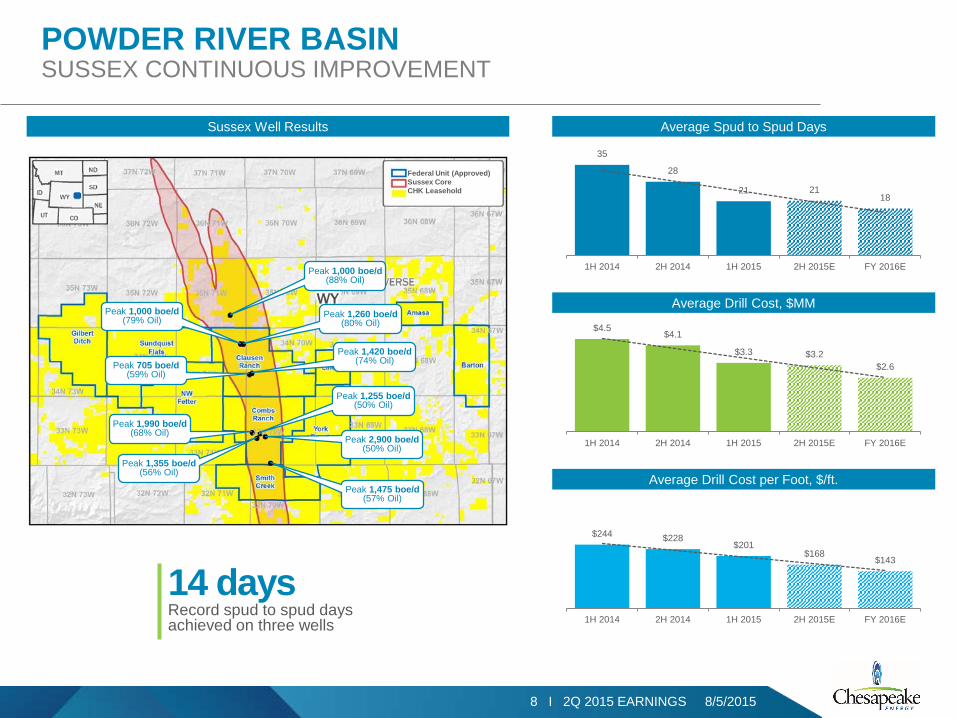
$4.5$4.1
$3.3 $3.2$2.6
1H 2014 2H 2014 1H 2015 2H 2015E FY 2016E
Average Drill Cost, $MM
POWDER RIVER BASINSUSSEX CONTINUOUS IMPROVEMENT
Sussex Well Results
Peak 1,000 boe/d(88% Oil)
Peak 1,260 boe/d(80% Oil)
Peak 1,000 boe/d(79% Oil)
Peak 1,420 boe/d(74% Oil)Peak 705 boe/d
(59% Oil)
Peak 1,255 boe/d(50% Oil)
Peak 2,900 boe/d(50% Oil)
Peak 1,990 boe/d(68% Oil)
Peak 1,355 boe/d(56% Oil)
Peak 1,475 boe/d(57% Oil)
Federal Unit (Approved)Sussex CoreCHK Leasehold
14 daysRecord spud to spud days achieved on three wells
35
28
21 2118
1H 2014 2H 2014 1H 2015 2H 2015E FY 2016E
Average Spud to Spud Days
$244 $228$201
$168$143
1H 2014 2H 2014 1H 2015 2H 2015E FY 2016E
Average Drill Cost per Foot, $/ft.
9 I 2Q 2015 EARNINGS 8/5/2015
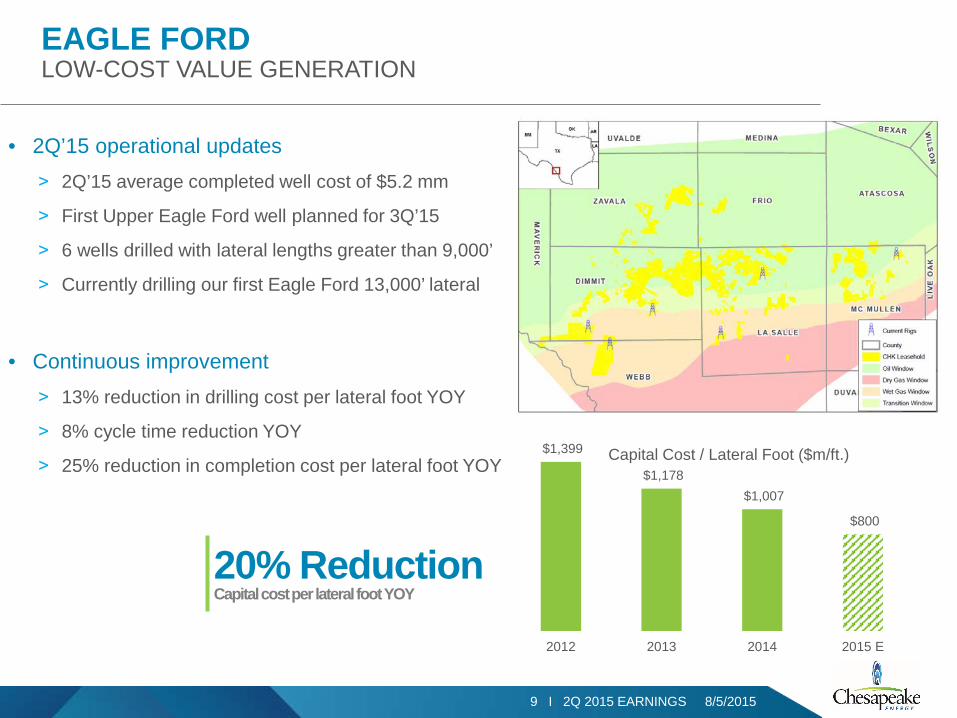
EAGLE FORD LOW-COST VALUE GENERATION
• 2Q’15 operational updates˃ 2Q’15 average completed well cost of $5.2 mm
˃ First Upper Eagle Ford well planned for 3Q’15
˃ 6 wells drilled with lateral lengths greater than 9,000’
˃ Currently drilling our first Eagle Ford 13,000’ lateral
• Continuous improvement˃ 13% reduction in drilling cost per lateral foot YOY
˃ 8% cycle time reduction YOY
˃ 25% reduction in completion cost per lateral foot YOY $1,399
$1,178 $1,007
$800
2012 2013 2014 2015 E
Capital Cost / Lateral Foot ($m/ft.)
20% ReductionCapital cost per lateral foot YOY
10 I 2Q 2015 EARNINGS 8/5/2015
0
20
40
60
0 60 120 180 240
Cum
ulat
ive
Oil
Mbo
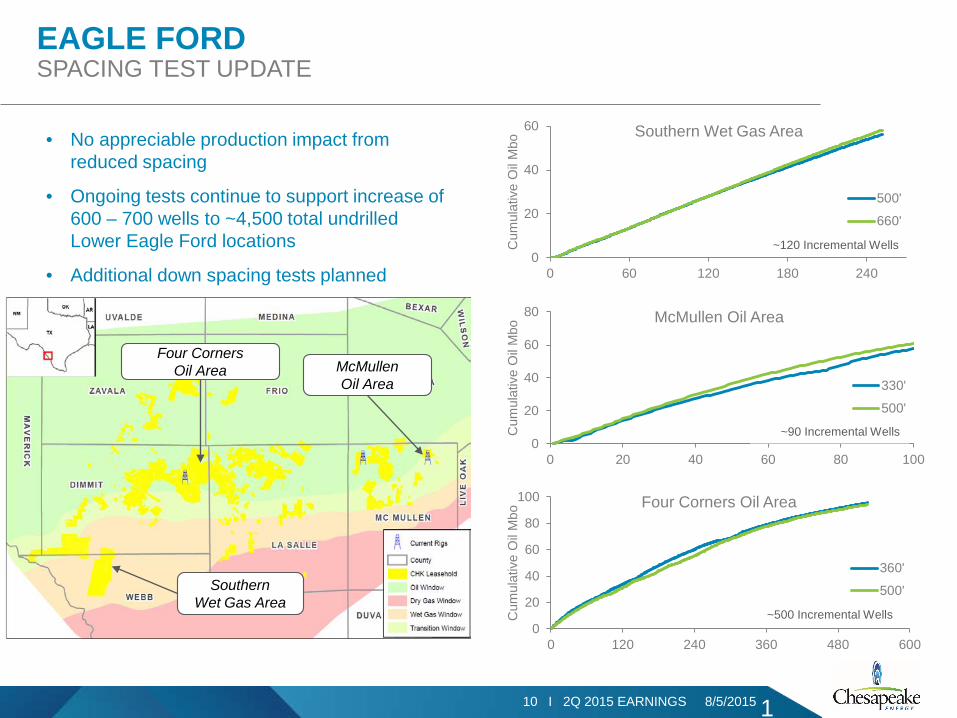
Southern Wet Gas Area
500'
660'
0
20
40
60
80
0 20 40 60 80 100
Cum
ulat
ive
Oil
Mbo
McMullen Oil Area
330'
500'
0
20
40
60
80
100
0 120 240 360 480 600
Cum
ulat
ive
Oil
Mbo
Four Corners Oil Area
360'
500'
• No appreciable production impact from reduced spacing
• Ongoing tests continue to support increase of 600 – 700 wells to ~4,500 total undrilled Lower Eagle Ford locations
• Additional down spacing tests planned
Four CornersOil Area McMullen
Oil Area
Southern Wet Gas Area
~120 Incremental Wells
~500 Incremental Wells
~90 Incremental Wells
EAGLE FORD SPACING TEST UPDATE
1
11 I 2Q 2015 EARNINGS 8/5/2015
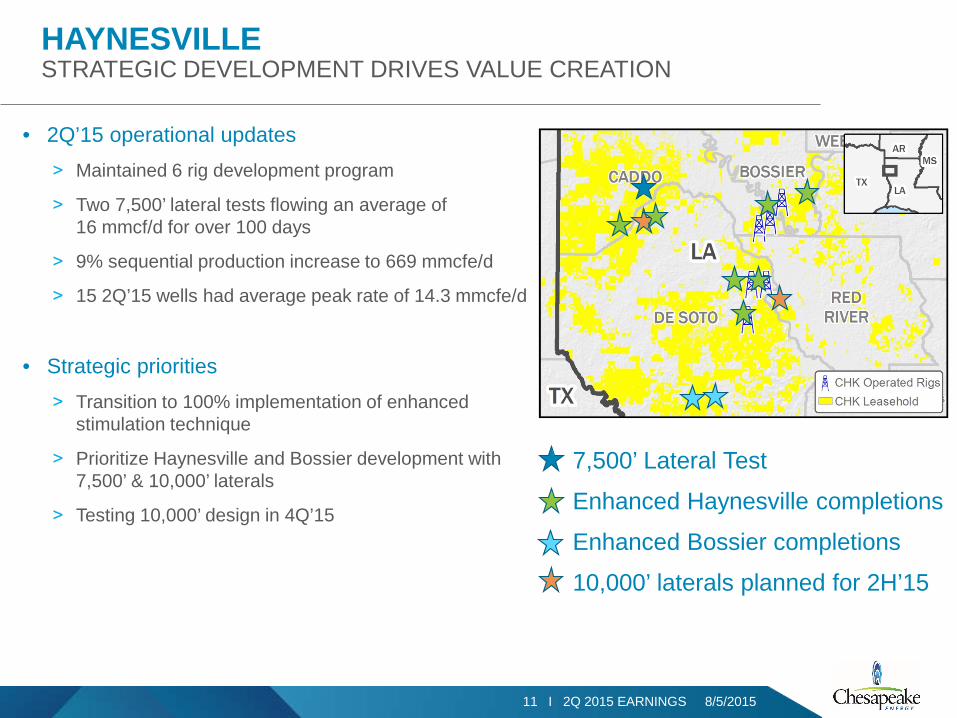
HAYNESVILLE STRATEGIC DEVELOPMENT DRIVES VALUE CREATION
7,500’ Lateral Test
Enhanced Haynesville completions
Enhanced Bossier completions
10,000’ laterals planned for 2H’15
• 2Q’15 operational updates˃ Maintained 6 rig development program
˃ Two 7,500’ lateral tests flowing an average of 16 mmcf/d for over 100 days
˃ 9% sequential production increase to 669 mmcfe/d
˃ 15 2Q’15 wells had average peak rate of 14.3 mmcfe/d
• Strategic priorities˃ Transition to 100% implementation of enhanced
stimulation technique
˃ Prioritize Haynesville and Bossier development with 7,500’ & 10,000’ laterals
˃ Testing 10,000’ design in 4Q’15
12 I 2Q 2015 EARNINGS 8/5/2015
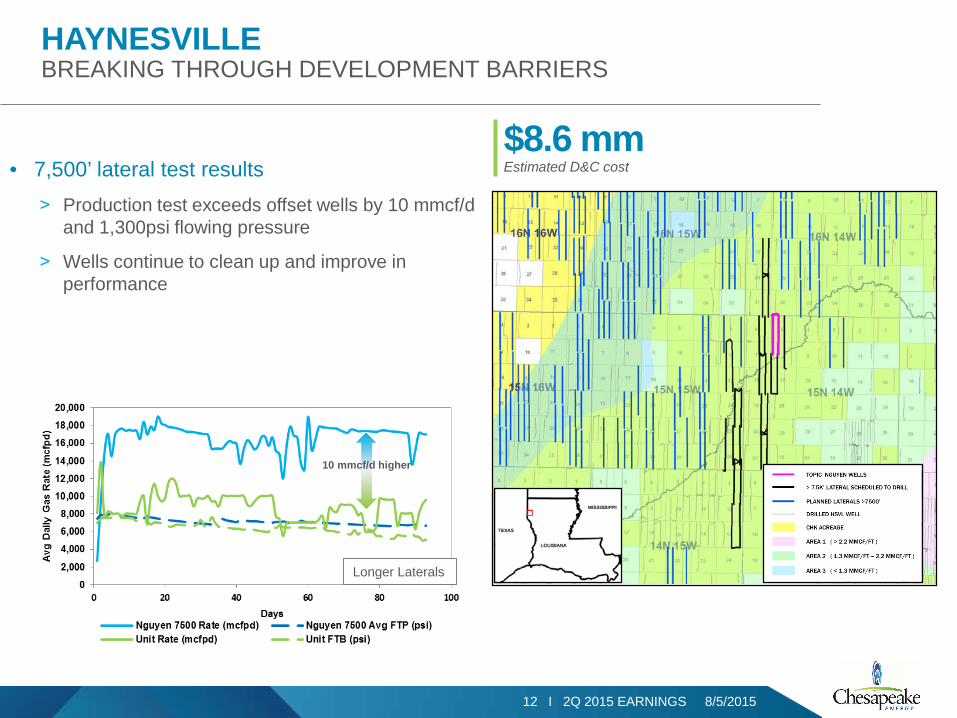
HAYNESVILLEBREAKING THROUGH DEVELOPMENT BARRIERS
$8.6 mmEstimated D&C cost
10 mmcf/d higher
Longer Laterals
• 7,500’ lateral test results˃ Production test exceeds offset wells by 10 mmcf/d
and 1,300psi flowing pressure
˃ Wells continue to clean up and improve in performance
13 I 2Q 2015 EARNINGS 8/5/2015
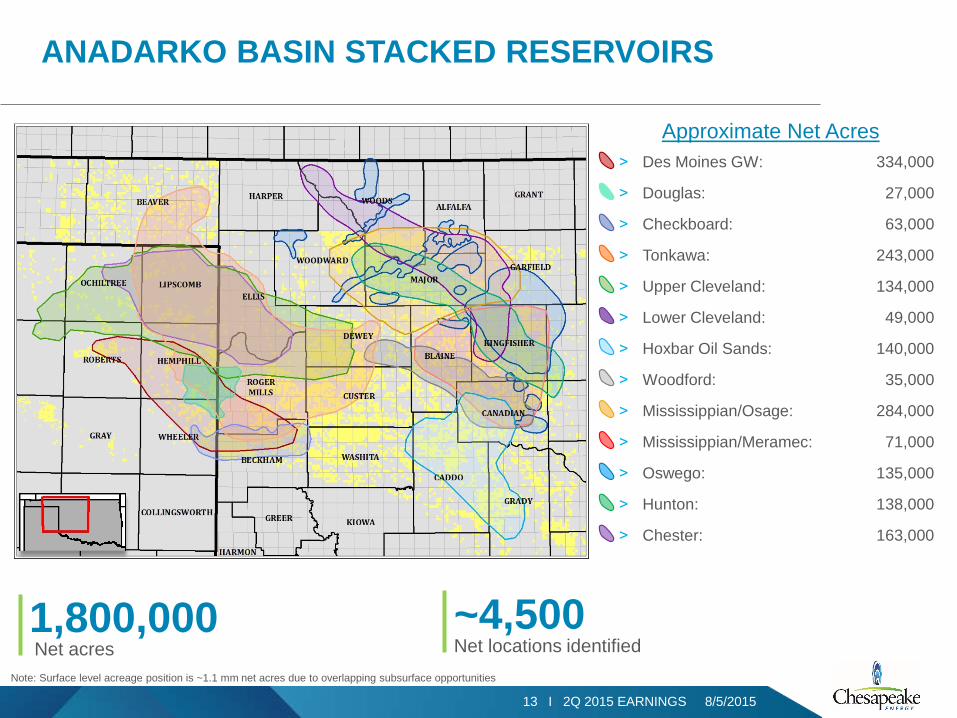
˃ Des Moines GW: 334,000
˃ Douglas: 27,000
˃ Checkboard: 63,000
˃ Tonkawa: 243,000
˃ Upper Cleveland: 134,000
˃ Lower Cleveland: 49,000
˃ Hoxbar Oil Sands: 140,000
˃ Woodford: 35,000
˃ Mississippian/Osage: 284,000
˃ Mississippian/Meramec: 71,000
˃ Oswego: 135,000
˃ Hunton: 138,000
˃ Chester: 163,000
ANADARKO BASIN STACKED RESERVOIRS
Note: Surface level acreage position is ~1.1 mm net acres due to overlapping subsurface opportunities
Approximate Net Acres
1,800,000Net acres
~4,500Net locations identified
14 I 2Q 2015 EARNINGS 8/5/2015
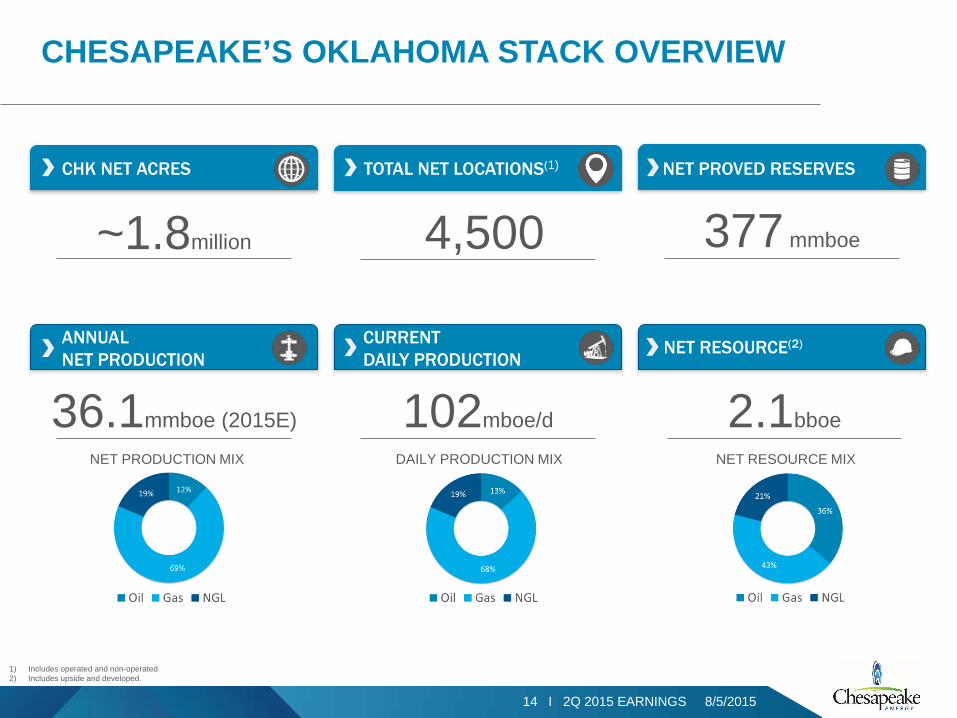
CHESAPEAKE’S OKLAHOMA STACK OVERVIEW
NET PROVED RESERVESCHK NET ACRES TOTAL NET LOCATIONS(1)
377 mmboe4,500~1.8million
36.1mmboe (2015E)
CURRENT DAILY PRODUCTION
NET RESOURCE(2)
102mboe/d 2.1bboe
ANNUAL NET PRODUCTION
1) Includes operated and non-operated2) Includes upside and developed.
NET PRODUCTION MIX DAILY PRODUCTION MIX NET RESOURCE MIX
15 I 2Q 2015 EARNINGS 8/5/2015
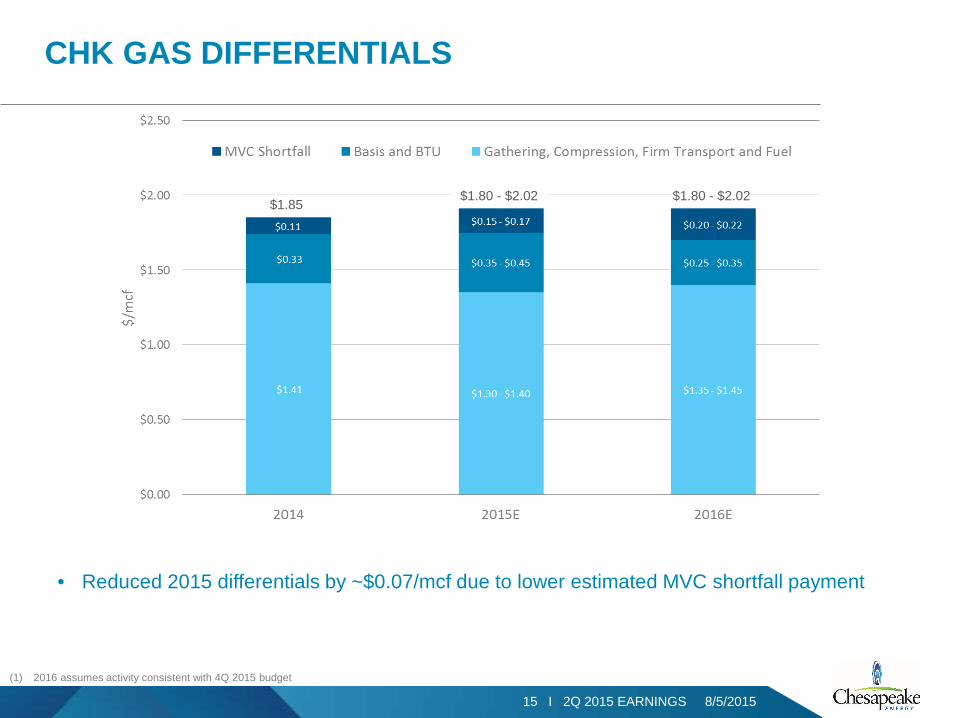
CHK GAS DIFFERENTIALS
$1.85$1.80 - $2.02 $1.80 - $2.02
• Reduced 2015 differentials by ~$0.07/mcf due to lower estimated MVC shortfall payment
(1) 2016 assumes activity consistent with 4Q 2015 budget
16 I 2Q 2015 EARNINGS 8/5/2015
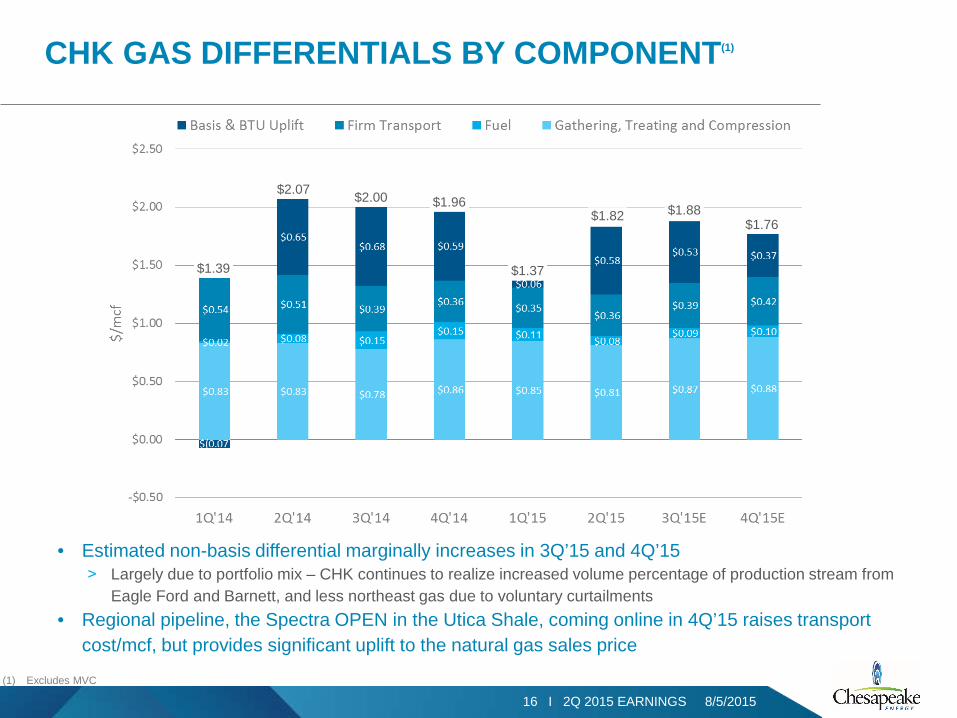
CHK GAS DIFFERENTIALS BY COMPONENT(1)
(1) Excludes MVC
$1.39
$2.07 $2.00 $1.96
$1.37
$1.82 $1.88$1.76
• Estimated non-basis differential marginally increases in 3Q’15 and 4Q’15˃ Largely due to portfolio mix – CHK continues to realize increased volume percentage of production stream from
Eagle Ford and Barnett, and less northeast gas due to voluntary curtailments• Regional pipeline, the Spectra OPEN in the Utica Shale, coming online in 4Q’15 raises transport
cost/mcf, but provides significant uplift to the natural gas sales price
17 I 2Q 2015 EARNINGS 8/5/2015
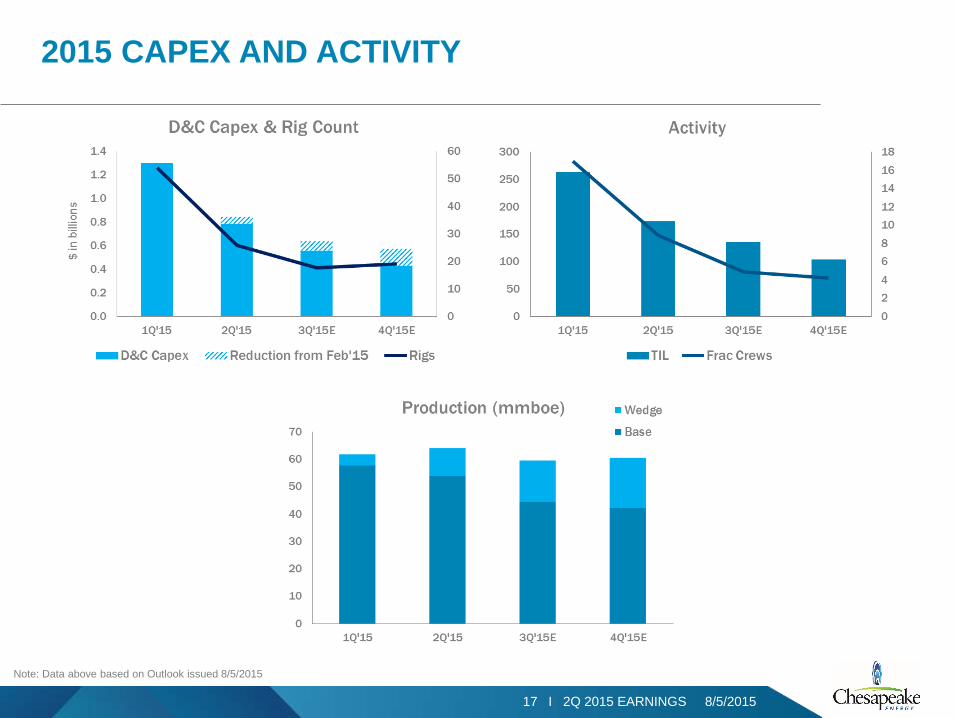
2015 CAPEX AND ACTIVITY
Note: Data above based on Outlook issued 8/5/2015
18 I 2Q 2015 EARNINGS 8/5/201518 I INVESTOR PRESENTATION 8/5/2015
APPENDIX
19 I 2Q 2015 EARNINGS 8/5/2015
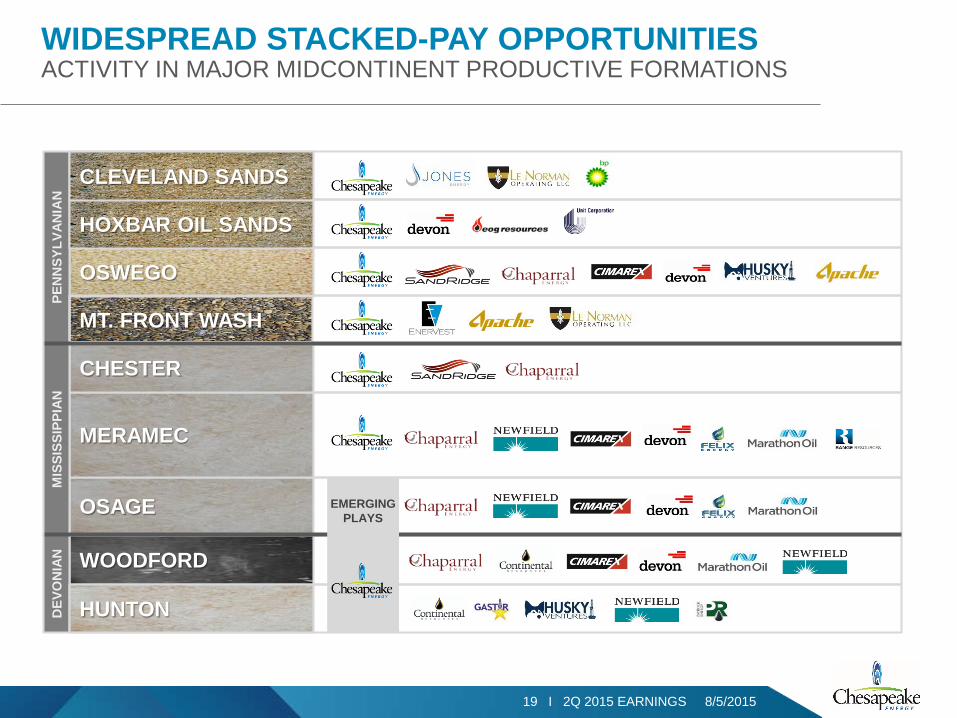
WIDESPREAD STACKED-PAY OPPORTUNITIESACTIVITY IN MAJOR MIDCONTINENT PRODUCTIVE FORMATIONS
WOODFORD
OSAGE
MERAMEC
CHESTER
MIS
SISS
IPPI
AND
EVO
NIA
N
HUNTON
MT. FRONT WASH
OSWEGO
PEN
NSY
LVAN
IAN
HOXBAR OIL SANDS
CLEVELAND SANDS
EMERGING PLAYS
20 I 2Q 2015 EARNINGS 8/5/2015
0
5
10
15
20
25
30
0
1,000
2,000
3,000
4,000
-90 -60 -30 0 30 60 90
Wel
l Cou
nt
Avg
Prod
uctio
n Ra
te (M
cfpd
)
Pre and Post Refrac Days
Pre Refrac Rate Post Refrac Rate Well Count
0
5
10
15
20
25
30
0
1,000
2,000
3,000
4,000
5,000
6,000
7,000
-90 -60 -30 0 30 60 90
Wel
l Cou
nt
Avg
Flow
ing
Tubi
ng P
ress
ure
(psig
)
Pre and Post Refrac DaysPre Refrac FTP Post Refrac FTP Well Count
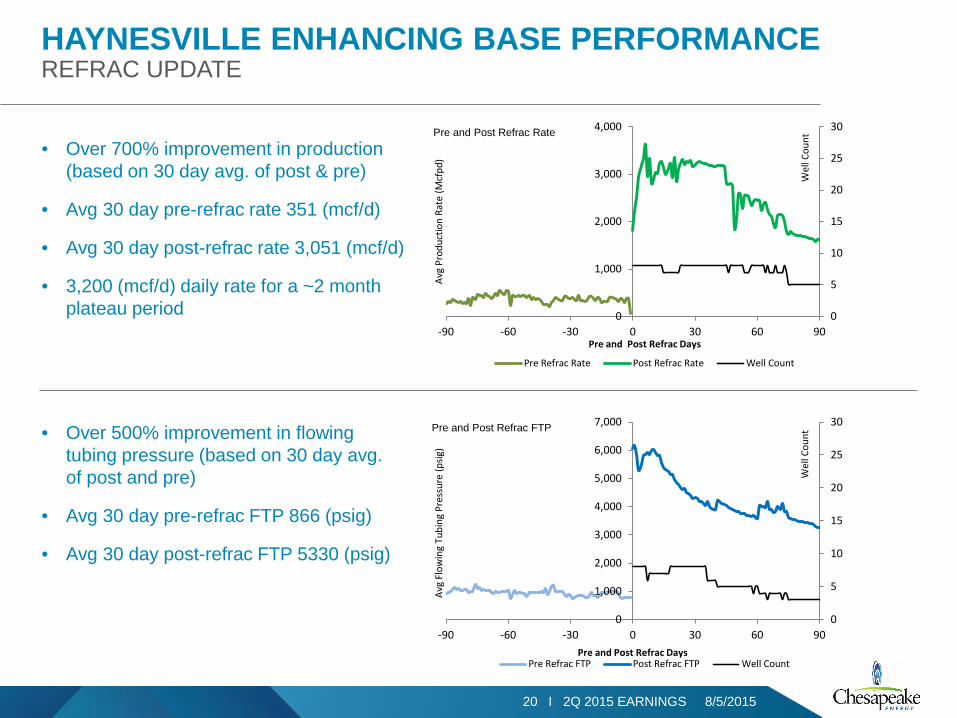
HAYNESVILLE ENHANCING BASE PERFORMANCEREFRAC UPDATE
Pre and Post Refrac Rate
Pre and Post Refrac FTP
• Over 700% improvement in production (based on 30 day avg. of post & pre)
• Avg 30 day pre-refrac rate 351 (mcf/d)
• Avg 30 day post-refrac rate 3,051 (mcf/d)
• 3,200 (mcf/d) daily rate for a ~2 month plateau period
• Over 500% improvement in flowing tubing pressure (based on 30 day avg. of post and pre)
• Avg 30 day pre-refrac FTP 866 (psig)
• Avg 30 day post-refrac FTP 5330 (psig)
21 I 2Q 2015 EARNINGS 8/5/2015
($ in mm)
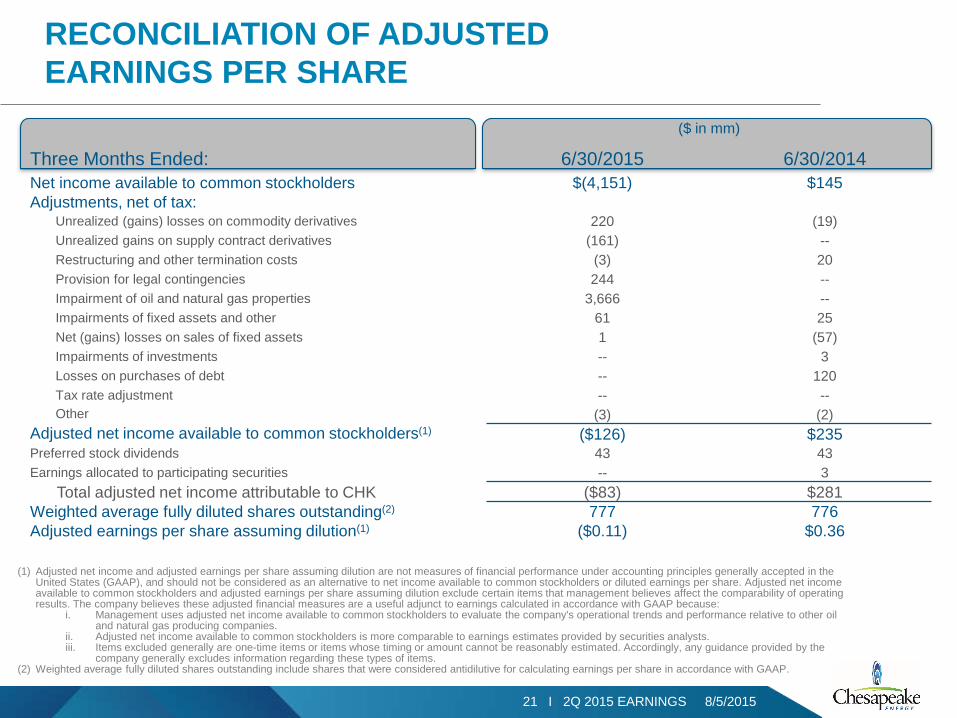
Three Months Ended: 6/30/2015 6/30/2014Net income available to common stockholders $(4,151) $145Adjustments, net of tax:
Unrealized (gains) losses on commodity derivatives 220 (19)Unrealized gains on supply contract derivatives (161) --Restructuring and other termination costs (3) 20Provision for legal contingencies 244 --Impairment of oil and natural gas properties 3,666 --Impairments of fixed assets and other 61 25Net (gains) losses on sales of fixed assets 1 (57)Impairments of investments -- 3Losses on purchases of debt -- 120Tax rate adjustment -- --Other (3) (2)
Adjusted net income available to common stockholders(1) ($126) $235Preferred stock dividends 43 43Earnings allocated to participating securities -- 3
Total adjusted net income attributable to CHK ($83) $281Weighted average fully diluted shares outstanding(2) 777 776Adjusted earnings per share assuming dilution(1) ($0.11) $0.36
(1) Adjusted net income and adjusted earnings per share assuming dilution are not measures of financial performance under accounting principles generally accepted in the United States (GAAP), and should not be considered as an alternative to net income available to common stockholders or diluted earnings per share. Adjusted net income available to common stockholders and adjusted earnings per share assuming dilution exclude certain items that management believes affect the comparability of operating results. The company believes these adjusted financial measures are a useful adjunct to earnings calculated in accordance with GAAP because:
i. Management uses adjusted net income available to common stockholders to evaluate the company's operational trends and performance relative to other oil and natural gas producing companies.
ii. Adjusted net income available to common stockholders is more comparable to earnings estimates provided by securities analysts.iii. Items excluded generally are one-time items or items whose timing or amount cannot be reasonably estimated. Accordingly, any guidance provided by the
company generally excludes information regarding these types of items.(2) Weighted average fully diluted shares outstanding include shares that were considered antidilutive for calculating earnings per share in accordance with GAAP.
RECONCILIATION OF ADJUSTED EARNINGS PER SHARE
22 I 2Q 2015 EARNINGS 8/5/2015
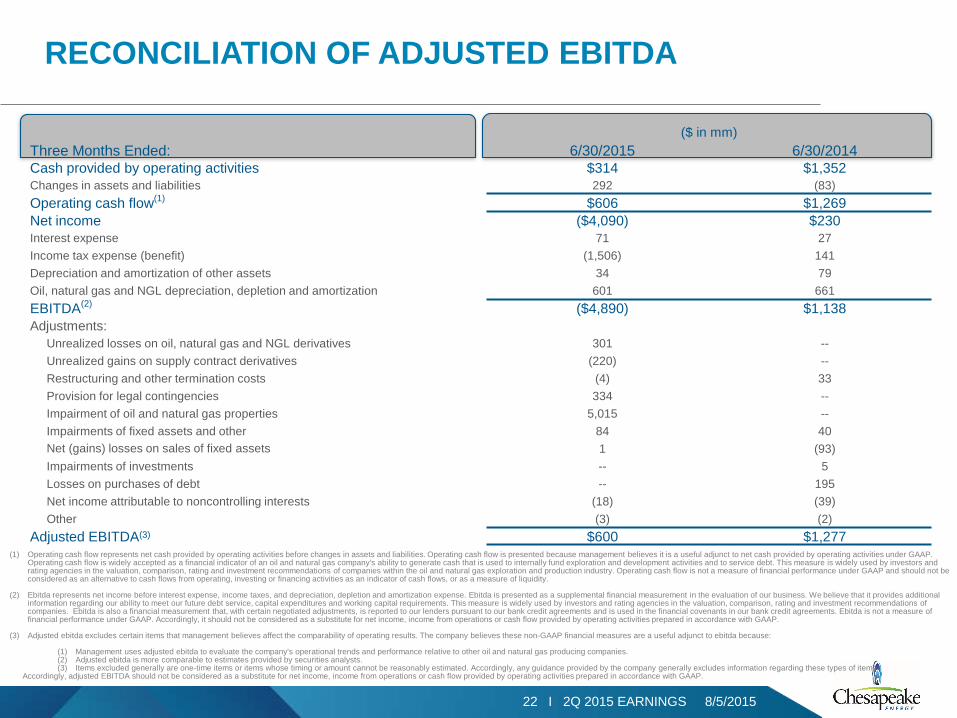
($ in mm)Three Months Ended: 6/30/2015 6/30/2014Cash provided by operating activities $314 $1,352Changes in assets and liabilities 292 (83)Operating cash flow(1) $606 $1,269Net income ($4,090) $230Interest expense 71 27Income tax expense (benefit) (1,506) 141Depreciation and amortization of other assets 34 79Oil, natural gas and NGL depreciation, depletion and amortization 601 661EBITDA(2) ($4,890) $1,138Adjustments:
Unrealized losses on oil, natural gas and NGL derivatives 301 --Unrealized gains on supply contract derivatives (220) --Restructuring and other termination costs (4) 33Provision for legal contingencies 334 --Impairment of oil and natural gas properties 5,015 --Impairments of fixed assets and other 84 40Net (gains) losses on sales of fixed assets 1 (93)Impairments of investments -- 5Losses on purchases of debt -- 195Net income attributable to noncontrolling interests (18) (39)Other (3) (2)
Adjusted EBITDA(3) $600 $1,277
RECONCILIATION OF ADJUSTED EBITDA
(1) Operating cash flow represents net cash provided by operating activities before changes in assets and liabilities. Operating cash flow is presented because management believes it is a useful adjunct to net cash provided by operating activities under GAAP. Operating cash flow is widely accepted as a financial indicator of an oil and natural gas company's ability to generate cash that is used to internally fund exploration and development activities and to service debt. This measure is widely used by investors and rating agencies in the valuation, comparison, rating and investment recommendations of companies within the oil and natural gas exploration and production industry. Operating cash flow is not a measure of financial performance under GAAP and should not be considered as an alternative to cash flows from operating, investing or financing activities as an indicator of cash flows, or as a measure of liquidity.
(2) Ebitda represents net income before interest expense, income taxes, and depreciation, depletion and amortization expense. Ebitda is presented as a supplemental financial measurement in the evaluation of our business. We believe that it provides additional information regarding our ability to meet our future debt service, capital expenditures and working capital requirements. This measure is widely used by investors and rating agencies in the valuation, comparison, rating and investment recommendations of companies. Ebitda is also a financial measurement that, with certain negotiated adjustments, is reported to our lenders pursuant to our bank credit agreements and is used in the financial covenants in our bank credit agreements. Ebitda is not a measure offinancial performance under GAAP. Accordingly, it should not be considered as a substitute for net income, income from operations or cash flow provided by operating activities prepared in accordance with GAAP.
(3) Adjusted ebitda excludes certain items that management believes affect the comparability of operating results. The company believes these non-GAAP financial measures are a useful adjunct to ebitda because:
(1) Management uses adjusted ebitda to evaluate the company's operational trends and performance relative to other oil and natural gas producing companies.(2) Adjusted ebitda is more comparable to estimates provided by securities analysts.(3) Items excluded generally are one-time items or items whose timing or amount cannot be reasonably estimated. Accordingly, any guidance provided by the company generally excludes information regarding these types of items.
Accordingly, adjusted EBITDA should not be considered as a substitute for net income, income from operations or cash flow provided by operating activities prepared in accordance with GAAP.
23 I 2Q 2015 EARNINGS 8/5/2015
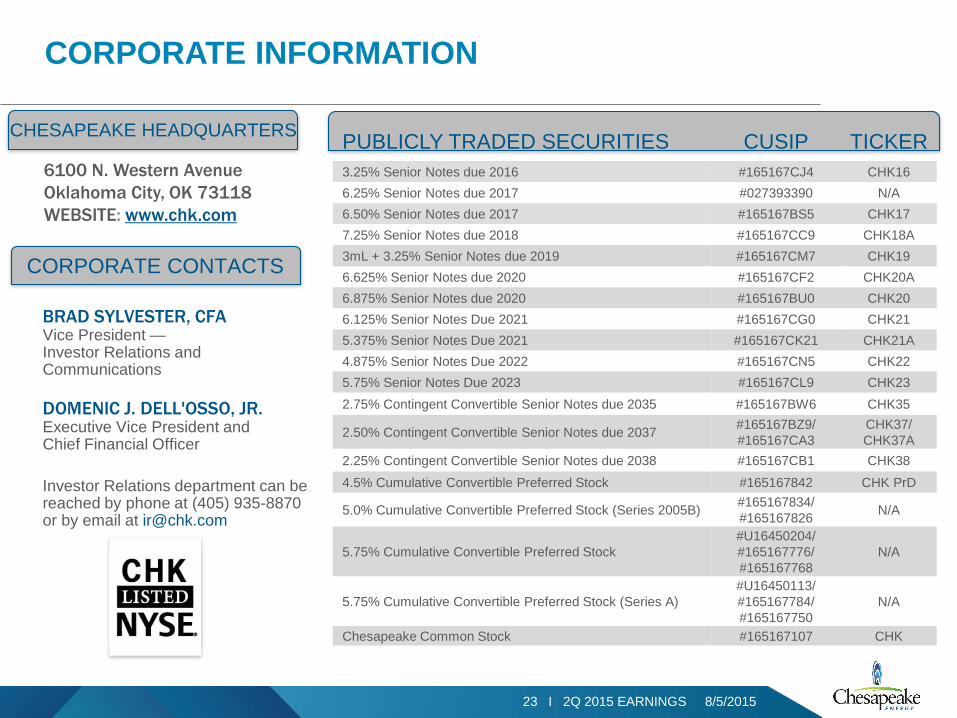
CORPORATE INFORMATION
PUBLICLY TRADED SECURITIES CUSIP TICKER3.25% Senior Notes due 2016 #165167CJ4 CHK166.25% Senior Notes due 2017 #027393390 N/A6.50% Senior Notes due 2017 #165167BS5 CHK177.25% Senior Notes due 2018 #165167CC9 CHK18A3mL + 3.25% Senior Notes due 2019 #165167CM7 CHK196.625% Senior Notes due 2020 #165167CF2 CHK20A6.875% Senior Notes due 2020 #165167BU0 CHK206.125% Senior Notes Due 2021 #165167CG0 CHK215.375% Senior Notes Due 2021 #165167CK21 CHK21A4.875% Senior Notes Due 2022 #165167CN5 CHK225.75% Senior Notes Due 2023 #165167CL9 CHK232.75% Contingent Convertible Senior Notes due 2035 #165167BW6 CHK35
2.50% Contingent Convertible Senior Notes due 2037 #165167BZ9/ #165167CA3
CHK37/ CHK37A
2.25% Contingent Convertible Senior Notes due 2038 #165167CB1 CHK384.5% Cumulative Convertible Preferred Stock #165167842 CHK PrD
5.0% Cumulative Convertible Preferred Stock (Series 2005B) #165167834/#165167826 N/A
5.75% Cumulative Convertible Preferred Stock#U16450204/#165167776/#165167768
N/A
5.75% Cumulative Convertible Preferred Stock (Series A)#U16450113/#165167784/ #165167750
N/A
Chesapeake Common Stock #165167107 CHK
6100 N. Western AvenueOklahoma City, OK 73118WEBSITE: www.chk.com
CHESAPEAKE HEADQUARTERS
BRAD SYLVESTER, CFAVice President —Investor Relations and Communications
DOMENIC J. DELL'OSSO, JR. Executive Vice President and Chief Financial Officer
Investor Relations department can be reached by phone at (405) 935-8870 or by email at [email protected]
CORPORATE CONTACTS