Embed Size (px)
Citation preview

S E P T E M B E R 7 , 2 0 1 6
M O L S O N C O O R S B R E W I N G C O M PAN Y
B AR C L AY S G L O B AL C O N S U M E R S TAP L E S C O N F E R E N C E

S E P T E M B E R 7 , 2 0 1 6
M AR K H U N T E R
P R E S I D E N T & C E OM O L S O N C O O R S B R E W I N G C O M PAN Y

3
F O RWA R D L O O K I N G S TAT E M E N T
This presentation includes estimates or projections that constitute “forward-looking statements” within the meaning of the U.S.
federal securities laws. Generally, the words “believe,” "expect,” "intend,” "anticipate,” “project,” “will,” and similar expressions
identify forward-looking statements, which generally are not historic in nature. Although the Company believes that the
assumptions upon which its forward-looking statements are based are reasonable, it can give no assurance that these
assumptions will prove to be correct. Important factors that could cause actual results to differ materially from the Company’s
historical experience, and present projections and expectations are disclosed in the Company’s filings with the Securities and
Exchange Commission (“SEC”), including in "Risk Factors" in our Annual Report on Form 10-K for the year-ended December
31, 2015. These factors include, among others, our ability to successfully close, finance and integrate the acquisition; our ability
to achieve expected tax benefits, accretion and cost synergies; our ability to obtain necessary regulatory approvals for the
acquisition; impact of increased competition resulting from further consolidation of brewers, competitive pricing and product
pressures; health of the beer industry and our brands in our markets; economic conditions in our markets; additional
impairment charges; our ability to maintain manufacturer/distribution agreements; changes in our supply chain system;
availability or increase in the cost of packaging materials; success of our joint ventures; risks relating to operations in
developing and emerging markets; changes in legal and regulatory requirements, including the regulation of distribution
systems; fluctuations in foreign currency exchange rates; increase in the cost of commodities used in the business; the impact
of climate change and the availability and quality of water; loss or closure of a major brewery or other key facility; our ability to
implement our strategic initiatives, including executing and realizing cost savings; our ability to successfully integrate newly
acquired businesses; pension plan costs; failure to comply with debt covenants or deterioration in our credit rating; our ability to
maintain good labor relations; our ability to maintain brand image, reputation and product quality; lack of full-control over the
operations of MillerCoors and other risks discussed in our filings with the SEC, including our Annual Report on Form 10-K for
the year-ended December 31, 2015. All forward-looking statements in this presentation are expressly qualified by such
cautionary statements and by reference to the underlying assumptions. You should not place undue reliance on forward-looking
statements, which speak only as of the date they are made. We do not undertake to update forward-looking statements,
whether as a result of new information, future events or otherwise.

4
TO D AY ’ S A G E N D A
MARK HUNTER, CEO, MOLSON COORS
• Introductions, corporate overview, strategic focus and growth opportunities
MAURICIO RESTREPO, CFO, MOLSON COORS
• Strategies to grow profit, cash, total shareholder return
Q&A

5
M O L S O N C O O R S TO D AY
$ 6 . 8 B I L L I O N I N R E V E N U E A N D $ 1 . 3 B I L L I O N I N E B I T D A
(1) Excludes Corporate and Eliminations from the total.(2) Does not include underlying operating losses for Corporate and MCI. Non GAAP underlying income is calculated by excluding
special and other non-core items from the nearest U.S. GAAP earnings. See reconciliation to nearest U.S. GAAP measures on our website.
EUROPE
CANADA
UNITED STATES (42%)
INTERNATIONAL MARKETS
45% 48% 53%
13%
22%
28%
37%
28%19%
2%
WORLDWIDEBEER VOLUME
NETSALES (1)
UNDERLYINGPRETAX(2)
5%

6
L E A D I N G M A R K E T & B R A N D P O S I T I O N S
# 1 O R # 2 I N M O S T O F O U R M A R K E T S
We have our brands in over 50 countries through our license and export business.
* Company/Industry Estimates, based on full year 2015 results.
MARKET MARKET POSTIONS* BRAND POSITION* BRAND
USA #2 #2 & #4
Canada #2 #2 & #4
UK #2 #1
Bulgaria #1 #1
Croatia #1 #1
Serbia #1 #1
Czech Republic #2 #4
Hungary #3 #2
Romania #3 #5
Bosnia #1 #1
Slovakia #3 #5
Montenegro #1 #1

7
A F O C U S O N D E L I V E R I N G G R O W T H & L O N G T E R M
S H A R E H O L D E R VA L U E
• Investing behind core brands
• Driving share in above premium
• Delivering value-added innovation
• Commercial excellence
• Cost reductions
• Capital expenditure
driving efficiencies
• Working Capital improvements
• Sale of non-core assets
• Disciplined cash use
• Return-driven criteria
• Balanced priorities
PROFIT AFTER
CAPITAL CHARGE
TOTAL
SHAREHOLDER
RETURN
(TSR)
BRAND-LED
PROFIT
GROWTH
CASH AND
CAPITAL
ALLOCATION
CASH
GENERATION
PA C C R E M A I N S K E Y D E C I S I O N D R I V E R

8
• Brand-led revenue and profit growth
• Cash generation
• Cash and capital allocation, underpinned by PACC
TOTAL SHAREHOLDER RETURN TAP SHARES
5 YEAR 170%
3 YEAR 126%
1 YEAR 58%
A S T R O N G R E C O R D O F S H A R E H O L D E R R E T U R N S
O U T P E R F O R M E D T H E S & P 5 0 0 O V E R 1 , 3 A N D 5 Y E A R H O R I Z O N S
Total Shareholder Return (TSR) = TAP stock price, plus dividends (intraday September 2, 2016).
TAP

9
O U R S T R AT E G I C F R A M E W O R K – M C B C B R E W H O U S E
D R I V I N G O U R F I R S T C H O I C E A M B I T I O N

10
ECONOMY IMPORT SPECIALTY CRAFT PREMIUM
A C Q U I R I N G M I L L E R C O O R S & M I L L E R I N T E R N AT I O N A L
A U N I Q U E A N D G A M E - C H A N G I N G O P P O R T U N I T Y F O R M O L S O N C O O R S
Consistent with Molson Coors’ strategic vision
Seamless integration based on existing ownership
Iconic American beer brands support global growth
Drives substantial financial benefits to shareholders
Continues strategic evolution of Molson Coors

11
M O L S O N C O O R S : TO D AY V S . TO M O R R O WD O U B L E S T H E S I Z E O F T H E C O M PA N Y
Plus: $200 million of annualized cost synergies by Year 4
Plus: More than $250 million of annual cash tax benefit
TODAY42% OF MILLERCOORS
TOMORROWPRO FORMA – 100%OF MILLERCOORS
2015 Net sales
2015 Underlying EBITDA income
$6.8 BILLION
$1.3BILLION
$11.2 BILLION
$2.3BILLION
2015 Underlying operating income
2015 Volume
$936MILLION
$1.6BILLION
58MILLION HLs
94MILLION HLs
12
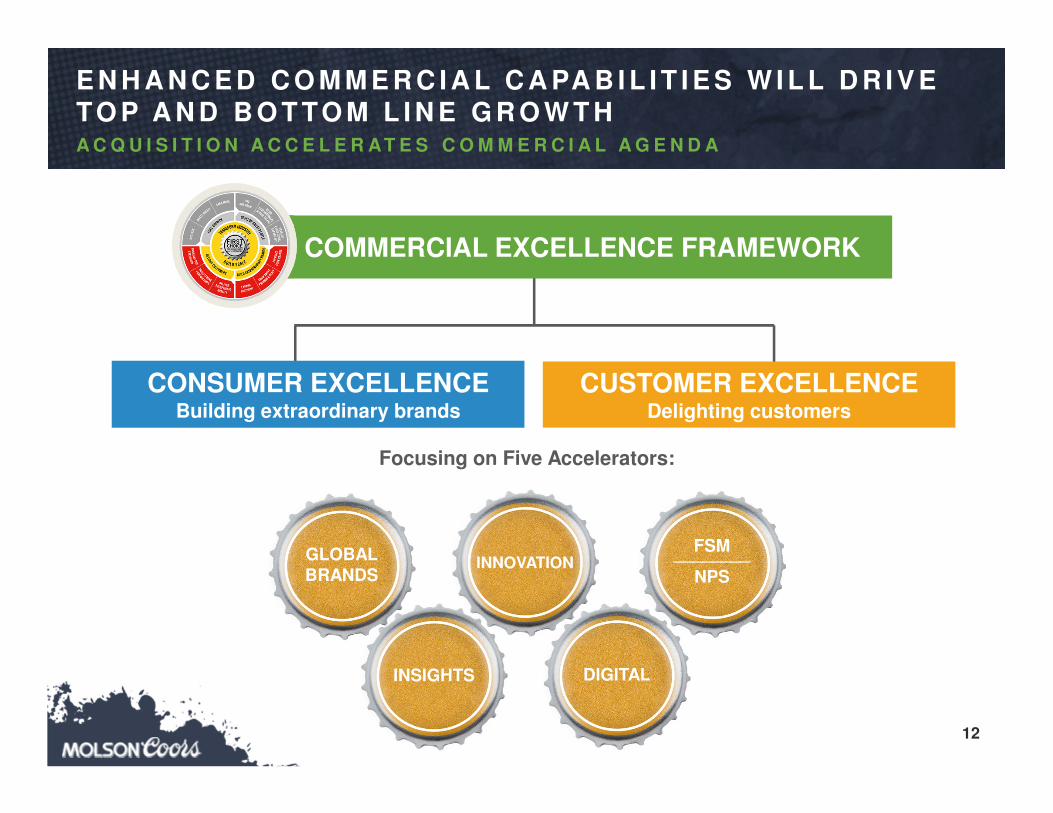
E N H A N C E D C O M M E R C I A L C A PA B I L I T I E S W I L L D R I V E TO P A N D B O T TO M L I N E G R O W T H
DIGITAL
CUSTOM
ER
RELATIO
NSHIPSCUSTOMER
RELATIONSHI
PS
Focusing on Five Accelerators:
INSIGHTS
CONSUMER EXCELLENCEBuilding extraordinary brands
CUSTOMER EXCELLENCEDelighting customers
COMMERCIAL EXCELLENCE FRAMEWORK
A C Q U I S I T I O N A C C E L E R AT E S C O M M E R C I A L A G E N D A
GLOBALBRANDS
INSIGHTS
INNOVATION
DIGITAL
FSM________
NPS

13
A C C E L E R AT I N G G L O B A L B R A N D S
B U I L D I N G A N E X T R A O R D I N A R Y B R A N D P O R T F O L I O
• Sharpened Portfolio Strategy
• Distinctive Brand Propositions
• Global Brands + Emerging Categories Centre of Expertise
• Consumer Excellence Capability
• Commercial Excellence Academy
GLOBAL TRADEMARK
BRANDS
GLOBALBRANDS
NATIONAL CHAMPIONS
HIGH-GROWTH CRAFT &
AP PORTFOLIO
GLOBALBRANDS

Insert Coors Banquet Commercials

15
A C C E L E R AT I N G G L O B A L B R A N D S
B U I L D I N G A N E X T R A O R D I N A R Y B R A N D P O R T F O L I O
• Sharpened Portfolio Strategy
• Distinctive Brand Propositions
• Global Brands + Emerging Categories Centre of Expertise
• Consumer Excellence Capability
• Commercial Excellence Academy
GLOBAL TRADEMARK
BRANDS
NATIONAL CHAMPIONS
HIGH-GROWTH CRAFT &
AP PORTFOLIO
GLOBALBRANDS

16
# 1 C R A F T B R A N D I N M O S T O F O U R C O R E M A R K E T S
L E A D I N G G L O B A L C R A F T P O R T F O L I O
#1 US Craft Brand
US
EUROPE
CANADA
#1 UK Craft Brand #1 Irish Craft Brewery
#1 US Shandy Brand

17
A C C E L E R AT I N G O U R F O C U S O N I N S I G H T S & D I G I TA L
• Embed global segmentation model
• Sharpened portfolio strategy
• Distinctive brand propositions
• New Global Digital Centre of Expertise Team
• Digital Experts now placed in all key markets
• Partnerships with Leading Digital companies
• Digital Incubator & Venturing
B U I L D I N G S T R O N G E R C O N S U M E R C O N N E C T I O N S
INSIGHTS DIGITAL

18
A C C E L E R AT I N G O U R I N N O VAT I O N A G E N D A
• New Global Innovation Centre of Expertise Team
• White spaces for Innovation
• Enterprise projects, in flight
• Leverage MillerCoors approach
• Best of Both Processes & Tools
B U I L D I N G S T R O N G E R C O N S U M E R C O N N E C T I O N S
INNOVATION

19
F I R S T C H O I C E F O R C U S TO M E R S
S U P E R I O R C U S T O M E R E X P E R I E N C E A N D F R O N T - L I N E R E L AT I O N S H I P S
• Relentless focus on customer experience
• Net Promotor Score (NPS) as primary metric• Voted #1 supplier by Tamarron Survey in the US
• Best rated supplier by UK’s largest grocer Tesco
• Voted #1 in UK’s Advantage Survey (Major Chain Grocers)
• Ranked #1 supplier by Boston Pizza in Canada
• Deployed Field Sales Management (FSM) and NPS across Canada & Europe
• Compensation link to execution
• Best of both process & tools
FSM________
NPS

20
B U I L D I N G A B I G G E R A N D B E T T E R B U S I N E S S
CUSTOM
ER
RELATIO
NSHIPSCUSTOMER
RELATIONSHI
PS
INSIGHTS
CONSUMER EXCELLENCEBuilding extraordinary brands
CUSTOMER EXCELLENCEDelighting customers
COMMERCIAL EXCELLENCE FRAMEWORK
A C C E L E R AT I N G O U R C O M M E R C I A L A G E N D A T O D R I V E G R O W T H
A stronger, more effective competitor with enhanced commercial capabilities to drive top-line growth and win in the marketplace.
GLOBALBRANDS
INSIGHTS
INNOVATION
DIGITAL
FSM________
NPS

S E P T E M B E R 7 , 2 0 1 6
M AU R I C I O R E S T R E P O
G L O B AL C F OM O L S O N C O O R S B R E W I N G C O M PAN Y

22
D R I V I N G G R O W T H T H R O U G H F O C U S O N S T R AT E G I E S A N D PA C C M O D E L

23
T H E PA C C M O D E L

24
• Investing behind core brands
• Driving share in above premium
• Delivering value-added innovation
• Commercial excellence
• Cost reductions
• Capital expenditure
driving efficiencies
• Working Capital improvements
• Sale of non-core assets
• Disciplined cash use
• Return-driven criteria
• Balanced priorities
PROFIT AFTER
CAPITAL CHARGE
TOTAL
SHAREHOLDER
RETURN
(TSR)
BRAND-LED
PROFIT
GROWTH
CASH AND
CAPITAL
ALLOCATION
CASH
GENERATION
D R I V I N G TO TA L S H A R E H O L D E R R E T U R N W I T H PA C C M O D E L

25
EARN MORE
INVEST WISELY
USE LESS
D R I V I N G TO TA L S H A R E H O L D E R R E T U R N W I T H PA C C M O D E L
PROFIT AFTER
CAPITAL CHARGE
TOTAL
SHAREHOLDER
RETURN
(TSR)

26
Up 2% in first half 2016.
(1) Non-GAAP underlying pretax income is calculated by excluding special and other non-core items from the nearest U.S. GAAP earnings. See reconciliation to nearest U.S. GAAP measures in our 10-K.
$821 $865 $865
$904
$832
$430 $439
$0
$200
$400
$600
$800
$1000
2011 2012 2013 2014 2015 1H 2015 1H 2016
($ millions)
C O N S I S T E N T F I N A N C I A L P E R F O R M A N C E E V E N I N TO U G H T I M E S …
UNDERLYING PRETAX INCOME(1)

27
Over $1.4 billion of cumulative annualized cost savings delivered.
(1) Includes 42% of MillerCoors cost savings.
$81
$185
$331 $442
$657
$851
$958
$1,078
$1,195
$1,333 $1,434
$0
$200
$400
$600
$800
$1000
$1200
$1400
2005 2006 2007 2008 2009 2010 2011 2012 2013 2014 2015
($ millions)
C O S T R E D U C T I O N S H E L P TO D R I V E TO P L I N E A N D B O T TO M L I N E
CUMULATIVE ANNUALIZED COST SAVINGS(1)

28
Substantial % of savings reinvested for profitable growth.
LONG-TERM SUSTAINABILITY
• Captured almost $65 million of savings in 2015 (1)
• Expect cost savings of $50-$70 million/year for at least the next 2 years(1)
DRIVEN THROUGH EFFICIENCY AND EFFECTIVENESS
• Canada Supply Chain and China Restructuring
• U.S.: Eden brewery closure announced
• Europe: Alton and Plovdiv Closures, Burton South agreement
• Canada: Vancouver sale, Montreal under review
(1) Excludes MillerCoors cost savings.
O N G O I N G C O S T E F F I C I E N C I E S W I L L F U E L G R O W T H I N V E S T M E N T S

29
Commitment to maintaining investment-grade debt ratings.
(1) Pro forma net debt/underlying EBITDA. Non-GAAP underlying EBITDA (Earnings before interest, taxes, depreciation and amortization) is calculated excluding special and other non-core items from U.S. GAAP earnings. See reconciliation to nearest U.S. GAAP measures in our 2015 10-K, as well as pro forma financial results in our 8-K filed on May12, 2016. Does not include transaction-related cash tax benefits.
Note: Years 2011 through 2015 include 42% of MillerCoors underlying EBITDA.
F O C U S O N PAY I N G D O W N D E B T
0.7
2.8
2.31.7x 1.9x
5.3x
0x
1x
2x
3x
4x
5x
6x
2011 2012 PF 2013 2014 2015 2015 PF (1)
NET DEBT / EBITDA
Net debt reduced by +1.5 billion
X
X
X

30
Will revisit dividend policy once deleveraging is well underway.
$0.64 $0.64
$0.76
$0.92
$1.08 $1.24 $1.28
$1.28$1.48
$1.64
$0.0
$0.2
$0.4
$0.6
$0.8
$1.0
$1.2
$1.4
$1.6
$1.8
$2.0
2006 2007 2008 2009 2010 2011 2012 2013 2014 2015
C O M M I T T E D TO C A S H R E T U R N S V I A D I V I D E N D S
DIVIDENDS PAID (ANNUAL PER SHARE)

31
Consistent return-driven criteria, anchored by PACC.
D I S C I P L I N E D C A S H U S E
STRENGTHENBalance sheet
RETURN CASH to shareholders
CASH USE PRIORITIES
Brand-ledGROWTH
OPPORTUNITIES

32
More than $250 million of cash tax benefits in each of first 15 years.
E N H A N C I N G V I S I B I L I T Y
T R A N S A C T I O N - R E L AT E D R E P O R T I N G : E P S
Underlying After-Tax Income(2) $A
Plus: Annual after-tax transaction-related book amortization (non-cash)
$B(3)
Plus: Annual transaction-related cash tax benefits
$1.15
Equals: Underlying transaction-adjusted EPS
$A + $B + $1.15
Example: 2015 pro forma transaction-adjusted EPS
$4.33 + $0.24 + $1.15 = $5.72/share
P&L Item Per Share(1)
(1) Based on May 12, 2016, pro forma financial information, including 216.3 diluted shares outstanding, as well as estimated cash tax benefits of $250 million/year, but excludes Miller Global brands business. See our website (www.molsoncoors.com) for a reconciliation to nearest U.S. GAAP measure.
(2) Net income from continuing operations attributable to MCBC from Exhibit 99.3 of 8-K filed on May 12, 2016, has been adjusted to take into account transaction-related permanent financing completed in July 2016 (which drove a decrease of $199.8 million to PF interest expense), as well as the related tax impact (an increase of $75.8 million to PF income tax expense).
(3) Assumed 38% tax rate.

33
Increased visibility to gross cost savings.
FUTURE STATECURRENT STATE
Molson Coors annual cost savings
• $50-$70 million/year for at least 2 years
Transaction-related cost synergies
• $200 million by year 4 (annualized)
MillerCoors cost savings
• No forward targets
• Quarterly historical reporting
All-in multi-year savings target
_______________________________
Annual cost savings reporting
I N C R E A S I N G A L I G N M E N T, V I S I B I L I T Y & A C C O U N T A B I L I T Y
T R A N S A C T I O N - R E L AT E D R E P O R T I N G : C O S T S AV I N G S

34
D R I V I N G TO TA L S H A R E H O L D E R R E T U R N W I T H PA C C M O D E L
EARN MORE
INVEST WISELY
USE LESS
PROFIT AFTER
CAPITAL CHARGE
TOTAL
SHAREHOLDER
RETURN
(TSR)

35
B U I L D I N G A B I G G E R A N D B E T T E R B U S I N E S S
DIGITAL
CUSTOM
ER
RELATIO
NSHIPSCUSTOMER
RELATIONSHI
PS
INSIGHTS
CONSUMER EXCELLENCEBuilding extraordinary brands
CUSTOMER EXCELLENCEDelighting customers
COMMERCIAL EXCELLENCE FRAMEWORK
A stronger, more effective competitor with enhanced commercial capabilities to drive top-line growth and win in the marketplace.
A C C E L E R AT I N G O U R C O M M E R C I A L A G E N D A T O D R I V E G R O W T H
GLOBALBRANDS
INSIGHTS
INNOVATION
DIGITAL
FSM________
NPS

S E P T E M B E R 7 , 2 0 1 6
M O L S O N C O O R S B R E W I N G C O M PAN Y
B AR C L AY S G L O B AL C O N S U M E R S TAP L E S C O N F E R E N C E


![Septins: New Microtubule Interacting PartnersSEPT2 SEPT2 coimmunoprecipitates with the exocyst complex and tubulin, and aligns along interphase MTs in PC12 cells[20]. SEPT2 partially](https://img.pdfslide.us/doc/110x75/60cb385bb9174017cc1b2ba9/septins-new-microtubule-interacting-partners-sept2-sept2-coimmunoprecipitates-with.jpg)