Embed Size (px)
Citation preview
Barclays Global Consumer Staples Conference September 9, 2015

2
This presentation contains “forward-looking statements” within the meaning of U.S. federal securities laws. Forward-looking statements are not historical facts, and are based upon management’s current expectations, beliefs, projections and targets, many of which, by their nature, are inherently uncertain. Such expectations, beliefs, projections and targets are expressed in good faith. However, there can be no assurance that management’s expectations, beliefs, projections and targets will be achieved and actual results may differ materially from what is expressed in or indicated by the forward- looking statements. Forward-looking statements are subject to significant business, economic, regulatory and competitive risks and uncertainties that could cause actual performance or results to differ materially from those expressed in the forward-looking statements, including risks detailed in Pinnacle Foods Inc.’s (“Pinnacle Foods,” “Pinnacle” or the “Company”) filings with the U.S. Securities and Exchange Commission (the “SEC”). Nothing in this presentation should be regarded as a representation by any person that these forward-looking statements will be achieved.
Forward-looking statements speak only as of the date the statements are made. The Company assumes no obligation to update forward-looking statements to reflect actual results, subsequent events or circumstances or other changes affecting forward-looking information except to the extent required by applicable securities laws.
This presentation includes certain financial measures, including Adjusted Gross Profit and Unleveraged Free Cash Flow, which differ from results using U.S. Generally Accepted Accounting Principles (GAAP). Non-GAAP financial measures typically exclude certain charges, which are not expected to occur routinely in future periods. The Company uses non-GAAP financial measures internally to focus management on performance excluding these special charges to gauge our business operating performance. Management believes this information is helpful to investors in understanding trends in the business. The most directly comparable GAAP financial measures and reconciliations to non-GAAP financial measures are set forth in the slides in this presentation and included in the Company’s filings with the SEC.
Forward-Looking Statements & Non-GAAP Financial Measures

3
Agenda Overview
Executing Our Strategy
Financial Update
Outlook
4
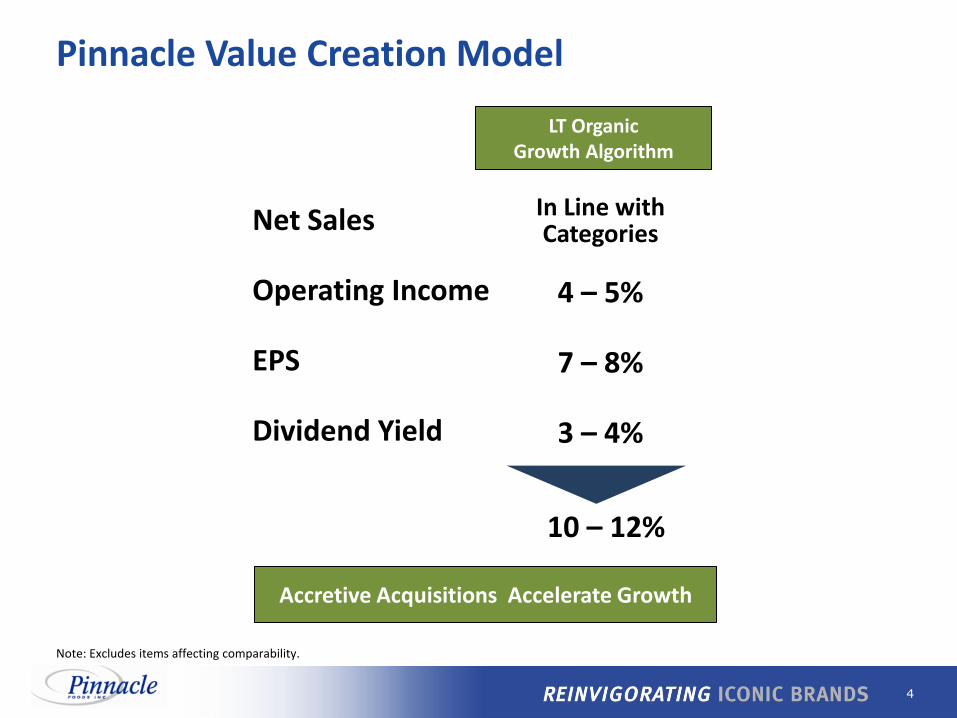
Pinnacle Value Creation Model
Net Sales
Operating Income
EPS
Dividend Yield
In Line with Categories
10 – 12%
4 – 5%
7 – 8%
3 – 4%
LT Organic Growth Algorithm
Accretive Acquisitions Accelerate Growth
Note: Excludes items affecting comparability.
5
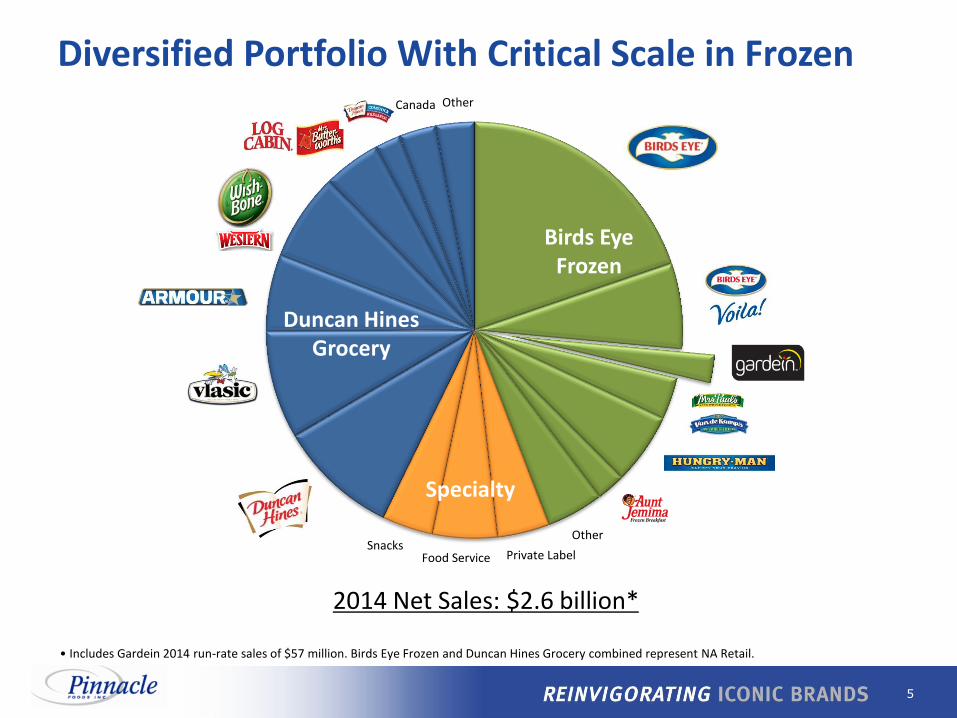
Birds Eye Frozen
Specialty
Duncan Hines Grocery
Other
2014 Net Sales: $2.6 billion*
Diversified Portfolio With Critical Scale in Frozen
• Includes Gardein 2014 run-rate sales of $57 million. Birds Eye Frozen and Duncan Hines Grocery combined represent NA Retail.
Canada
Snacks Food Service Private Label
Other

6
70% 77% 73%
80%
Net Sales
2014 2015 2014 2015
30% 23% 27%
20%
2014 2015 2014 2015
Invest in marketing to drive growth and share expansion
Focus on breakthrough innovation
Gross Profit Net Sales Gross Profit
Maintain stable sales/market position and cash flow
Focus on brand renovation
Leadership Brands Foundation Brands
(% of NA Retail) (% of NA Retail)
1st Half: 1st Half:
Portfolio Management Strategy

7
Net Sales
Operating Income
EPS
Dividend Yield
In Line with Categories
10 – 12%
4 – 5%
7 – 8%
3 – 4%
LT Organic Growth Algorithm
10%
39%
3%
Outpaced Categories
42%
2013 Actual
Accretive Acquisitions Accelerate Growth Beyond Algorithm
Note: Excludes items affecting comparability. See reconciliation to GAAP financial measures in Appendix.
17%
14%
2014 Actual
Outpaced Categories
3%
13%
Attractive Value Creation Results

8
Agenda Overview
Executing Our Strategy
Financial Update
Outlook
9
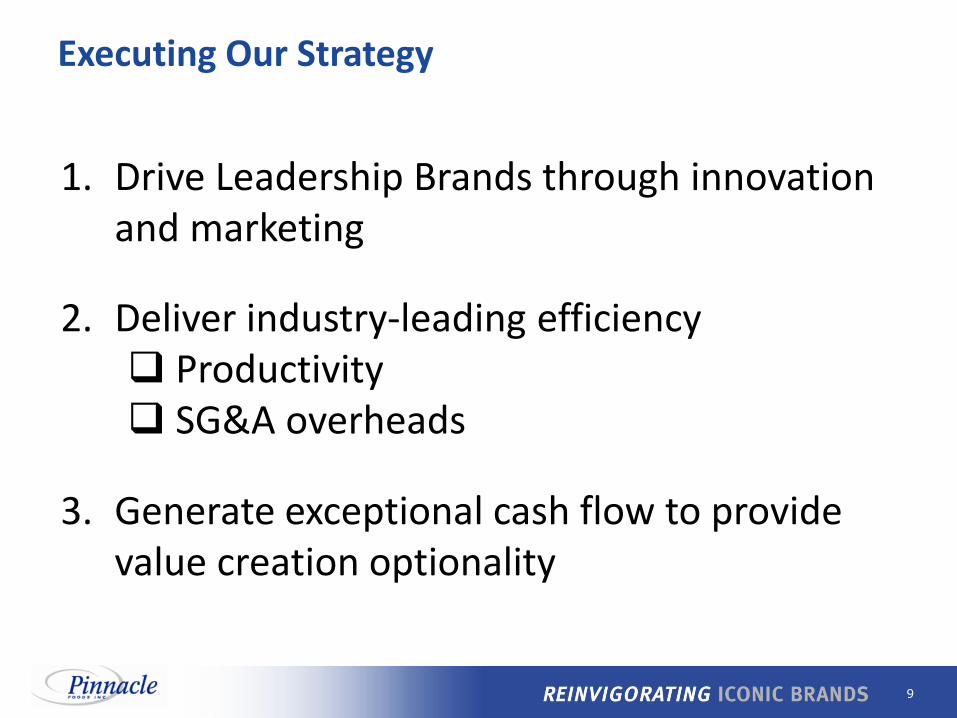
3. Generate exceptional cash flow to provide value creation optionality
1. Drive Leadership Brands through innovation and marketing
2. Deliver industry-leading efficiency Productivity SG&A overheads
Executing Our Strategy

10
Leadership Brands
Category
Pinnacle Market Position
Growing/ Holding Share
Frozen Vegetables #1
Frozen Complete Bagged Meals #1
Frozen Prepared Seafood #2
Frozen/Refrig. Meat Substitutes #4
Shelf-Stable Pickles #1
Table Syrups #1
Cake/Brownie Mixes and Frostings #2
Shelf-Stable Salad Dressings #3
Source: IRI US Multi-Outlet data, YTD ending 8/2/15; based on IRI’s Pinnacle custom definitions; market position ranks are among branded players.
Growth driven by strong performance of Leadership Brands
2012 2013 2014 2015 YTD
$ Market Share +0.1 pts. +0.3 pts. +0.2 pts. +0.5 pts.
(Change vs. PY)
Pinnacle Foods Composite Market Share
11
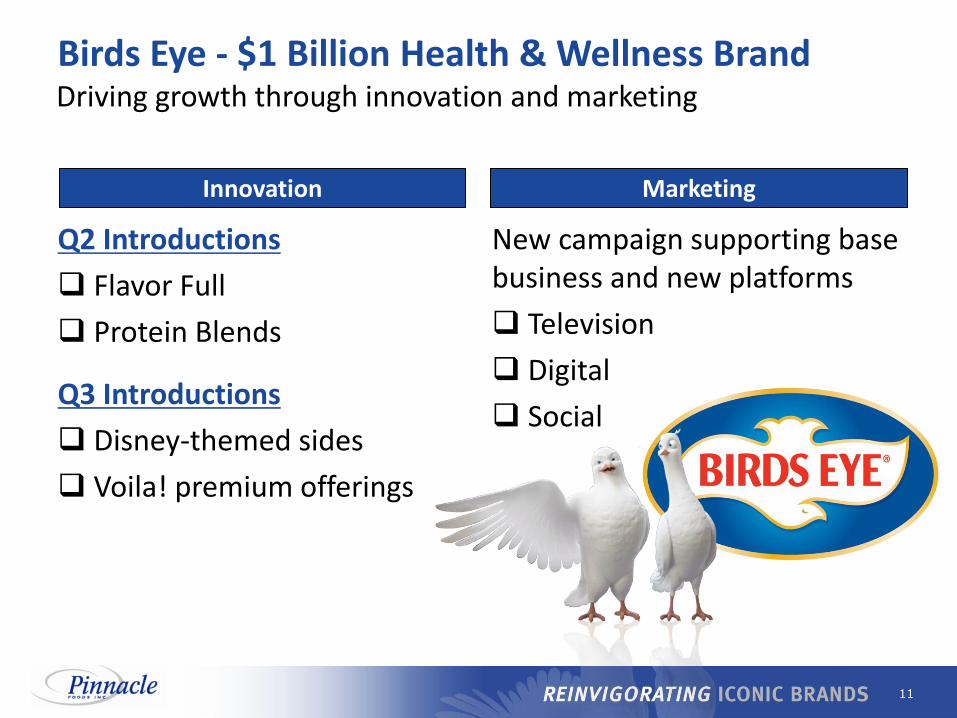
Innovation
Q2 Introductions
Flavor Full
Protein Blends
Q3 Introductions
Disney-themed sides
Voila! premium offerings
Marketing
New campaign supporting base business and new platforms
Television
Digital
Social
Birds Eye - $1 Billion Health & Wellness Brand Driving growth through innovation and marketing
12
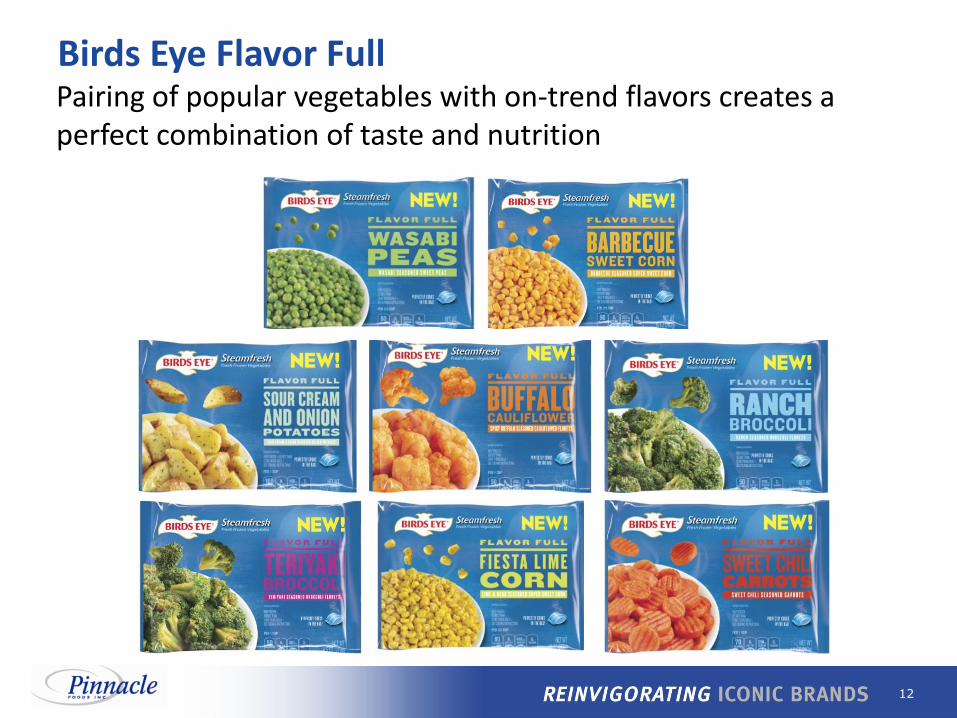
Birds Eye Flavor Full Pairing of popular vegetables with on-trend flavors creates a perfect combination of taste and nutrition
13
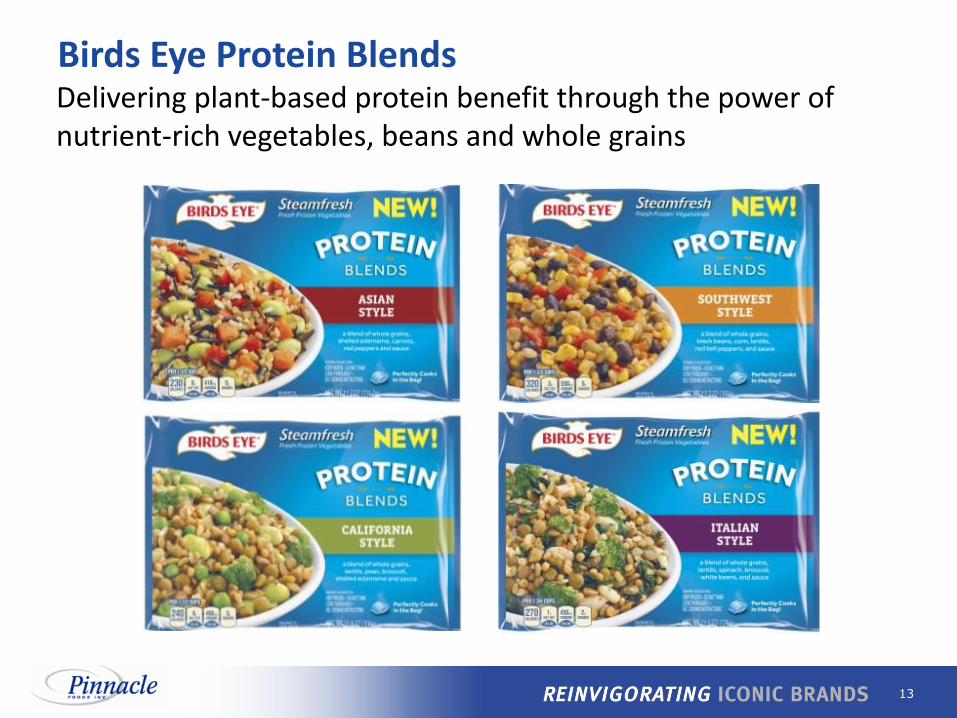
Birds Eye Protein Blends Delivering plant-based protein benefit through the power of nutrient-rich vegetables, beans and whole grains
14
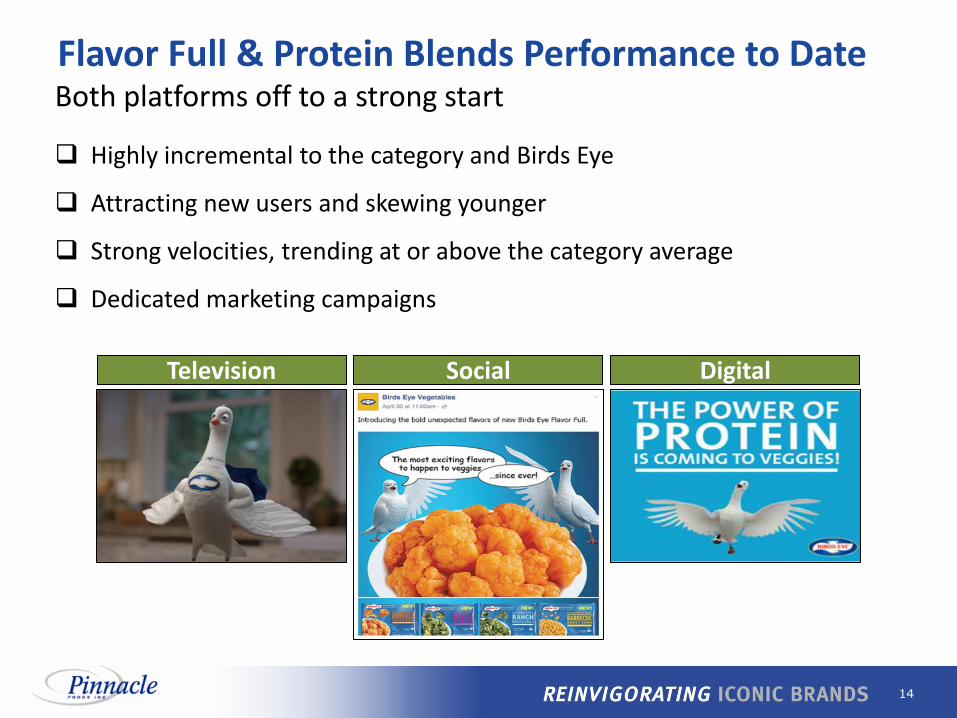
Both platforms off to a strong start
Highly incremental to the category and Birds Eye
Attracting new users and skewing younger
Strong velocities, trending at or above the category average
Dedicated marketing campaigns
Flavor Full & Protein Blends Performance to Date
Digital Television Social
15
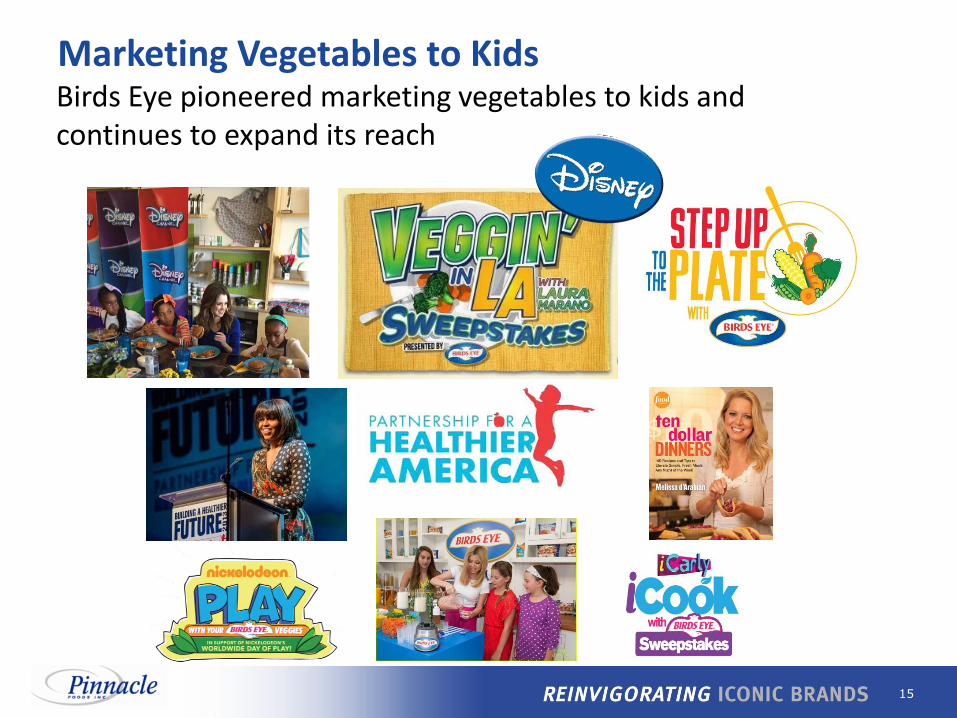
Marketing Vegetables to Kids Birds Eye pioneered marketing vegetables to kids and continues to expand its reach
16
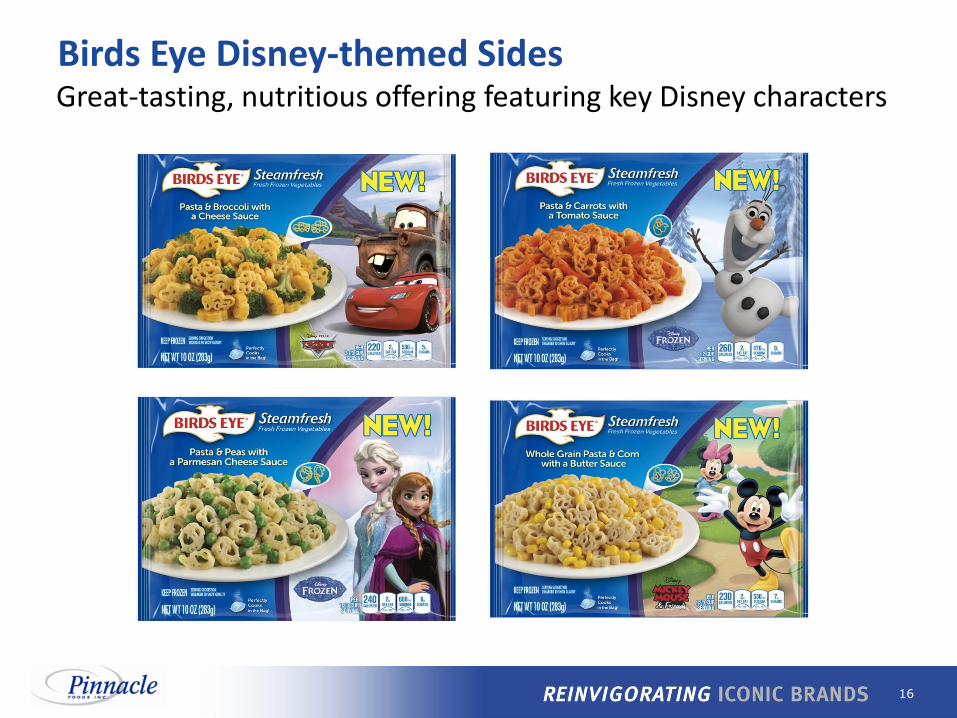
Birds Eye Disney-themed Sides Great-tasting, nutritious offering featuring key Disney characters

17
Regular Size
Family Size
15.7% 17.2% 21.1%
23.7%
28.0%
33.9%
39.8%
2009 2010 2011 2012 2013 2014 2015YTD
$ Market Share
Source: IRI US Multi-Outlet data; based on IRI’s Pinnacle custom definitions.
More than doubled share and grew consumption 88% since acquisition
2015 YTD consumption +16%
Adding capacity in Q4 2015
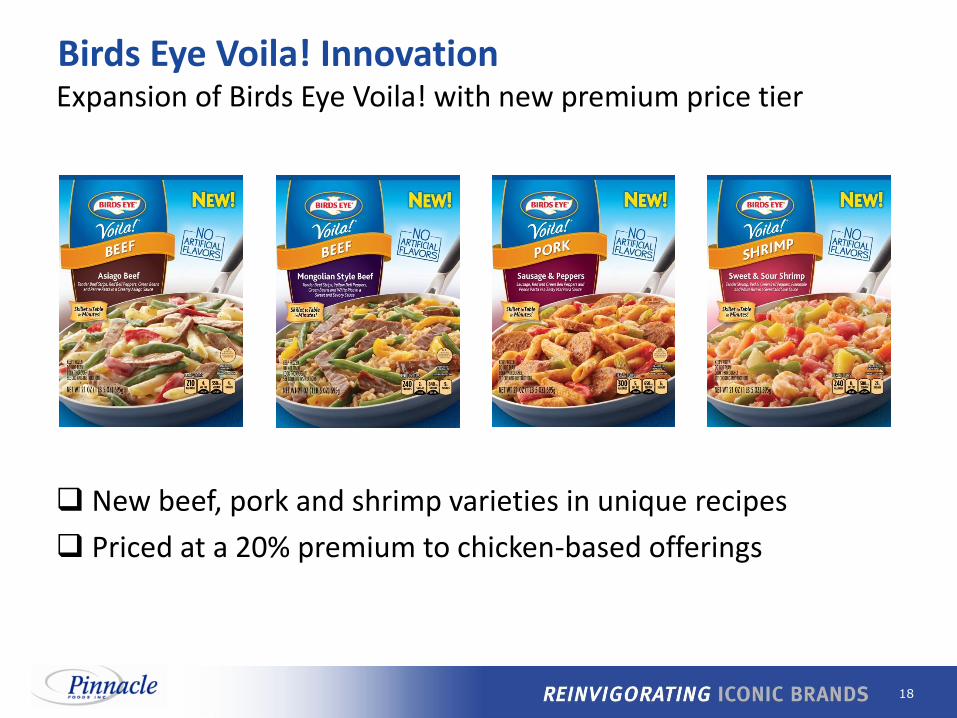
Birds Eye Voila! Vegetable-rich complete meals at a great value
18
New beef, pork and shrimp varieties in unique recipes
Priced at a 20% premium to chicken-based offerings
Birds Eye Voila! Innovation Expansion of Birds Eye Voila! with new premium price tier

19
Birds Eye Advertising New campaign supporting new platforms and base business, including dedicated advertising for Voila! for the first time

20
Baking Category
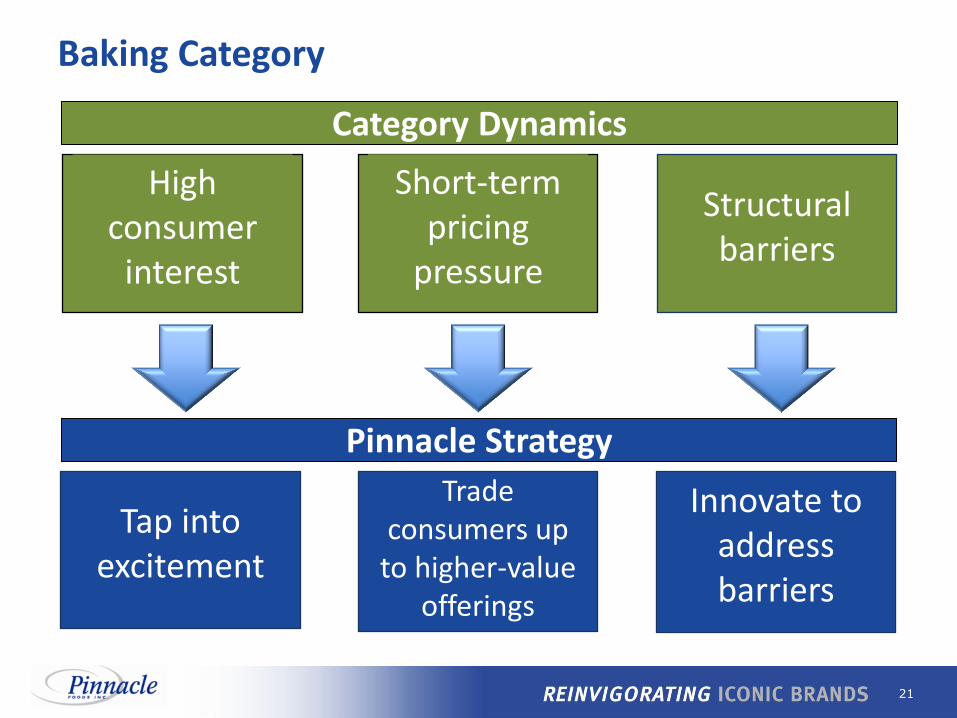
21
High consumer
interest
Structural barriers
Short-term pricing
pressure
Category Dynamics
Tap into excitement
Innovate to address barriers
Trade consumers up
to higher-value offerings
Pinnacle Strategy
Baking Category
22
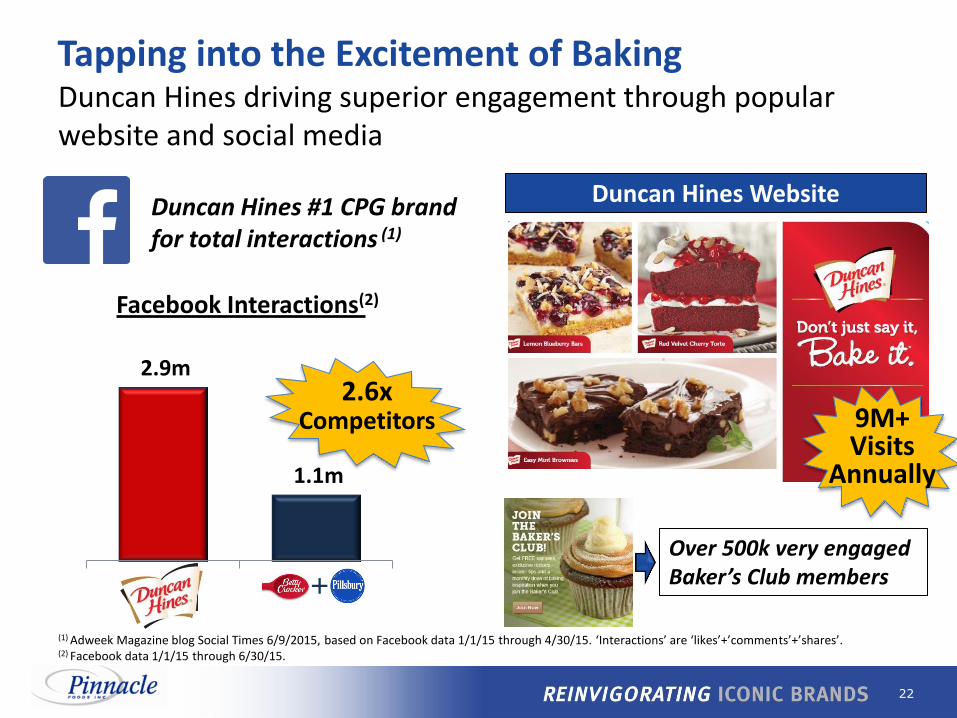
Tapping into the Excitement of Baking Duncan Hines driving superior engagement through popular website and social media
Duncan Hines Website
(1) Adweek Magazine blog Social Times 6/9/2015, based on Facebook data 1/1/15 through 4/30/15. ‘Interactions’ are ‘likes’+’comments’+’shares’. (2) Facebook data 1/1/15 through 6/30/15.
9M+ Visits
Annually
2.6x Competitors
Duncan Hines #1 CPG brand for total interactions (1)
2.9m
1.1m
+
Facebook Interactions(2)
Over 500k very engaged Baker’s Club members
23
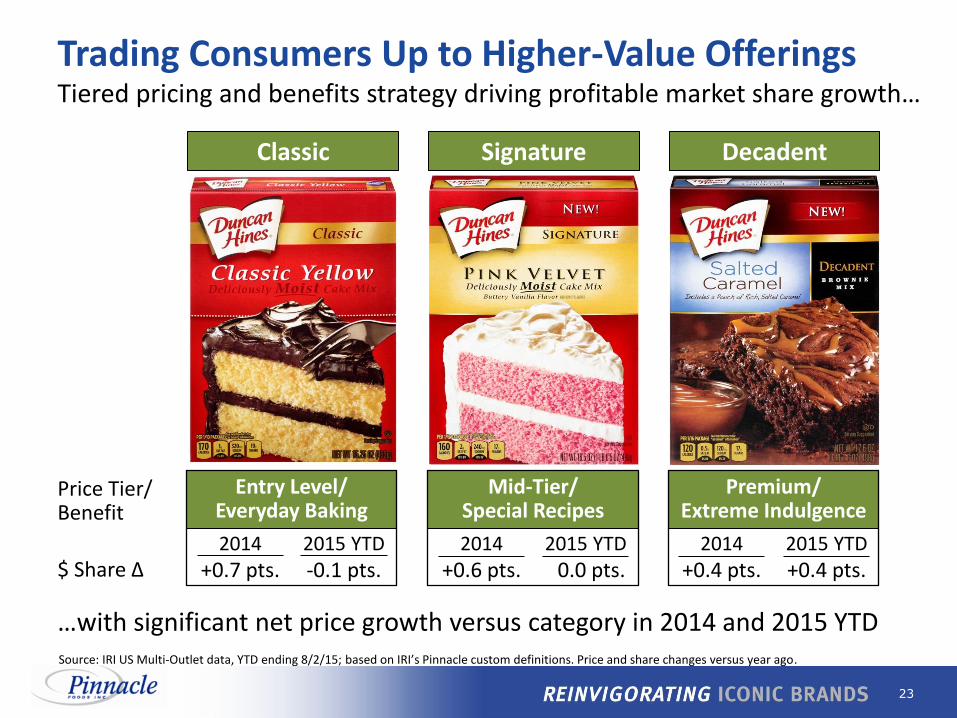
Price Tier/ Benefit
Decadent Classic Signature
Tiered pricing and benefits strategy driving profitable market share growth…
Trading Consumers Up to Higher-Value Offerings
Source: IRI US Multi-Outlet data, YTD ending 8/2/15; based on IRI’s Pinnacle custom definitions. Price and share changes versus year ago.
Premium/ Extreme Indulgence
Entry Level/ Everyday Baking
Mid-Tier/ Special Recipes
$ Share ∆ 2014
+0.7 pts. 2015 YTD
-0.1 pts. 2014
+0.4 pts. 2015 YTD
+0.4 pts. 2014
+0.6 pts. 2015 YTD
+0.0 pts.
…with significant net price growth versus category in 2014 and 2015 YTD

24
Ideal for serving 2 to 4 people
Kit includes mix, frosting and 6-inch disposable pan
New premium baking kits positioned for smaller households
Innovating to Address Structural Barriers
25
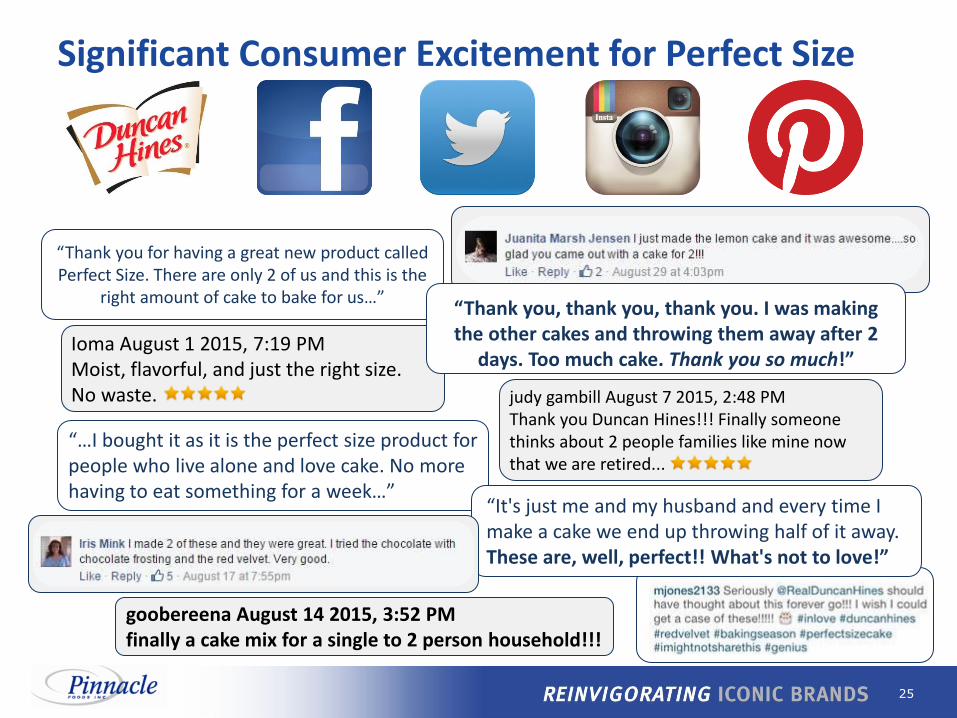
Significant Consumer Excitement for Perfect Size
goobereena August 14 2015, 3:52 PM finally a cake mix for a single to 2 person household!!!
“Thank you for having a great new product called Perfect Size. There are only 2 of us and this is the
right amount of cake to bake for us…”
“…I bought it as it is the perfect size product for people who live alone and love cake. No more having to eat something for a week…”
“It's just me and my husband and every time I make a cake we end up throwing half of it away. These are, well, perfect!! What's not to love!”
Ioma August 1 2015, 7:19 PM Moist, flavorful, and just the right size. No waste. judy gambill August 7 2015, 2:48 PM
Thank you Duncan Hines!!! Finally someone thinks about 2 people families like mine now that we are retired...
“Thank you, thank you, thank you. I was making the other cakes and throwing them away after 2
days. Too much cake. Thank you so much!”
26
A Disciplined Approach to M&A
North America focus
Existing or adjacent categories
Market leadership or line of sight to leadership
Synergy-rich transactions
Speed of integration

27
Category remains highly competitive, with share below expectations
Profitability on track with acquisition model
In-house manufacturing start-up complete
Robust new product pipeline ready for launch in early 2016
Wish-Bone Update
28
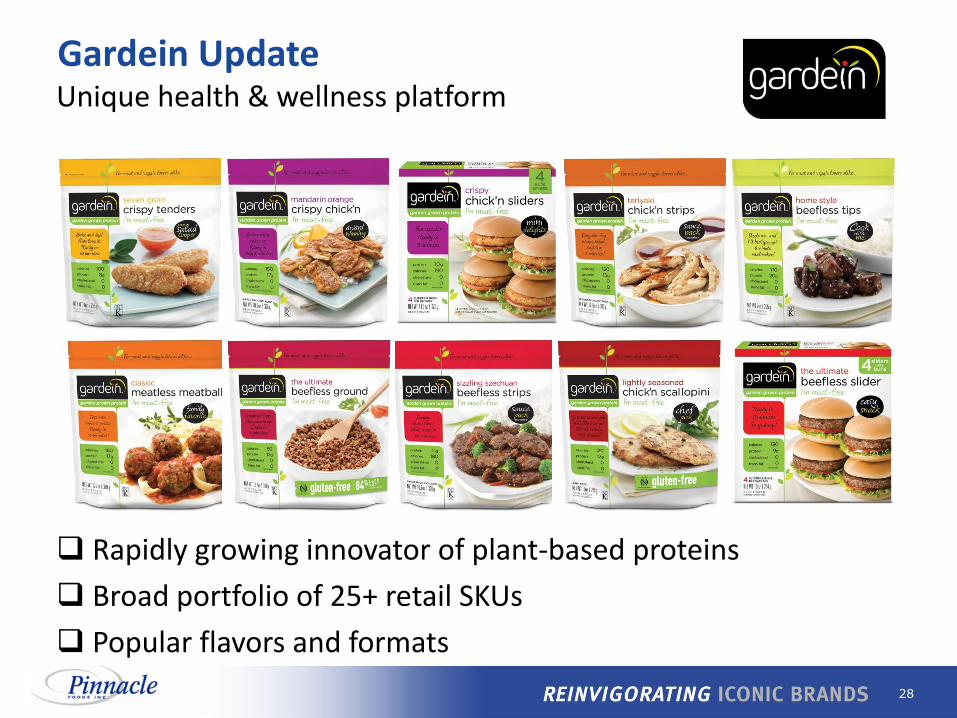
Rapidly growing innovator of plant-based proteins
Broad portfolio of 25+ retail SKUs
Popular flavors and formats
Gardein Update Unique health & wellness platform

29
Results by Channel
Optimizing Vancouver plant capacity
Adding capacity at newly-acquired Hagerstown, MD site
Expansion Plans Underway
Award-winning plant-based protein offering positioned against key trends
Gardein Platform Opportunity
Traditional Natural & Organic
$ Consumption vs. PY +31% +41%
ACV Distribution +66% +87%
Avg. Items/Store +07% +06%
Source: IRI US Multi-Outlet data and SPINS US Natural data; consumption 12 weeks ended 7/12/15; ACV and items/store 4 weeks ended 7/12/15.
30
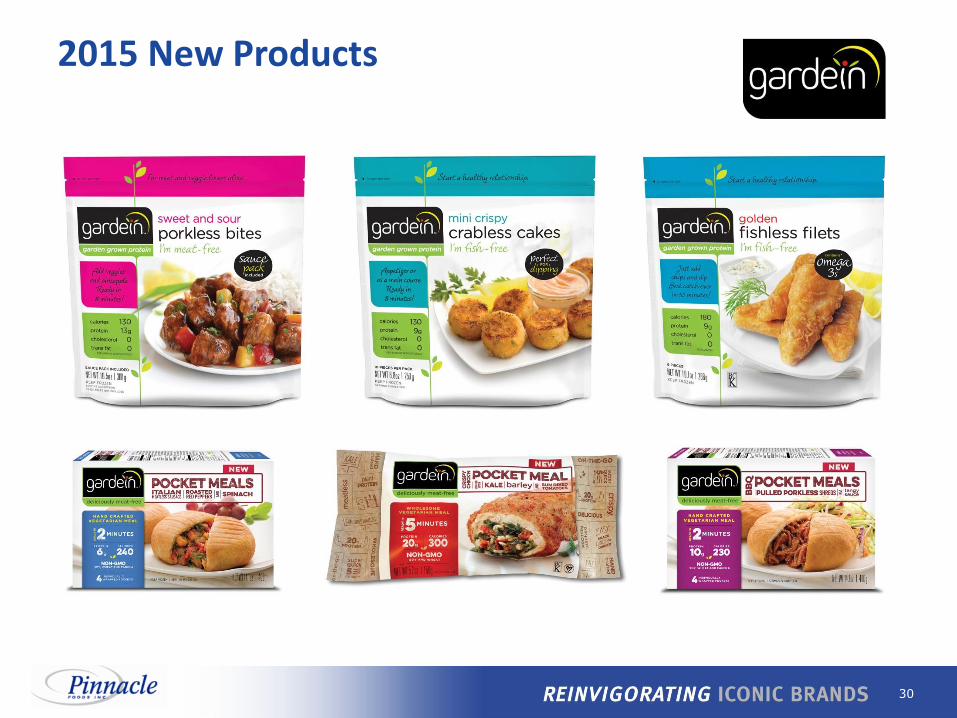
2015 New Products
31
Agenda Overview
Executing Our Strategy
Financial Update
Outlook

32
($m, except EPS) $ Vs. PY
Net Sales – Consolidated Net Sales – NA Retail
$1,297 $1,126
+2.8% +2.8%
Gross Margin 26.3% flat
Operating Income (EBIT) $182 +2%
Diluted EPS $0.75 +9%
Note: Gross Margin, Operating Income (EBIT) and Diluted EPS are on an adjusted basis. See reconciliation to GAAP financial measures in Appendix.
2015 First-half Financial Results Strong EPS growth driven by solid top-line performance and benefits of lower interest expense and effective tax rate

33
4.0% 4.1% 3.7% 3-4%
7.4%
2.3% 2.7% 3-3.5%
2012 2013 2014 2015E
Productivity Inflation
% of COGS
Productivity exceeded inflation in the past two years, enabling offset to weak industry growth
2015 2nd half gross margin expected to accelerate, benefitting from favorable productivity/inflation relationship
Business model calls for productivity to offset inflation over time
Productivity and Inflation

34
Conversion
Logistics
Proteins
Grains & Oils
Packaging Vegetables
& Fruit
All Other Sugar & Cocoa
2015 Cost of Goods Sold: $1.9 billion
More Inflationary
Logistics
Proteins
Conversion
Deflationary
Grains & Oils
Sugar & Cocoa
2015 Outlook
Diversity of cost basket serves as a natural hedge
2015 Input Cost Breakdown

35
2014 37.9%
One-time items benefitting 2014 +0.8%
2014 Ongoing 38.7%
Domestic Production Activities Deduction (DPAD)
Foreign Tax Credit (FTC)
Other
2015 Guidance 36.5% - 37.0%
ETR
Utilization of NOL benefit enables ETR reduction in 2015
2015 Effective Tax Rate (ETR)
Note: ETR is on an adjusted basis. See reconciliation to GAAP financial measures in Appendix.

36
$345 $325
$452 $400+
$0
$100
$200
$300
$400
$500
$600
$700
2012 2013 2014 2015E
Unleveraged Free Cash Flow (1)
~3%
~6%
Peer Average
Pinnacle Estimate
Free Cash Flow Yield (2)
($m)
(1) See reconciliation to GAAP financial measures in Appendix. (2) 2015E based on industry analysts’ valuation analyses using prices as of 8/28/2015.
Superior Free Cash Flow Generation Another year of strong cash flow expected in 2015…
…despite impact of strong crop season driving higher inventories

37
Key Drivers of Free Cash Flow
$2m $4m $8m
$17m
2012 2013 2014 2015E
$181m
$109m $96m $90m
2012 2013 2014 2015E
Minimal cash taxes and declining interest expense have fueled industry-leading free cash flow conversion
Minimal Cash Taxes
Significant NOLs benefit through 2015; residual benefit through 2027
Acquisition-related amortization tax shield through 2029
DPAD and FTC benefits start in 2015
Declining Interest Expense
Significant deleveraging; leverage ratio expected to decline to <4x in 2015
2013 refinancing and 2014 interest rate step-down

38
2012 2013 2014 2015E
Capital Expenditures
Capital Expenditures
Prudent investment against both acquisitions and the base business further supports strong cash flow
$78m $84m
$103m
$110m-$120m
Base Acquisition-related
Base Acquisition-related

39
After servicing debt and paying dividends at approximately 50% of net earnings, cash flow deployed to highest priorities:
Capital Allocation Strategy
Acquisitions #1
Debt Reduction #2
Share Repurchase #3

40
Agenda Overview
Executing Our Strategy
Financial Update
Outlook

41
Net Sales Growth exceeds categories
Inflation 3.0% to 3.5% of COGS Nm
Productivity 3% to 4% of COGS Nm
ETR 36.5% to 37.0%
Diluted EPS $1.89 to $1.91 +9% to +10%
CAPEX $110m to $120m
Note: Diluted EPS and ETR adjusted for items affecting comparability.
Outlook
H1 weighted
H2 weighted
H2 weighted
2015 Full Year Outlook

42
Attractive Value Creation Potential
Long-Term Organic Growth Algorithm
Net Sales
Operating Income
EPS
Dividend Yield
Note: Excludes items affecting comparability.
In Line with Categories
10 – 12%
4 – 5%
7 – 8%
3 – 4%
Accretive acquisitions would accelerate growth further
Realistic organic growth targets
Sustainable productivity program
Strong FCF providing optionality
Disciplined M&A approach with demonstrated value creation
43
Appendix

44
Reconciliation to GAAP Financial Measures
(1) Primarily includes: Hillshire agreement termination fee (net of costs), restructuring charges including integration costs, employee severance and non-recurring merger costs. (2) Primarily includes: Equity-based compensation expense resulting from liquidity event, fair value write-up of acquired inventories and mark-to-market gains/losses. (3) Primarily includes: Restructuring charges from plant consolidations, integration costs, non-recurring merger costs and employee severance. (4) Primarily includes: Bond redemption costs and management fee paid to sponsor. (5) Pro forma data reflects Adjusted Statement of Operations amounts assuming IPO and 2013 Refinancing occurred on the first day of Fiscal 2013.
Year (52 Weeks) Ended December 29, 2013
Diluted
In millions, except per share Gross Diluted Earnings
Net Sales Profit EBIT EBT Net Earnings Shares Per Share
Reported $2,591 $681 $512 $416 $248 116.9 $2.13
Acquisition, merger and other restructuring charges (1) 12 (130) (130) (79)
Other non-cash items (2) 18 41 41 34
Adjusted 2,591 711 423 327 203 116.9 $1.74
Diluted
In millions, except per share Gross Diluted Earnings
Net Sales Profit EBIT EBT Net Earnings Shares Per Share
Reported $2,464 $654 $293 $161 $89 108.6 $0.82
Acquisition, merger and other restructuring charges (3) 4 22 22 14
Other non-cash items (2) 6 6 6 3
Other adjustments (4) 53 76 55
Adjusted 2,464 664 374 265 161 108.6 $1.49
IPO and Refinancing (5) 26 16 8.0
Pro Forma $2,464 $664 $374 $291 $177 116.6 $1.52
Stock-based Compensation 1 8 8 6 0.05
Pro Forma Excluding Stock-based Compensation $665 $382 $299 $183 116.6 $1.57
Year (52 Weeks) Ended December 28, 2014

45
(1) Primarily includes: Accelerated depreciation from plant consolidations, restructuring charges including integration costs and employee severance. (2) Primarily includes: Bond redemption costs. (3) Pro forma data reflects Adjusted Statement of Operations amounts assuming IPO occurred on the first day of Fiscal 2012.
Diluted
In millions, except per share Diluted Earnings
Net Sales EBIT Net Earnings Shares Per Share
Reported $2,479 $284 $53 86.5 $0.61
Acquisition, merger and other restructuring charges (1) 45 28
Other adjustments (2) 21 23
Adjusted 2,479 350 104 86.5 $1.20
IPO (3) 30 30.9
Public company costs (3) (3) (2)
Pro Forma $2,479 $347 $132 117.4 $1.13
Year (53 Weeks) Ended December 30, 2012
Reconciliation to GAAP Financial Measures
46
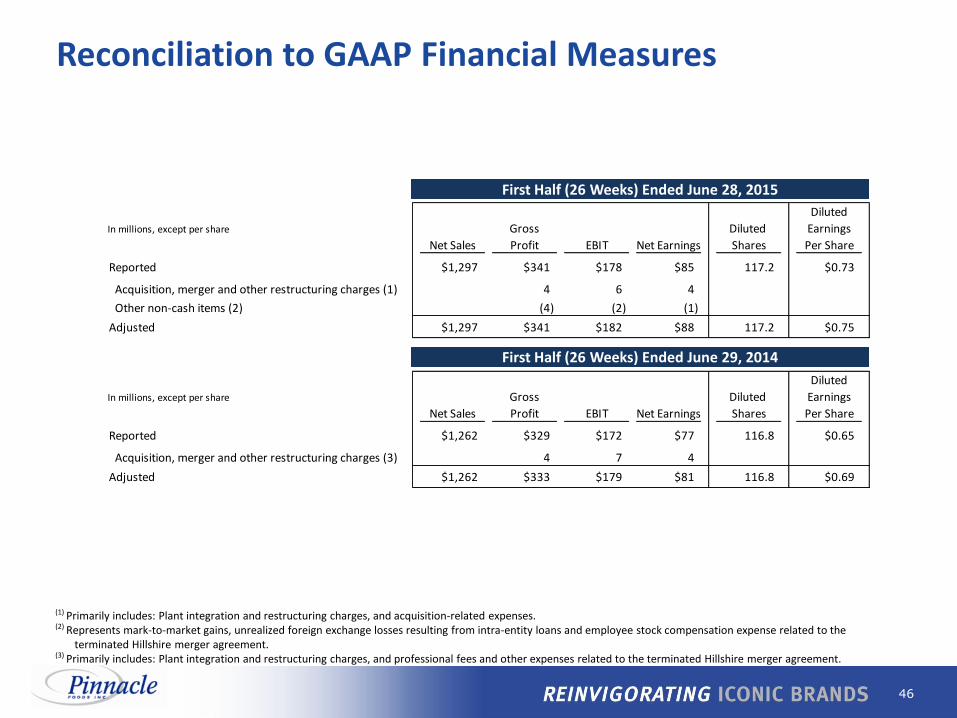
(1) Primarily includes: Plant integration and restructuring charges, and acquisition-related expenses. (2) Represents mark-to-market gains, unrealized foreign exchange losses resulting from intra-entity loans and employee stock compensation expense related to the
terminated Hillshire merger agreement. (3) Primarily includes: Plant integration and restructuring charges, and professional fees and other expenses related to the terminated Hillshire merger agreement.
Diluted
In millions, except per share Gross Diluted Earnings
Net Sales Profit EBIT Net Earnings Shares Per Share
Reported $1,297 $341 $178 $85 117.2 $0.73
Acquisition, merger and other restructuring charges (1) 4 6 4
Other non-cash items (2) (4) (2) (1)
Adjusted $1,297 $341 $182 $88 117.2 $0.75
Diluted
In millions, except per share Gross Diluted Earnings
Net Sales Profit EBIT Net Earnings Shares Per Share
Reported $1,262 $329 $172 $77 116.8 $0.65
Acquisition, merger and other restructuring charges (3) 4 7 4
Adjusted $1,262 $333 $179 $81 116.8 $0.69
First Half (26 Weeks) Ended June 29, 2014
First Half (26 Weeks) Ended June 28, 2015
Reconciliation to GAAP Financial Measures

47
(1) Primarily includes: Restructuring charges from plant consolidations, integration costs, non-recurring merger costs and employee severance.
2012 2013 2014
Reported Cash Flows from Operating Activities $203 $262 $551
Capital expenditures (78) (84) (103)
Hillshire termination fee (net of costs and cash taxes) (150)
Acquisition, merger and other restructuring charges (1) 48 39 64
Free Cash Flow $173 $217 $362
Cash interest expense 172 108 90
Unleveraged Free Cash Flow $345 $325 $452
Reconciliation of Unleveraged Free Cash Flow to Reported Cash Flows from Operating Activities - $m
Reconciliation to GAAP Financial Measures


![Barclays Virtual Investor Conference 9-10-20.pptx [Read-Only]€¦ · Microsoft PowerPoint - Barclays Virtual Investor Conference 9-10-20.pptx [Read-Only] Author: 00081735 Created](https://img.pdfslide.us/doc/110x75/600f26791386122e333902a9/barclays-virtual-investor-conference-9-10-20pptx-read-only-microsoft-powerpoint.jpg)


![Barclays Wave v6 Final 25 Jun[1]](https://img.pdfslide.us/doc/110x75/546b0f9eb4af9f842c8b4ad5/barclays-wave-v6-final-25-jun1.jpg)

![Barclays capital radar strategy citywire stockholm final [read only]](https://img.pdfslide.us/doc/110x75/5472a2b9b4af9fa30a8b503d/barclays-capital-radar-strategy-citywire-stockholm-final-read-only.jpg)