Embed Size (px)
Citation preview

© 2014 Level 3 Communications, LLC. All Rights Reserved.
BAML Leveraged Finance Conference
December 3, 2014

© 2014 Level 3 Communications, LLC. All Rights Reserved. 2
200,000+ miles of fiber in over 60 countries
Over 13,000 employees across North America, LATAM, EMEA, Asia
Over $8 billion in annual revenue pro forma for tw telecom
~350 datacenter and colocation facilities
Level 3 is Local to Global

© 2014 Level 3 Communications, LLC. All Rights Reserved.
Fundamental Strategy
We want to be the premier provider of global communications
Enterprise is the growth engine for Level 3
Enterprise is about 70% of the combined company’s revenue
We are taking market share and we have a large opportunity to grow
To win in Enterprise we focus on Operational Excellence,
not just scale and price
Deliver a differentiated customer experience
Simplify our processes, tools, and systems
Our Wholesale business gives us scale, reach and efficiency
3

© 2014 Level 3 Communications, LLC. All Rights Reserved.
Enterprise is Level 3’s Growth Engine
2013 2014(3)(4)
Wholesale CNS Enterprise CNS
2011(1)(2)
~
~
71%
29%
(1) Level 3 standalone results
(2) FY2011 Wholesale CNS includes Europe revenue
(3) 2014 results are annualized based on the third quarter 2014 results for the combined company
(4) Combined company CNS revenue is adjusted for $60 million on an annualized basis related to intercompany eliminations 6
36%64%
$3B $5.6B $7.6B
$ in millions
59%
41%

© 2014 Level 3 Communications, LLC. All Rights Reserved.
Combination with tw telecom further strengthens the company’s position
New company size and trajectory leads to:
Increased breadth and scale of the combined company’s metro footprint, expanded
addressable market and service portfolio
Growing market opportunity as the competitive landscape shifts to favor our strengths and
our combined market share is still in the single digits
Our network, products and sales and marketing capabilities will give us complete customer
coverage from global multi-national corporations to medium-size businesses
Innovation in new products and services our customers need for their growth, efficiency and
security for the long term
Enhances credit and Free Cash Flow profile enables increase opportunity for de-leveraging,
investments and other value-enhancing opportunities
Creates a more focused, capable and powerful competitor to the incumbents and
provides choice to customers
Level 3 Going Forward
5
© 2014 Level 3 Communications, LLC. All Rights Reserved.
FINANCIALS
© 2014 Level 3 Communications, LLC. All Rights Reserved.
$905 $939
$962 $984 $992
3Q13 4Q13 1Q14 2Q14 3Q147
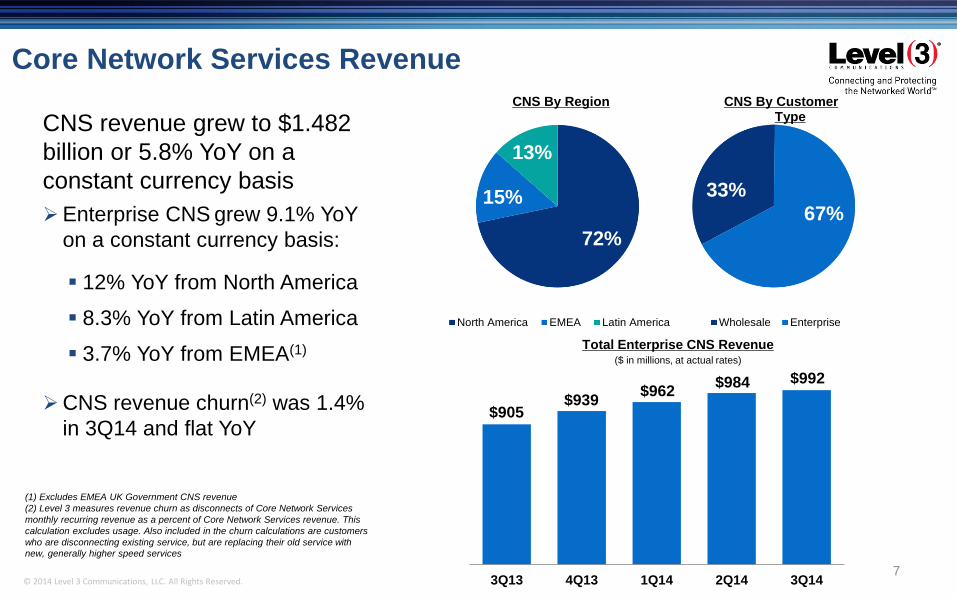
CNS By Region CNS By Customer TypeCNS revenue grew to $1.482
billion or 5.8% YoY on a
constant currency basis
Enterprise CNS grew 9.1% YoY
on a constant currency basis:
12% YoY from North America
8.3% YoY from Latin America
3.7% YoY from EMEA(1)
CNS revenue churn(2) was 1.4%
in 3Q14 and flat YoY
(1) Excludes EMEA UK Government CNS revenue
(2) Level 3 measures revenue churn as disconnects of Core Network Services
monthly recurring revenue as a percent of Core Network Services revenue. This
calculation excludes usage. Also included in the churn calculations are customers
who are disconnecting existing service, but are replacing their old service with
new, generally higher speed services
Total Enterprise CNS Revenue ($ in millions, at actual rates)
33%
67%
Wholesale Enterprise
72%
15%
13%
North America EMEA Latin America
Core Network Services Revenue

© 2014 Level 3 Communications, LLC. All Rights Reserved.
Year to date, capital expenditures
of 12.5% as a percent of total
revenue
Level 3 Adjusted EBITDA and Capital Expenditures
8
Continued double digit growth
in Adjusted EBITDA on a YoY
basis
Adjusted EBITDA(1)
($ in millions)
$404
$471
25.7%
28.9%
3Q13 3Q14
Adj EBITDA Adj EBITDA % of Total Revenue
$194 $204
3Q13 3Q14
Capital Expenditures($ in millions)
(1) Third quarter 2013 Adjusted EBITDA and resulting Adjusted EBITDA margin are adjusted to include the $11 million in bonus-related non-cash compensation expenses and to
exclude $30 million of severance charges
© 2014 Level 3 Communications, LLC. All Rights Reserved.
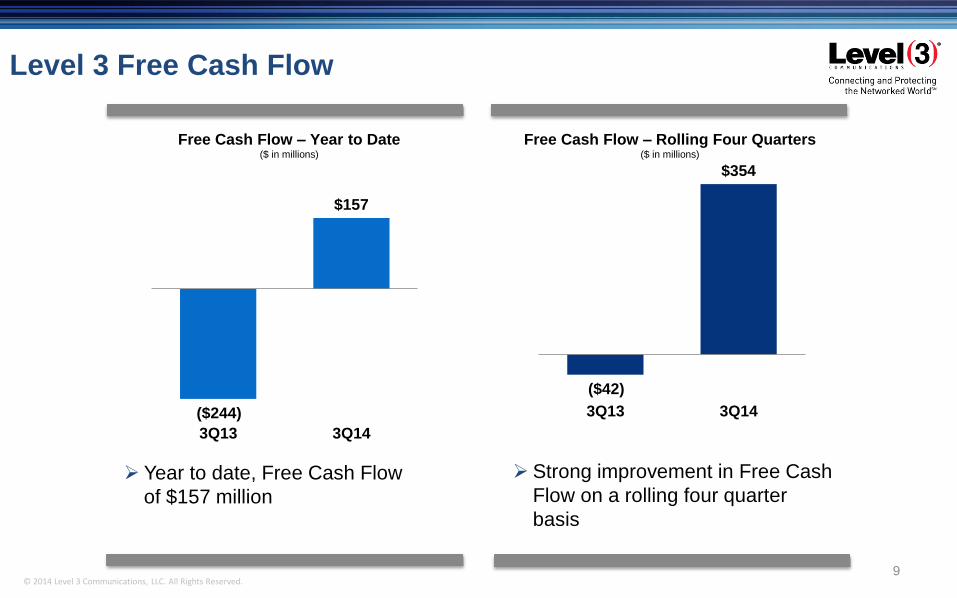
Level 3 Free Cash Flow
9
Free Cash Flow – Year to Date($ in millions)
($42)
$354
3Q13 3Q14
Free Cash Flow – Rolling Four Quarters ($ in millions)
Strong improvement in Free Cash
Flow on a rolling four quarter
basis
Year to date, Free Cash Flow
of $157 million
($244)
$157
3Q13 3Q14
© 2014 Level 3 Communications, LLC. All Rights Reserved.
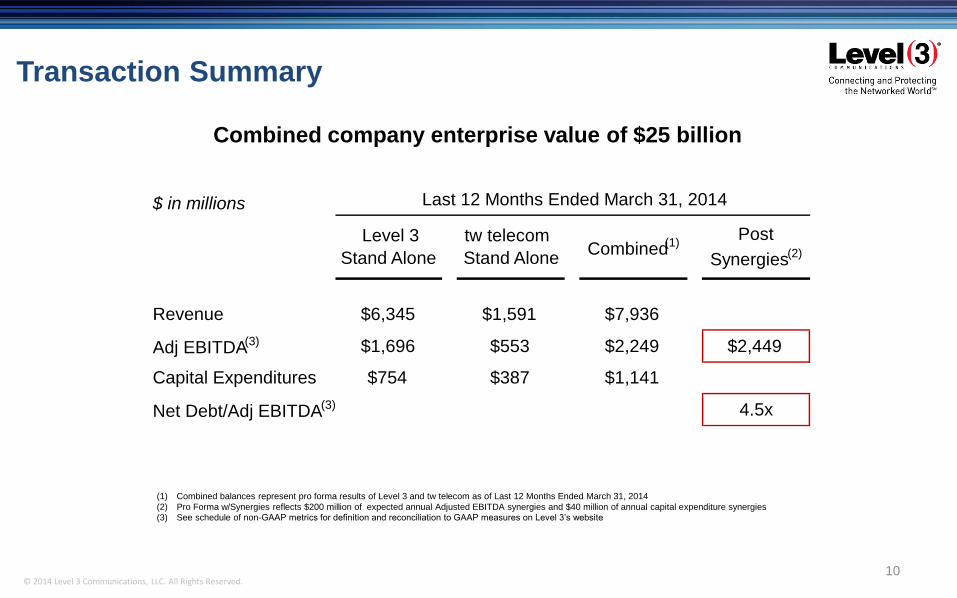
$ in millions
Revenue $6,345 $1,591 $7,936
Adj EBITDA(3) $1,696 $553 $2,249 $2,449
Capital Expenditures $754 $387 $1,141
Net Debt/Adj EBITDA(3) 4.5x
Last 12 Months Ended March 31, 2014
Level 3
Stand Alone
tw telecom
Stand AloneCombined(1)
Post
Synergies(2)
(1) Combined balances represent pro forma results of Level 3 and tw telecom as of Last 12 Months Ended March 31, 2014
(2) Pro Forma w/Synergies reflects $200 million of expected annual Adjusted EBITDA synergies and $40 million of annual capital expenditure synergies
(3) See schedule of non-GAAP metrics for definition and reconciliation to GAAP measures on Level 3’s website
Combined company enterprise value of $25 billion
Transaction Summary
10

© 2014 Level 3 Communications, LLC. All Rights Reserved. 11
Synergies Create Value
$240 million expected total run-rate
synergies
• $200 million of expected annualized run-rate Adjusted EBITDA savings
• Expect to achieve 70% of annualized Adjusted EBITDA savings within 18 months of closing
• $40 million of expected capital expenditure synergies
Expect integration costs of $170 million with: • 60% from operating expenses • 40% from capital expenditures• Expect to incur the majority of integration
expenses by the end of 2015
NPV of Expected Synergies of $2.2 billion
Annualized Adjusted EBITDA
Savings
55%45%
NetEx OpEx

© 2014 Level 3 Communications, LLC. All Rights Reserved.
$475 $300
$2,815
$3,471
$640
$3,600
2014 2015 2016 2017 2018 2019 2020 2021 2022
Pro Forma Debt Maturity Profile
16
Raised an aggregate of $3 billion through two capital markets transactions to facilitate the
closing of the tw telecom transaction
In the fourth quarter 2014, refinanced 11.875% Senior Notes with 5.75% Senior Notes due
2022, lowering cash interest expense
2015 maturity is 7% Convertible Senior Notes that convert at $27 per share
Continue to target lower end of leverage ratio of 3x-5x
No material maturities until 2019
Note: Maturity chart excludes capital leases and other debt of approximately $225 million
Pro forma
Q4 2014
($ in Millions)

© 2014 Level 3 Communications, LLC. All Rights Reserved.
Q&A