Embed Size (px)
Citation preview
1
PETROBRASPETROBRAS
Theodore M. Helms
Investors Relations Executive Manager
January, 2010
Pre-Salt Reservoir
2
The presentation may contain forecasts about future events. Such forecasts merely reflect the expectations of the Company's management. Such terms as "anticipate", "believe", "expect", "forecast", "intend", "plan", "project", "seek", "should", along with similar or analogous expressions, are used to identify such forecasts. These predictions evidently involve risks and uncertainties, whether foreseen or not by the Company. Therefore, the future results of operations may differ from current expectations, and readers must not base their expectations exclusively on the information presented herein. The Company is not obliged to update the presentation/such forecasts in light of new information or future developments.
The United States Securities and Exchange
Commission permits oil and gas companies,
in their filings with the SEC, to disclose only
proved reserves that a company has
demonstrated by actual production or
conclusive formation tests to be
economically and legally producible under
existing economic and operating conditions.
We use certain terms in this presentation, such as oil and gas
resources, that the SEC’s guidelines strictly prohibit us from including in
filings with the SEC.
CAUTIONARY STATEMENT FOR US INVESTORS
DISCLAIMER
3
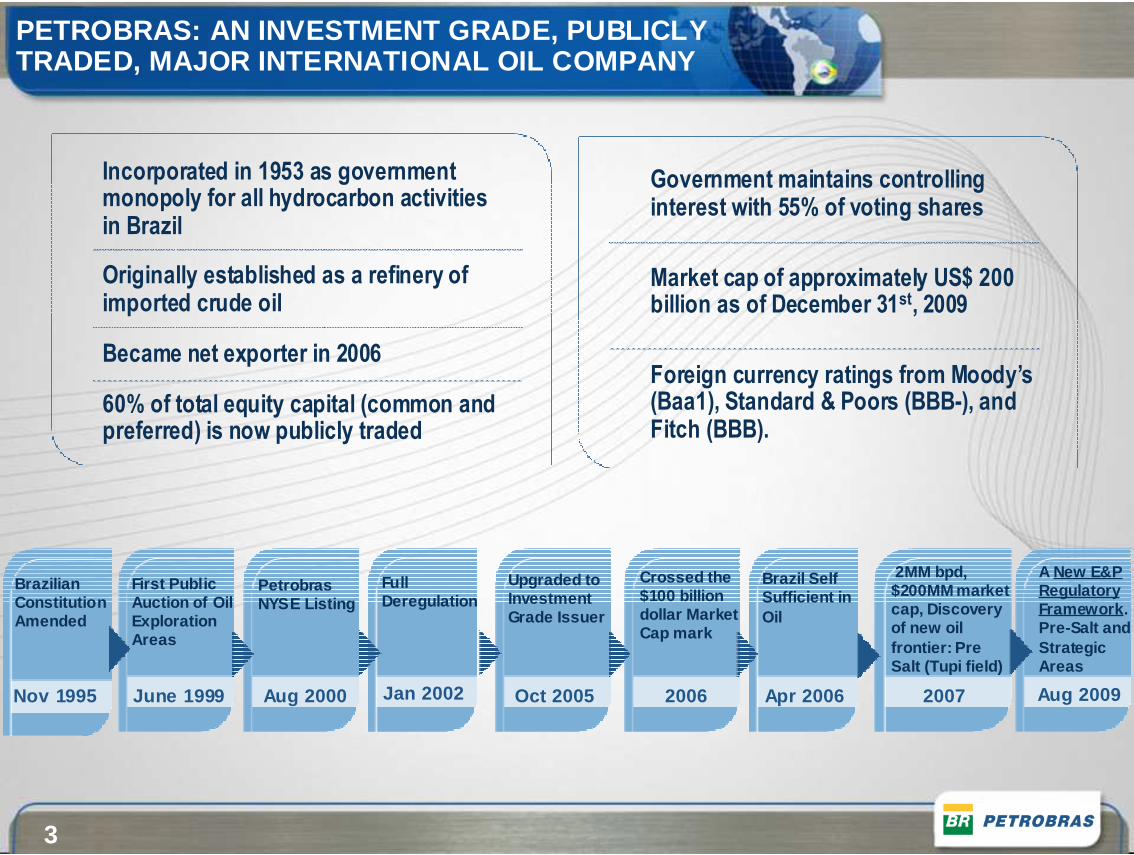
Government maintains controlling interest with 55% of voting shares
Market cap of approximately US$ 200 billion as of December 31st, 2009
Foreign currency ratings from Moody’s (Baa1), Standard & Poors (BBB-), and Fitch (BBB).
Incorporated in 1953 as government monopoly for all hydrocarbon activities in Brazil
Originally established as a refinery of imported crude oil
Became net exporter in 2006
60% of total equity capital (common and preferred) is now publicly traded
BrazilianConstitutionAmended
PetrobrasNYSE Listing
First PublicAuction of OilExplorationAreas
FullDeregulation
Brazil SelfSufficient in Oil
Upgraded toInvestmentGrade Issuer
Crossed the$100 billiondollar MarketCap mark
Nov 1995 Aug 2000June 1999 Jan 2002 Apr 2006Oct 2005 2006
2MM bpd, $200MM market cap, Discovery of new oil frontier: Pre Salt (Tupi field)
2007
A New E&PRegulatory Framework .Pre-Salt and Strategic Areas
Aug 2009
PETROBRAS: AN INVESTMENT GRADE, PUBLICLY TRADED, MAJOR INTERNATIONAL OIL COMPANY
4
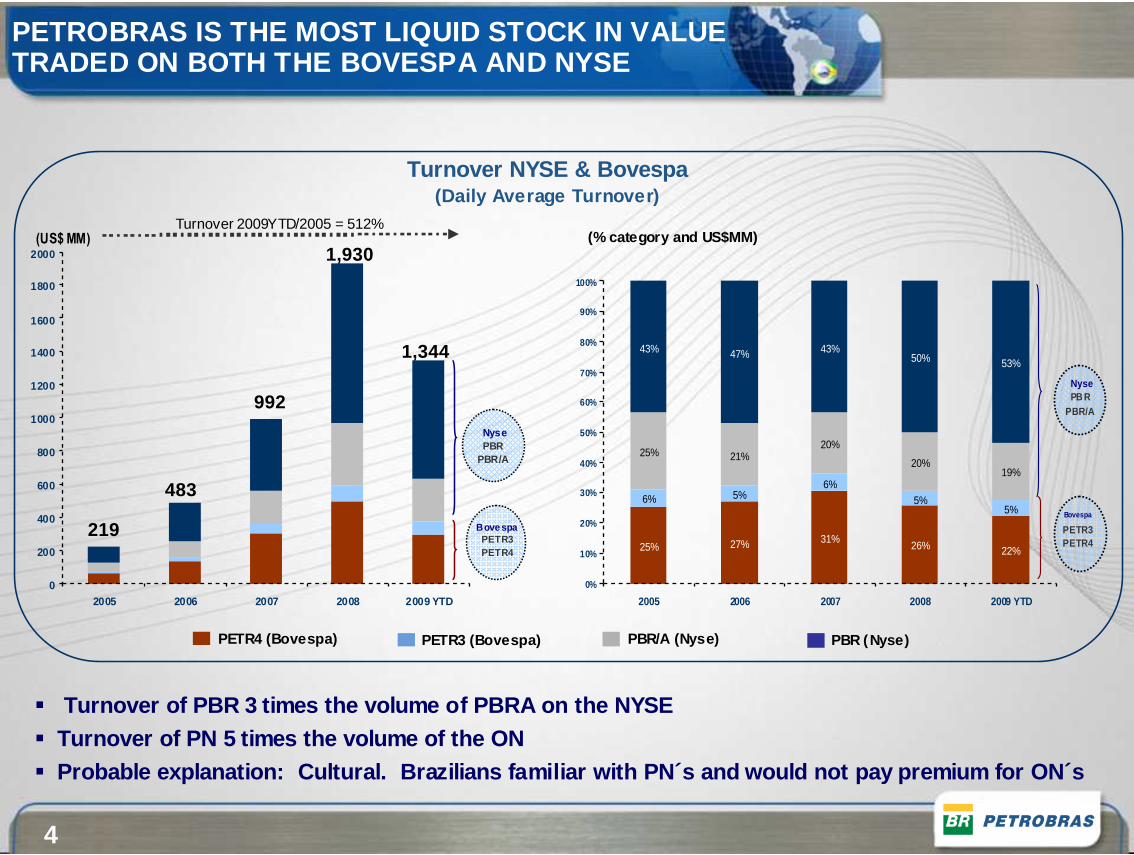
Turnover NYSE & Bovespa (Daily Average Turnover)
0
200
400
600
800
1000
1200
1400
1600
1800
2000
2005 2006 2007 2008 2009 YTD
NysePBR
PBR/A
BovespaPETR3PETR4
(US$ MM)
25% 27% 31%26% 22%
6% 5%6%
5%5%
25% 21%20%
20%19%
43% 47% 43%50% 53%
0%
10%
20%
30%
40%
50%
60%
70%
80%
90%
100%
2005 2006 2007 2008 2009 YTD
NysePB R
PBR/A
Bovespa
PETR3PETR4
PETR4 (Bovespa) PBR/A (Nyse)PETR3 (Bovespa) PBR (Nyse)
(% category and US$MM)
1,344
1,930
992
483
219
Turnover 2009YTD/2005 = 512%
� Turnover of PBR 3 times the volume of PBRA on the N YSE� Turnover of PN 5 times the volume of the ON� Probable explanation: Cultural. Brazilians famili ar with PN´s and would not pay premium for ON´s
PETROBRAS IS THE MOST LIQUID STOCK IN VALUE TRADED ON BOTH THE BOVESPA AND NYSE
5
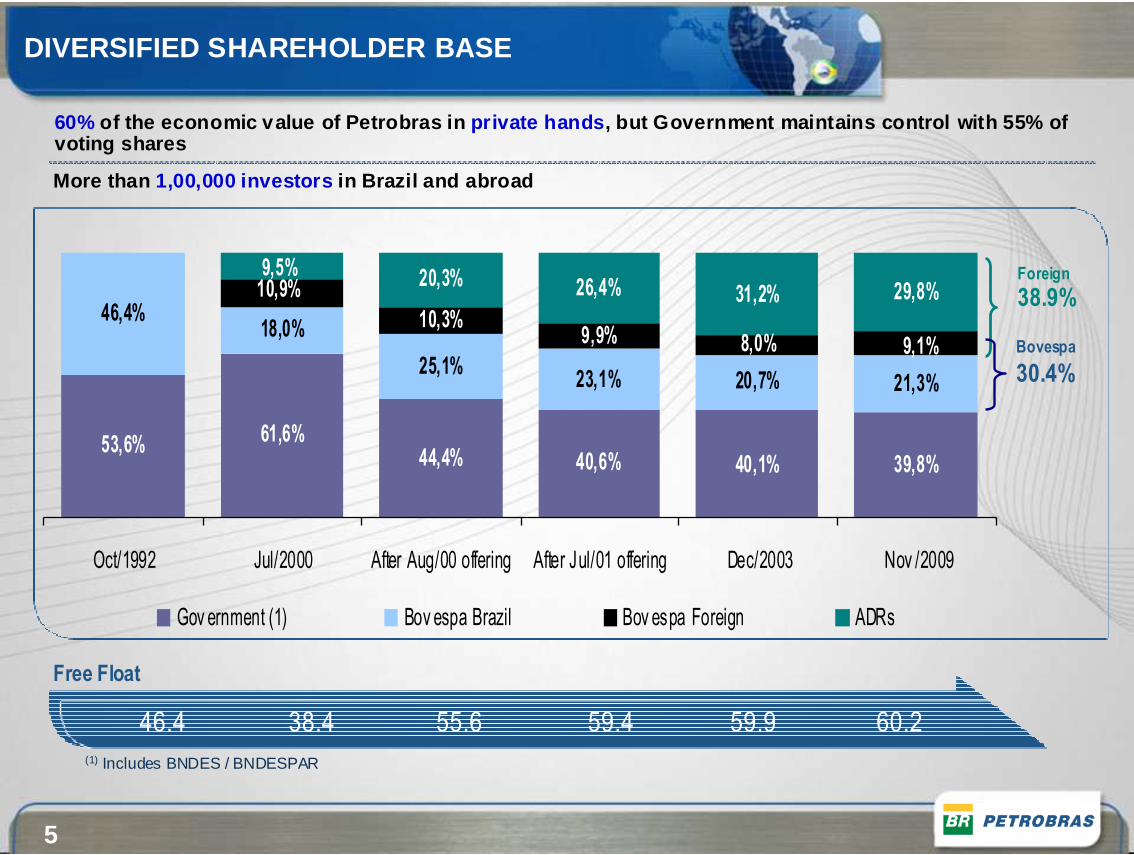
DIVERSIFIED SHAREHOLDER BASE
60% of the economic value of Petrobras in private hands , but Government maintains control with 55% of voting shares
More than 1,00,000 investors in Brazil and abroad
53,6% 61,6%44,4% 40,6% 39,8%
46,4%18,0%
25,1%23,1% 20,7% 21,3%
10,3%9,9% 8,0%
29,8%
40,1%
9,1%
10,9% 31,2%26,4%20,3%9,5%
Oct/1992 Jul/2000 After Aug/00 offering After Jul/01 offering Dec/2003 Nov /2009
Gov ernment (1) Bov espa Brazil Bov espa Foreign ADRs
Foreign
38.9%
Bovespa
30.4%
Free Float
46.4 38.4 55.6 59.4 59.9 60.2(1) Includes BNDES / BNDESPAR
6
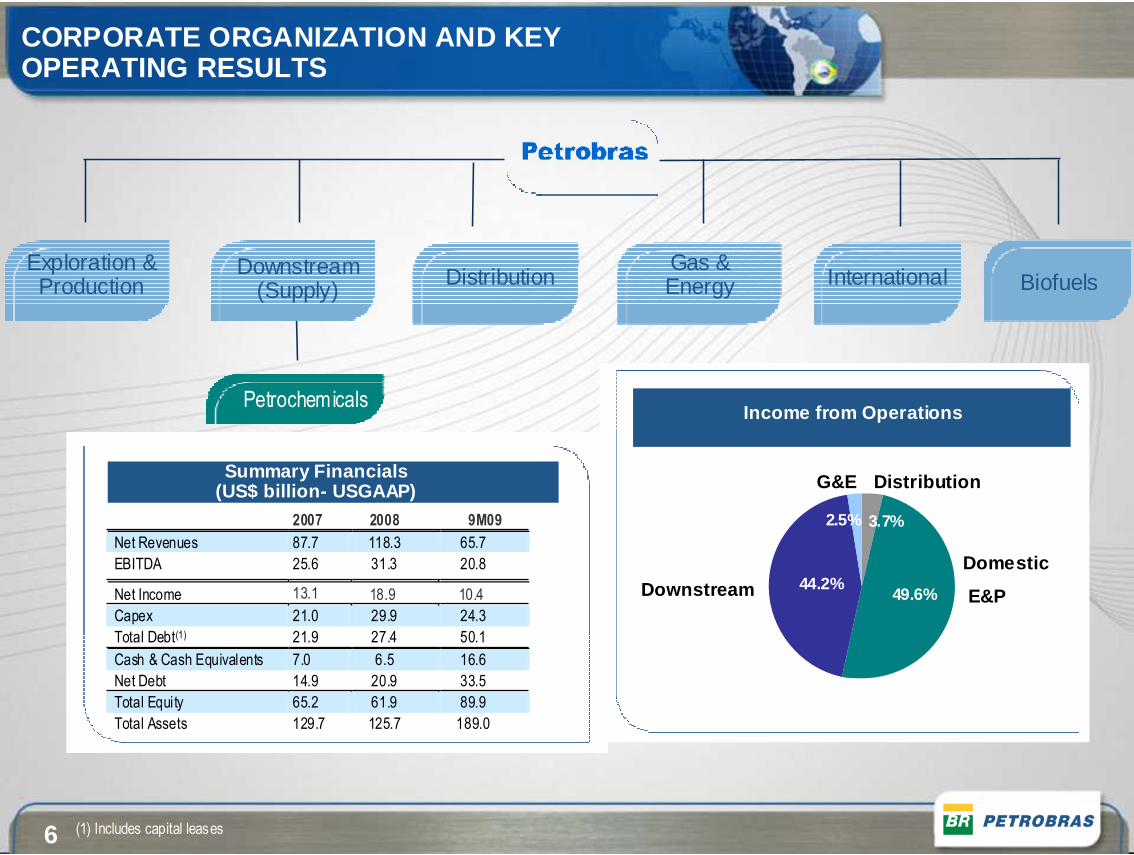
2007 2008 9M09
Net Revenues 87.7 118.3 65.7
EBITDA 25.6 31.3 20.8
Net Income 13.1 18.9 10.4
Capex 21.0 29.9 24.3
Total Debt(1) 21.9 27.4 50.1
Cash & Cash Equivalents 7.0 6.5 16.6
Net Debt 14.9 20.9 33.5
Total Equity 65.2 61.9 89.9
Total Assets 129.7 125.7 189.0
Exploration & Production
Downstream(Supply)
Gas & EnergyDistribution
Petrochemicals
International
Summary Financials (US$ billion- USGAAP)
(1) Includes capital leases
Biofuels
2.5% 3.7%
49.6%44.2%
Income from Operations
CORPORATE ORGANIZATION AND KEY OPERATING RESULTS
Domestic
E&PDownstream
G&E Distribution
7
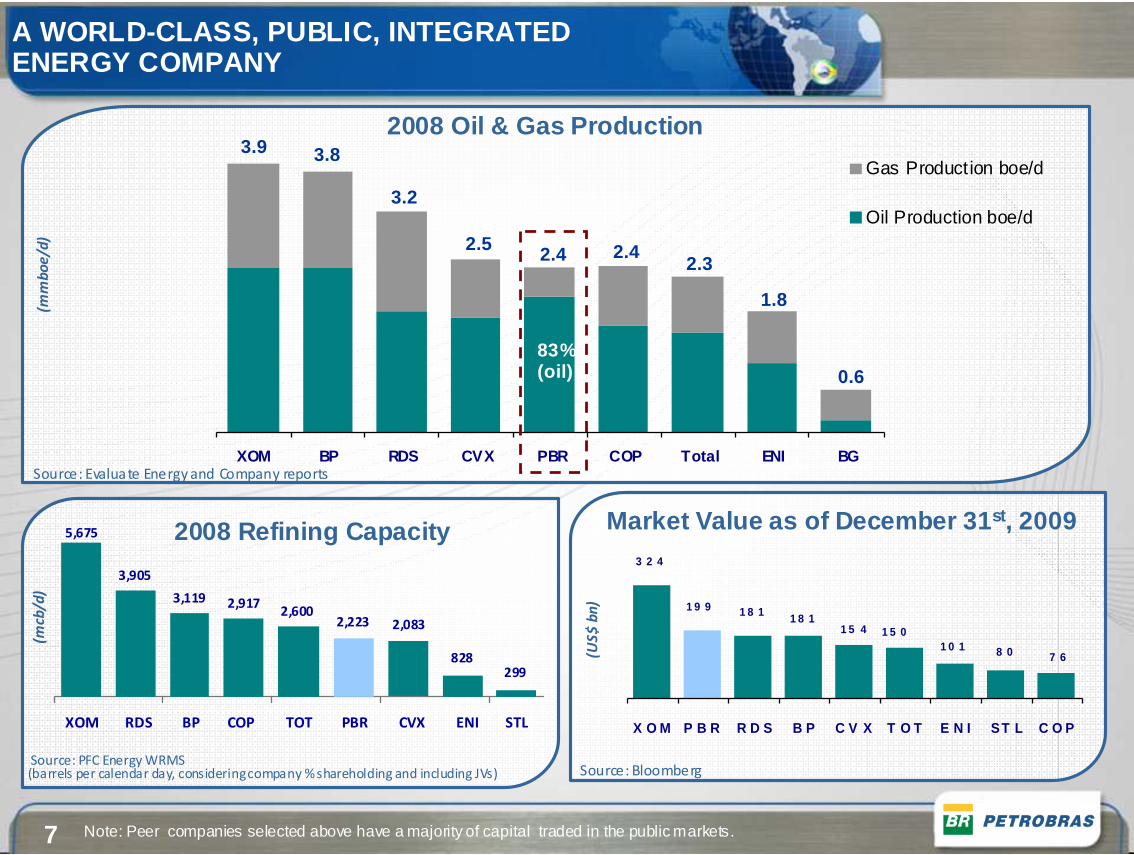
2008 Oil & Gas Production
2008 Refining Capacity
A WORLD-CLASS, PUBLIC, INTEGRATED ENERGY COMPANY
Note: Peer companies selected above have a majority of capital traded in the public markets.
Source: Evaluate Energy and Company reports
Source: PFC Energy WRMS (barrels per calendar day, considering company % shareholding and including JVs)
(mm
bo
e/d
)(m
cb/d
)
299828
2,223 2,083
5,675
2,6002,9173,119
3,905
XOM RDS BP COP TOT PBR CVX ENI STL
Market Value as of December 31 st, 20093 2 4
1 9 9 1 8 1
7 68 01 0 11 5 01 5 4
1 8 1
X O M P B R R D S B P C V X T O T E N I ST L C O P
(US
$ b
n)
Source: Bloomberg
XOM BP RDS CVX PBR COP Total ENI BG
Gas Production boe/d
Oil Production boe/d
3.9 3.8
3.2
2.5 2.4 2.42.3
1.8
0.683%(oil)
8
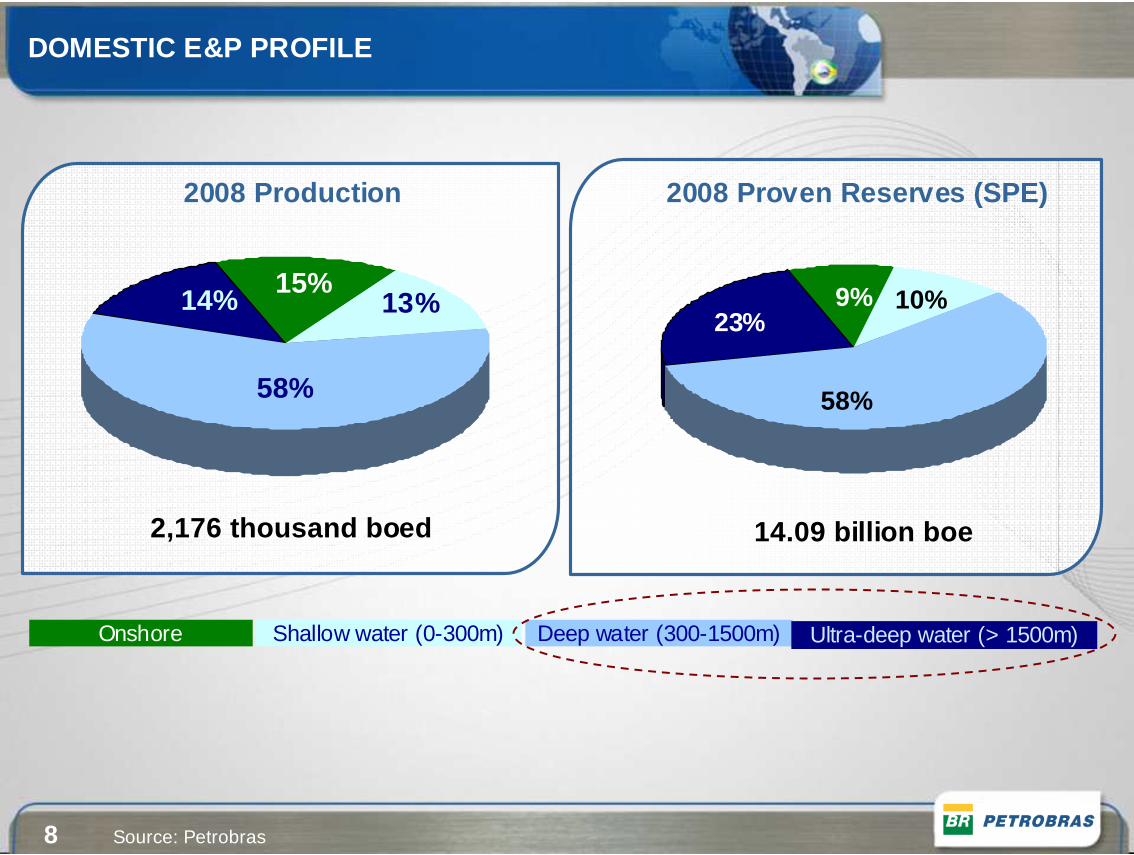
DOMESTIC E&P PROFILE
2008 Proven Reserves (SPE)
9% 10%
58%
23%
14.09 billion boe
Shallow water (0-300m)Onshore Deep water (300-1500m) Ultra-deep water (> 1500m)
Source: Petrobras
15%13%
58%
14%
2008 Production
2,176 thousand boed
9
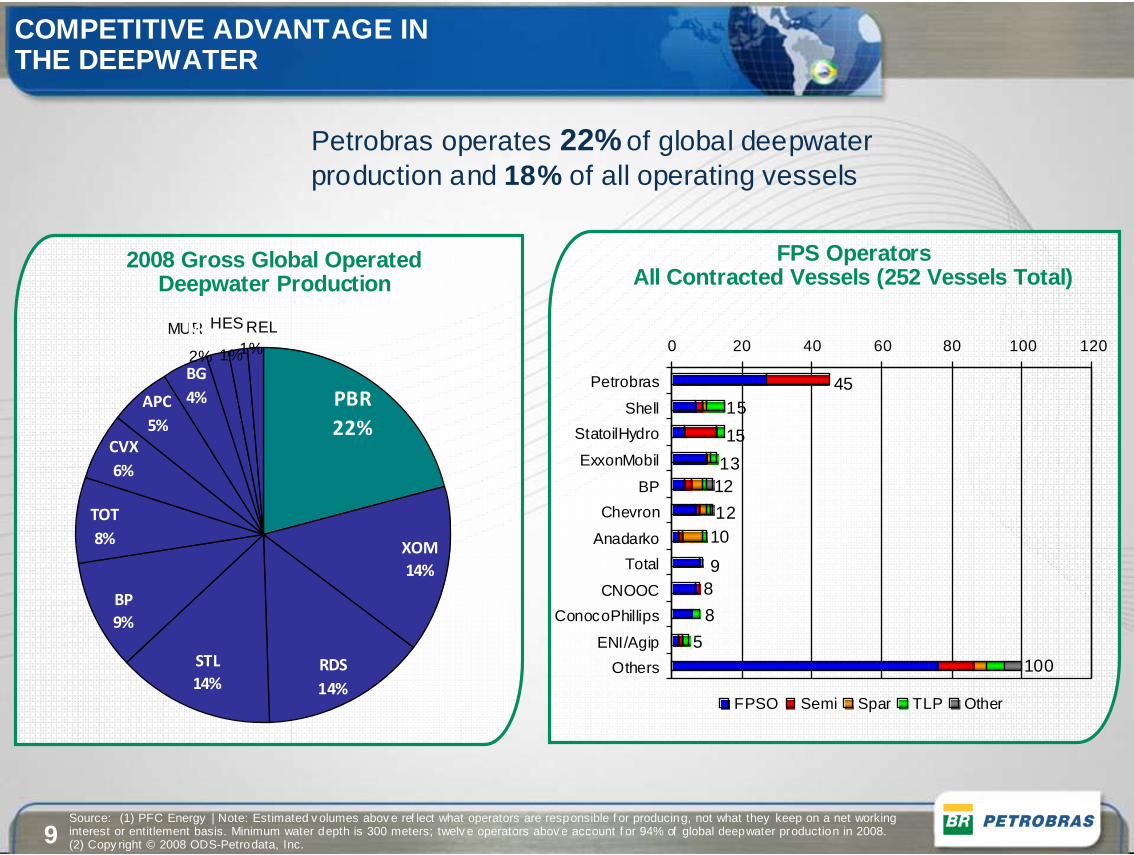
COMPETITIVE ADVANTAGE IN THE DEEPWATER
XOM
APC6%
MUR
Petrobras operates 22% of global deepwater production and 18% of all operating vessels
Source: (1) PFC Energy | Note: Estimated v olumes abov e ref lect what operators are responsible f or producing, not what they keep on a net working interest or entitlement basis. Minimum water depth is 300 meters; twelv e operators abov e account f or 94% of global deepwater production in 2008. (2) Copy right © 2008 ODS-Petrodata, Inc.
2008 Gross Global Operated Deepwater Production
PBR
22%
XOM
14%
RDS
14%
STL
14%
BP
9%
TOT
8%
CVX
6%
APC
5%
BG
4%
MUR
2%
REL
1%
HES
1%
2%
HES
1%1%REL
8
45
5
8
1012
13
15
15
100
9
12
0 20 40 60 80 100 120
Petrobras
Shell
StatoilHydro
ExxonMobil
BP
Chevron
Anadarko
Total
CNOOC
ConocoPhillips
ENI/Agip
Others
FPSO Semi Spar TLP Other
FPS OperatorsAll Contracted Vessels (252 Vessels Total)
10
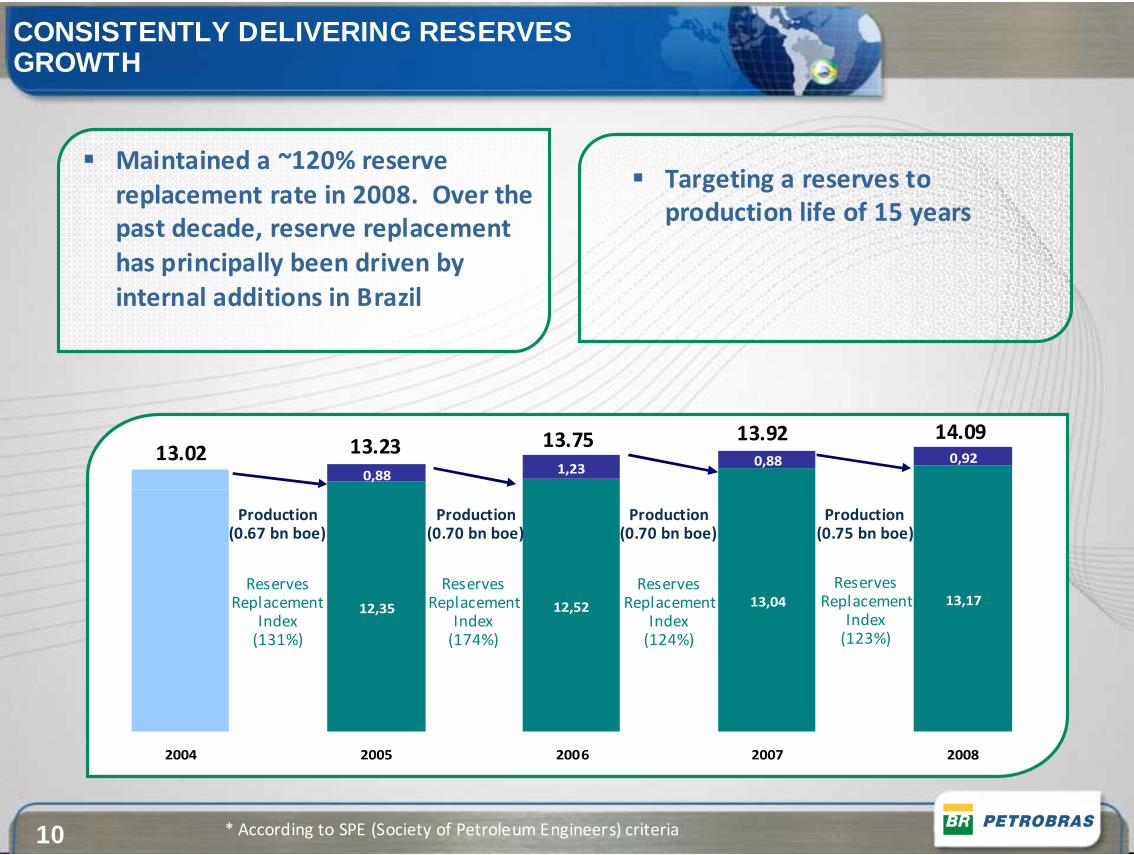
CONSISTENTLY DELIVERING RESERVES GROWTH
� Maintained a ~120% reserve
replacement rate in 2008. Over the
past decade, reserve replacement
has principally been driven by
internal additions in Brazil
� Targeting a reserves to
production life of 15 years
13,0412,3513,1712,52
0,880,88
0,921,23
2004 2005 2006 2007 2008
Production(0.70 bn boe)
13.02 13.23 13.75
Production(0.67 bn boe)
Reserves Replacement
Index(174%)
Reserves Replacement
Index(131%)
Production(0.75 bn boe)
Reserves Replacement
Index(123%)
Production(0.70 bn boe)
Reserves Replacement
Index(124%)
13.92 14.09
* According to SPE (Society of Petroleum Engineers) criteria
11
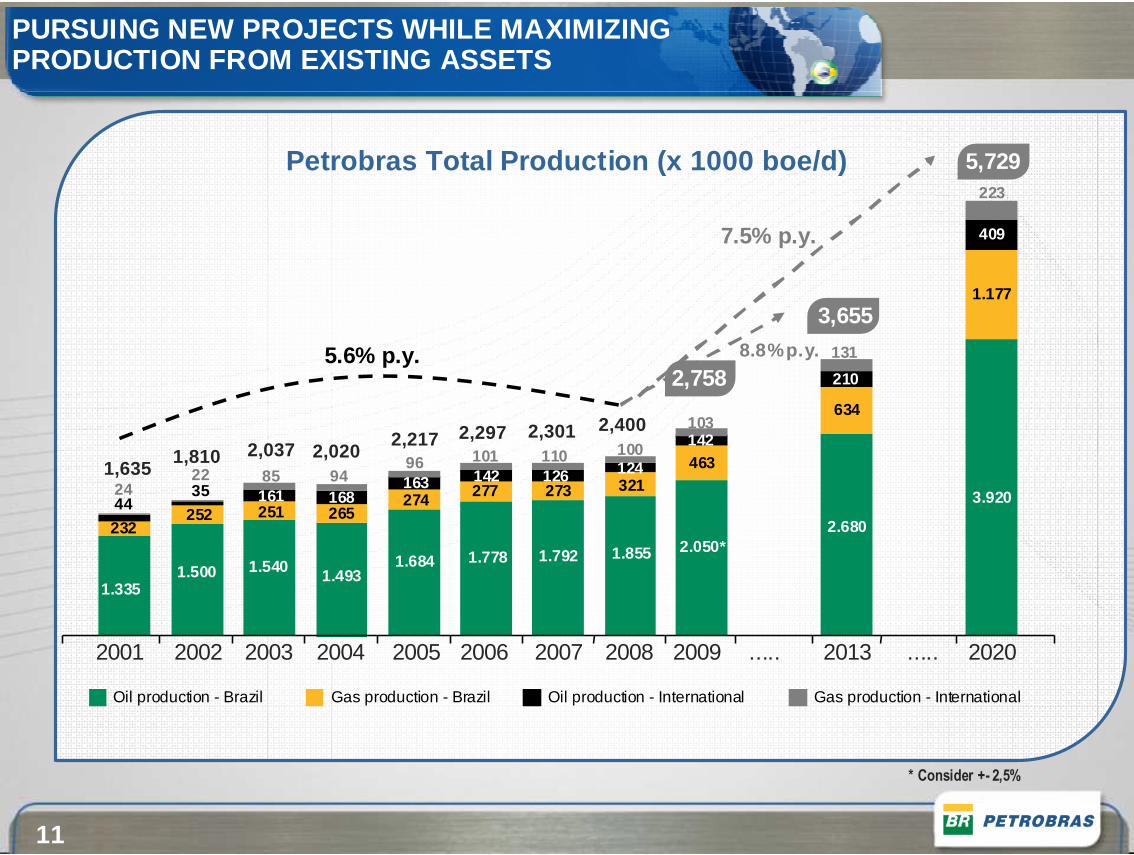
Petrobras Total Production (x 1000 boe/d)
1.335
232
4424
1.500
252
3522
1.540
25116185
1.493
26516894
1.684
27416396
1.778
277142101
1.792
273126110
1.855
321124100
2.050*
463142103
2.680
634
210
131
3.920
1.177
409
223
2001 2002 2003 2004 2005 2006 2007 2008 2009 ..... 2013 2020.....
* Consider +- 2,5%
8.8% p.y.
2,4002,3012,2972,2172,0202,0371,810
1,635
5.6% p.y.
7.5% p.y.
2,758
3,655
5,729
Oil production - Brazil Gas production - Brazil Oil production - International Gas production - International
PURSUING NEW PROJECTS WHILE MAXIMIZING PRODUCTION FROM EXISTING ASSETS
12
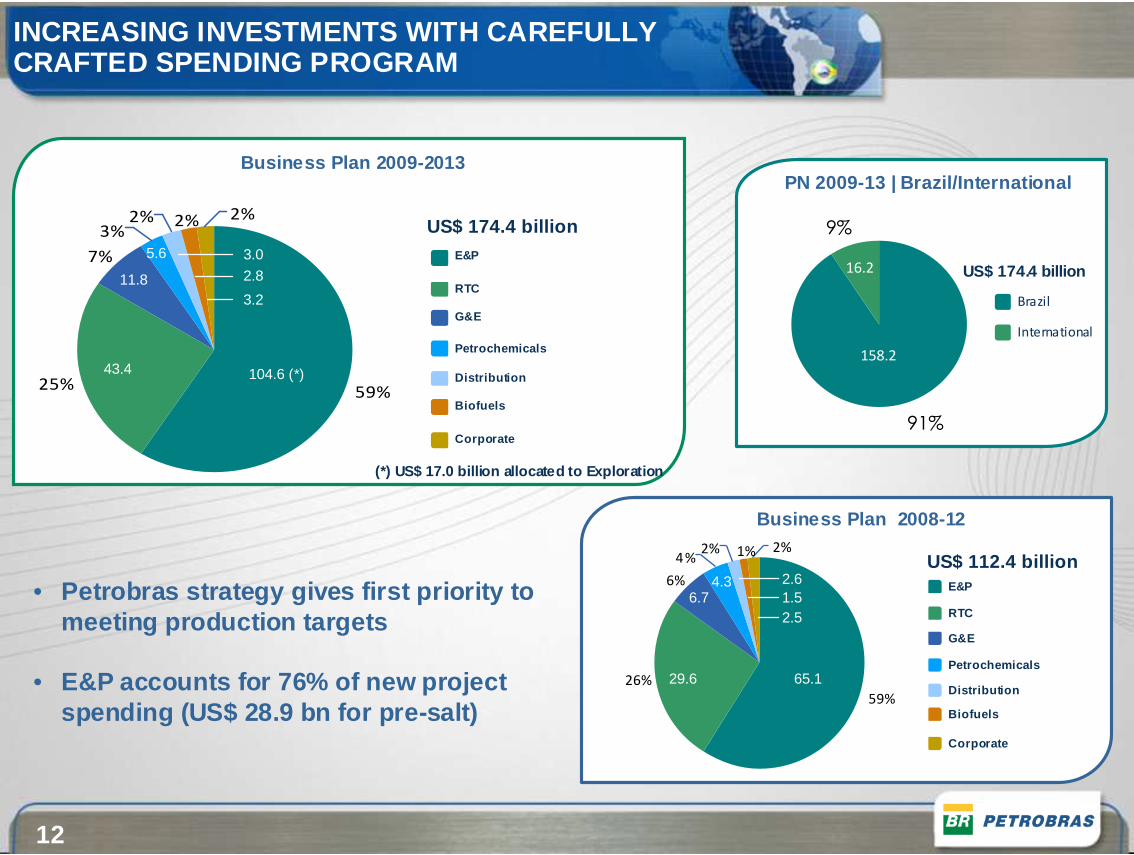
Business Plan 2008-12
26%
1%2%
6%
4%2%
59%
E&P
RTC
G&E
Petrochemicals
Biofuels
Distribution
Corporate
US$ 112.4 billion
65.129.6
6.74.3 2.6
1.52.5
Business Plan 2009-2013
25%
2%2%
7%
3%2%
59%
E&P
RTC
G&E
Petrochemicals
Biofuels
Distribution
Corporate
US$ 174.4 billion
104.6 (*)43.4
11.8
5.6 3.0
2.8
3.2
(*) US$ 17.0 billion allocated to Exploration
INCREASING INVESTMENTS WITH CAREFULLY CRAFTED SPENDING PROGRAM
PN 2009-13 | Brazil/International
91%
9%
158.2
16.2
Brazil
International
US$ 174.4 billion
• Petrobras strategy gives first priority to meeting production targets
• E&P accounts for 76% of new project spending (US$ 28.9 bn for pre-salt)
13
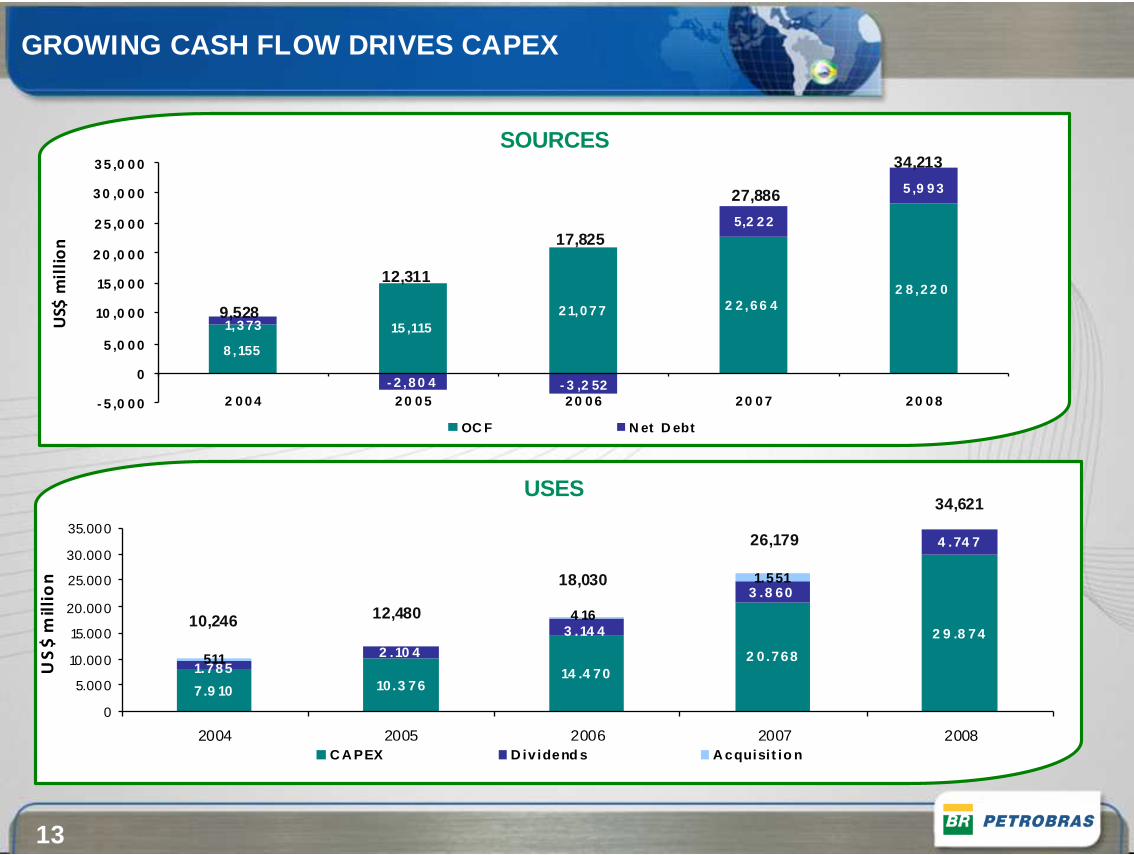
SOURCES
8 ,155
15 ,1152 1,0 7 7 2 2 ,6 6 4
2 8 ,2 2 0
5 ,9 9 3
5,2 2 2
- 3 ,2 52- 2 ,8 0 4
1,3 73
- 5 ,0 0 0
0
5 ,0 0 0
10 ,0 0 0
15 ,0 0 0
2 0 ,0 0 0
2 5 ,0 0 0
3 0 ,0 0 0
3 5 ,0 0 0
2 0 0 4 2 0 0 5 2 0 0 6 2 0 0 7 2 0 0 8
US$
mil
lio
n
OC F N et D ebt
USES
GROWING CASH FLOW DRIVES CAPEX
7.9 10 10.3 7614 .4 70
2 0.768
2 9 .8 742 .10 4
3 .8 60
4 .74 7
1.551
3 .14 4
1.785
4 16
511
0
5.000
10.000
15.000
20.000
25.000
30.000
35.000
2004 2005 2006 2007 2008
US
$ m
illi
on
C A PEX D iv idend s A cquisi t io n
9,528
12,311
17,825
27,886
34,213
10,246
18,030
26,179
34,621
12,480
14 t
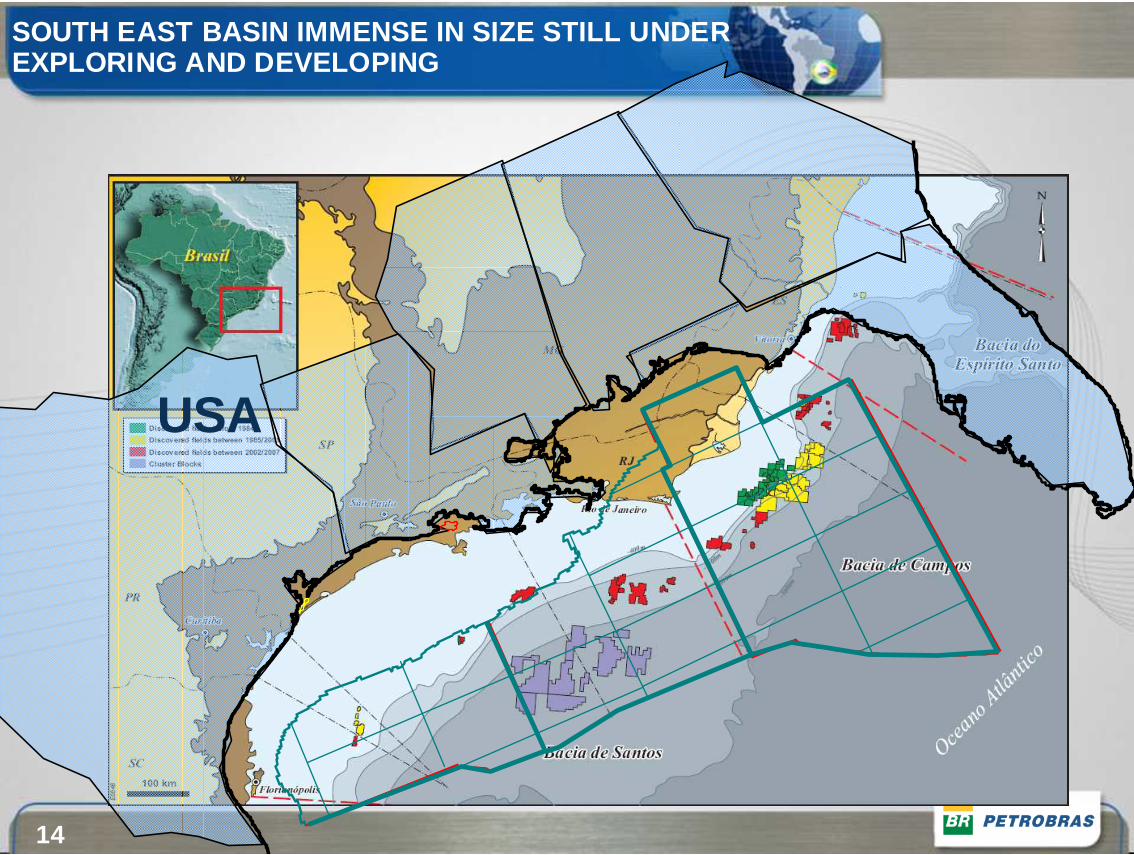
USA
SOUTH EAST BASIN IMMENSE IN SIZE STILL UNDER EXPLORING AND DEVELOPING
15
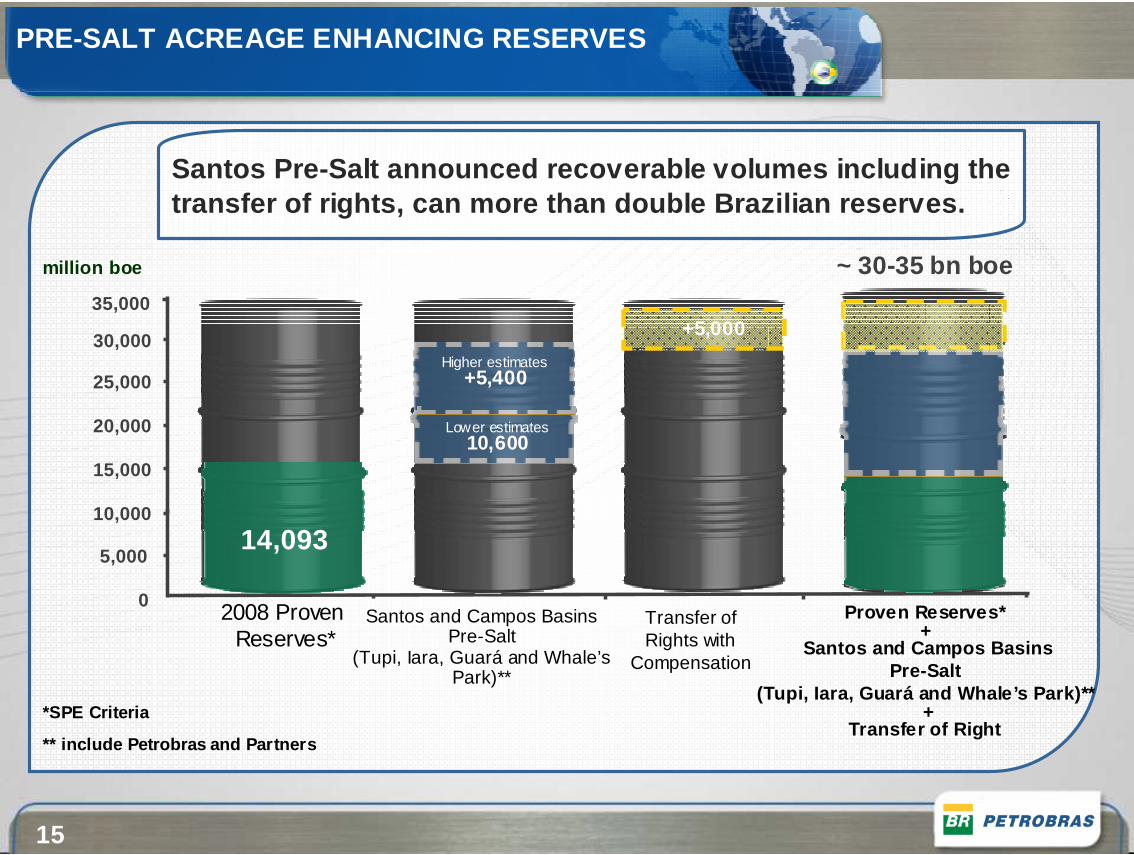
20,000
25,000
30,000
Santos and Campos BasinsPre-Salt
(Tupi, Iara, Guará and Whale’sPark)**
million boe ~ 30-35 bn boe
Proven Reserves* +
Santos and Campos BasinsPre-Salt
(Tupi, Iara, Guará and Whale’s Park)**+
Transfer of Right
5,000
10,000
15,000
2008 ProvenReserves*
14,093
0
PRE-SALT ACREAGE ENHANCING RESERVES
*SPE Criteria
** include Petrobras and Partners
Santos Pre-Salt announced recoverable volumes inclu ding the transfer of rights, can more than double Brazilian reserves.
Transfer ofRights with
Compensation
35,000
Higher estimates+5,400
Lower estimates10,600
+5,000
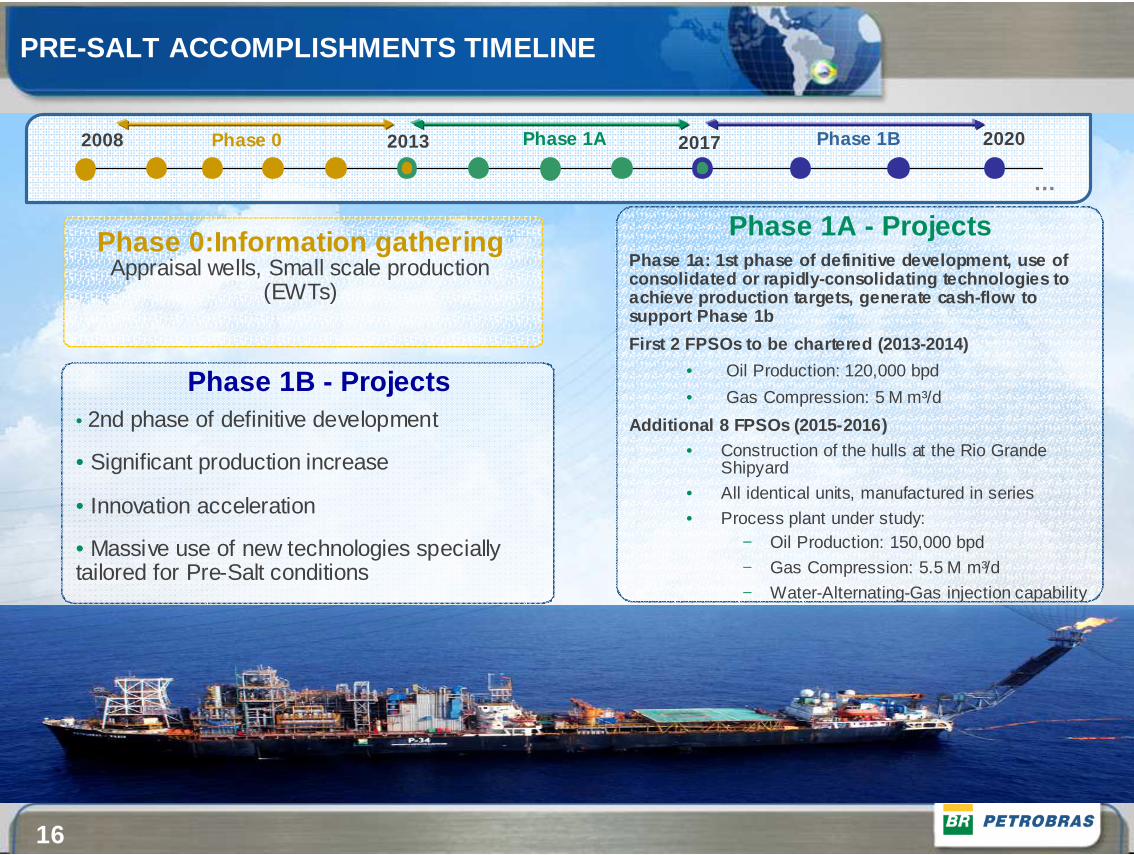
16
2017 2020Phase 1A Phase 1B
…
2013
Phase 1a: 1st phase of definitive development, use of consolidated or rapidly-consolidating technologies to achieve production targets, generate cash-flow to support Phase 1b
First 2 FPSOs to be chartered (2013-2014)
• Oil Production: 120,000 bpd
• Gas Compression: 5 M m³/d
Additional 8 FPSOs (2015-2016)• Construction of the hulls at the Rio Grande
Shipyard
• All identical units, manufactured in series
• Process plant under study:− Oil Production: 150,000 bpd
− Gas Compression: 5.5 M m³/d
− Water-Alternating-Gas injection capability
Phase 1A - Projects
Phase 1B - Projects• 2nd phase of definitive development
• Significant production increase
• Innovation acceleration
• Massive use of new technologies specially tailored for Pre-Salt conditions
Phase 0:Information gatheringAppraisal wells, Small scale production
(EWTs)
2008 Phase 0
PRE-SALT ACCOMPLISHMENTS TIMELINE
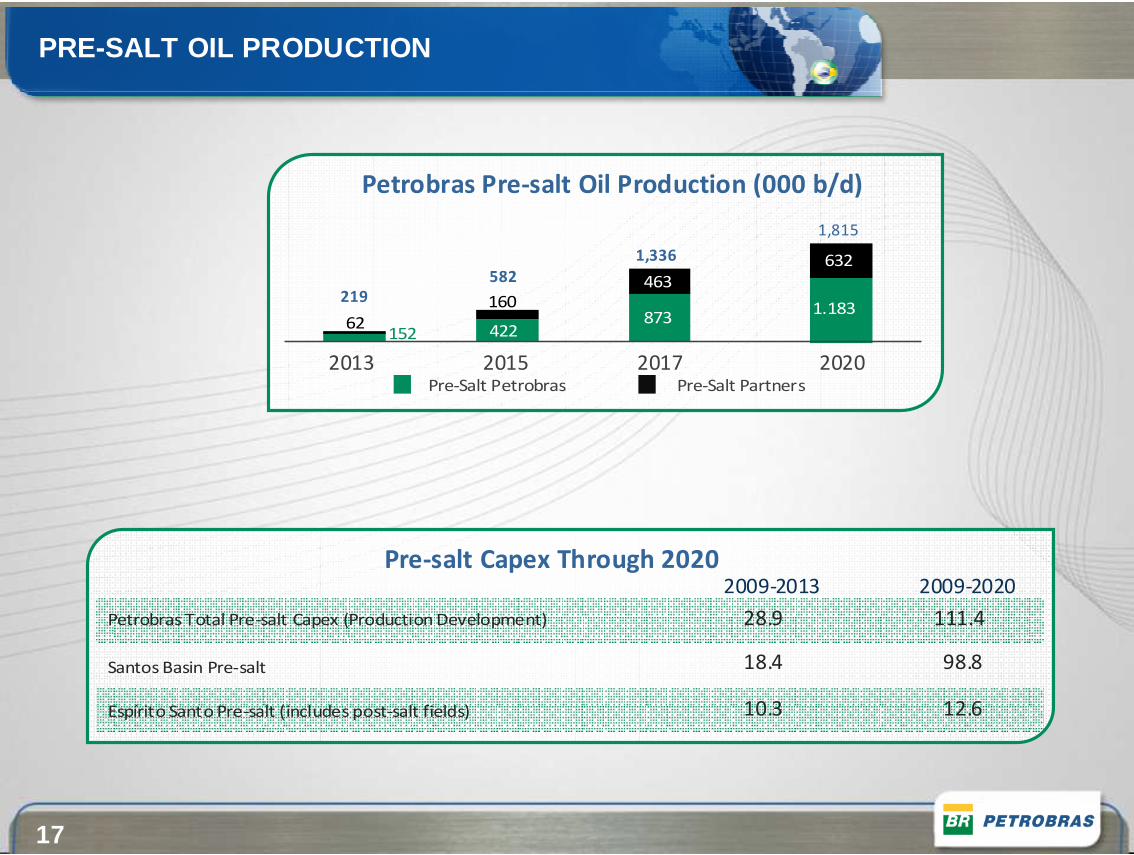
17
Petrobras Pre-salt Oil Production (000 b/d)
2013 2015 2017 2020
62152
160
422
463
873
632
1.183
Pre-Salt Petrobras Pre-Salt Partners
219
1,336
1,815
582
Pre-salt Capex Through 2020
Petrobras Total Pre-salt Capex (Production Development)
Santos Basin Pre-salt
Espírito Santo Pre-salt (includes post-salt fields)
2009-2013 2009-2020
28.9
18.4
10.3
111.4
98.8
12.6
PRE-SALT OIL PRODUCTION
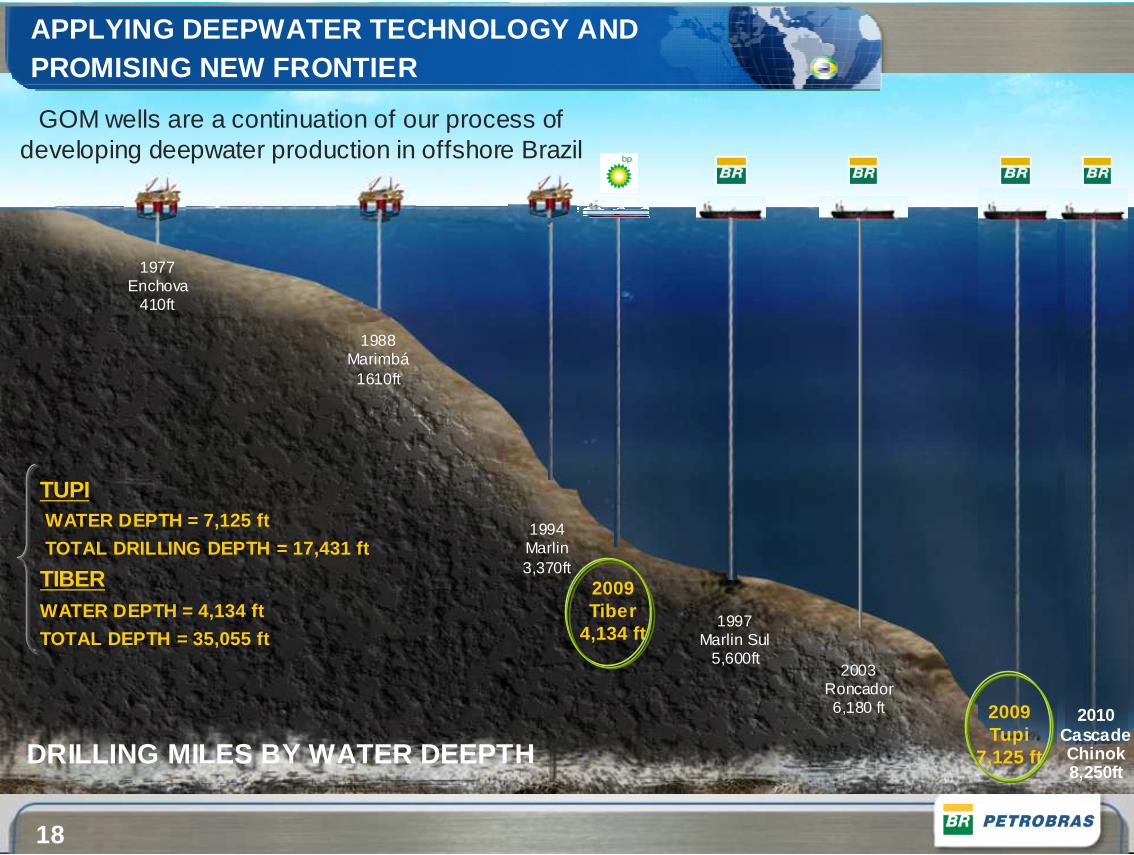
18
1977Enchova
410ft
1988Marimbá
1610ft
1994Marlin3,370ft
2009Tiber
4,134 ft1997
Marlin Sul5,600ft
2003Roncador6,180 ft
DRILLING MILES BY WATER DEEPTH
GOM wells are a continuation of our process of developing deepwater production in offshore Brazil
APPLYING DEEPWATER TECHNOLOGY AND PROMISING NEW FRONTIER
2009Tupi
7,125 ft
2010CascadeChinok8,250ft
TUPIWATER DEPTH = 7,125 ft
TOTAL DRILLING DEPTH = 17,431 ft
TIBERWATER DEPTH = 4,134 ft
TOTAL DEPTH = 35,055 ft
19
8.0
4.8
2.9 2.82.5 2.4 2.3 2.3 2.2 2.0 1.9 1.7 1 .7 1.7
-
1
2
3
4
5
6
7
8
9
10
US
Ch
ina
Jap
an
Ind
ia
Ru
ssia
Ge
rma
ny
Bra
zil
Ca
na
da
S. K
ore
a
Sau
di
Me
xico
Fran
ce
Iran UK
Ital
y
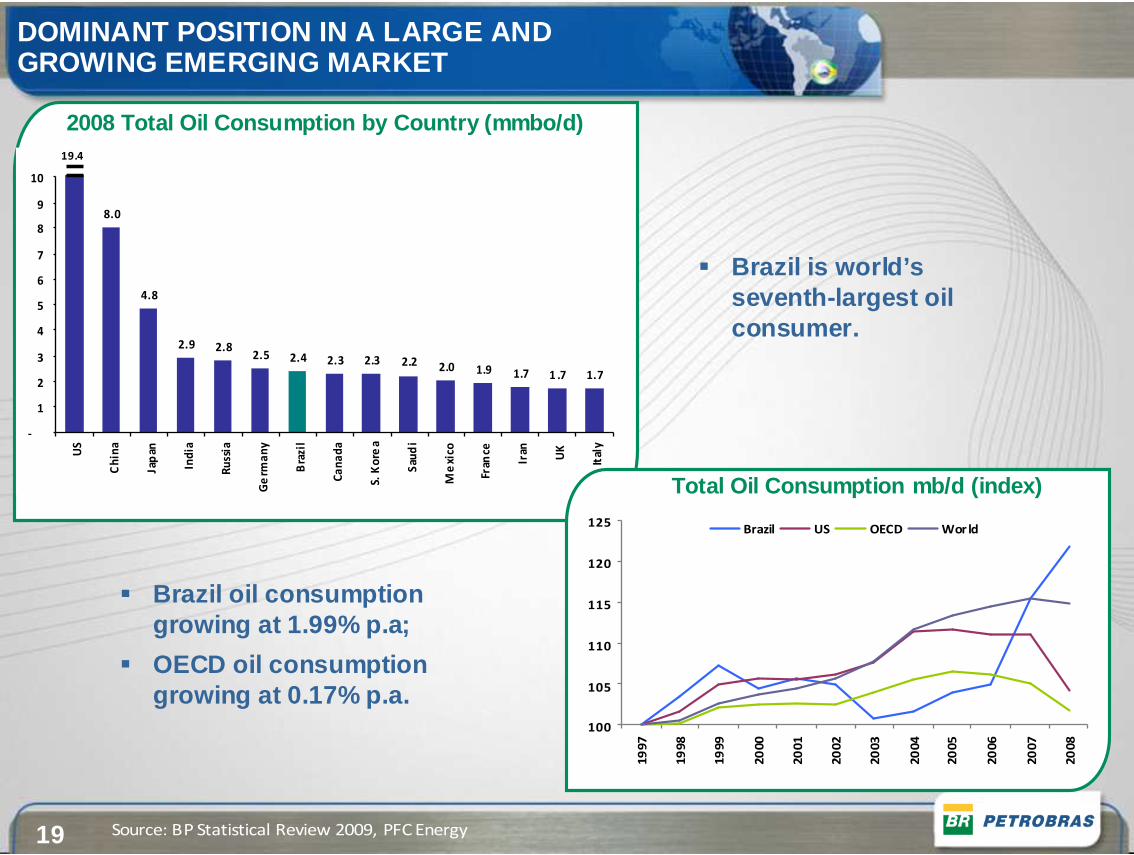
2008 Total Oil Consumption by Country (mmbo/d)
DOMINANT POSITION IN A LARGE AND GROWING EMERGING MARKET
Source: BP Statistical Review 2009, PFC Energy
� Brazil is world’s seventh-largest oil consumer.
� Brazil oil consumption growing at 1.99% p.a;
� OECD oil consumption growing at 0.17% p.a.
19.4
100
105
110
115
120
125
19
97
19
98
19
99
20
00
20
01
20
02
20
03
20
04
20
05
20
06
20
07
20
08
Brazil US OECD Wor ld
Total Oil Consumption mb/d (index)
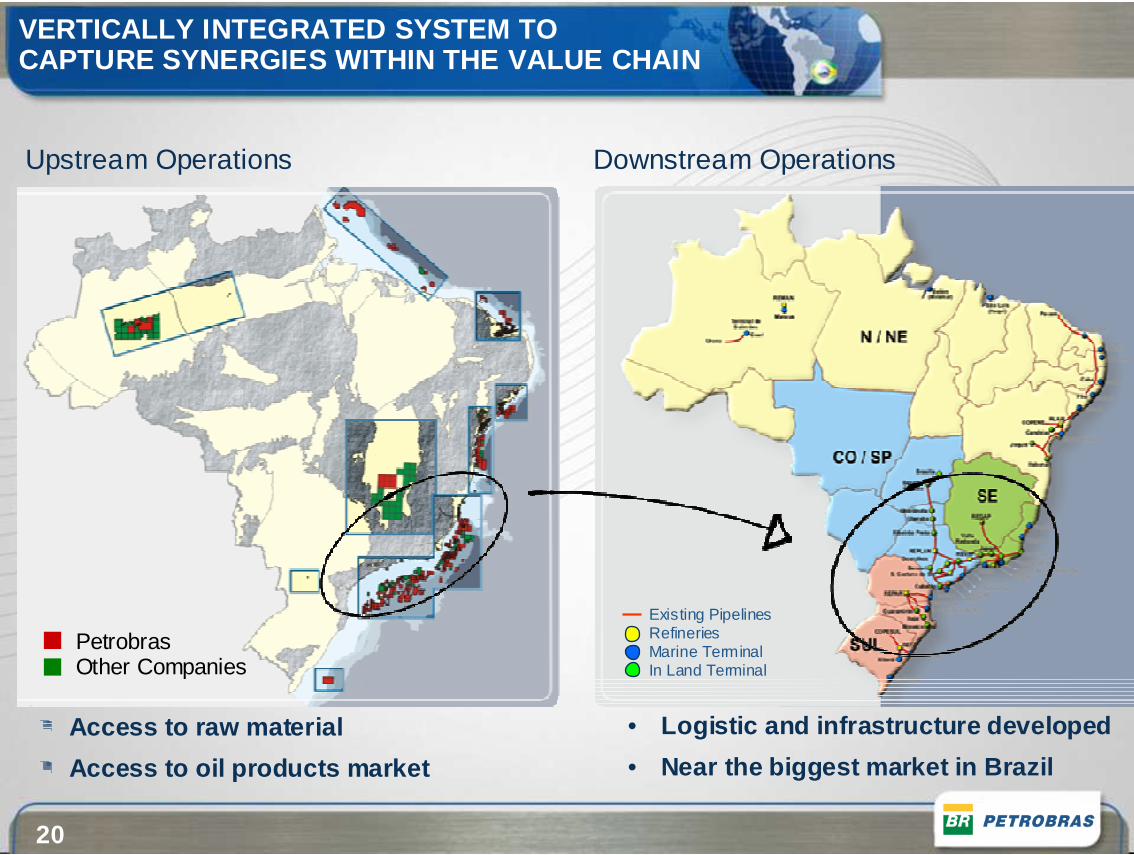
20
VERTICALLY INTEGRATED SYSTEM TO CAPTURE SYNERGIES WITHIN THE VALUE CHAIN
PetrobrasOther Companies
Upstream Operations Downstream Operations
Existing PipelinesRefineriesMarine Terminal In Land Terminal
Access to raw material
Access to oil products market
• Logistic and infrastructure developed
• Near the biggest market in Brazil
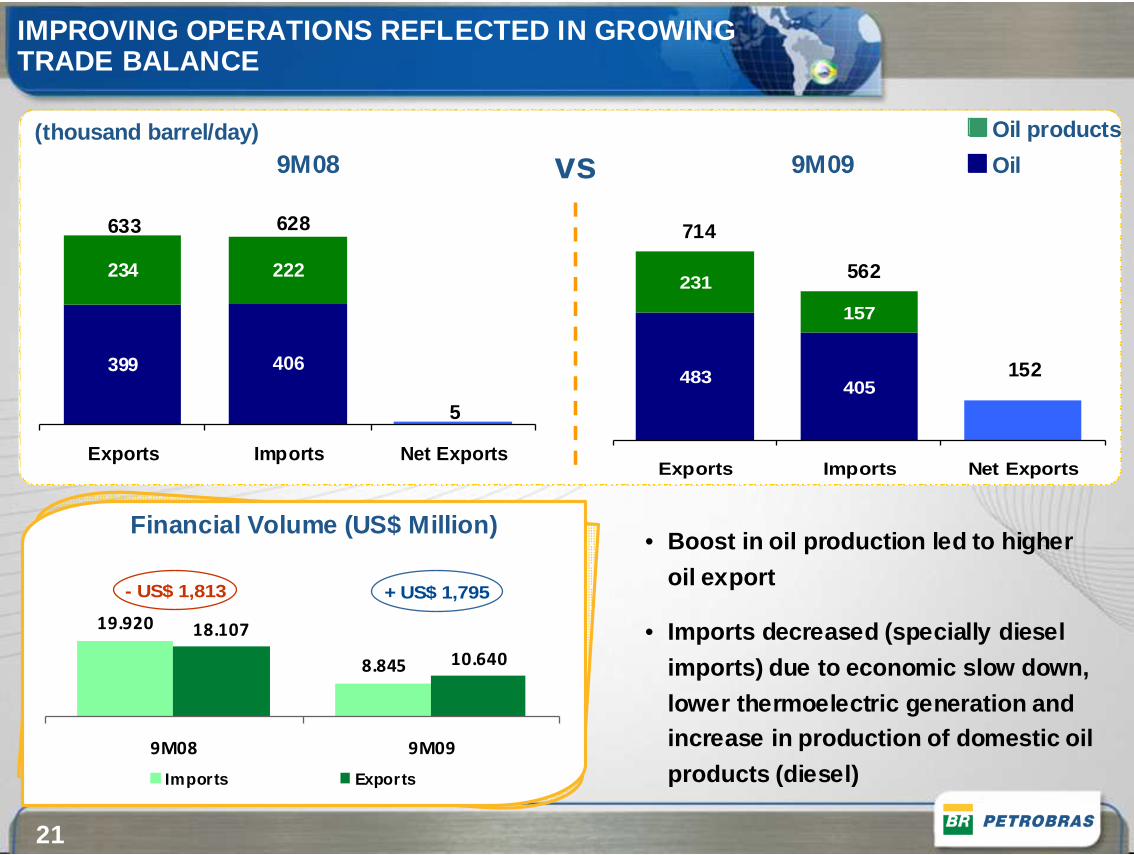
21
9M09
483405
231
157
Exports Imports Net Exports
9M08
399 406
234 222
Exports Imports Net Exports
628633
5
152
562
714
vs
19.920
8.845
18.107
10.640
9M08 9M09
Imports Exports
+ US$ 1,795- US$ 1,813
IMPROVING OPERATIONS REFLECTED IN GROWING TRADE BALANCE
Oil
Oil products(thousand barrel/day)
Financial Volume (US$ Million)• Boost in oil production led to higher
oil export
• Imports decreased (specially diesel
imports) due to economic slow down,
lower thermoelectric generation and increase in production of domestic oil
products (diesel)
22
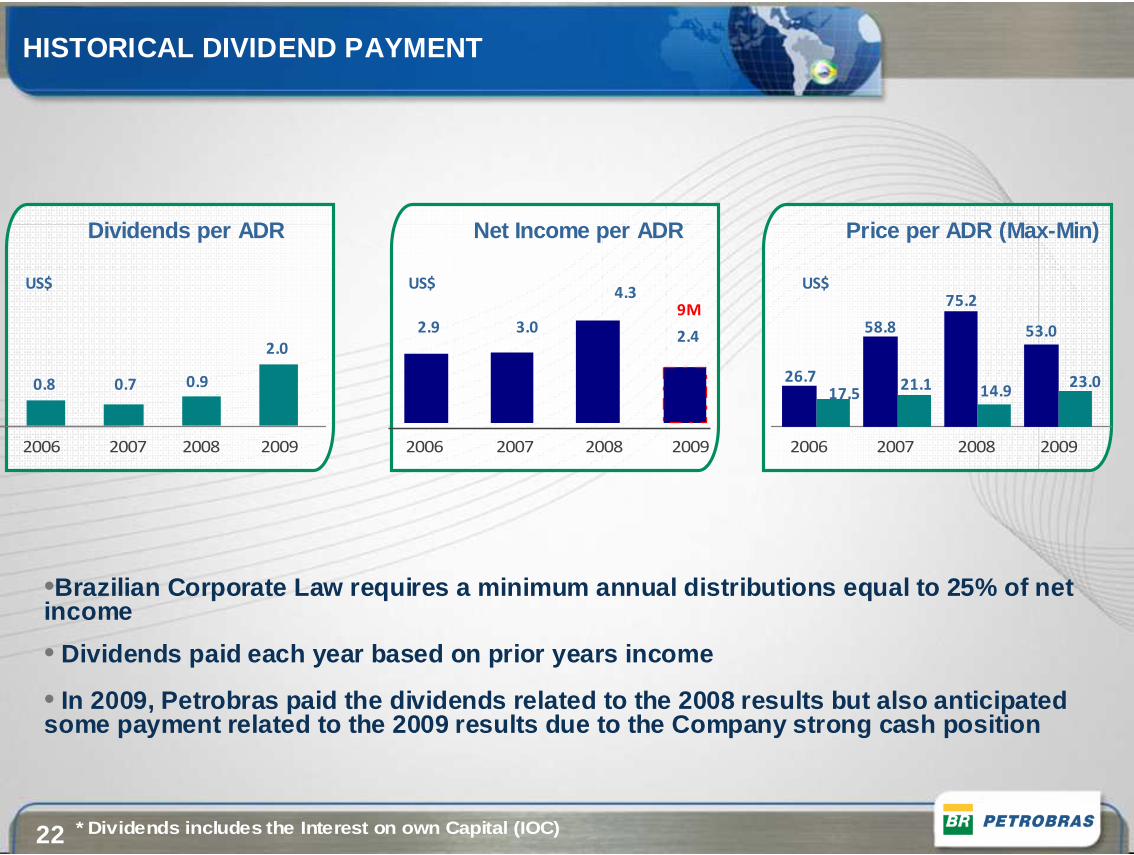
•Brazilian Corporate Law requires a minimum annual d istributions equal to 25% of net income
• Dividends paid each year based on prior years incom e
• In 2009, Petrobras paid the dividends related to th e 2008 results but also anticipated some payment related to the 2009 results due to the Company strong cash position
HISTORICAL DIVIDEND PAYMENT
* Dividends includes the Interest on own Capital (I OC)
2006
0.8
2007 2008 2009
0.7 0.9
2.0
2006 2007 2008 2009
2.9 3.0
4.3
2.4
2006 2007 2008 2009
9M
26.717.5
58.8
21.1
75.2
14.9
53.0
23.0
US$
Dividends per ADR Net Income per ADR Price per ADR (M ax-Min)
US$ US$
23
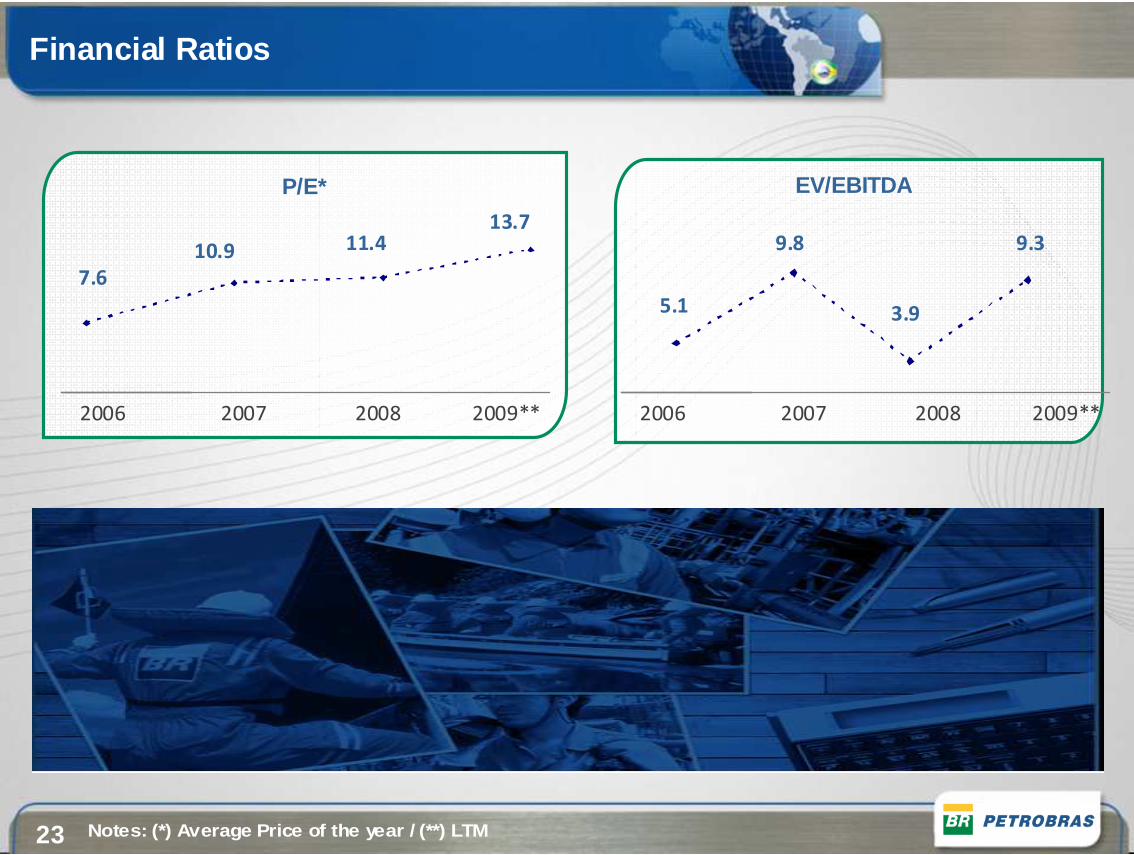
Financial Ratios
Notes: (*) Average Price of the year / (**) LTM
2006 2007 2008 2009** 2006 2007 2008 2009**
7.6
10.9 11.413.7
P/E* EV/EBITDA
5.1
9.8
3.9
9.3
24
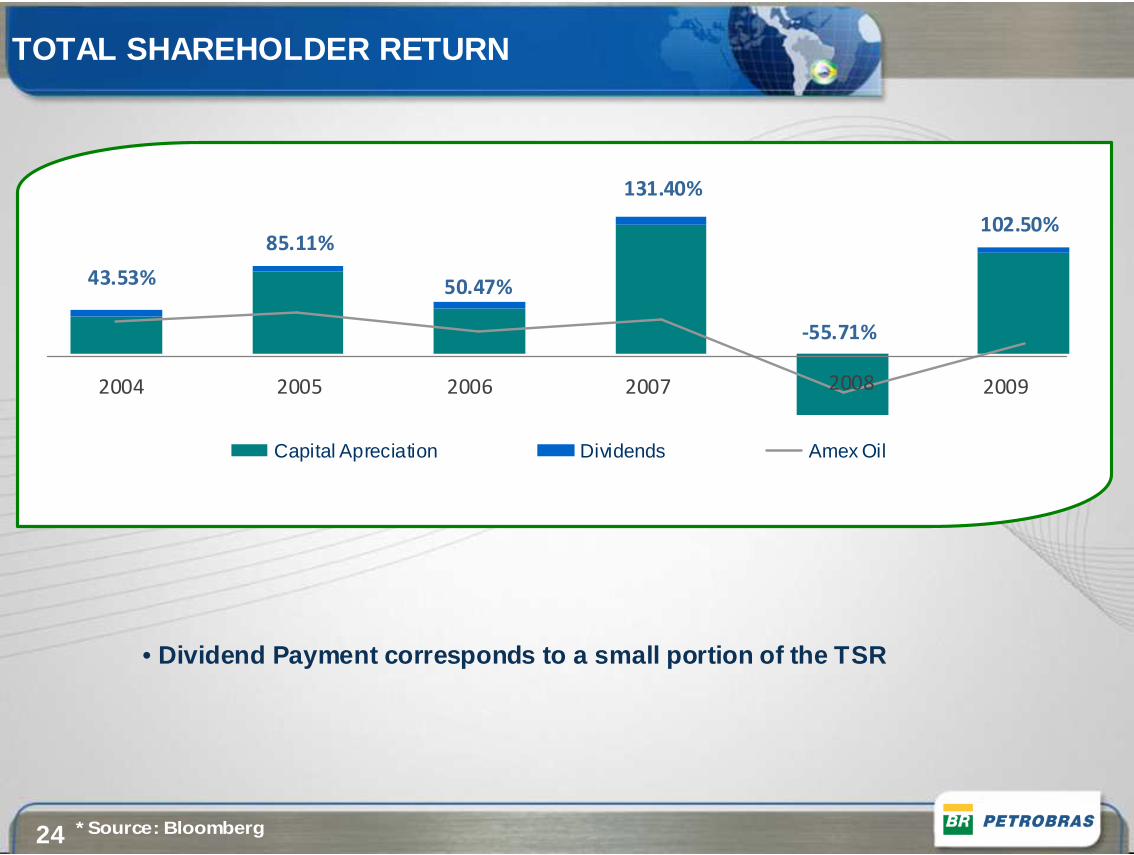
Capital Apreciation Dividends Amex Oil
TOTAL SHAREHOLDER RETURN
* Source: Bloomberg
• Dividend Payment corresponds to a small portion of the TSR
2006 2007 2008 200920052004
43.53%
85.11%
50.47%
131.40%
-55.71%
102.50%
25
For more information:Investor Relations
www.petrobras.com.br/ri+55 21 3224-1510