Embed Size (px)
Citation preview
2016Q4&FULLYEAROPERATING&FINANCIALRESULTSConferenceCall&WebcastPresentationMarch16,2017
This document has been prepared by Asanko Gold Inc. (the “Company”) solely forinformational purposes. This presentation is the sole responsibility of theCompany. Information contained herein does not purport to be complete and issubject to certain qualifications and assumptions and should not be relied uponfor the purposes of making an investment in the securities or entering into anytransaction. The information and opinions contained in the presentation areprovided as at the date of this presentation and are subject to change withoutnotice and, in furnishing the presentation, the Company does not undertake oragree to any obligation to provide recipients with access to any additionalinformation or to update or correct the presentation.No securities commission or similar regulatory authority has passed on the meritsof any securities referred to in the presentation, nor has it passed on or reviewedthe presentation. Cautionary note to United States investors - the informationcontained in the presentation uses terms that comply with reporting standards inCanada and certain estimates are made in accordance with National Instrument43-101 (“NI 43-101”) - standards for disclosure for mineral projects. Thepresentation uses the terms “other resources”, “measured”, “indicated” and“inferred” resources. United States investors are advised that, while such termsare recognized and required by Canadian securities laws, the SEC does notrecognize them. Under United States standards, mineralization may not beclassified as “ore” or a “reserve” unless the determination has been made thatthe mineralization could be economically and legally produced or extracted at thetime the reserve determination is made. United States investors are cautionednot to assume that all or any part of measured or indicated resources will ever beconverted into reserves. Further, “inferred resources” have a great amount ofuncertainty as to their existence and as to whether they can be mined legally oreconomically. It cannot be assumed that all or any part of the “inferred resources”will ever be upgraded to a higher category. Therefore, United States investors arealso cautioned not to assume that all or any part of the inferred resources exist, orthat they can be mined legally or economically.
Under Canadian rules, estimates of “inferred resources” may not form the basis offeasibility or pre-feasibility studies except in limited cases. Disclosure of “containedounces” is permitted disclosure under Canadian regulations; however, the SecuritiesExchange Commission (SEC) normally only permits issuers to report mineralizationthat does not constitute “reserves” as in place tonnage and grade without referenceto unit measures. Accordingly, information concerning descriptions ofmineralization, mineral resources and mineral reserves contained in thepresentation, may not be comparable to information made public by United Statescompanies subject to the reporting and disclosure requirements of the SEC.The presentation may contain “forward-looking statements” within the meaning ofthe United States private securities litigation reform act of 1995 and “forward-looking information” with the meaning of applicable Canadian securities legislationconcerning, among other things, the size and the growth of the Company’s mineralresources and the timing of further exploration and development of the Company’sprojects. There can be no assurance that the plans, intentions or expectations uponwhich these forward-looking statements and information are based will occur.“Forward-looking statements” and “forward-looking information” are subject to avariety of risks, uncertainties and assumptions, including those that are discussed inthe Company’s annual information form. Some of the factors which could affectfuture results and could cause results to differ materially from those expressed inthe forward looking statements and information contained herein include: marketprices, exploitation and exploration successes, continued availability of capital andfinancing and general economic, market, business or governmental conditions.Forward looking statements and information are based on the beliefs, estimates andopinions of management at the date the statements are made and are subject tochange without notice. The Company does not undertake to update forward lookingstatements or information if management believes, estimates forward or opinions orother circumstances should change. The Company also cautions potential investorsthat mineral resources that are not material reserves do not have demonstratedeconomic viability.
2
FORWARDLOOKINGINFORMATION
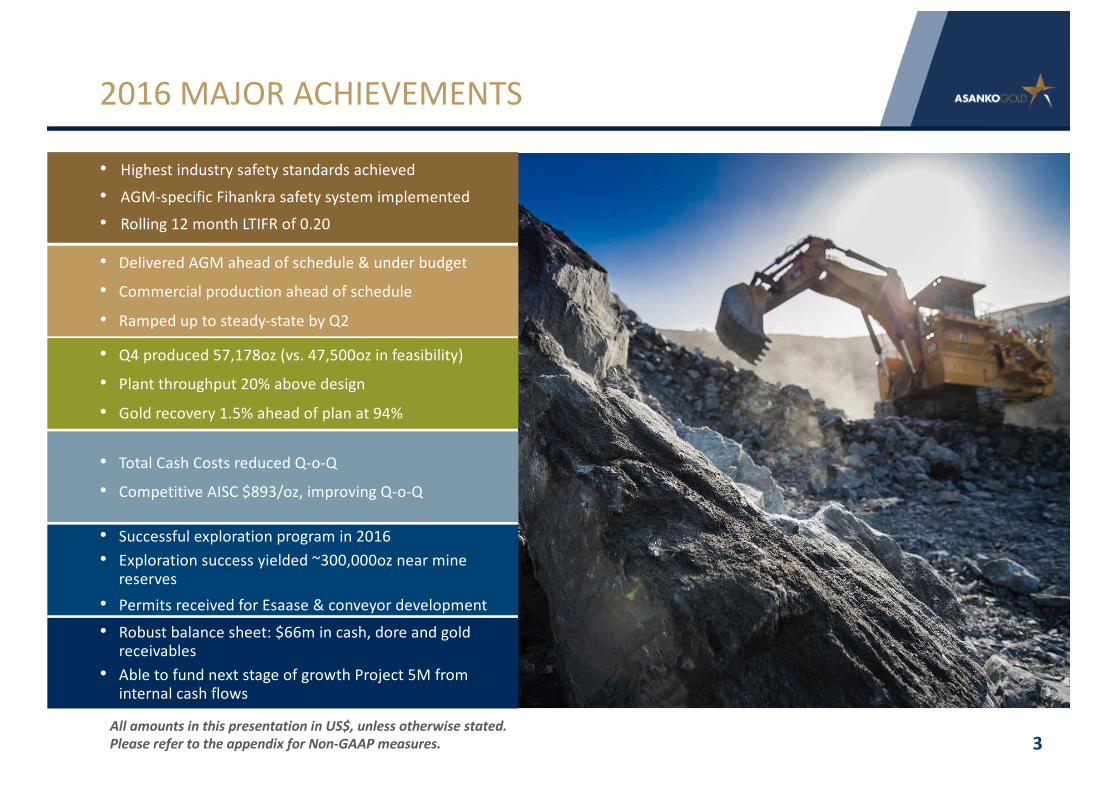
• DeliveredAGMaheadofschedule&underbudget
• Commercialproductionaheadofschedule
• Rampeduptosteady-statebyQ2
3
2016MAJORACHIEVEMENTS
• Highestindustrysafetystandardsachieved• AGM-specificFihankrasafetysystemimplemented• Rolling12monthLTIFRof0.20
• Q4produced57,178oz(vs.47,500ozinfeasibility)
• Plantthroughput20%abovedesign
• Goldrecovery1.5%aheadofplanat94%
• TotalCashCostsreducedQ-o-Q
• CompetitiveAISC$893/oz,improvingQ-o-Q
• Robustbalancesheet:$66mincash,doreandgoldreceivables
• AbletofundnextstageofgrowthProject5Mfrominternalcashflows
• Successfulexplorationprogramin2016• Explorationsuccessyielded~300,000oznearmine
reserves• PermitsreceivedforEsaase &conveyordevelopment
AllamountsinthispresentationinUS$,unlessotherwisestated.PleaserefertotheappendixforNon-GAAPmeasures.
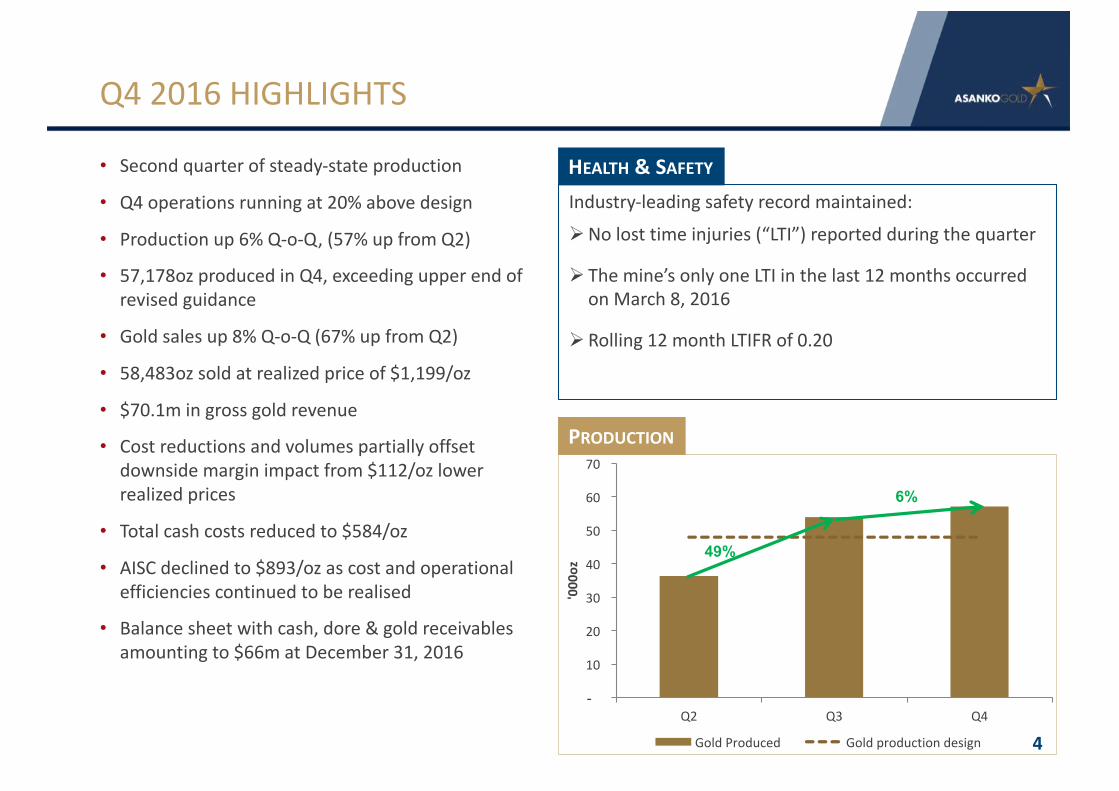
49%
6%
-
10
20
30
40
50
60
70
Q2 Q3 Q4
'000
oz
GoldProduced Goldproductiondesign
• Secondquarterofsteady-stateproduction
• Q4operationsrunningat20%abovedesign
• Productionup6%Q-o-Q,(57%upfromQ2)
• 57,178ozproducedinQ4,exceedingupperendofrevisedguidance
• Goldsalesup8%Q-o-Q(67%upfromQ2)
• 58,483oz soldatrealizedpriceof$1,199/oz
• $70.1mingrossgoldrevenue
• Costreductionsandvolumespartiallyoffsetdownsidemarginimpactfrom$112/ozlowerrealizedprices
• Totalcashcostsreducedto$584/oz
• AISCdeclinedto$893/ozascostandoperationalefficienciescontinuedtoberealised
• Balancesheetwithcash,dore &goldreceivablesamountingto$66matDecember31,2016
4
Q42016HIGHLIGHTS
Industry-leadingsafetyrecordmaintained:
ØNolosttimeinjuries(“LTI”)reportedduringthequarter
Ø Themine’sonlyoneLTIinthelast12monthsoccurredonMarch8,2016
Ø Rolling12monthLTIFRof0.20
HEALTH &SAFETY
PRODUCTION
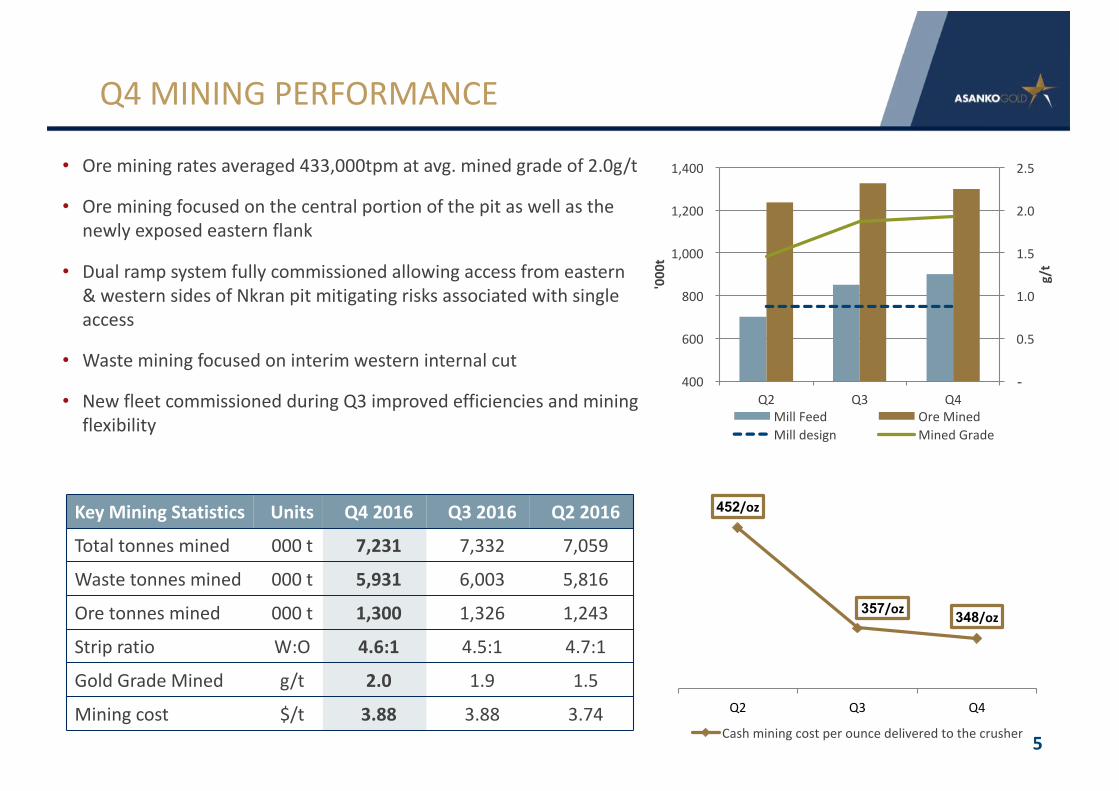
• Oreminingratesaveraged433,000tpmatavg.minedgradeof2.0g/t
• Oreminingfocusedonthecentralportionofthepitaswellasthenewlyexposedeasternflank
• Dualrampsystemfullycommissionedallowingaccessfromeastern&westernsidesofNkranpitmitigatingrisksassociatedwithsingleaccess
• Wasteminingfocusedoninterimwesterninternalcut
• NewfleetcommissionedduringQ3improvedefficienciesandminingflexibility
5
Q4MININGPERFORMANCE
Key Mining Statistics Units Q42016 Q32016 Q22016
Totaltonnes mined 000t 7,231 7,332 7,059
Wastetonnes mined 000t 5,931 6,003 5,816
Oretonnes mined 000t 1,300 1,326 1,243
Stripratio W:O 4.6:1 4.5:1 4.7:1
Gold GradeMined g/t 2.0 1.9 1.5
Mining cost $/t 3.88 3.88 3.74
-
0.5
1.0
1.5
2.0
2.5
400
600
800
1,000
1,200
1,400
Q2 Q3 Q4
g/t
'000
t
MillFeed OreMinedMilldesign MinedGrade
452/oz
357/oz 348/oz
Q2 Q3 Q4
Cashminingcostperouncedeliveredtothecrusher
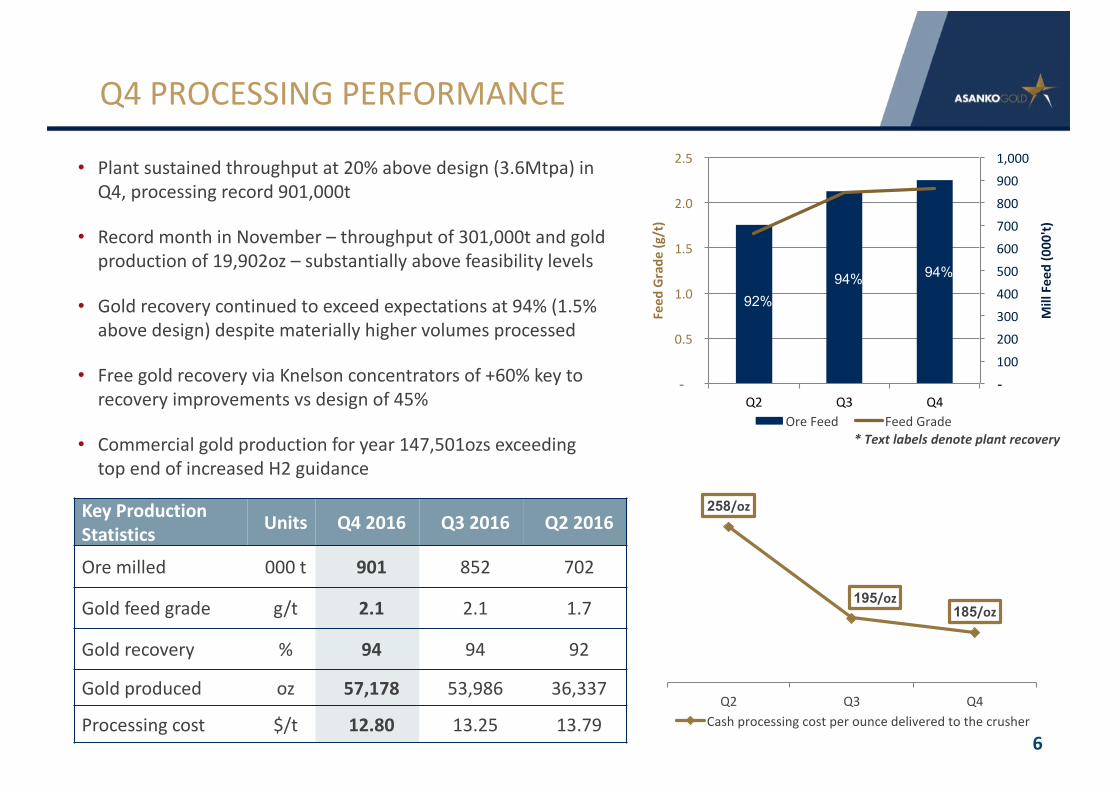
• Plantsustainedthroughputat20%abovedesign(3.6Mtpa)inQ4,processingrecord901,000t
• RecordmonthinNovember– throughputof301,000tandgoldproductionof19,902oz– substantiallyabovefeasibilitylevels
• Goldrecoverycontinuedtoexceedexpectationsat94%(1.5%abovedesign)despitemateriallyhighervolumesprocessed
• FreegoldrecoveryviaKnelsonconcentratorsof+60%keytorecoveryimprovementsvsdesignof45%
• Commercialgoldproductionforyear147,501ozsexceedingtopendofincreasedH2guidance
6
Q4PROCESSINGPERFORMANCE
KeyProductionStatistics Units Q42016 Q32016 Q22016
Ore milled 000t 901 852 702
Gold feed grade g/t 2.1 2.1 1.7
Gold recovery % 94 94 92
Gold produced oz 57,178 53,986 36,337
Processing cost $/t 12.80 13.25 13.79
*Textlabelsdenoteplantrecovery
92%94% 94%
-1002003004005006007008009001,000
-
0.5
1.0
1.5
2.0
2.5
Q2 Q3 Q4
MillFeed(000
't)
Feed
Grade
(g/t)
OreFeed FeedGrade
258/oz
195/oz185/oz
Q2 Q3 Q4Cashprocessingcostperouncedeliveredtothecrusher
7
Q4COSTPERFORMANCE
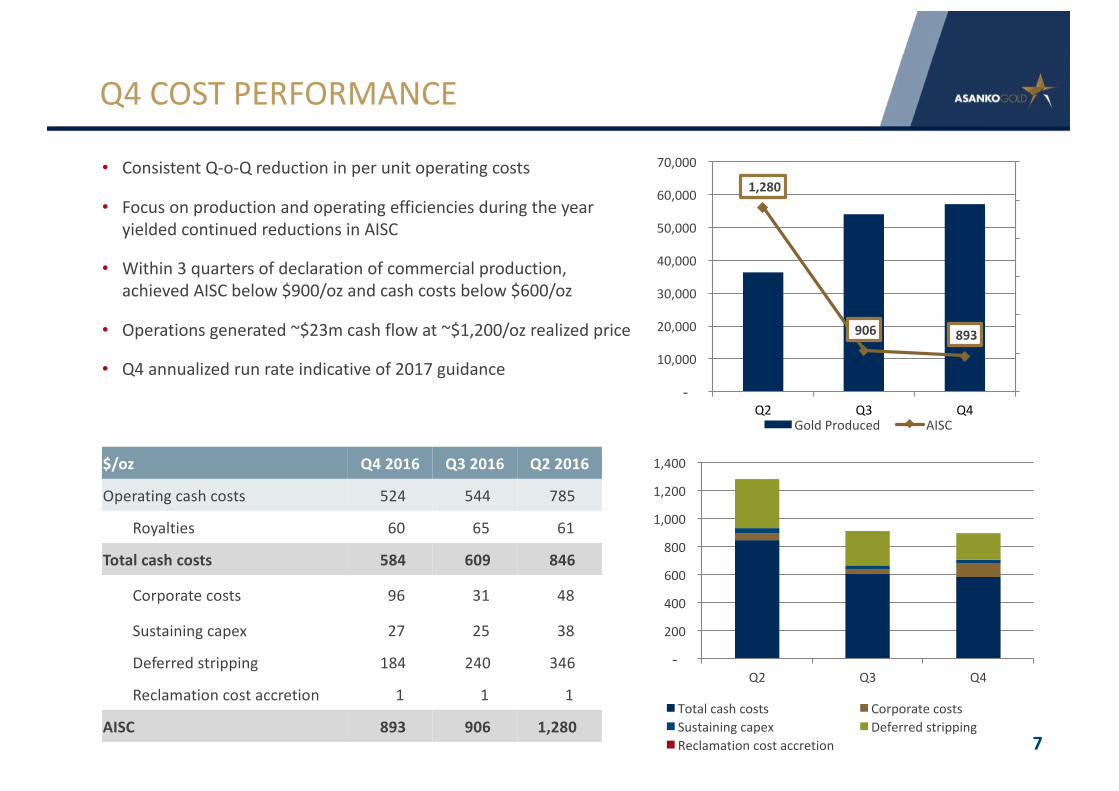
1,280
906 893
800
900
1,000
1,100
1,200
1,300
1,400
-
10,000
20,000
30,000
40,000
50,000
60,000
70,000
Q2 Q3 Q4GoldProduced AISC
• ConsistentQ-o-Qreductioninperunitoperatingcosts
• FocusonproductionandoperatingefficienciesduringtheyearyieldedcontinuedreductionsinAISC
• Within3quartersofdeclarationofcommercialproduction,achievedAISCbelow$900/ozandcashcostsbelow$600/oz
• Operationsgenerated~$23mcashflowat~$1,200/ozrealizedprice
• Q4annualizedrunrateindicativeof2017guidance
-
200
400
600
800
1,000
1,200
1,400
Q2 Q3 Q4
Totalcashcosts CorporatecostsSustainingcapex DeferredstrippingReclamationcostaccretion
$/oz Q42016 Q32016 Q22016
Operatingcashcosts 524 544 785
Royalties 60 65 61
Totalcashcosts 584 609 846
Corporatecosts 96 31 48
Sustainingcapex 27 25 38
Deferredstripping 184 240 346
Reclamationcostaccretion 1 1 1
AISC 893 906 1,280
8
INCOMESTATEMENT
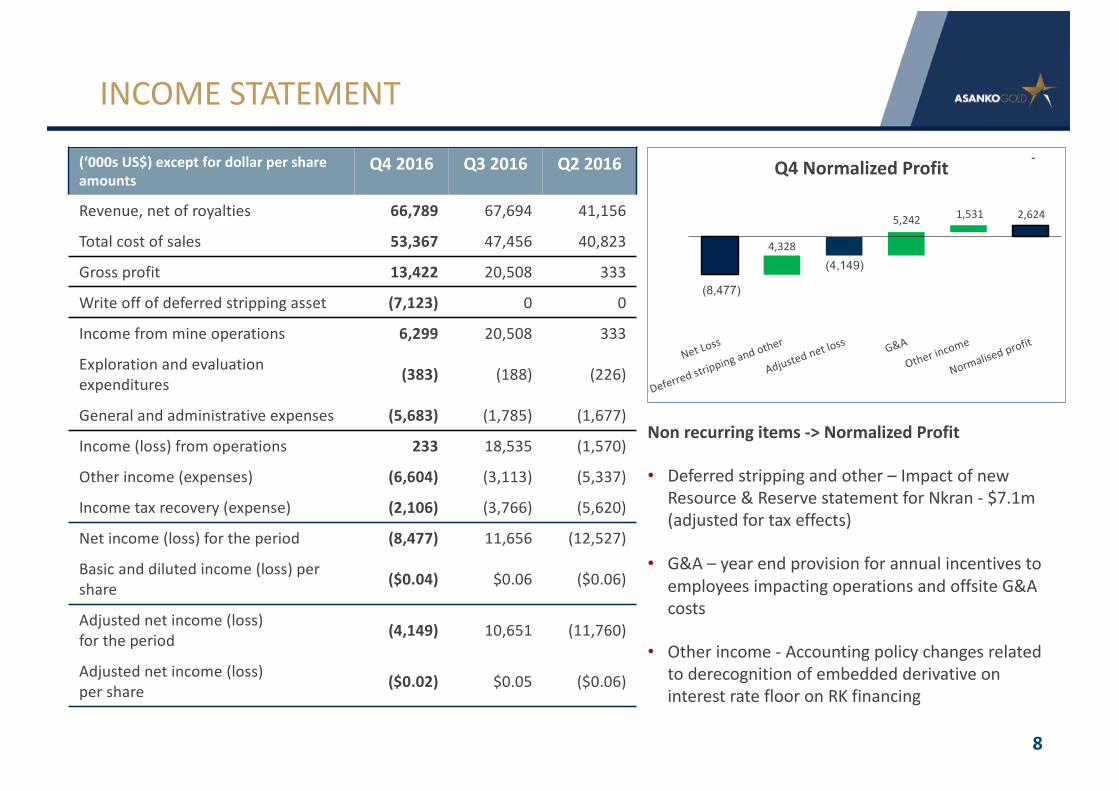
(‘000sUS$)except fordollarpershareamounts
Q42016 Q3 2016 Q22016
Revenue, netofroyalties 66,789 67,694 41,156
Totalcostofsales 53,367 47,456 40,823
Grossprofit 13,422 20,508 333
Writeoffof deferredstrippingasset (7,123) 0 0
Incomefrommineoperations 6,299 20,508 333
Exploration andevaluationexpenditures (383) (188) (226)
Generalandadministrative expenses (5,683) (1,785) (1,677)
Income(loss)fromoperations 233 18,535 (1,570)
Otherincome (expenses) (6,604) (3,113) (5,337)
Incometaxrecovery(expense) (2,106) (3,766) (5,620)
Netincome(loss)fortheperiod (8,477) 11,656 (12,527)
Basicanddilutedincome(loss)pershare ($0.04) $0.06 ($0.06)
Adjustednet income(loss)fortheperiod (4,149) 10,651 (11,760)
Adjustednetincome(loss)pershare ($0.02) $0.05 ($0.06)
(4,149)
-
(8,477)
4,328
5,242 1,531 2,624
Q4NormalizedProfit
Nonrecurringitems->NormalizedProfit
• Deferredstrippingandother– ImpactofnewResource&ReservestatementforNkran- $7.1m(adjustedfortaxeffects)
• G&A– yearendprovisionforannualincentivestoemployeesimpactingoperationsandoffsiteG&Acosts
• Otherincome- Accountingpolicychangesrelatedtoderecognition ofembeddedderivativeoninterestrateflooronRKfinancing
9
STRONGCASHFLOWFROMOPERATIONS
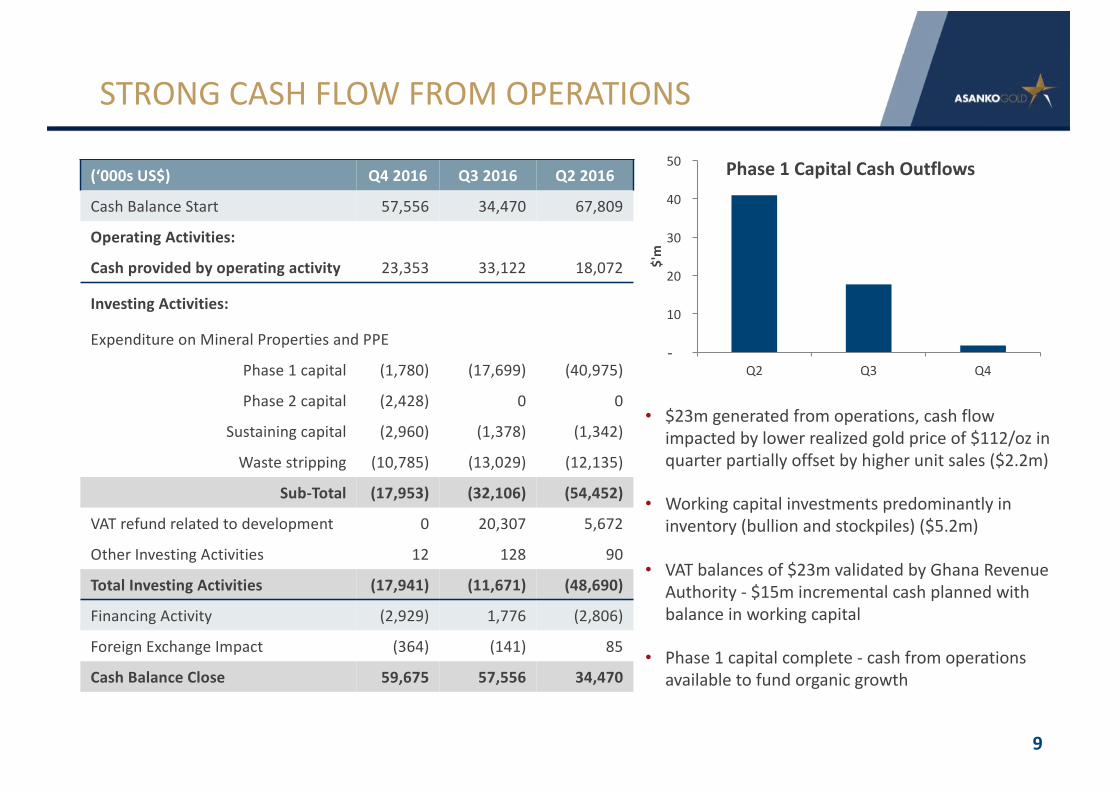
(‘000sUS$) Q42016 Q3 2016 Q22016
Cash BalanceStart 57,556 34,470 67,809
OperatingActivities:
Cashprovided byoperatingactivity 23,353 33,122 18,072
InvestingActivities:
Expenditure onMineralPropertiesandPPE
Phase1capital (1,780) (17,699) (40,975)
Phase2capital (2,428) 0 0
Sustainingcapital (2,960) (1,378) (1,342)
Wastestripping (10,785) (13,029) (12,135)
Sub-Total (17,953) (32,106) (54,452)
VATrefundrelatedtodevelopment 0 20,307 5,672
OtherInvestingActivities 12 128 90
Total InvestingActivities (17,941) (11,671) (48,690)
Financing Activity (2,929) 1,776 (2,806)
ForeignExchangeImpact (364) (141) 85
CashBalance Close 59,675 57,556 34,470
• $23mgeneratedfromoperations,cashflowimpactedbylowerrealizedgoldpriceof$112/ozinquarterpartiallyoffsetbyhigherunitsales($2.2m)
• Workingcapitalinvestmentspredominantlyininventory(bullionandstockpiles)($5.2m)
• VATbalancesof$23mvalidatedbyGhanaRevenueAuthority- $15mincrementalcashplannedwithbalanceinworkingcapital
• Phase1capitalcomplete- cashfromoperationsavailabletofundorganicgrowth
-
10
20
30
40
50
Q2 Q3 Q4
$'m
Phase1CapitalCashOutflows
10
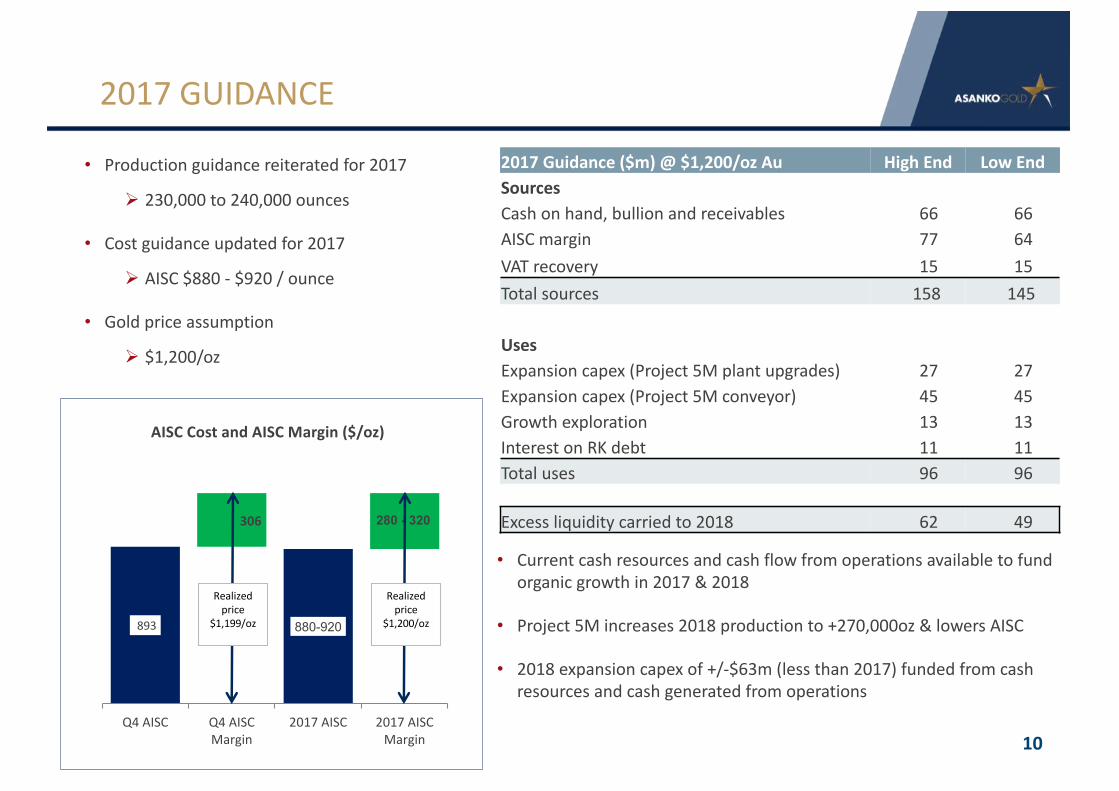
2017GUIDANCE
• Productionguidancereiteratedfor2017
Ø 230,000to240,000ounces
• Costguidanceupdatedfor2017
Ø AISC$880- $920/ounce
• Goldpriceassumption
Ø $1,200/oz
893 880-920
306 280 - 320
Q4AISC Q4AISCMargin
2017AISC 2017AISCMargin
AISCCostandAISCMargin($/oz)
Realizedprice
$1,199/oz
Realizedprice
$1,200/oz
2017Guidance($m)@ $1,200/oz Au HighEnd LowEndSourcesCashonhand,bullionandreceivables 66 66AISCmargin 77 64VATrecovery 15 15Totalsources 158 145
UsesExpansioncapex(Project5Mplantupgrades) 27 27Expansioncapex(Project5Mconveyor) 45 45Growthexploration 13 13InterestonRKdebt 11 11Totaluses 96 96
Excessliquiditycarriedto2018 62 49
• Currentcashresourcesandcashflowfromoperationsavailabletofundorganicgrowthin2017&2018
• Project5Mincreases2018productionto+270,000oz&lowersAISC
• 2018expansioncapexof+/-$63m(lessthan2017)fundedfromcashresourcesandcashgeneratedfromoperations
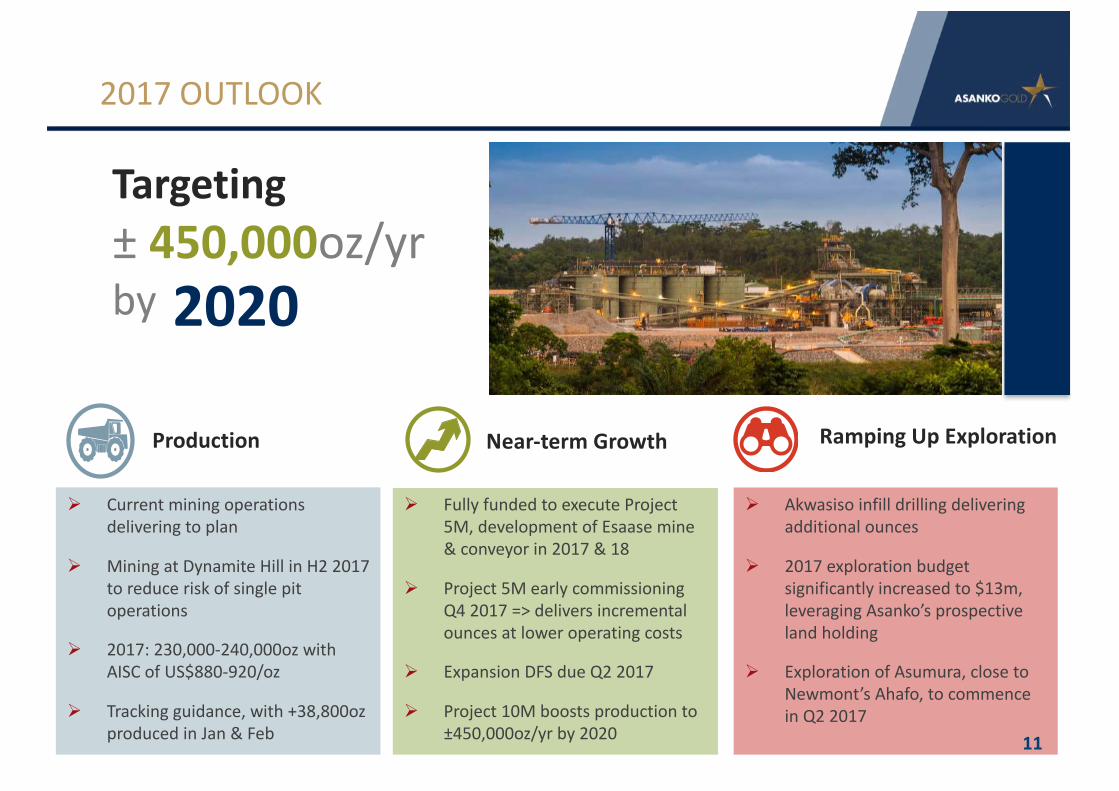
Ø Currentminingoperationsdeliveringtoplan
Ø MiningatDynamiteHillinH22017toreduceriskofsinglepitoperations
Ø 2017:230,000-240,000ozwithAISCofUS$880-920/oz
Ø Trackingguidance,with+38,800ozproducedinJan&Feb
Targeting± 450,000oz/yrby 2020
Ø Akwasiso infilldrillingdeliveringadditionalounces
Ø 2017explorationbudgetsignificantlyincreasedto$13m,leveragingAsanko’s prospectivelandholding
Ø ExplorationofAsumura,closetoNewmont’sAhafo,tocommenceinQ22017
RampingUpExplorationProduction
Ø FullyfundedtoexecuteProject5M,developmentofEsaasemine&conveyorin2017&18
Ø Project5MearlycommissioningQ42017=>deliversincrementalouncesatloweroperatingcosts
Ø ExpansionDFSdueQ22017
Ø Project10Mboostsproductionto±450,000oz/yr by2020
Near-termGrowth
2017OUTLOOK
11
APPENDIX
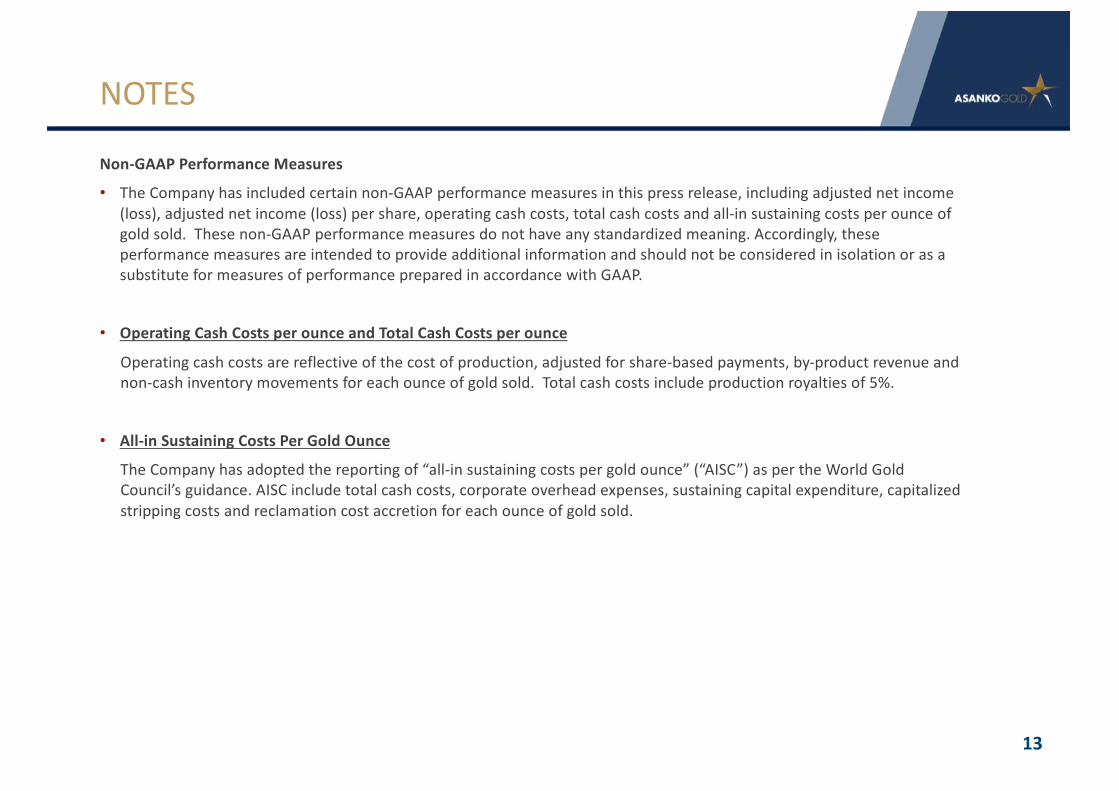
Non-GAAPPerformanceMeasures
• TheCompanyhasincludedcertainnon-GAAPperformancemeasuresinthispressrelease,includingadjustednetincome(loss),adjustednetincome(loss)pershare,operatingcashcosts,totalcashcostsandall-insustainingcostsperounceofgoldsold.Thesenon-GAAPperformancemeasuresdonothaveanystandardizedmeaning.Accordingly,theseperformancemeasuresareintendedtoprovideadditionalinformationandshouldnotbeconsideredinisolationorasasubstituteformeasuresofperformancepreparedinaccordancewithGAAP.
• OperatingCashCostsperounceandTotalCashCostsperounce
Operatingcashcostsarereflectiveofthecostofproduction,adjustedforshare-basedpayments,by-productrevenueandnon-cashinventorymovementsforeachounceofgoldsold.Totalcashcostsincludeproductionroyaltiesof5%.
• All-inSustainingCostsPerGoldOunce
TheCompanyhasadoptedthereportingof“all-insustainingcostspergoldounce”(“AISC”)aspertheWorldGoldCouncil’sguidance.AISCincludetotalcashcosts,corporateoverheadexpenses,sustainingcapitalexpenditure,capitalizedstrippingcostsandreclamationcostaccretionforeachounceofgoldsold.
13
NOTES
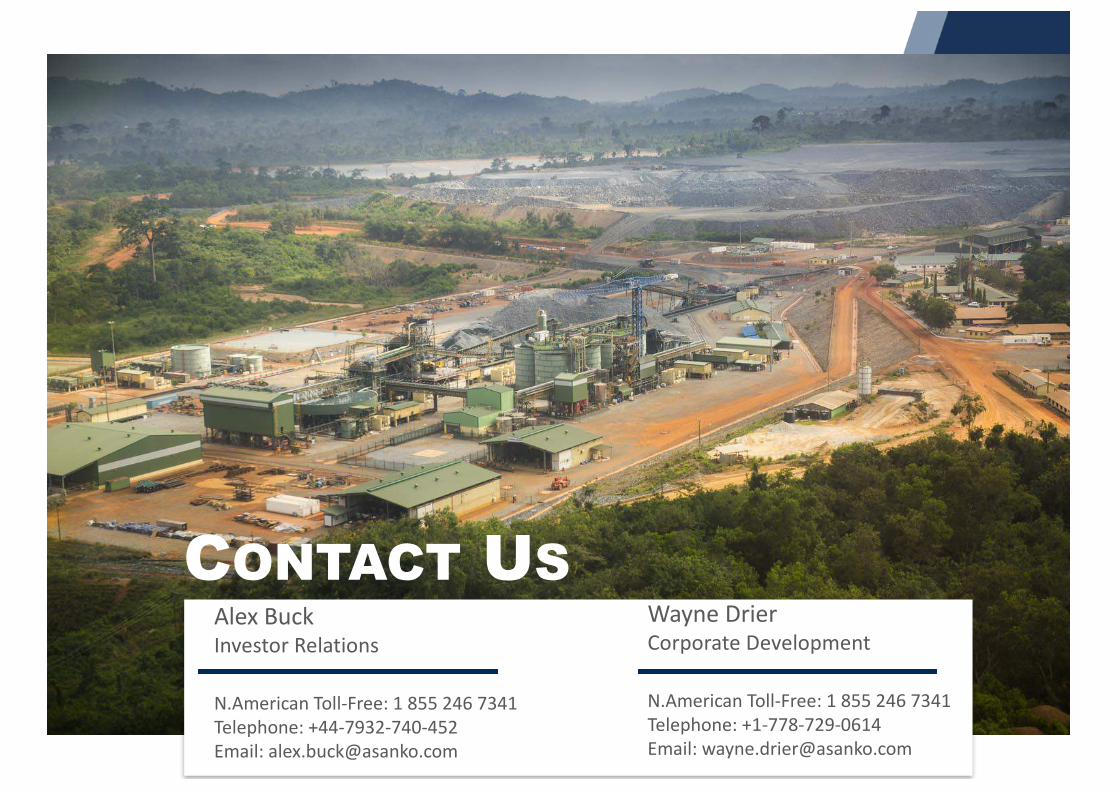
AlexBuckInvestorRelations
N.AmericanToll-Free:18552467341Telephone:+44-7932-740-452Email:[email protected]
WayneDrierCorporateDevelopment
N.AmericanToll-Free:18552467341Telephone:+1-778-729-0614Email:[email protected]
CONTACT US