Embed Size (px)
Citation preview
Corporate Presentation
January 2015
OVERVIEW01
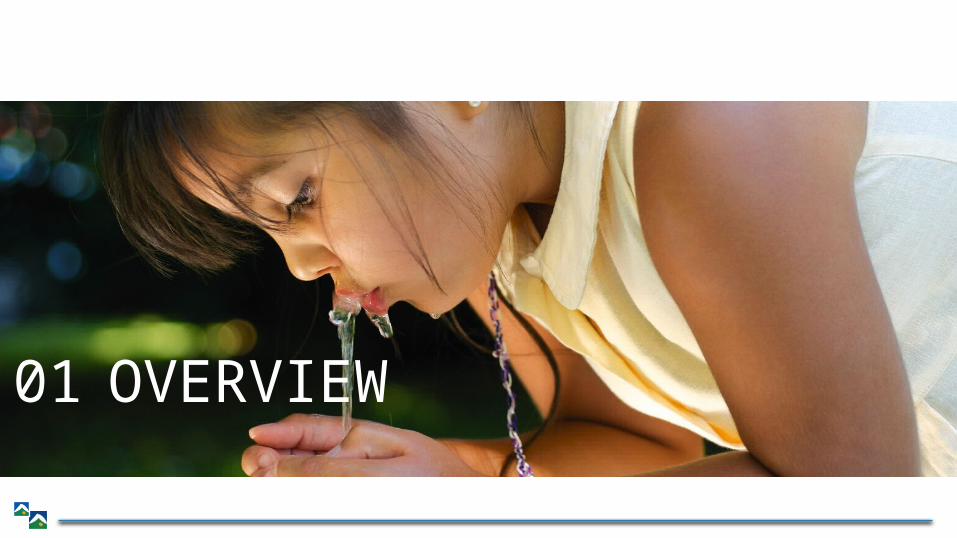
AGUAS ANDINASLargest Water Utility
(1) Annual average 2009-2013(2) Marketshare estimated according to SIIS´ Informe de Gestión 2013
5,3% annual
average1
4,7% annual
average1
Largest water utility in Chile and one of the largest in Latin America
More than 2 million clients
Natural monopoly (regulated)
Proven, stable regulatory framework
Exclusive, high-quality water resources that do not expire
Stable demand
Minimum, guaranteed return of 7%
MARKET SHARE (1)
43% of industry revenue
43% of clients in the industry
51% of billed water in the industry
FINANCIAL HIGHLIGHTS (millions of pesos)
REVENUE
EBITDA
2009 2013 41518 41883
205,6
09
247,277
174,9
80
192,8
77
2009 2013 41518 41883
327,22
5
402,624
291,19
0
317,52
2
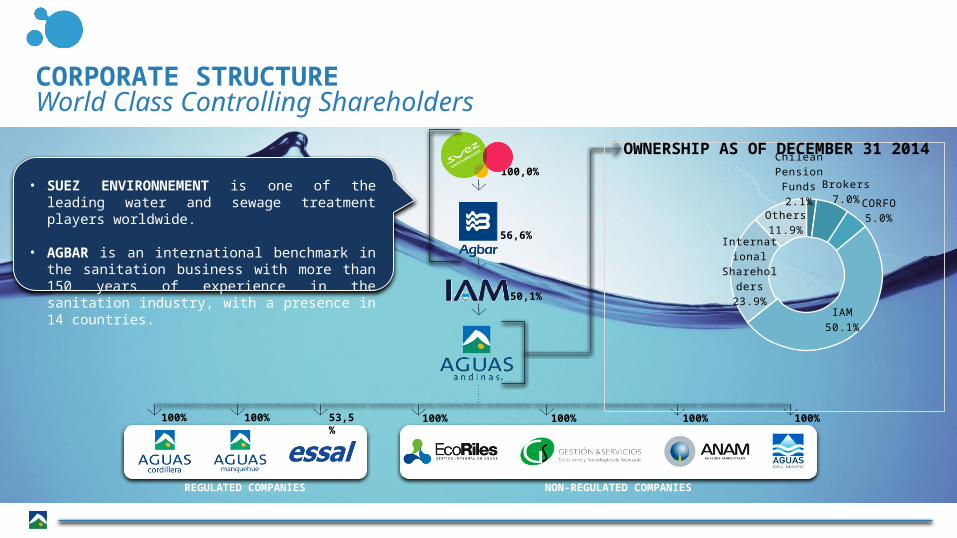
100%
50,1%
100,0%
56,6%
100% 100%53,5% 100%100% 100%
REGULATED COMPANIES NON-REGULATED COMPANIES
CORPORATE STRUCTUREWorld Class Controlling Shareholders
Chilean Pension Funds2.1%
Brokers7.0%
CORFO5.0%
IAM50.1%
International Shareholders
23.9%
Others11.9%
OWNERSHIP AS OF DECEMBER 31 2014
• SUEZ ENVIRONNEMENT is one of the leading water and sewage treatment players worldwide.
• AGBAR is an international benchmark in the sanitation business with more than 150 years of experience in the sanitation industry, with a presence in 14 countries.
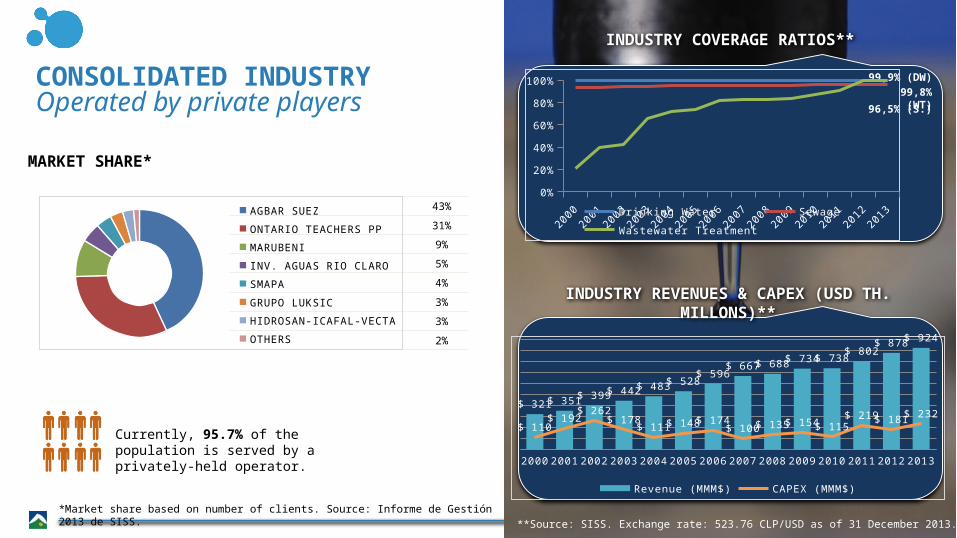
96,5% (S.)
INDUSTRY COVERAGE RATIOS**
INDUSTRY REVENUES & CAPEX (USD TH. MILLONS)**
99,8% (WT)99,9% (DW)
MARKET SHARE*
43%
31%
9%
5%
4%
3%
3%
2%
CONSOLIDATED INDUSTRYOperated by private players
AGBAR SUEZ
ONTARIO TEACHERS PP
MARUBENI
INV. AGUAS RIO CLARO
SMAPA
GRUPO LUKSIC
HIDROSAN-ICAFAL-VECTA
OTHERS
Currently, 95.7% of the population is served by a privately-held operator.
200020012002200320042005200620072008200920102011201220130%
20%
40%
60%
80%
100%
Drinking Water SewageWastewater Treatment
*Market share based on number of clients. Source: Informe de Gestión 2013 de SISS.**Source: SISS. Exchange rate: 523.76 CLP/USD as of 31 December 2013.
2000 2001 2002 2003 2004 2005 2006 2007 2008 2009 2010 2011 2012 2013
$ 321 $ 351 $ 399 $ 442 $ 483 $ 528$ 596
$ 667 $ 688 $ 734 $ 738$ 802
$ 878 $ 924
$ 110$ 192
$ 262$ 178
$ 111 $ 148 $ 174$ 100 $ 135 $ 154 $ 115
$ 219 $ 181 $ 232
Revenue (MMM$) CAPEX (MMM$)
CHALLENGES FOR AGUAS ANDINAS02
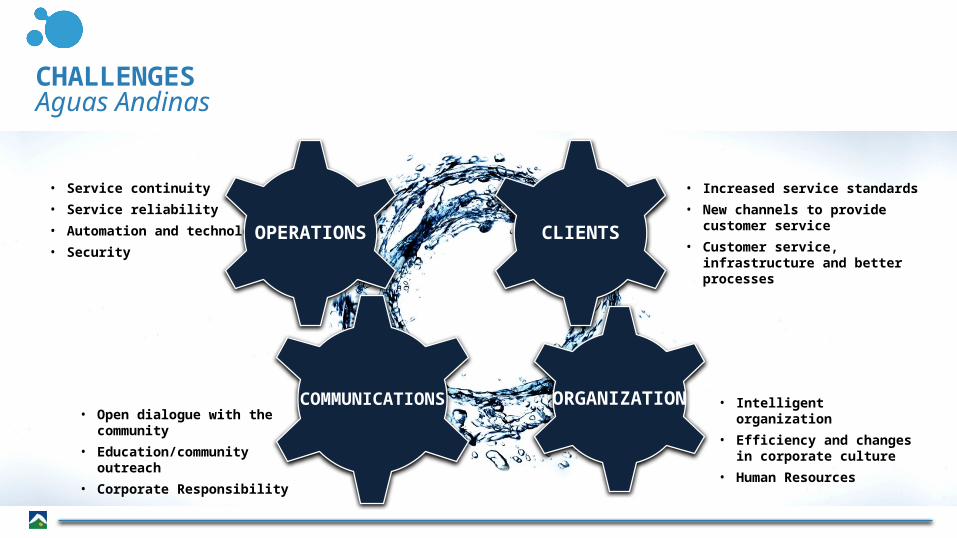
CHALLENGESAguas Andinas
• Service continuity
• Service reliability
• Automation and technology
• Security
• Increased service standards
• New channels to provide customer service
• Customer service, infrastructure and better processes
• Open dialogue with the community
• Education/community outreach
• Corporate Responsibility
• Intelligent organization
• Efficiency and changes in corporate culture
• Human Resources
COMMUNICATIONS
CLIENTSOPERATIONS
ORGANIZATION
Source: Aguas Andinas* USD/CLP=570 UF/CLP=23.500
SERVICE CONTINUITYIncrease Reserves of Drinking Water
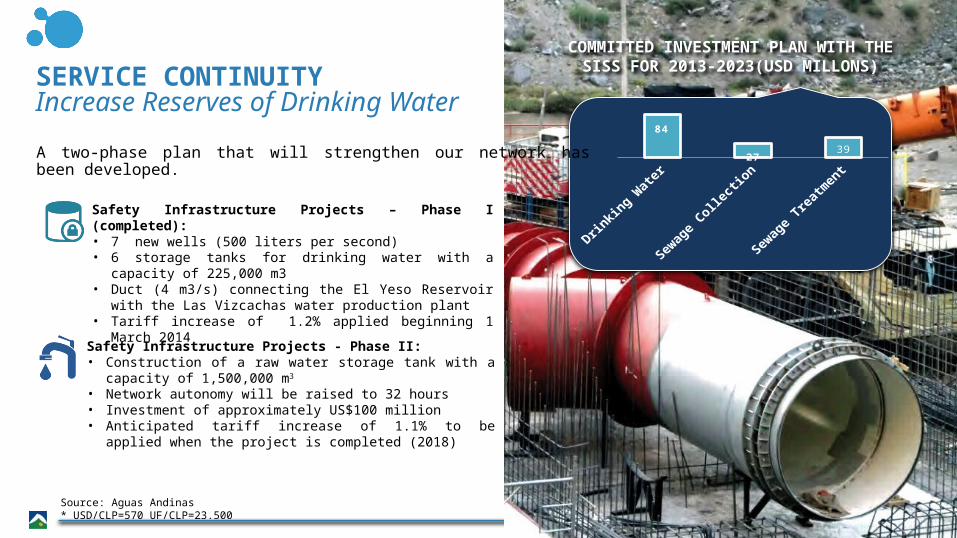
COMMITTED INVESTMENT PLAN WITH THE SISS FOR 2013-2023(USD MILLONS)
A two-phase plan that will strengthen our network has been developed.
Safety Infrastructure Projects – Phase I (completed):• 7 new wells (500 liters per second)• 6 storage tanks for drinking water with a capacity of 225,000 m3• Duct (4 m3/s) connecting the El Yeso Reservoir with the Las Vizcachas
water production plant• Tariff increase of 1.2% applied beginning 1 March 2014
Safety Infrastructure Projects - Phase II:• Construction of a raw water storage tank with a capacity of 1,500,000
m3
• Network autonomy will be raised to 32 hours• Investment of approximately US$100 million• Anticipated tariff increase of 1.1% to be applied when the project is
completed (2018)
Drinkin
g Wate
r
Sewag
e Collecti
on
Sewag
e Treatm
ent
84
2739
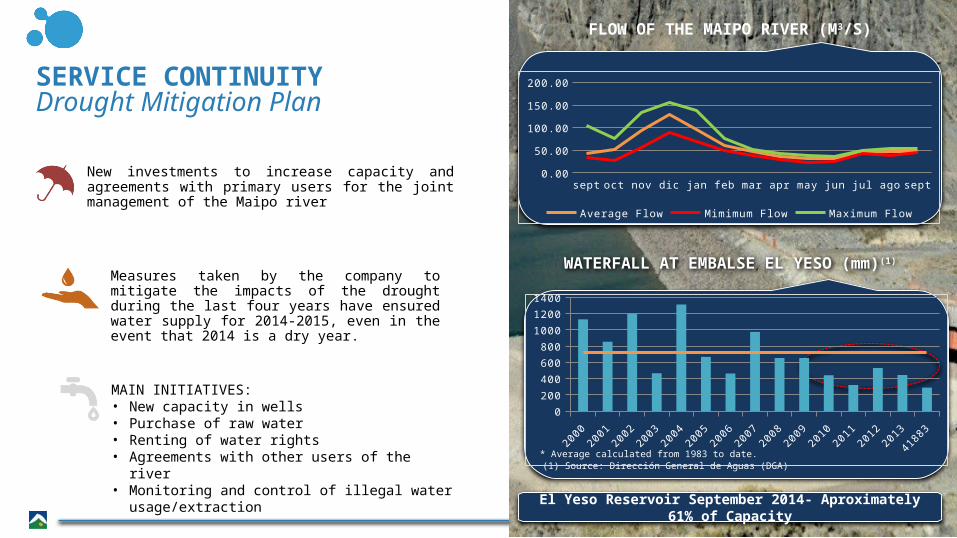
FLOW OF THE MAIPO RIVER (M3/S)
WATERFALL AT EMBALSE EL YESO (mm)(1)
SERVICE CONTINUITYDrought Mitigation Plan
Measures taken by the company to mitigate the impacts of the drought during the last four years have ensured water supply for 2014-2015, even in the event that 2014 is a dry year.
New investments to increase capacity and agreements with primary users for the joint management of the Maipo river
MAIN INITIATIVES:• New capacity in wells• Purchase of raw water• Renting of water rights• Agreements with other users of the river• Monitoring and control of illegal water usage/extraction
* Average calculated from 1983 to date. (1) Source: Dirección General de Aguas (DGA)
El Yeso Reservoir September 2014- Aproximately 61% of Capacity
sept oct nov dic jan feb mar apr may jun jul ago sept0.00
20.0040.0060.0080.00
100.00120.00140.00160.00180.00
Average Flow Mimimum Flow Maximum Flow
20002001
20022003
20042005
20062007
20082009
20102011
20122013
41883
0
200
400
600
800
1000
1200
1400
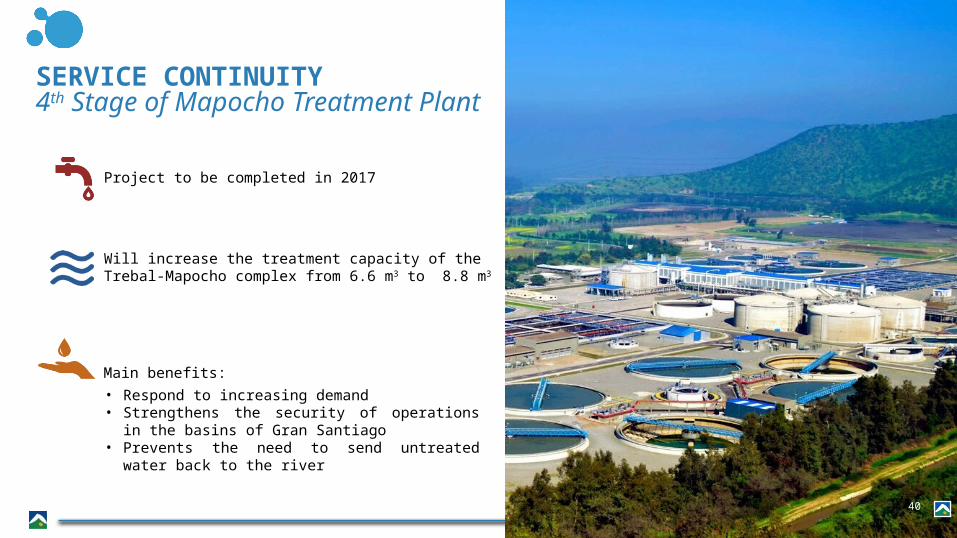
• Respond to increasing demand• Strengthens the security of operations in the basins of Gran
Santiago• Prevents the need to send untreated water back to the
river
Main benefits:
Will increase the treatment capacity of the Trebal-Mapocho complex from 6.6 m3 to 8.8 m3
Project to be completed in 2017
40
SERVICE CONTINUITY4th Stage of Mapocho Treatment Plant
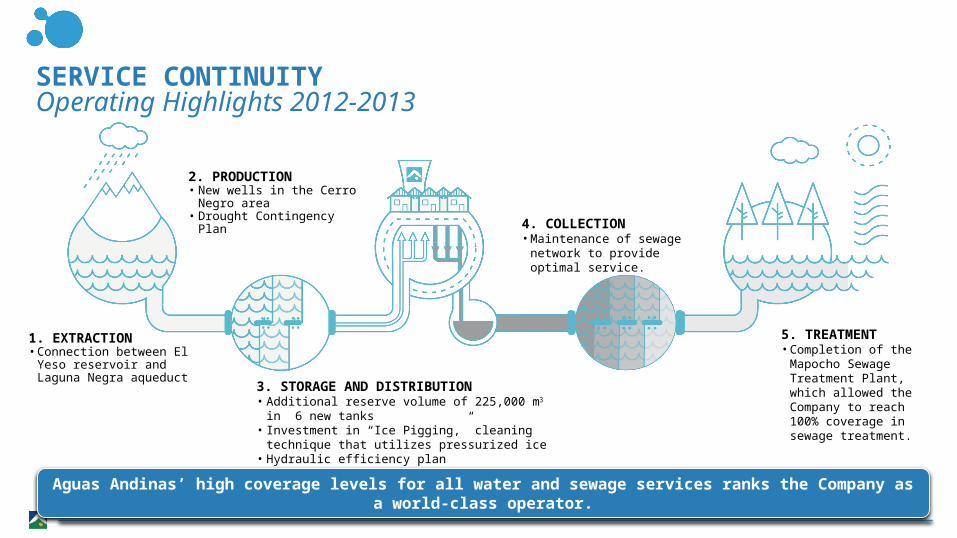
Aguas Andinas’ high coverage levels for all water and sewage services ranks the Company as a world-class operator.
SERVICE CONTINUITYOperating Highlights 2012-2013
5. TREATMENT• Completion of the Mapocho
Sewage Treatment Plant, which allowed the Company to reach 100% coverage in sewage treatment.
2. PRODUCTION• New wells in the Cerro Negro area• Drought Contingency Plan
3. STORAGE AND DISTRIBUTION• Additional reserve volume of 225,000 m3 in 6 new tanks • Investment in “Ice Pigging,” cleaning technique that utilizes
pressurized ice• Hydraulic efficiency plan
4. COLLECTION• Maintenance of sewage
network to provide optimal service.
1. EXTRACTION• Connection between El Yeso
reservoir and Laguna Negra aqueduct
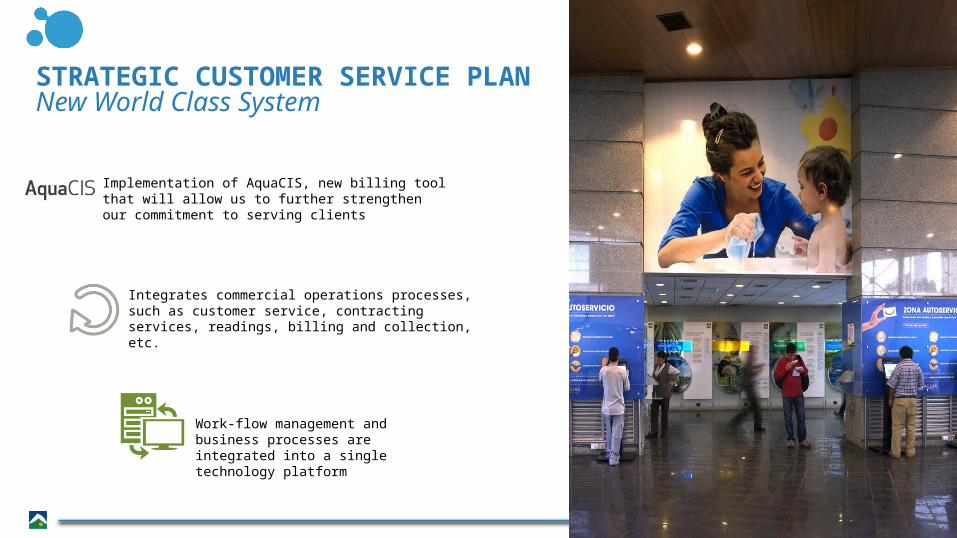
STRATEGIC CUSTOMER SERVICE PLANNew World Class System
Implementation of AquaCIS, new billing tool that will allow us to further strengthen our commitment to serving clients
Integrates commercial operations processes, such as customer service, contracting services, readings, billing and collection, etc.
Work-flow management and business processes are integrated into a single technology platform
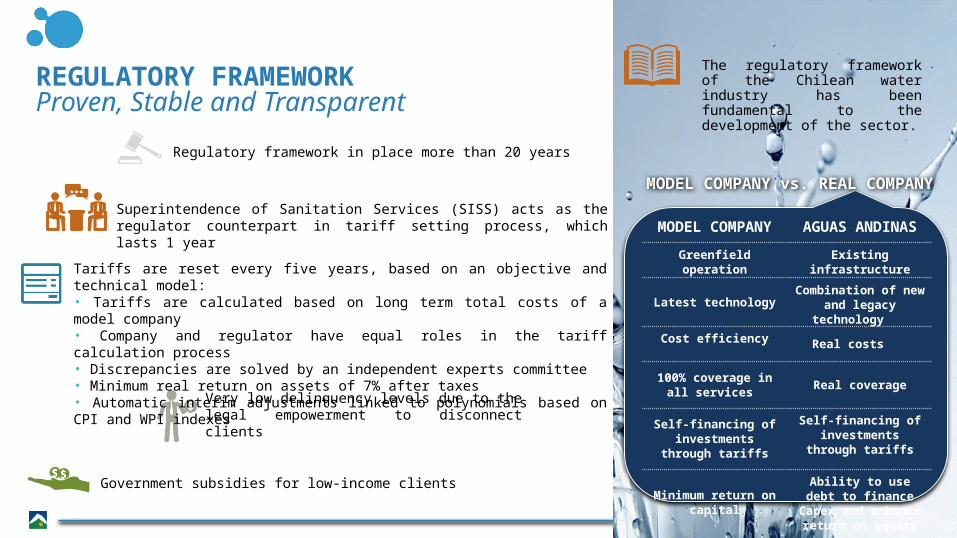
REGULATORY FRAMEWORKProven, Stable and Transparent
The regulatory framework of the Chilean water industry has been fundamental to the development of the sector.
Government subsidies for low-income clients
MODEL COMPANY vs. REAL COMPANY
MODEL COMPANY AGUAS ANDINAS
Greenfield operation Existing infrastructure
Latest technology Combination of new and legacy technology
Cost efficiency Real costs
100% coverage in all services Real coverage
Self-financing of investments through tariffs
Self-financing of investments through tariffs
Minimum return on capitalAbility to use debt to
finance Capex and enhance return on equity
Regulatory framework in place more than 20 years
Superintendence of Sanitation Services (SISS) acts as the regulator counterpart in tariff setting process, which lasts 1 year
Tariffs are reset every five years, based on an objective and technical model:• Tariffs are calculated based on long term total costs of a model company• Company and regulator have equal roles in the tariff calculation process• Discrepancies are solved by an independent experts committee• Minimum real return on assets of 7% after taxes• Automatic interim adjustments linked to polynomials based on CPI and WPI indexes
Very low delinquency levels due to the legal empowerment to disconnect clients
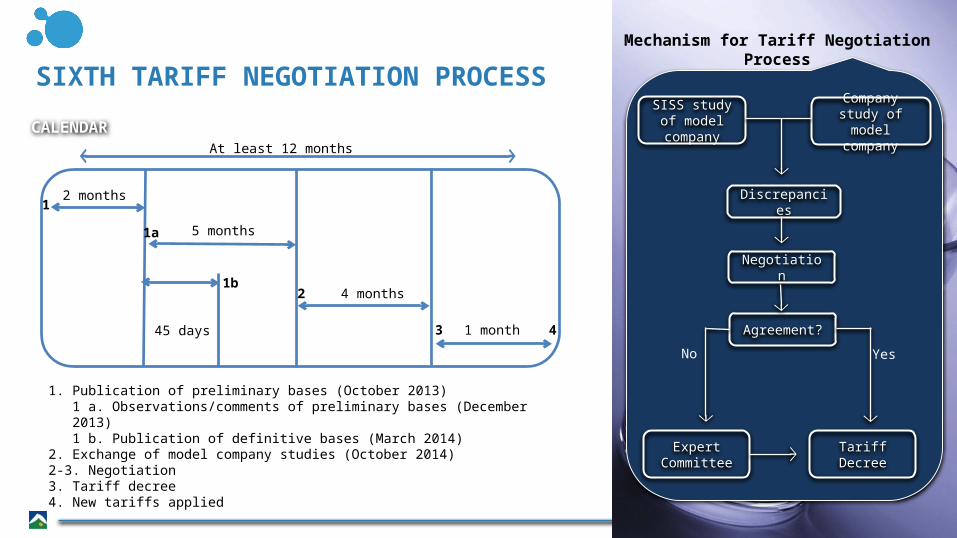
CALENDAR
SIXTH TARIFF NEGOTIATION PROCESSMechanism for Tariff Negotiation Process
SISS study of model
company
Company study of model company
Discrepancies
Negotiation
Agreement?
Expert Committee Tariff Decree
No Yes
At least 12 months
1. Publication of preliminary bases (October 2013)1 a. Observations/comments of preliminary bases (December 2013)1 b. Publication of definitive bases (March 2014)
2. Exchange of model company studies (October 2014)2-3. Negotiation3. Tariff decree4. New tariffs applied
2
2 months
5 months
1
1a
1b2
3 41 month45 days
4 months
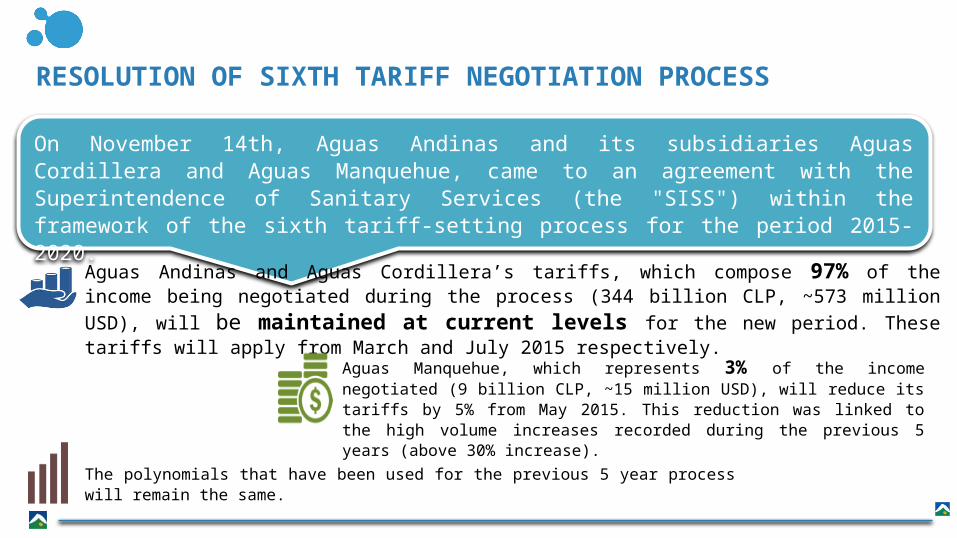
On November 14th, Aguas Andinas and its subsidiaries Aguas Cordillera and Aguas Manquehue, came to an agreement with the Superintendence of Sanitary Services (the "SISS") within the framework of the sixth tariff-setting process for the period 2015-2020.
Aguas Andinas and Aguas Cordillera’s tariffs, which compose 97% of the income being negotiated during the process (344 billion CLP, ~573 million USD), will be maintained at current levels for the new period. These tariffs will apply from March and July 2015 respectively.
Aguas Manquehue, which represents 3% of the income negotiated (9 billion CLP, ~15 million USD), will reduce its tariffs by 5% from May 2015. This reduction was linked to the high volume increases recorded during the previous 5 years (above 30% increase).
The polynomials that have been used for the previous 5 year process will remain the same.
RESOLUTION OF SIXTH TARIFF NEGOTIATION PROCESS
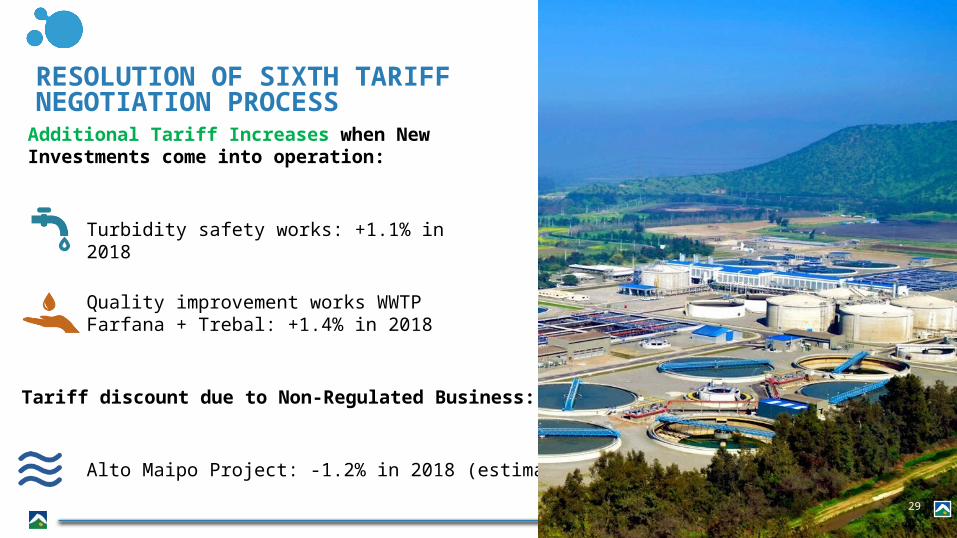
Additional Tariff Increases when New Investments come into operation:
Turbidity safety works: +1.1% in 2018
Quality improvement works WWTP Farfana + Trebal: +1.4% in 2018
Tariff discount due to Non-Regulated Business:
Alto Maipo Project: -1.2% in 2018 (estimated)
29
RESOLUTION OF SIXTH TARIFF NEGOTIATION PROCESS
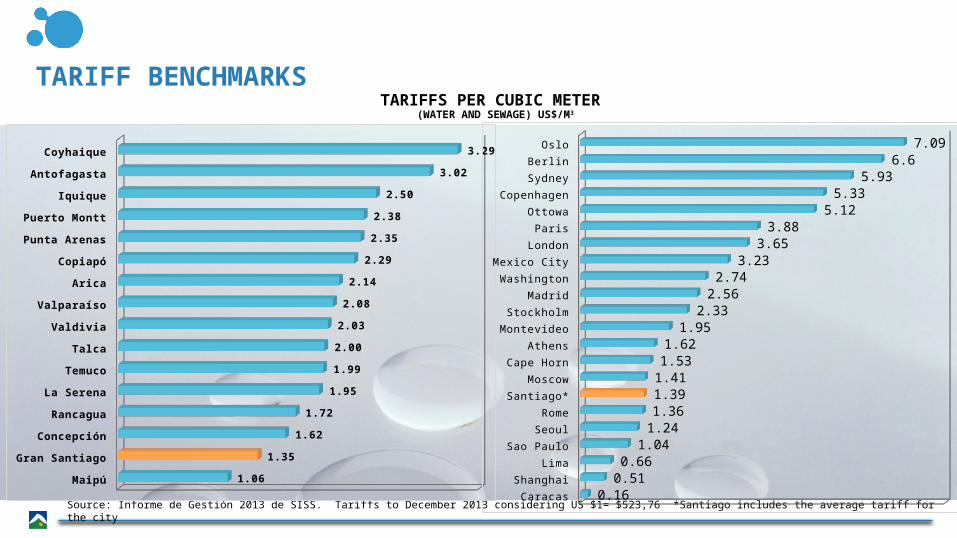
Source: Informe de Gestión 2013 de SISS. Tariffs to December 2013 considering US $1= $523,76 *Santiago includes the average tariff for the city
TARIFF BENCHMARKS
Maipú
Gran Santiago
Concepción
Rancagua
La Serena
Temuco
Talca
Valdivia
Valparaíso
Arica
Copiapó
Punta Arenas
Puerto Montt
Iquique
Antofagasta
Coyhaique
1.06
1.35
1.62
1.72
1.95
1.99
2.00
2.03
2.08
2.14
2.29
2.35
2.38
2.50
3.02
3.29
TARIFFS PER CUBIC METER (WATER AND SEWAGE) US$/M3
Caracas
Shanghai
Lima
Sao Paulo
Seoul
Rome
Santiago*
Moscow
Cape Horn
Athens
Montevideo
Stockholm
Madrid
Washington
Mexico City
London
Paris
Ottowa
Copenhagen
Sydney
Berlin
Oslo
0.160.51
0.661.04
1.241.361.391.411.531.62
1.952.33
2.562.74
3.233.65
3.885.12
5.335.93
6.67.09
AGUAS ANDINAS CHILEAN INDUSTRY AVERAGE
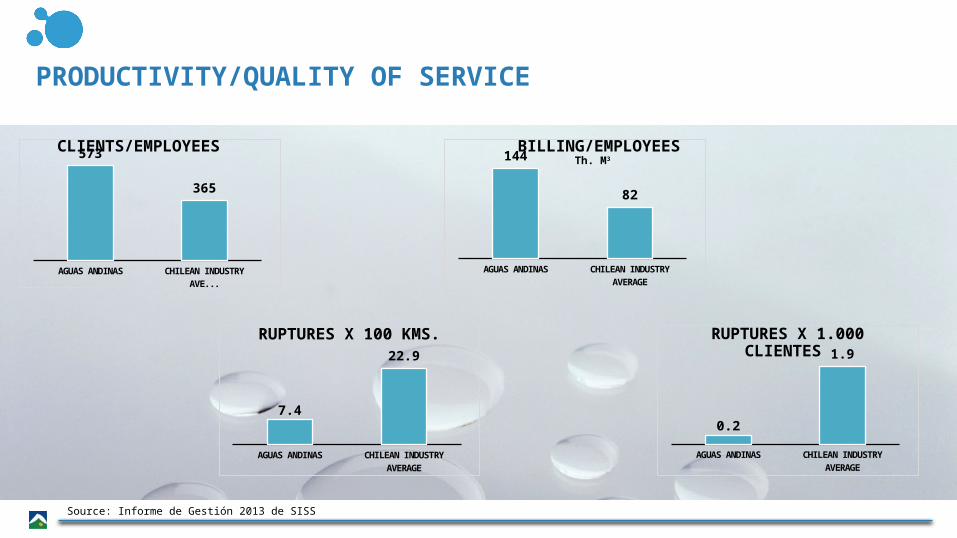
573
365
AGUAS ANDINAS CHILEAN INDUSTRY AVERAGE
144
82
CLIENTS/EMPLOYEES BILLING/EMPLOYEESTh. M3
AGUAS ANDINAS CHILEAN INDUSTRY AVERAGE
7.4
22.9
RUPTURES X 100 KMS.
AGUAS ANDINAS CHILEAN INDUSTRY AVERAGE
0.2
1.9RUPTURES X 1.000 CLIENTES
Source: Informe de Gestión 2013 de SISS
PRODUCTIVITY/QUALITY OF SERVICE
FINANCIAL PERFORMANCE03
Source: Aguas Andinas
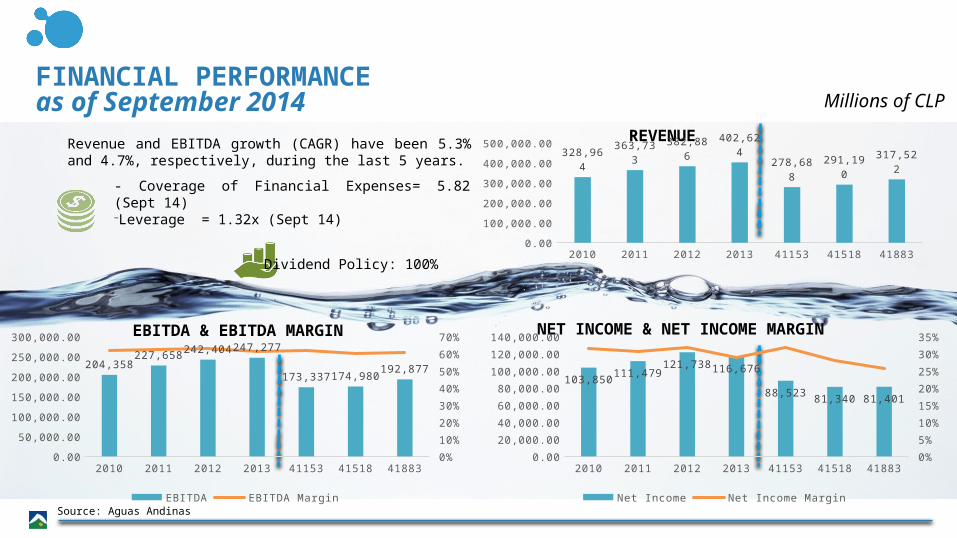
Millions of CLPFINANCIAL PERFORMANCEas of September 2014
REVENUE
EBITDA & EBITDA MARGIN NET INCOME & NET INCOME MARGIN
Revenue and EBITDA growth (CAGR) have been 5.3% and 4.7%, respectively, during the last 5 years.
Dividend Policy: 100%
- Coverage of Financial Expenses= 5.82 (Sept 14)-Leverage = 1.32x (Sept 14)
2010 2011 2012 2013 41153 41518 418830.00
50,000.00100,000.00150,000.00200,000.00250,000.00300,000.00350,000.00400,000.00450,000.00
328,964363,733 382,886 402,624
278,688 291,190 317,522
2010 2011 2012 2013 41153 41518 418830.00
50,000.00
100,000.00
150,000.00
200,000.00
250,000.00
300,000.00
0%
10%
20%
30%
40%
50%
60%
70%
204,358227,658 242,404 247,277
173,337 174,980192,877
EBITDA EBITDA Margin
2010 2011 2012 2013 41153 41518 418830.00
20,000.00
40,000.00
60,000.00
80,000.00
100,000.00
120,000.00
140,000.00
0%
5%
10%
15%
20%
25%
30%
35%
103,850111,479
121,738 116,676
88,52381,340 81,401
Net Income Net Income Margin
Pasivos Financieros
Source: Aguas Andinas
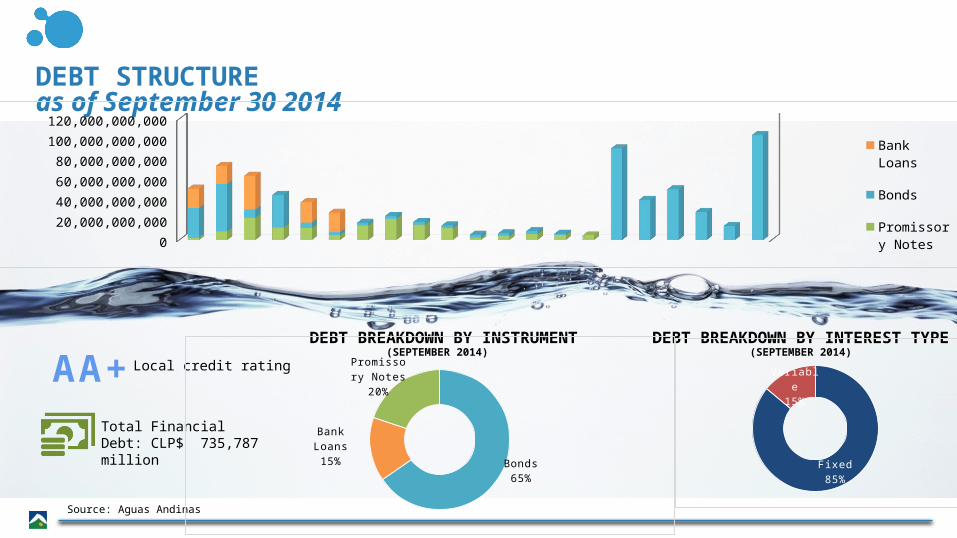
DEBT STRUCTUREas of September 30 2014
DEBT BREAKDOWN BY INSTRUMENT(SEPTEMBER 2014)
DEBT BREAKDOWN BY INTEREST TYPE(SEPTEMBER 2014)
Total Financial Debt: CLP$ 735,787 million
Local credit ratingAA+
2015 2016 2017 2018 2019 2020 2021 2022 2023 2024 2025 2026 2027 2028 2029 2031 2032 2033 2034 2035 20370
20,000,000,000
40,000,000,000
60,000,000,000
80,000,000,000
100,000,000,000
120,000,000,000
Bank Loans
Bonds
Promissory Notes
Bonds65%
Bank Loans15%
Promissory Notes20%
Fixed85%
Variable15%