Embed Size (px)
Citation preview

The AES Corporation First Quarter 2016 Financial Review May 9, 2016

2 Contains Forward-Looking Statements
Safe Harbor Disclosure
Certain statements in the following presentation regarding AES’ business operations may constitute “forward-looking statements.” Such forward-looking statements include, but are not limited to, those related to future earnings growth and financial and operating performance. Forward-looking statements are not intended to be a guarantee of future results, but instead constitute AES’ current expectations based on reasonable assumptions. Forecasted financial information is based on certain material assumptions. These assumptions include, but are not limited to, accurate projections of future interest rates, commodity prices and foreign currency pricing, continued normal or better levels of operating performance and electricity demand at our distribution companies and operational performance at our generation businesses consistent with historical levels, as well as achievements of planned productivity improvements and incremental growth from investments at investment levels and rates of return consistent with prior experience. For additional assumptions see Slide 49 and the Appendix to this presentation. Actual results could differ materially from those projected in our forward-looking statements due to risks, uncertainties and other factors. Important factors that could affect actual results are discussed in AES’ filings with the Securities and Exchange Commission including but not limited to the risks discussed under Item 1A “Risk Factors” and Item 7: “Management’s Discussion & Analysis” in AES’ 2015 Annual Report on Form 10-K, as well as our other SEC filings. AES undertakes no obligation to update or revise any forward-looking statements, whether as a result of new information, future events or otherwise.

3 Contains Forward-Looking Statements
Q1 2016 Earnings Call: Key Takeaways
l Resolved outstanding receivables at Maritza in Bulgaria
l On track to achieve our three-year $150 million cost reduction program
l Saw improvements in our credit ratings and outlook by ratings agencies
l Our $7.5 billion construction program is advancing on schedule and will be the major contributor to our cash and earnings growth over the next three years
l Continued to leverage our platforms, by advancing projects with long-term, U.S. Dollar-denominated contracts, which will contribute to our growth beyond 2018 � Total capex of ~$3.7 billion and AES equity of ~$810 million

4 Contains Forward-Looking Statements
$ in Millions, Except Per Share Amounts
1. A non-GAAP financial measure. See Appendix for definition and reconciliation.
Q1 2016 Results
Q1 2016 Q1 2015 FY 2016 Guidance
% of 2016 Guidance Midpoint
Proportional Free Cash Flow1 $253 $265 $1,000-$1,350 22%
Consolidated Net Cash Provided by Operating Activities $640 $437 $2,000-$2,900 26%
Adjusted EPS1 $0.13 $0.25 $0.95-$1.05 13%
l Proportional Free Cash Flow1 in line with 2015
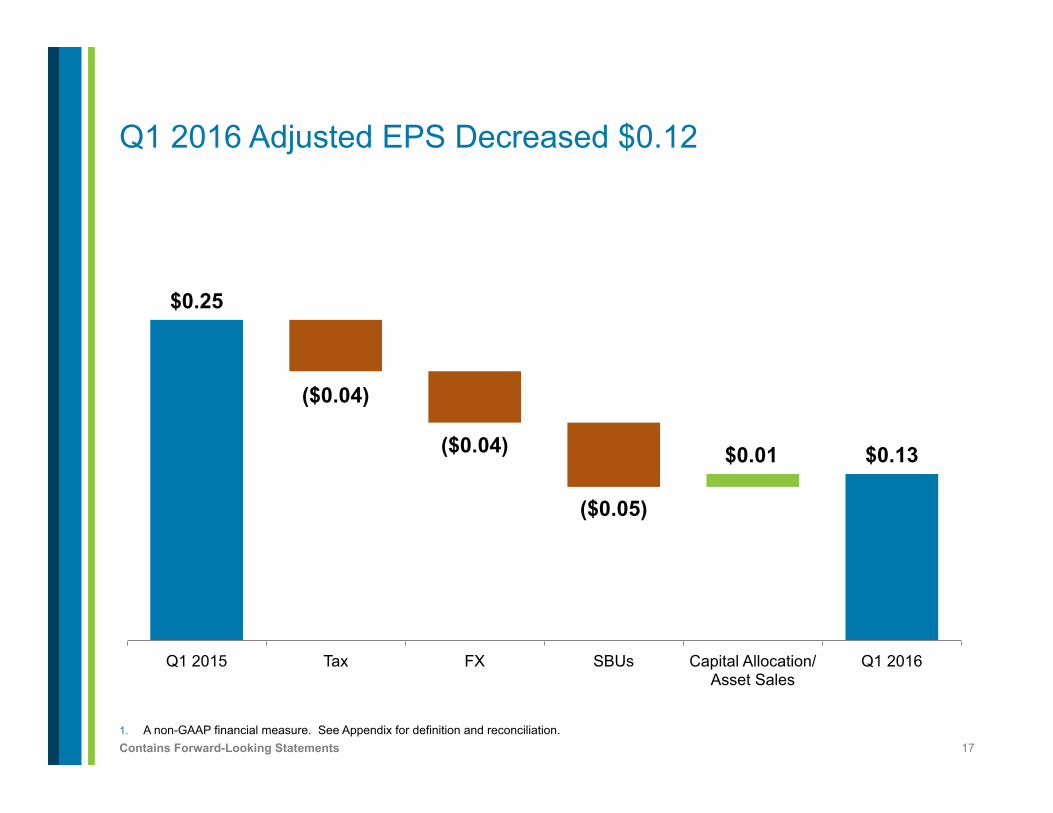
l Adjusted EPS1 reflects:
� Devaluation in foreign currencies
� Lower power prices in the United States and the expiration of Tietê’s PPA
� A higher quarterly tax rate of 50%, which we expect to recover during the year, to a full year rate of 31% to 33%

5 Contains Forward-Looking Statements
l Received full payment of $350 million for outstanding receivables from our offtaker, NEK
l Majority of proceeds will be used to pay the local mine that supplies Maritza and repay the lenders of the plant’s non-recourse debt
l Maritza is providing critical power to the Bulgarian electric grid and we have been collecting in a timely manner since December 2015
Business Update
690 MW Maritza in Bulgaria

6 Contains Forward-Looking Statements
$ in Millions
1. Cost reductions reflected in General and Administrative Expense (G&A), as well as Cost of Sales. Some of the previously reported 2012 and 2013 G&A Expense related to administrative costs at our SBUs has been reclassified to Cost of Sales.
$90 $200
$53
$57
$50
$100
$150
2012 2013 2014 2016 Estimate 2017-2018 Estimate
Total
Performance Excellence
Already Achieved $200 Reduction in Global Overhead1; On Track for $150 Cost Savings & Revenue Enhancement Initiative
$350
7 Contains Forward-Looking Statements
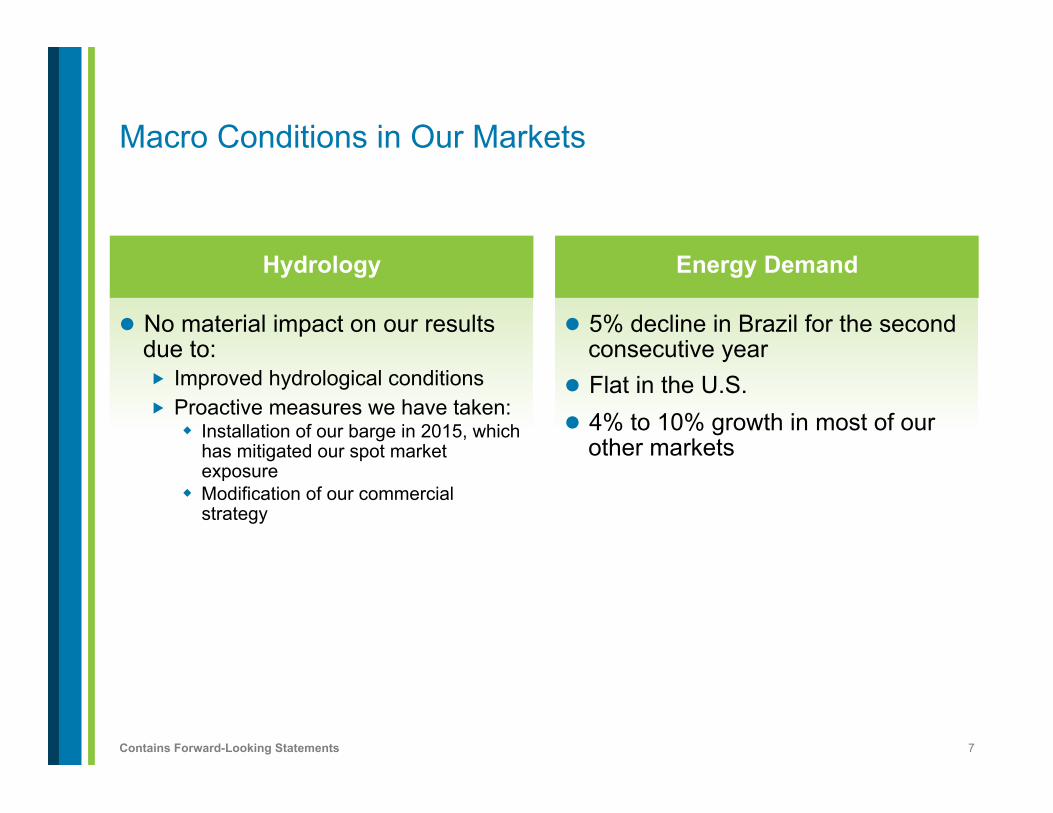
Macro Conditions in Our Markets
Energy Demand
l 5% decline in Brazil for the second consecutive year
l Flat in the U.S. l 4% to 10% growth in most of our
other markets
Hydrology
l No material impact on our results due to: � Improved hydrological conditions � Proactive measures we have taken:
w Installation of our barge in 2015, which has mitigated our spot market exposure
w Modification of our commercial strategy

8 Contains Forward-Looking Statements
Pursuing Disciplined Growth Projects
l Leveraging our advantaged platforms
l Focused on projects with: � Long-term contracts � U.S. Dollar-denominated revenues
l Significant opportunity to play a leading role in the broad distribution of LNG in Central America and the Caribbean

9 Contains Forward-Looking Statements
Construction Project: Masinloc 2 in the Philippines
335 MW Expansion l Broke ground Q1 2016, with
operations in 1H 2019
l Will benefit from robust electricity demand growth in the Philippines
l First super critical plant will be one of the most flexible, efficient and low-cost plants in the Philippines
l $740 million total project cost to be funded with debt capacity and free cash flow generated at Masinloc 1 � Equity contribution of $110
million to be funded from cash flow from Masinloc 1

10 Contains Forward-Looking Statements
Advanced Stage Development Project: Colon in Panama
380 MW CCGT and 180,000 m3 LNG Storage Tank and Regasification Facility
l Building Panama’s first natural gas-fired generation plant
l Power plant contracted under a 10-year, U.S. Dollar-denominated PPA
l Strategically located on the Panama Canal � Allows for LNG capacity to be
used for bunkering vessels with LNG or distributing to neighboring countries
l Expect to break ground in Q2 2016, with operations of the CCGT in 2018 and the LNG facility in 2019
l Expected total project cost of ~$1 billion and AES equity of ~$200 million

11 Contains Forward-Looking Statements
1,384 MW Under 20-Year Power Purchase Agreements
Advanced Stage Development Project: Southland Repowering
1,384 MW Under 20-Year Power Purchase Agreements
l 1,284 MW of combined cycle natural gas and 100 MW of battery-based energy storage capacity
l Recently signed turbine supply agreements and EPC contracts for the CCGT
l Expect to break ground in 2017, with operations in 2020 and 2021
l Expected total project cost of ~$2 billion and ~$500 million of equity from AES and potentially a partner

12 Contains Forward-Looking Statements
World Leader in Battery-Based Energy Storage 1,384 MW Under 20-Year Power Purchase Agreements 394 MW in Operation, Construction or Late Stage Development
l 116 MW in operation
l 50 MW under construction and coming on-line in 2016
l 228 MW in advanced stage development
l Growth through two paths: � AES-owned projects
� Sales by AES and our channel partners to utilities and other customers

13 Contains Forward-Looking Statements
1. Based on contributions from all projects under construction and IPL MATS and wastewater upgrades, from 2020-2023, once all projects under construction are completed.
Note: These are some of our construction projects. Other projects not currently on this slide, whether developed through acquisitions or otherwise, may be brought on-line before these projects. In addition, some of these examples may not close or be completed as anticipated, or they may be delayed or subject to additional funding requirements, including AES equity, due to uncertainty inherent in the development process.
35%
39%
26%
Leveraging Our Platforms: 5,945 MW Currently Under Construction Yield ~15% Return on Equity1
74% of Required Equity is for Projects at IPL (US) & Gener (Chile)
US
Chile
Asia
$7.5 Billion Total Cost; AES Equity Commitment of $1.3 Billion, of Which Only $160 Million is Still to be Funded

14 Contains Forward-Looking Statements
$ in Millions
1. A non-GAAP financial measure. See Appendix for definition.
Proportional Free Cash Flow1 Growth Drivers
Largely Funded Construction Program Drives Growth in Proportional Free Cash Flow1
$1,241 $1,000-$1,350
≥10% Average Annual Growth
2015 Actual 2016 Guidance 2017-2018 Expectations

15 Contains Forward-Looking Statements
$ in Millions
1. A non-GAAP financial measure. See Appendix for definition.
Adjusted EPS1 Growth Drivers
2017-2018: Expect High End of 12%-16% Average Annual Growth Range
$1.22 $0.95-$1.05
12%-16% Average Annual Growth
2015 Actual 2016 Guidance 2017-2018 Expectations
5% Existing Businesses
8%-10% New Construction

16 Contains Forward-Looking Statements 1. A non-GAAP financial measure. See Appendix for definition and reconciliation.
Q1 2016 Financial Review
l Q1 2016 results � Adjusted EPS1
� Proportional Free Cash Flow and Adjusted PTC1 by Strategic Business Unit (SBU)
l 2016 Parent capital allocation plan
l 2016 Guidance
17 Contains Forward-Looking Statements 1. A non-GAAP financial measure. See Appendix for definition and reconciliation.
Q1 2016 Adjusted EPS Decreased $0.12
$0.25
$0.13
($0.04)
($0.04)
($0.05)
$0.01
Q1 2015 Tax FX SBUs Capital Allocation/Asset Sales
Q1 2016

18 Contains Forward-Looking Statements
Q1 Financial Results $ in Millions
1. A non-GAAP financial measure. See Appendix for definition and reconciliation.
l Lower Proportional Free Cash Flow1 reflects: � Lower margins: US, Brazil and
Europe SBUs � Offset by higher collections in Brazil
and US, as well as lower working capital requirements in Asia
l Lower Adjusted PTC1 is primarily driven by lower margins
Proportional Free Cash Flow1 Decreased $12
$265 $253
Q1 2015 Q1 2016
Adjusted PTC1 Decreased $80
$252 $172
Q1 2015 Q1 2016

19 Contains Forward-Looking Statements
Q1 Financial Results: US SBU $ in Millions
1. A non-GAAP financial measure. See Appendix for definition and reconciliation.
l Lower Proportional Free Cash Flow1 reflects: � Lower margins:
- Lower wholesale prices and contributions from regulated retail at DPL
- Lower retail margins driven by unfavorable weather and the impact of the partial sell-down at IPL
- Sale of Armenia Mountain in 2015 � Unfavorable timing of accounts
payable at IPL, partially offset by higher collections at DPL
Proportional Free Cash Flow1 Decreased $22
$155 $133
Q1 2015 Q1 2016
Adjusted PTC1 Decreased $21
$106 $85
Q1 2015 Q1 2016

20 Contains Forward-Looking Statements
Q1 Financial Results: Andes SBU $ in Millions
1. A non-GAAP financial measure. See Appendix for definition and reconciliation.
l Lower Proportional Free Cash Flow1 reflects: � Lower margins:
- 40% devaluation of the Argentine Peso - 24% devaluation of the Colombian
Peso - Lower volumes at Chivor in Colombia + Lower spot prices for energy and coal
purchases and lower fixed costs at Gener in Chile
� Higher tax payments in Chile, partially offset by higher collections at Chivor in Colombia
l Lower Adjusted PTC1 also reflects: � Lower equity in earnings at
Guacolda in Chile
Proportional Free Cash Flow1 Decreased $13
$17 $4
Q1 2015 Q1 2016
Adjusted PTC1 Decreased $30
$91 $61
Q1 2015 Q1 2016

21 Contains Forward-Looking Statements
Q1 Financial Results: Brazil SBU $ in Millions
1. A non-GAAP financial measure. See Appendix for definition and reconciliation.
l Higher Proportional Free Cash Flow1 reflects: � Higher collections at Sul and
Eletropaulo � Favorable timing of energy
purchases at Tietê � Lower margins:
- Expiration of Tietê’s PPA with Eletropaulo
- Lower demand at Sul and Eletropaulo - 26% devaluation of the Brazilian Real
Proportional Free Cash Flow1 Increased $81
($47)
$34
Q1 2015 Q1 2016
Adjusted PTC1 Decreased $30
$21
($9)
Q1 2015 Q1 2016

22 Contains Forward-Looking Statements
Q1 Financial Results: MCAC SBU $ in Millions
1. A non-GAAP financial measure. See Appendix for definition and reconciliation.
l Lower Proportional Free Cash Flow1 reflects: � Primarily higher tax payments and
lower collections versus abnormally high collections in 2015 in the Dominican Republic
Proportional Free Cash Flow1 Decreased $101
$114
$13
Q1 2015 Q1 2016
Adjusted PTC1 Decreased $2
$50 $48
Q1 2015 Q1 2016

23 Contains Forward-Looking Statements
Q1 Financial Results: Europe SBU $ in Millions
1. A non-GAAP financial measure. See Appendix for definition and reconciliation.
l Lower Proportional Free Cash Flow1 reflects: � Lower margins:
- 48% devaluation of the Kazakhstan Tenge
- Lower dark spreads at Kilroot in the United Kingdom
� Timing of payments to the fuel supplier at Maritza in Bulgaria, partially offset by higher collections
� Unfavorable timing of collections and tax payments in the United Kingdom
Proportional Free Cash Flow1 Decreased $63
$139 $76
Q1 2015 Q1 2016
Adjusted PTC1 Decreased $16
$85 $69
Q1 2015 Q1 2016
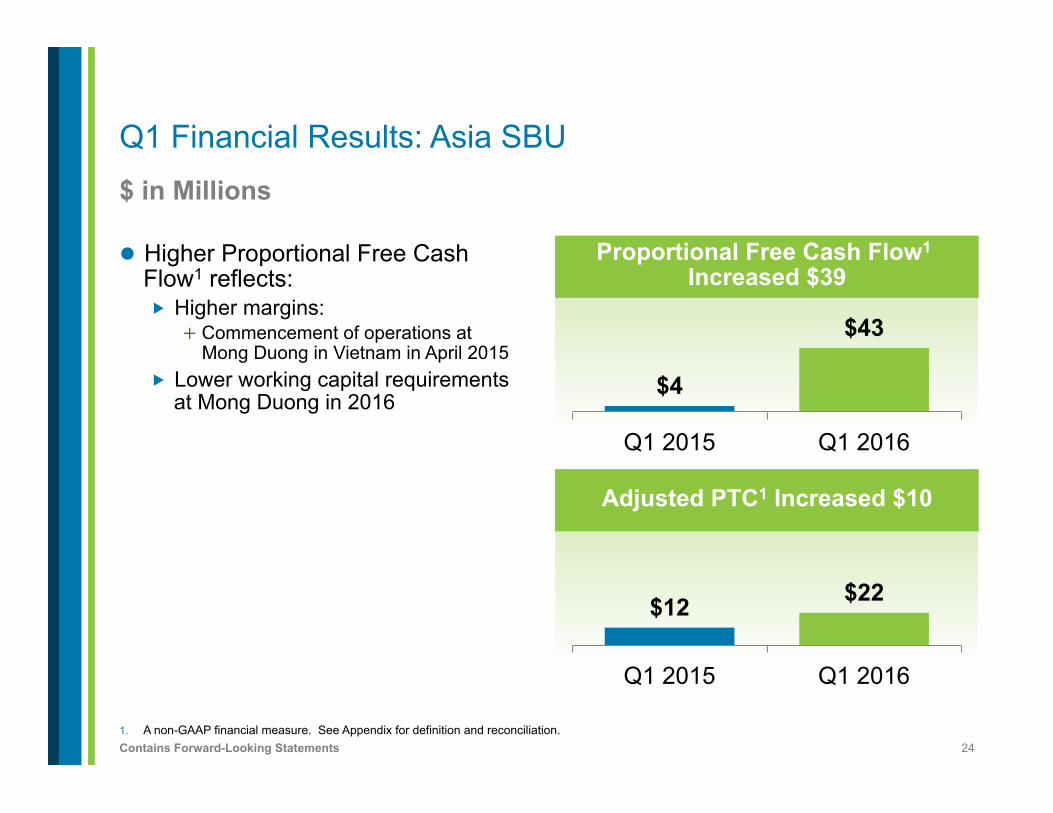
24 Contains Forward-Looking Statements
Q1 Financial Results: Asia SBU $ in Millions
1. A non-GAAP financial measure. See Appendix for definition and reconciliation.
l Higher Proportional Free Cash Flow1 reflects: � Higher margins:
+ Commencement of operations at Mong Duong in Vietnam in April 2015
� Lower working capital requirements at Mong Duong in 2016
Proportional Free Cash Flow1 Increased $39
$4
$43
Q1 2015 Q1 2016
Adjusted PTC1 Increased $10
$12 $22
Q1 2015 Q1 2016

25 Contains Forward-Looking Statements
l DPL filed its ESP in February 2015, to be effective beginning in 2017
l Since then, there have been challenges to regulation in Ohio � Included an alternative proposal in our ESP, providing an option for the Public
Utilities Commission of Ohio (PUCO) to approve a non-bypassable charge structured in the same way as the one in our existing ESP
� Alternative falls under PUCO’s authority and achieves policy goals set out by the Commission
� Continue to believe this alternative provides a viable path forward for DPL and Ohio and that PUCO is seeking a reasonable resolution before the end of 2016
Business Update
DPL Electric Security Plan (ESP)

26 Contains Forward-Looking Statements
2016 Capital Allocation Plan $ in Millions
1. Includes announced asset sale proceeds of: $40 million (Sonel, Kribi and Dibamba, Cameroon), $21 million (IPP4 partnership, Jordan) and $9 million (Kelanitissa, Sri Lanka).
2. A non-GAAP financial metric. See Appendix for definition and reconciliation.
Discretionary Cash – Uses ($1,060-$1,160)
Discretionary Cash – Sources ($1,060-$1,160)
$400
$525- $625
$70
$65 $1,060-$1,160
Beginning Cash
Asset Sales Proceeds
Parent FCF Return of Capital
Total Discretionary
Cash
2
1
$50
$111- $211
$79
$290 $330
$200 Unallocated Discretionary Cash
Target Closing Cash Balance
Investments in Subsidiaries
Shareholder Dividend
Completed Share Buyback
Debt Prepayment
Maximizing Discretionary Cash to Increased Risk-Adjusted Returns for Shareholders

27 Contains Forward-Looking Statements
l Continue to generate strong Proportional Free Cash Flow1
l Forecasting 70% to 75% of Adjusted EPS1 in the second half of the year, versus ~60% in past years � Lower effective tax rate in the second half, normalizing to a full year rate of 31% to 33%
� Higher availability due to lower planned outages in the second half
� Improvement in forward curves for FX and commodities over the balance of the year
� $50 million in 2016 cost reductions more weighted toward the second half
� Other beneficial items
$ in Millions, Except Per Share Amounts
1. A non-GAAP financial measure. See Appendix for definition and reconciliation.
Reaffirming 2016 Guidance and 2017-2018 Expectations
2016 2017-2018
Proportional Free Cash Flow1 $1,000-$1,350 At least 10% average annual growth Parent Free Cash Flow1 Expectation $525-$625
Consolidated Net Cash Provided by Operating Activities $2,000-$2,900 N/A
Adjusted EPS1 $0.95-$1.05 Expect higher end of
12%-16% average annual growth

28 Contains Forward-Looking Statements 1. A non-GAAP financial measure. See Appendix for definition and reconciliation.
Conclusion
l Reaffirming 2016 guidance and 2017-2018 expectations
l Made significant progress on strategic priorities: � Resolving outstanding receivables at Maritza in Bulgaria � Receiving positive actions from ratings agencies due to our efforts
to de-risk the portfolio and de-lever � Reaffirming double-digit growth through 2018 in cash flow and
earnings � Achieving significant milestones on three projects in our
development pipeline, to drive growth beyond 2018

29 Contains Forward-Looking Statements 1. A non-GAAP financial measure.
Appendix
l Listed Subs & Public Filers Slide 30 l SBU Modeling Disclosures Slides 31-32 l DPL Inc. Modeling Disclosures Slide 33 l DP&L and DPL Inc. Debt Maturities Slide 34 l Parent Only Cash Flow Slides 35-37 l Currency and Commodities Slides 38-40 l 2016 Adjusted PTC1 Modeling Ranges Slide 41 l AES Modeling Disclosures Slide 42 l Key Assumptions for 2016 Guidance & 2017-2018 Expectations Slide 43 l Construction Program Slide 44 l Reconciliations Slides 45-48 l Assumptions & Definitions Slides 49-51
30 Contains Forward-Looking Statements
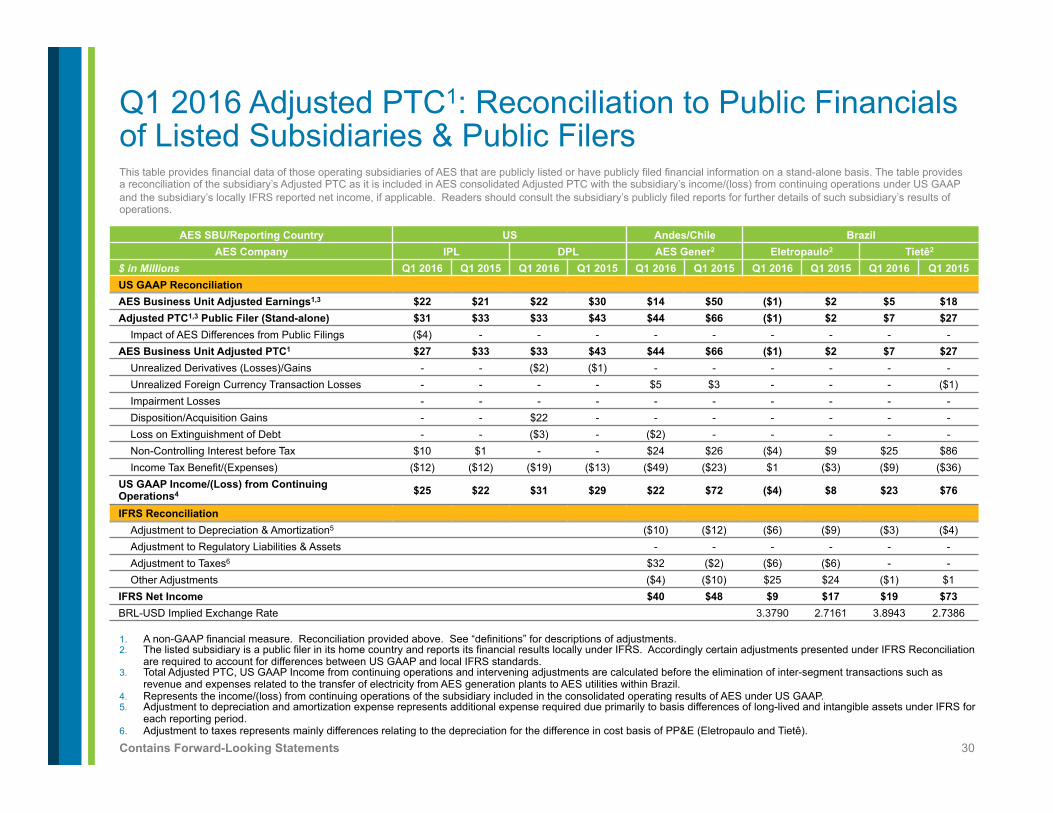
This table provides financial data of those operating subsidiaries of AES that are publicly listed or have publicly filed financial information on a stand-alone basis. The table provides a reconciliation of the subsidiary’s Adjusted PTC as it is included in AES consolidated Adjusted PTC with the subsidiary’s income/(loss) from continuing operations under US GAAP and the subsidiary’s locally IFRS reported net income, if applicable. Readers should consult the subsidiary’s publicly filed reports for further details of such subsidiary’s results of operations.
1. A non-GAAP financial measure. Reconciliation provided above. See “definitions” for descriptions of adjustments. 2. The listed subsidiary is a public filer in its home country and reports its financial results locally under IFRS. Accordingly certain adjustments presented under IFRS Reconciliation
are required to account for differences between US GAAP and local IFRS standards. 3. Total Adjusted PTC, US GAAP Income from continuing operations and intervening adjustments are calculated before the elimination of inter-segment transactions such as
revenue and expenses related to the transfer of electricity from AES generation plants to AES utilities within Brazil. 4. Represents the income/(loss) from continuing operations of the subsidiary included in the consolidated operating results of AES under US GAAP. 5. Adjustment to depreciation and amortization expense represents additional expense required due primarily to basis differences of long-lived and intangible assets under IFRS for
each reporting period. 6. Adjustment to taxes represents mainly differences relating to the depreciation for the difference in cost basis of PP&E (Eletropaulo and Tietê).
Q1 2016 Adjusted PTC1: Reconciliation to Public Financials of Listed Subsidiaries & Public Filers
AES SBU/Reporting Country US Andes/Chile Brazil AES Company IPL DPL AES Gener2 Eletropaulo2 Tietê2
$ in Millions Q1 2016 Q1 2015 Q1 2016 Q1 2015 Q1 2016 Q1 2015 Q1 2016 Q1 2015 Q1 2016 Q1 2015 US GAAP Reconciliation
AES Business Unit Adjusted Earnings1,3 $22 $21 $22 $30 $14 $50 ($1) $2 $5 $18 Adjusted PTC1,3 Public Filer (Stand-alone) $31 $33 $33 $43 $44 $66 ($1) $2 $7 $27
Impact of AES Differences from Public Filings ($4) - - - - - - - - - AES Business Unit Adjusted PTC1 $27 $33 $33 $43 $44 $66 ($1) $2 $7 $27
Unrealized Derivatives (Losses)/Gains - - ($2) ($1) - - - - - - Unrealized Foreign Currency Transaction Losses - - - - $5 $3 - - - ($1) Impairment Losses - - - - - - - - - - Disposition/Acquisition Gains - - $22 - - - - - - - Loss on Extinguishment of Debt - - ($3) - ($2) - - - - - Non-Controlling Interest before Tax $10 $1 - - $24 $26 ($4) $9 $25 $86 Income Tax Benefit/(Expenses) ($12) ($12) ($19) ($13) ($49) ($23) $1 ($3) ($9) ($36)
US GAAP Income/(Loss) from Continuing Operations4 $25 $22 $31 $29 $22 $72 ($4) $8 $23 $76
IFRS Reconciliation Adjustment to Depreciation & Amortization5 ($10) ($12) ($6) ($9) ($3) ($4) Adjustment to Regulatory Liabilities & Assets - - - - - - Adjustment to Taxes6 $32 ($2) ($6) ($6) - - Other Adjustments ($4) ($10) $25 $24 ($1) $1
IFRS Net Income $40 $48 $9 $17 $19 $73 BRL-USD Implied Exchange Rate 3.3790 2.7161 3.8943 2.7386

31 Contains Forward-Looking Statements
$ in Millions
1. A non-GAAP financial measure. See reconciliation on Slide 46 and “definitions”.
Q1 2016 Modeling Disclosures
Adjusted PTC1
Interest Expense Interest Income Depreciation & Amortization
Consolidated Adjustment Factor Proportional Consolidated Adjustment
Factor Proportional Consolidated Adjustment Factor Proportional
US $85 $58 ($7) $51 - - - $119 ($19) $100
DPL $33 $26 - $26 - - - $33 - $33
IPL $27 $22 ($7) $15 - - - $53 ($16) $37
Andes $61 $41 ($11) $30 $13 ($1) $12 $50 ($16) $34
AES Gener $44 $35 ($11) $24 $2 ($1) $1 $48 ($16) $32
Brazil ($9) $101 ($66) $35 $77 ($52) $25 $40 ($25) $15
Tietê $7 $13 ($10) $3 $6 ($5) $1 $8 ($6) $2
Eletropaulo ($1) $66 ($55) $11 $56 ($47) $9 $23 ($19) $4
MCAC $48 $39 ($6) $33 $3 ($1) $2 $42 ($11) $31
Europe $69 $17 ($4) $13 $4 - $4 $28 ($4) $24
Asia $22 $28 ($13) $15 $33 ($16) $17 $8 ($4) $4
Subtotal $276 $284 ($107) $177 $130 ($70) $60 $287 ($79) $208
Corp/Other ($104) $80 - $80 - - - $3 - $3
TOTAL $172 $364 ($107) $257 $130 ($70) $60 $290 ($79) $211

32 Contains Forward-Looking Statements
$ in Millions
1. In addition to total debt, Eletropaulo has $765 million of pension plan liabilities. AES owns 16% of Eletropaulo.
Q1 2016 Modeling Disclosures
Total Debt Cash & Cash Equivalents, Restricted Cash, Short-Term Investments, Debt Service Reserves & Other Deposits
Consolidated Adjustment Factor Proportional Consolidated Adjustment Factor Proportional
US $4,964 ($716) $4,248 $251 ($10) $241
DPL $1,922 - $1,922 $95 - $95
IPL $2,386 ($716) $1,670 $22 ($7) $15
Andes $3,814 ($1,505) $2,309 $278 ($98) $180
AES Gener $3,613 ($1,595) $2,108 $267 ($98) $169
Brazil1 $1,767 ($1,170) $597 $826 ($600) $226
Tietê $387 ($293) $94 $217 ($164) $53
Eletropaulo $1,045 ($877) $168 $486 ($408) $78
MCAC $2,303 ($375) $1,928 $510 ($70) $440
EMEA $1,084 ($263) $821 $158 ($31) $127
Asia $1,701 ($834) $867 $275 ($130) $145
Subtotal $15,633 ($4,863) $10,770 $2,298 ($939) $1,359
Corp/Other $4,924 - $4,924 $224 - $224
TOTAL $20,557 ($4,863) $15,694 $2,522 ($939) $1,583

33 Contains Forward-Looking Statements
Based on Market Conditions and Hedged Position as of April 30, 2016
1. Includes capacity premium performance results. 2. Balance of Year 2016 (May-December), Full Year 2017 and Full Year 2018 based on forward curves as of April 30, 2016.
DPL Inc. Modeling Disclosures
Balance of Year 2016 Full Year 2017 Full Year 2018
Volume Production (TWh) 9.7 14.4 14.3
% Volume Hedged ~52% ~52% 0%
Average Hedge Dark Spread ($/MWh) $10.88 $12.49 N/A
EBITDA Generation Business1 ($ in Millions) $80 to $120 per year
EBITDA DPL Inc. including Generation and T&D ($ in Millions) ~$340 to $350 million per year
Reference Prices2
Henry Hub Natural Gas ($/mmbtu) $2.46 $3.01 $3.04
AEP-Dayton Hub ATC Prices ($/MWh) $30 $32 $32
EBITDA Sensitivities (with Existing Hedges) ($ in Millions) +10% AD Hub Energy Price ATC ($/MWh) $14 $22 $45
-10% AD Hub Energy Price ATC ($/MWh) -$14 -$22 -$45

34 Contains Forward-Looking Statements
$ in Millions
Non-Recourse Debt at DP&L and DPL Inc.
Series Interest Rate Maturity Amount Outstanding as of March 31, 2016 Remarks
2013 First Mortgage Bonds 1.875% Sept. 2016 $445.0 ● Callable at make-whole T+20
2005 Boone County, KY PCBs 4.7% Jan. 2028 - ● Retired on July 1
2005 OH Air Quality PCBs 4.8% Jan. 2034 - ● Retired on Aug. 3
2005 OH Water Quality PCBs 4.8% Jan. 2034 - ● Retired on July 1
2006 OH Air Quality PCBs 4.8% Sept. 2036 $100.0 ● Non-callable; at par in Sept. 2016
2008 OH Air Quality PCBs (VDRNs) Variable Nov. 2040 - ● Retired on Aug. 3
2015 Direct Purchase Tax Exempt TL Variable Aug. 2020 (put) $200.0 ● Redeemable at par on any day
Total Pollution Control Various Various $300.0
Wright-Patterson AFB Note 4.2% Feb. 2061 $18.1 ● No prepayment option
2015 DP&L Revolver Variable July 2020 - ● Pre-payable on any day
DP&L Preferred 3.8% N/A $22.9 ● Redeemable at pre-established premium
Total DP&L $786.0
2018 Term Loan Variable May 2018 $125.0 ● No prepayment penalty
2016 Senior Unsecured 6.5% Oct. 2016 $57.0 ● Callable make-whole T+50
2019 Senior Unsecured 6.75% Oct. 2019 $200.0 ● Callable at make-whole T+50
2021 Senior Unsecured 7.25% Oct. 2021 $780.0 ● Callable at make-whole T+50
Total Senior Unsecured Bonds Various Various $1,037.0
2015 DPL Revolver Variable July 2020 - ● Pre-payable on any day
2001 Cap Trust II Securities 8.125% Sept. 2031 $15.6 ● Non-callable
Total DPL Inc. $1,177.6
TOTAL $1,963.6

35 Contains Forward-Looking Statements
1. See “definitions”. 2. A non-GAAP financial measure. See “definitions”.
Parent Sources & Uses of Liquidity
$ in Millions Q1
2016 2015
SOURCES
Total Subsidiary Distributions1 $85 $175
Proceeds from Asset Sales, Net $11 $236
Financing Proceeds, Net - -
Increased/(Decreased) Credit Facility Commitments - -
Issuance of Common Stock, Net - -
Total Returns of Capital Distributions & Project Financing Proceeds $16 -
Beginning Parent Company Liquidity2 $1,138 $1,246
Total Sources $1,250 $1,657
USES
Repayments of Debt ($116) ($336)
Shareholder Dividend ($73) ($70)
Repurchase of Equity ($79) ($35)
Investments in Subsidiaries, Net ($139) ($46)
Cash for Development, Selling, General & Administrative and Taxes ($84) ($60)
Cash Payments for Interest ($74) ($86)
Changes in Letters of Credit and Other, Net ($10) $7
Ending Parent Company Liquidity2 ($675) ($1,031)
Total Uses ($1,250) ($1,657)

36 Contains Forward-Looking Statements
Subsidiary Distributions1 by SBU
$ in Millions Q1 2016
US $21
Andes $11
Brazil $32
MCAC $4
Europe $7
Asia $10
Corporate & Other2 -
TOTAL $85
1. See “definitions”. 2. Corporate & Other includes Global Insurance.
Q1 2016 Subsidiary Distributions1
Top Ten Subsidiary Distributions1 by Business
Q1 2016
Business Amount Business Amount
AES Holdings Brasil (Brazil) $32 Puerto Rico (MCAC) $4
IPALCO (US) $18 Laurel Mountain (US) $2
Alicura (Andes) $11 Amman East (Europe) $2
Kelanitissa (Asia) $9 Mong Duong (Asia) $1
Elsta (Europe) $6 Tait Energy Storage (US) $1
$ in Millions

37 Contains Forward-Looking Statements
$ in Millions
1. See “definitions”. 2. A non-GAAP financial measure. See “definitions”. 3. Qualified Holding Company. See “assumptions”.
Reconciliation of Subsidiary Distributions1 & Parent Liquidity2
Quarter Ended
March 31, 2016 December 31, 2015
September 30, 2015 June 30, 2015
Total Subsidiary Distributions1 to Parent & QHCs3 $85 $555 $93 $235
Total Return of Capital Distributions to Parent & QHCs3 $16 - - $8
Total Subsidiary Distributions1 & Returns of Capital to Parent $101 $555 $93 $243
Balance as of
March 31, 2016 December 31, 2015
September 30, 2015 June 30, 2015
Cash at Parent & QHCs3 $17 $400 $6 $40
Availability Under Credit Facilities $658 $738 $625 $739
Ending Liquidity $675 $1,138 $631 $779

38 Contains Forward-Looking Statements
Interest Rates1
Currencies
Commodity Sensitivity
l 100 bps move in interest rates over year-to-go 2016 is equal to a change in EPS of approximately $0.020 l 10% appreciation in USD against the following key currencies is equal to the following negative EPS impacts:
Balance of Year 2016
Average Rate Sensitivity
Argentine Peso (ARS) 15.43 $0.005
Brazilian Real (BRL) 3.56 Less than $0.005
Colombian Peso (COP) 2,911 $0.005
Euro (EUR) 1.15 Less than $0.005
Great British Pound (GBP) 1.46 Less than $0.005
Kazakhstan Tenge (KZT) 341.1 Less than $0.005
10% increase in commodity prices is forecasted to have the following EPS impacts:
Balance of Year 2016
Average Rate Sensitivity
NYMEX Coal $45/ton $0.010, negative correlation
Rotterdam Coal (API 2) $47/ton
NYMEX WTI Crude Oil $47/bbl $0.005, positive correlation
IPE Brent Crude Oil $48/bbl
NYMEX Henry Hub Natural Gas $2.5/mmbtu Less than $0.005, positive correlation UK National Balancing Point Natural Gas £0.31/therm
US Power (DPL) – PJM AD Hub $ 30/MWh $0.015, positive correlation
Note: Guidance provided on May 9, 2016. Sensitivities are provided on a standalone basis, assuming no change in the other factors, to illustrate the magnitude and direction of changing market factors on AES’ results. Estimates show the impact the year-to-go 2016 Adjusted EPS. Actual results may differ from the sensitivities provided due to execution of risk management strategies, local market dynamics and operational factors. Full year 2016 guidance is based on currency and commodity forward curves and forecasts as of April 30, 2016. There are inherent uncertainties in the forecasting process and actual results may differ from projections. The Company undertakes no obligation to update the guidance presented today. Please see Item 3 of the Form 10-Q for a more complete discussion of this topic. AES has exposure to multiple coal, oil, and natural gas, and power indices; forward curves are provided for representative liquid markets. Sensitivities are rounded to the nearest ½ cent per share. 1. The move is applied to the floating interest rate portfolio balances as of April 30, 2016.
Full Year 2016 Guidance Estimated Sensitivities
39 Contains Forward-Looking Statements
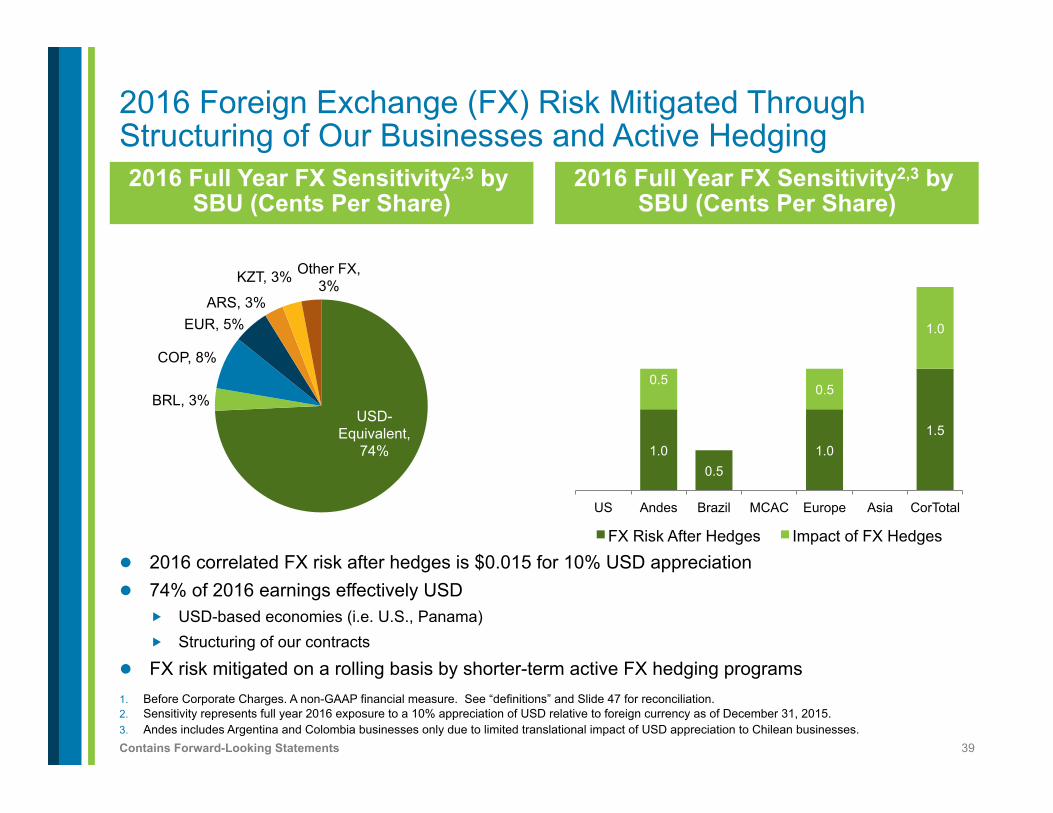
2016 Foreign Exchange (FX) Risk Mitigated Through Structuring of Our Businesses and Active Hedging
1. Before Corporate Charges. A non-GAAP financial measure. See “definitions” and Slide 47 for reconciliation. 2. Sensitivity represents full year 2016 exposure to a 10% appreciation of USD relative to foreign currency as of December 31, 2015. 3. Andes includes Argentina and Colombia businesses only due to limited translational impact of USD appreciation to Chilean businesses.
2016 Full Year FX Sensitivity2,3 by SBU (Cents Per Share)
1.0 0.5
1.0 1.5
0.5 0.5
1.0
US Andes Brazil MCAC Europe Asia CorTotal
FX Risk After Hedges Impact of FX Hedges
2016 Full Year FX Sensitivity2,3 by SBU (Cents Per Share)
USD-Equivalent,
74%
BRL, 3%
COP, 8%
EUR, 5% ARS, 3%
KZT, 3% Other FX, 3%
l 2016 correlated FX risk after hedges is $0.015 for 10% USD appreciation l 74% of 2016 earnings effectively USD
� USD-based economies (i.e. U.S., Panama) � Structuring of our contracts
l FX risk mitigated on a rolling basis by shorter-term active FX hedging programs
40 Contains Forward-Looking Statements
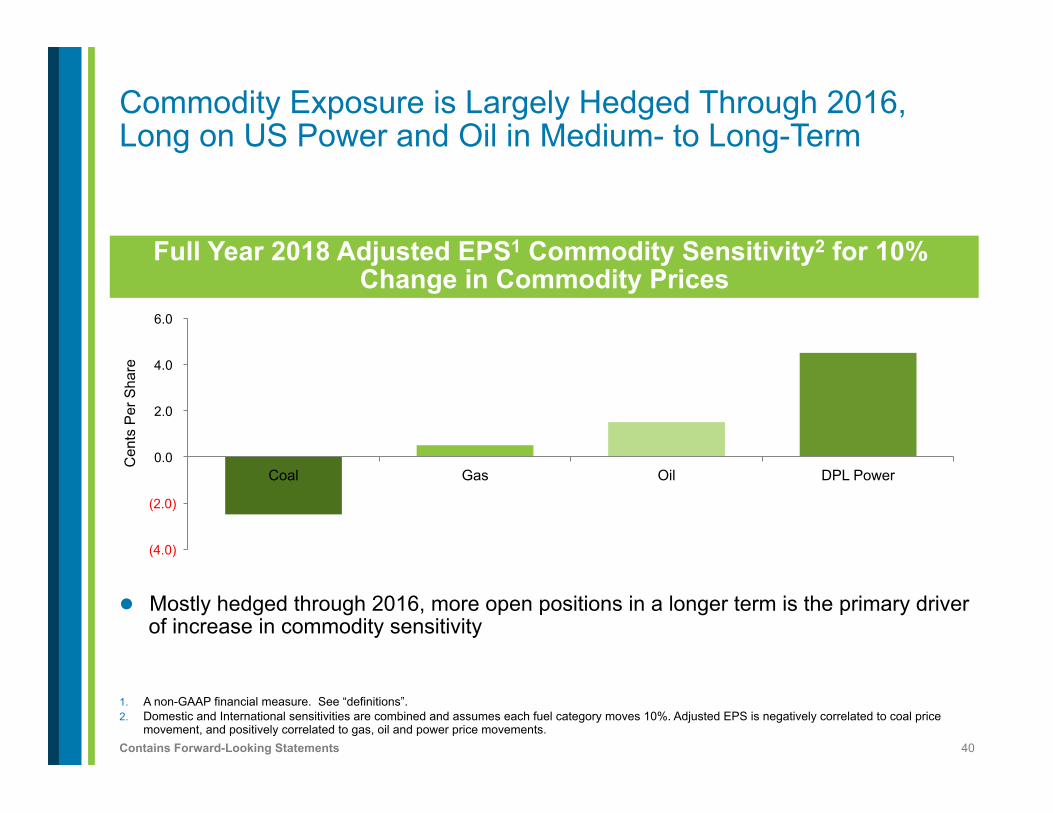
1. A non-GAAP financial measure. See “definitions”. 2. Domestic and International sensitivities are combined and assumes each fuel category moves 10%. Adjusted EPS is negatively correlated to coal price
movement, and positively correlated to gas, oil and power price movements.
l Mostly hedged through 2016, more open positions in a longer term is the primary driver of increase in commodity sensitivity
Full Year 2018 Adjusted EPS1 Commodity Sensitivity2 for 10% Change in Commodity Prices
(4.0)
(2.0)
0.0
2.0
4.0
6.0
Coal Gas Oil DPL Power
Cen
ts P
er S
hare
Commodity Exposure is Largely Hedged Through 2016, Long on US Power and Oil in Medium- to Long-Term

41 Contains Forward-Looking Statements
$ in Millions
1. A non-GAAP financial metric. See “definitions”. 2. Total AES Adjusted PTC includes after-tax adjusted equity in earnings.
Full Year 2016 Adjusted PTC1 Modeling Ranges
SBU 2016 Adjusted PTC
Modeling Ranges as of 2/24/161
Drivers of Growth Versus 2015
US $380-$405 + Better availability in Hawaii + Lower fixed costs - Commodities - Expiration of Buffalo Gap PPA
Andes $375-$405 - Guacolda restructuring - FX
Brazil $20-$50 - Tietê contract step-down - Eletropaulo cable reversal in 2015 - Lower demand, higher interest rates and FX
MCAC $300-$330 + Full year of oil-fired barge in Panama - Ancillary services in the Dominican Republic - Commodities
Europe $130-$175 - Commodities - FX - Maritza PPA negotiations
Asia $85-$105 + Full year of Mong Duong Total SBUs $1,290-$1,470
Corp/Other ($390)-($455) Total AES Adjusted PTC1,2 $900-$1,015

42 Contains Forward-Looking Statements
$ in Millions
1. A non-GAAP financial measure. See “definitions”.
AES Modeling Disclosures
2016 Assumptions Parent Company Cash Flow Assumptions Subsidiary Distributions (a) $1,060-$1,160 Cash Interest (b) $300 Cash for Development, General & Administrative and Tax (c) $235
Parent Free Cash Flow1 (a – b – c) $525-$625

43 Contains Forward-Looking Statements 1. A non-GAAP financial measure. See “definitions”.
Key Assumptions for Guidance
l 2016-2018 � Currency and commodity forward curves as of April 30, 2016 � Full year 2016 tax rate of 31%-33% and 2017-2018 tax rate in the
low- to mid-30% range

44 Contains Forward-Looking Statements
$ in Millions, Unless Otherwise Stated
1. AES equity contribution equal to 67% of AES Gener’s equity contribution to the project. 2. Based on projections. See our 2015 Form 10-K for further discussion of development and construction risks. Based on contributions from all projects under construction and IPL
MATS and wastewater upgrades, from 2020-2023, once all projects under construction are completed.
Attractive Returns from Construction Pipeline
Project Country AES Ownership Fuel Gross MW
Expected COD Total Capex
Total AES
Equity ROE Comments
Construction Projects Coming On-Line 2016-2018
Andes Solar Chile 67% Solar 21 1H 2016 $44 $29
Tunjita Colombia 67% Hydro 20 1H 2016 $67 $21 Lease capital structure at Chivor
IPL MATS US-IN 70% Coal 1H 2016 $454 $143 Environmental (MATS) upgrades of 1,713 MW
Harding Street Units 5-7 US-IN 70% Gas 630 1H 2016 $143 $45
Cochrane Chile 40% Coal 532 2H 2016 $1,365 $142
Eagle Valley CCGT US-IN 70% Gas 671 1H 2017 $590 $186
DPP Conversion Dominican Republic 90% Gas 122 1H 2017 $260 $0
IPL Wastewater US-IN 70% Gas 2H 2017 $224 $71 Environmental (NPDES) upgrades of 1,864 MW
OPGC 2 India 49% Coal 1,320 1H 2018 $1,585 $227
Alto Maipo Chile 40% Hydro 531 2H 2018/ 1H 2019 $2,053 $335
Masinloc 2 Philippines 51% Coal 335 1H 2019 $740 $110
ROE2 ~15% Weighted average; net
income divided by AES equity contribution
CASH YIELD2 ~15% Weighted average; subsidiary distributions divided by AES
equity contribution

45 Contains Forward-Looking Statements
$ in Millions
1. A non-GAAP financial measure as reconciled above. See “definitions”. 2. Includes capital expenditures under investing and financing activities.
Reconciliation of Q1 Capex and Free Cash Flow1
Consolidated Q1
2016 2015
Operational Capex (a) $162 $149
Environmental Capex (b) $87 $48
Maintenance Capex (a + b) $249 $197
Growth Capex (c) $401 $464
Total Capex2 (a + b + c) $650 $661
Consolidated Q1 Proportional1 Q1
2016 2015 2016 2015
Operating Cash Flow $640 $437 $375 $385
Add: Capital Expenditures Related to Service Concession Assets $24 $20 $12 $10
Less: Maintenance Capex, net of Reinsurance Proceeds and Non-Recoverable Environmental Capex
($174) ($159) ($122) ($120)
Free Cash Flow1 $490 $298 $253 $265

46 Contains Forward-Looking Statements
1. A non-GAAP financial measure as reconciled above. See “definitions”. 2. NCI is defined as noncontrolling Interests. 3. Unrealized derivative (gains) losses were net of income tax per share of ($0.02) and ($0.01) in the three months ended March 31, 2016 and 2015,
respectively. 4. Unrealized foreign currency transaction (gains) losses were net of income tax per share of ($0.01) and $0.03 in the three months ended March 31, 2016 and
2015, respectively. 5. Amount primarily relates to the gain from the sale of DPLER of $22 million ($12 million, or $0.02 per share, net of income tax expense per share of $0.01). 6. Amount primarily relates to the asset impairment at Buffalo Gap II of $159 million, of which $49 million was attributable to AES; offset by a tax benefit of $51
million (net impact of $2 million, or $0.00 per share). 7. Amount primarily relates to the loss on early retirement of debt at the Parent Company of $26 million ($18 million, or $0.03 per share, net of income tax per
share of $0.01).
Reconciliation of Q1 Adjusted PTC1 & Adjusted EPS1
$ in Millions, Except Per Share Amounts
Q1 2016 Q1 2015
Net of NCI2
Per Share (Diluted) Net of NCI2 and
Tax Net of NCI2
Per Share (Diluted) Net of NCI2 and
Tax
Income (Loss) from Continuing Operations Attributable to AES and Diluted EPS $126 $0.19 $142 $0.20
Add: Income Tax Expense (Benefit) from Continuing Operations Attributable to AES $56 $50
Pre-Tax Contribution $182 $192
Adjustments
Unrealized Derivative (Gains)/Losses3 ($34) ($0.03) ($15) ($0.01)
Unrealized Foreign Currency Transaction (Gains)/Losses4 ($8) ($0.01) $47 $0.03
Disposition/Acquisition (Gains)/Losses ($19) ($0.02)5 ($5) ($0.01)
Impairment Losses $50 -6 $6 $0.01
Loss on Extinguishment of Debt $1 - $27 $0.037
ADJUSTED PTC1 & ADJUSTED EPS1 $172 $0.13 $252 $0.25

47 Contains Forward-Looking Statements
$ in Millions, Except Per Share Amounts
1. A non-GAAP financial measure. See “definitions”.
Reconciliation of 2016 Guidance
2016 Guidance Proportional Free Cash Flow1 $1,000-$1,350 Consolidated Net Cash Provided by Operating Activities $2,000-$2,900
Adjusted EPS1 $0.95-$1.05
Reconciliation Consolidated Adjustment Factor Proportional Consolidated Net Cash Provided by Operating Activities (a)
$2,000-$2,900 $500-$1,050 $1,500-$1,850
Maintenance & Environmental Capital Expenditures (b)
$600-$800 $200 $400-$600
Free Cash Flow1 (a - b) $1,300-$2,200 $300-$850 $1,000-$1,350
l Commodity and foreign currency exchange rates and forward curves as of April 30, 2016

48 Contains Forward-Looking Statements
$ in Millions
1. A non-GAAP financial measure. See “definitions”.
Reconciliation of Net Debt1 as of March 31, 2016
Recourse Debt (Current) - Non-Recourse Debt (Current) $2,220 Recourse Debt (Noncurrent) $4,924 Non-Recourse Debt (Noncurrent) $13,413
Total Debt $20,557 LESS
Cash & Cash Equivalents $1,185 Restricted Cash $294 Short-Term Investments $628 Debt Service Reserves & Other Deposits $415
Total $2,522 NET DEBT $18,035
49 Contains Forward-Looking Statements
Assumptions
Forecasted financial information is based on certain material assumptions. Such assumptions include, but are not limited to: (a) no unforeseen external events such as wars, depressions, or economic or political disruptions occur; (b) businesses continue to operate in a manner consistent with or better than prior operating performance, including achievement of planned productivity improvements including benefits of global sourcing, and in accordance with the provisions of their relevant contracts or concessions; (c) new business opportunities are available to AES in sufficient quantity to achieve its growth objectives; (d) no material disruptions or discontinuities occur in the Gross Domestic Product (GDP), foreign exchange rates, inflation or interest rates during the forecast period; and (e) material business-specific risks as described in the Company’s SEC filings do not occur individually or cumulatively. In addition, benefits from global sourcing include avoided costs, reduction in capital project costs versus budgetary estimates, and projected savings based on assumed spend volume which may or may not actually be achieved. Also, improvement in certain Key Performance Indicators (KPIs) such as equivalent forced outage rate and commercial availability may not improve financial performance at all facilities based on commercial terms and conditions. These benefits will not be fully reflected in the Company’s consolidated financial results.
The cash held at qualified holding companies (“QHCs”) represents cash sent to subsidiaries of the Company domiciled outside of the U.S. Such subsidiaries had no contractual restrictions on their ability to send cash to AES, the Parent Company, however, cash held at qualified holding companies does not reflect the impact of any tax liabilities that may result from any such cash being repatriated to the Parent Company in the U.S. Cash at those subsidiaries was used for investment and related activities outside of the U.S. These investments included equity investments and loans to other foreign subsidiaries as well as development and general costs and expenses incurred outside the U.S. Since the cash held by these QHCs is available to the Parent, AES uses the combined measure of subsidiary distributions to Parent and QHCs as a useful measure of cash available to the Parent to meet its international liquidity needs. AES believes that unconsolidated parent company liquidity is important to the liquidity position of AES as a parent company because of the non-recourse nature of most of AES’ indebtedness.

50 Contains Forward-Looking Statements
Definitions
l Adjusted Earnings Per Share (a non-GAAP financial measure) is defined as diluted earnings per share from continuing operations excluding gains or losses of both consolidated entities and entities accounted for under the equity method due to (a) unrealized gains or losses related to derivative transactions, (b) unrealized foreign currency gains or losses, (c) gains or losses due to dispositions and acquisitions of business interests, (d) losses due to impairments, and (e) costs due to the early retirement of debt, adjusted for the same gains or losses excluded from consolidated entities. The GAAP measure most comparable to Adjusted EPS is diluted earnings per share from continuing operations. AES believes that Adjusted EPS better reflects the underlying business performance of the Company and is considered in the Company’s internal evaluation of financial performance. Factors in this determination include the variability due to unrealized gains or losses related to derivative transactions, unrealized foreign currency gains or losses, losses due to impairments and strategic decisions to dispose or acquire business interests or retire debt, which affect results in a given period or periods. Adjusted EPS should not be construed as an alternative to diluted earnings per share from continuing operations, which is determined in accordance with GAAP.
l Adjusted Pre-Tax Contribution (a non-GAAP financial measure) represents pre-tax income from continuing operations attributable to AES excluding gains or losses of both consolidated entities and entities accounted for under the equity method due to (a) unrealized gains or losses related to derivative transactions, (b) unrealized foreign currency gains or losses, (c) gains or losses due to dispositions and acquisitions of business interests, (d) losses due to impairments, and (e) costs due to the early retirement of debt, adjusted for the same gains or losses excluded from consolidated entities. It includes net equity in earnings of affiliates, on an after-tax basis. The GAAP measure most comparable to Adjusted PTC is income from continuing operations attributable to AES. AES believes that Adjusted PTC better reflects the underlying business performance of the Company and is considered in the Company’s internal evaluation of financial performance. Factors in this determination include the variability due to unrealized gains or losses related to derivative transactions, unrealized foreign currency gains or losses, losses due to impairments and strategic decisions to dispose or acquire business interests or retire debt, which affect results in a given period or periods. Earnings before tax represents the business performance of the Company before the application of statutory income tax rates and tax adjustments, including the affects of tax planning, corresponding to the various jurisdictions in which the Company operates. Adjusted PTC should not be construed as an alternative to income from continuing operations attributable to AES, which is determined in accordance with GAAP.
l Free Cash Flow (a non-GAAP financial measure) is defined as net cash from operating activities less maintenance capital expenditures (including non-recoverable environmental capital expenditures), net of reinsurance proceeds from third parties. AES believes that free cash flow is a useful measure for evaluating our financial condition because it represents the amount of cash provided by operations less maintenance capital expenditures as defined by our businesses, that may be available for investing or for repaying debt. Free cash flow should not be construed as an alternative to net cash from operating activities, which is determined in accordance with GAAP.
l Net Debt (a non-GAAP financial measure) is defined as current and non-current recourse and non-recourse debt less cash and cash equivalents, restricted cash, short term investments, debt service reserves and other deposits. AES believes that net debt is a useful measure for evaluating our financial condition because it is a standard industry measure that provides an alternate view of a company’s indebtedness by considering the capacity of cash. It is also a required component of valuation techniques used by management and the investment community.
l Parent Company Liquidity (a non-GAAP financial measure) is defined as cash at the Parent Company plus availability under corporate credit facilities plus cash at qualified holding companies (“QHCs”). AES believes that unconsolidated Parent Company liquidity is important to the liquidity position of AES as a Parent Company because of the non-recourse nature of most of AES’ indebtedness.
l Parent Free Cash Flow (a non-GAAP financial measure) should not be construed as an alternative to Net Cash Provided by Operating Activities which is determined in accordance with GAAP. Parent Free Cash Flow is equal to Subsidiary Distributions less cash used for interest costs, development, general and administrative activities, and tax payments by the Parent Company. Parent Free Cash Flow is used for dividends, share repurchases, growth investments, recourse debt repayments, and other uses by the Parent Company.

51 Contains Forward-Looking Statements
Definitions (Continued)
l Proportional Free Cash Flow – The Company defines Proportional Free Cash Flow as cash flows from operating activities (adjusted for service concession asset capital expenditures), less maintenance capital expenditures (including non-recoverable environmental capital expenditures and net of reinsurance proceeds), adjusted for the estimated impact of noncontrolling interests. The proportionate share of cash flows and related adjustments attributable to noncontrolling interests in our subsidiaries comprise the proportional adjustment factor. Upon the Company’s adoption of the accounting guidance for service concession arrangements effective January 1, 2015, capital expenditures related to service concession assets that would have been classified as investing activities on the Condensed Consolidated Statement of Cash Flows are now classified as operating activities. The Company excludes environmental capital expenditures that are expected to be recovered through regulatory, contractual or other mechanisms. An example of recoverable environmental capital expenditures is IPL’s investment in MATS-related environmental upgrades that are recovered through a tracker. The GAAP measure most comparable to proportional free cash flow is cash flows from operating activities. We believe that proportional free cash flow better reflects the underlying business performance of the Company, as it measures the cash generated by the business, after the funding of maintenance capital expenditures, that may be available for investing or repaying debt or other purposes. Factors in this determination include the impact of noncontrolling interests, where AES consolidates the results of a subsidiary that is not wholly owned by the Company.
l Proportional Metrics – The Company is a holding company that derives its income and cash flows from the activities of its subsidiaries, some of which are not wholly-owned by the Company. Accordingly, the Company has presented certain financial metrics which are defined as Proportional (a non-GAAP financial measure) to account for the Company’s ownership interest. Proportional metrics present the Company’s estimate of its share in the economics of the underlying metric. The Company believes that the Proportional metrics are useful to investors because they exclude the economic share in the metric presented that is held by non-AES shareholders. For example, Operating Cash Flow is a GAAP metric which presents the Company’s cash flow from operations on a consolidated basis, including operating cash flow allocable to noncontrolling interests. Proportional Operating Cash Flow removes the share of operating cash flow allocable to noncontrolling interests and therefore may act as an aid in the valuation the Company. Beginning in Q1 2015, the definition was revised to also exclude cash flows related to service concession assets. Proportional metrics are reconciled to the nearest GAAP measure. Certain assumptions have been made to estimate our proportional financial measures. These assumptions include: (i) the Company’s economic interest has been calculated based on a blended rate for each consolidated business when such business represents multiple legal entities; (ii) the Company’s economic interest may differ from the percentage implied by the recorded net income or loss attributable to noncontrolling interests or dividends paid during a given period; (iii) the Company’s economic interest for entities accounted for using the hypothetical liquidation at book value method is 100%; (iv) individual operating performance of the Company’s equity method investments is not reflected and (v) inter-segment transactions are included as applicable for the metric presented. The proportional adjustment factor, proportional maintenance capital expenditures (net of reinsurance proceeds) and proportional non-recoverable environmental capital expenditures are calculated by multiplying the percentage owned by noncontrolling interests for each entity by its corresponding consolidated cash flow metric and are totaled to the resulting figures. For example, Parent Company A owns 20% of Subsidiary Company B, a consolidated subsidiary. Thus, Subsidiary Company B has an 80% noncontrolling interest. Assuming a consolidated net cash flow from operating activities of $100 from Subsidiary B, the proportional adjustment factor for Subsidiary B would equal $80 (or $100 x 80%). The Company calculates the proportional adjustment factor for each consolidated business in this manner and then sums these amounts to determine the total proportional adjustment factor used in the reconciliation. The proportional adjustment factor may differ from the proportion of income attributable to noncontrolling interests as a result of (a) non-cash items which impact income but not cash and (b) AES’ ownership interest in the subsidiary where such items occur.
l Subsidiary Liquidity (a non-GAAP financial measure) is defined as cash and cash equivalents and bank lines of credit at various subsidiaries. l Subsidiary Distributions should not be construed as an alternative to Net Cash Provided by Operating Activities which is determined in accordance with GAAP. Subsidiary
Distributions are important to the Parent Company because the Parent Company is a holding company that does not derive any significant direct revenues from its own activities but instead relies on its subsidiaries’ business activities and the resultant distributions to fund the debt service, investment and other cash needs of the holding company. The reconciliation of the difference between the Subsidiary Distributions and Net Cash Provided by Operating Activities consists of cash generated from operating activities that is retained at the subsidiaries for a variety of reasons which are both discretionary and non-discretionary in nature. These factors include, but are not limited to, retention of cash to fund capital expenditures at the subsidiary, cash retention associated with non-recourse debt covenant restrictions and related debt service requirements at the subsidiaries, retention of cash related to sufficiency of local GAAP statutory retained earnings at the subsidiaries, retention of cash for working capital needs at the subsidiaries, and other similar timing differences between when the cash is generated at the subsidiaries and when it reaches the Parent Company and related holding companies.