Embed Size (px)
Citation preview
2Q11 and
1H11 Results
08/12/2011 > Investor Relations
Villa Flora - Sumaré – São Paulo
1
This material is a presentation of general background information about Rossi Residencial S.A. (“Rossi”) as of the date of this presentation.Information contained herein has been summarized and does not purport to be complete. This presentation shall not be considered an advice ofinvestment by potential investors. This presentation is strictly confidential and may not be disclosed to any third person. There are norepresentations or warranties, express or implied, regarding the accuracy, fairness, or completeness of the information presented herein, which shallnot support any decision of investment.
This presentation contains statements and information that are forward-looking pursuant section 27A of the Securities Act of 1933, as amended, andSection 21E of the Securities and Exchange Act of 1934. Such forward-looking statements and information are only predictions and cannot assureRossi’s future performance. Investors have been cautioned that any such forward-looking statements and information are subject to many risks anduncertainties relating to the operations and business of Rossi and its subsidiaries. As a result of such risks and uncertainties, the actual results ofRossi and its subsidiaries may be materially different from any future result expressed or implied in the forward-looking statement or informationcontained herein.
Although Rossi believes that the expectations and assumptions reflected in the forward-looking statements and information are reasonable and havebeen based on data currently available to its officers and directors, Rossi cannot guarantee future results or events. Rossi does not assume thecommitment of update any of the forward-looking statement of information.
Securities may not be offered or sold in the United States unlesss they are registered or exempt from registration under the Securities Act of 1933,as amended. Any offering of securities to be made in the United States will be made by means of an offering memorandum that may be obtainedfrom the underwriters. Such offering memorandum will contain, or incorporate by reference, detailed information about Rossi and its subsidiaries,their business and financial results, as well as its financial statements.
This material is for distribution only to person who (i) have professional experience in matters relating to investments falling within Article 19 (5) ofthe Financial Services and Markets Act of 2000 (Financial Promotion) Order 2005 (as amended, the “Financial Promotion Order”), (ii) are personsfalling within Article 49 (2) (a) to (d) (“high net worth companies, unincorporated associations etc”) of the Financial Promotion Order, (iii) areoutside the United Kingdom, or (iv) are persons to whom an invitation or inducement to engage in investment activity (within the meaning of section21 of the Financial Services and Markets Act 2000) in connection with the issue or sale of any securities may otherwise lawfully be communicated orcaused to be communicated (all such persons together being referred to as “relevant persons”). This material is directed only at relevant personsand must not be acted on or relied on by persons who are not relevant persons. Any investment or investment activity to which this material relatesis available only to relevant persons and will be engaged in only with relevant persons.
This presentation does not constitute an offer, invitation or solicitation of an offer to subscribe to or purchase any securities. Neither thispresentation nor anything contained herein shall form the basis of any contract or commitment whatsoever.
Disclaimer
2
Heitor Cantergiani
CEO
Highlights
Leonardo Diniz
Sales Officer
Operating Performance
Cássio Audi
CFO and IROFinancial Performance
Renato Diniz
Engineering Officer
Execution – Construction Technology
Agenda
3(¹) SOS – Sales over supply 3
www.rossiresidencial.com.br
Highlights
Operating Performance
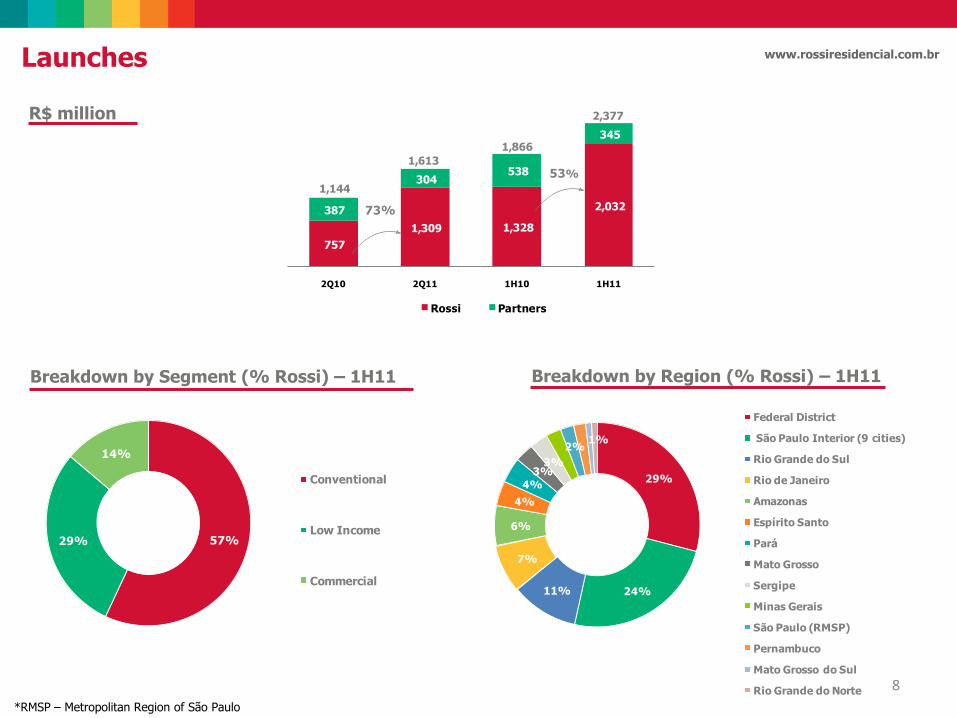
Launches (Rossi’s share): R$ 1.3 billion, 73% higher than in 2Q10;
Launches (Rossi’s share): R$ 2.0 billion, 53% higher than in 1H10;
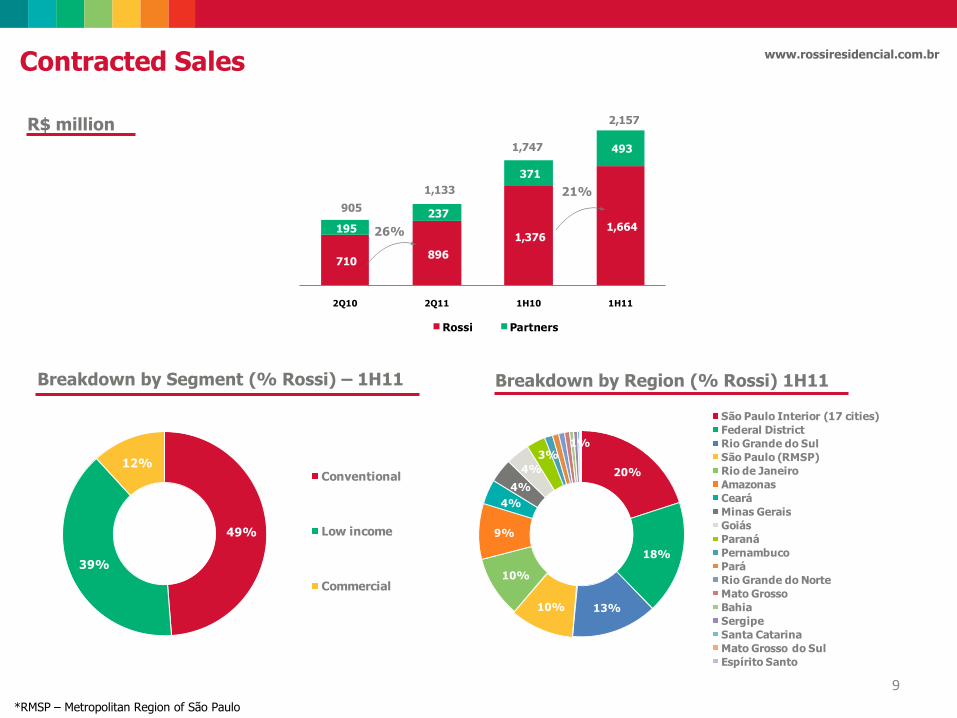
Contracted sales (Rossi’s share): R$ 896 million, 26% higher than in 2Q10;
Contracted sales (Rossi’s share): R$ 1.7 billion, 21% higher than in 1H10;
The low income segment represented 71% of the units launched and 31% of Rossi’s total PSV;
The low income segment represented 63% of the units launched in 1H11;
• SOS(¹) of 25% in the quarter;
Financial Performance
Net Revenue: R$ 752 million, 16% higher than in 2Q10;
In 1H11: R$ 1.4 billion, 23% higher than in 1H10;
Gross Income: R$ 232 million, 7% higher than in 2Q10 - Gross Margin: 31%;
In 1H11: R$ 446 million, with Gross Margin of 32%;
EBITDA (Adjusted): R$ 157 million, 21%higher than in 2Q10 – EBITDA Margin: 21%;
In 1H11: R$ 289 million, with EBITDA Margin of 21%;
Net Income (Adjusted): R$ 95 million in 2Q11 and R$ 173 million in 1H11;
4
Execution -
Construction
Technology
Jardins da França Residencial | Sergipe - Aracaju
5
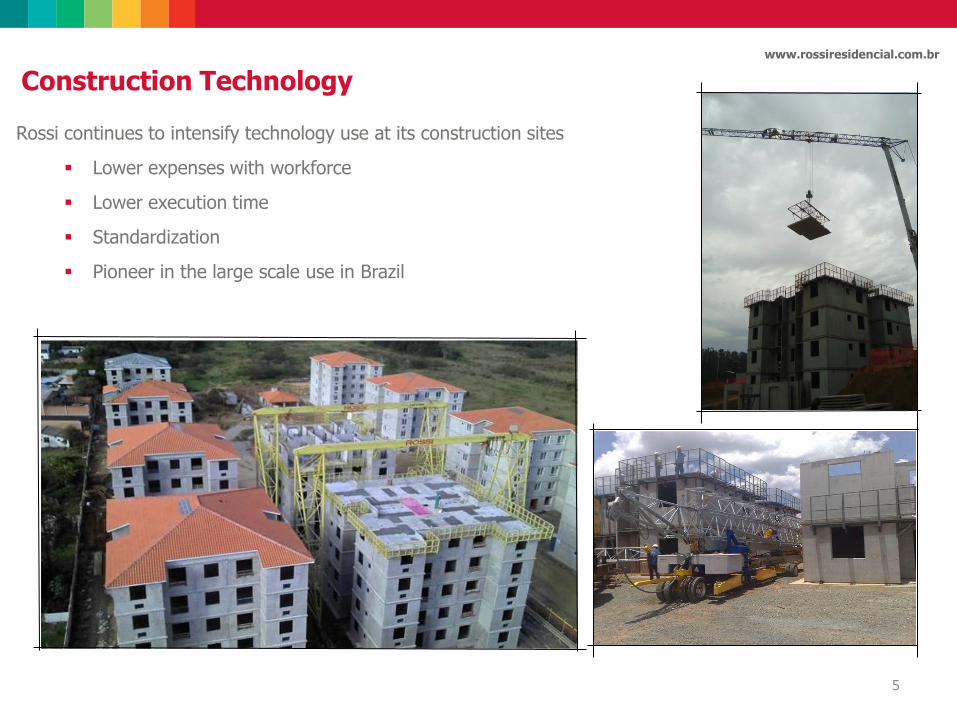
Construction Technology
Rossi continues to intensify technology use at its construction sites
Lower expenses with workforce
Lower execution time
Standardization
Pioneer in the large scale use in Brazil
www.rossiresidencial.com.br
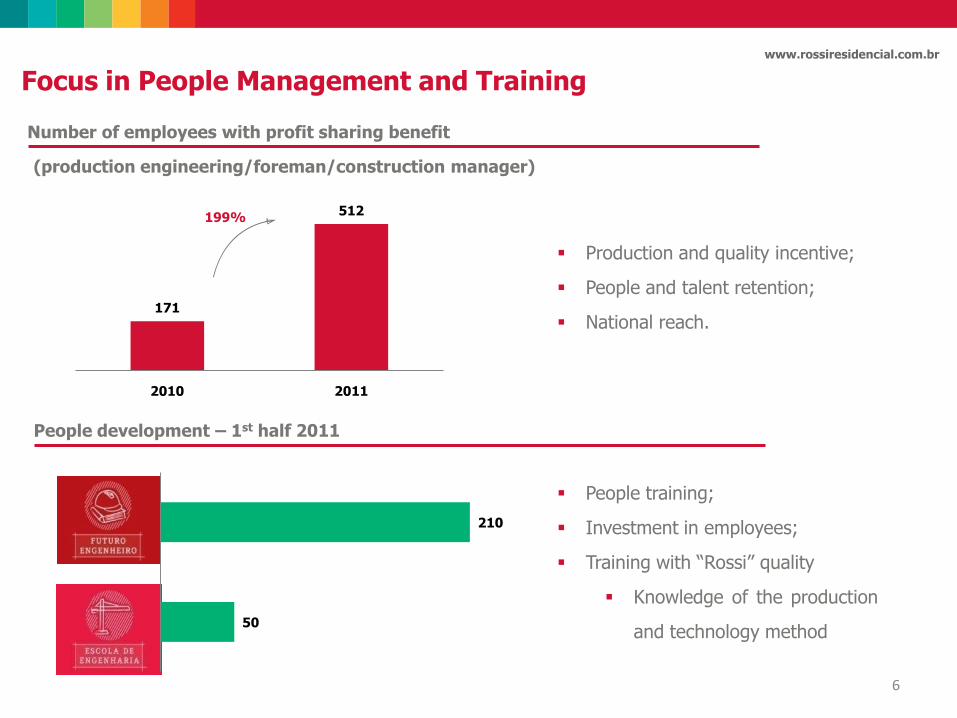
171
512
2010 2011
6
(production engineering/foreman/construction manager)
Focus in People Management and Training
Number of employees with profit sharing benefit
199%
Production and quality incentive;
People and talent retention;
National reach.
People development – 1st half 2011
50
210
People training;
Investment in employees;
Training with “Rossi” quality
Knowledge of the production
and technology method
www.rossiresidencial.com.br
77
Operating
Performance
Rossi Esplanada Business| Brasília – Distrito Federal
29%
24%11%
7%
6%
4%
4%
3%3%
2%1%
Federal District
São Paulo Interior (9 cities)
Rio Grande do Sul
Rio de Janeiro
Amazonas
Espírito Santo
Pará
Mato Grosso
Sergipe
Minas Gerais
São Paulo (RMSP)
Pernambuco
Mato Grosso do Sul
Rio Grande do Norte
Launches by State
8
R$ million
Launches www.rossiresidencial.com.br
Breakdown by Segment (% Rossi) – 1H11 Breakdown by Region (% Rossi) – 1H11
*RMSP – Metropolitan Region of São Paulo
57%29%
14%
Conventional
Low Income
Commercial
Launches by Income Segment
757
1,309 1,328
2,032 387
304 538
345
2Q10 2Q11 1H10 1H11
Rossi Partners
1,144
53%1,613
1,866
2,377
73%
9
Contracted Sales www.rossiresidencial.com.br
R$ million
Breakdown by Segment (% Rossi) – 1H11 Breakdown by Region (% Rossi) 1H11
*RMSP – Metropolitan Region of São Paulo
49%
39%
12%Conventional
Low income
Commercial
Sales by Income Segment
20%
18%
13%10%
10%
9%
4%
4%
4%
3%1%
São Paulo Interior (17 cities)
Federal District
Rio Grande do Sul
São Paulo (RMSP)
Rio de Janeiro
Amazonas
Ceará
Minas Gerais
Goiás
Paraná
Pernambuco
Pará
Rio Grande do Norte
Mato Grosso
Bahia
Sergipe
Santa Catarina
Mato Grosso do Sul
Espírito Santo
Sales by State
710 896
1,376 1,664 195
237
371
493
2Q10 2Q11 1H10 1H11
Rossi Partners
905
1,133
1,747
2,157
26%
21%
1,630 1,603 1,959 2,101 2,006 2,052 2,180 2,364 2,319 2,732
1Q09 2Q09 3Q09 4Q09 1Q10 2Q10 3Q10 4Q10 1Q11 2Q1110
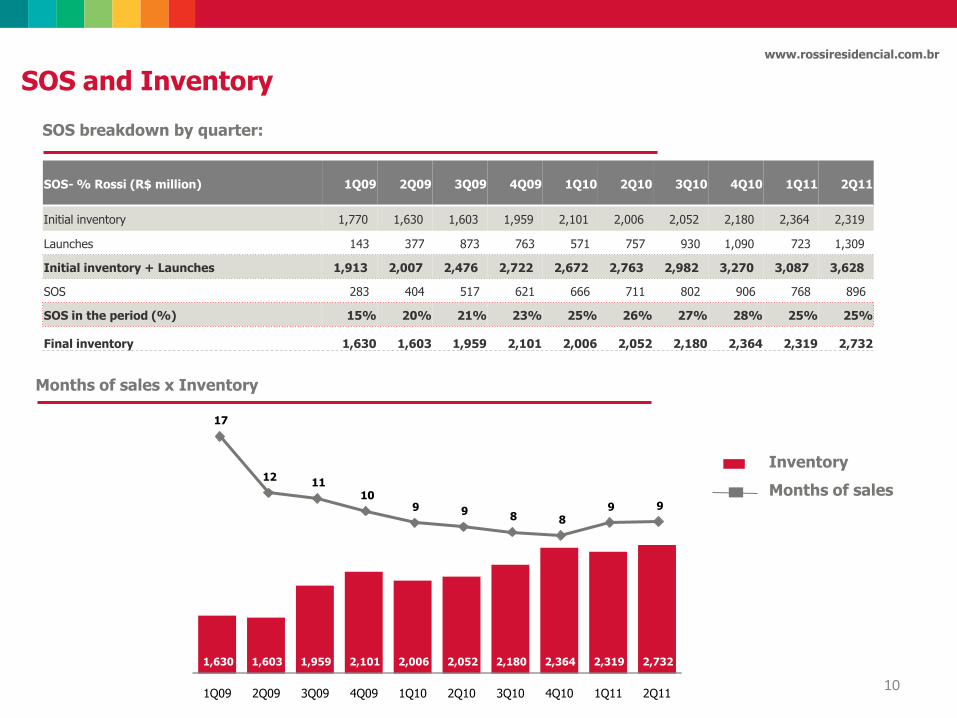
SOS breakdown by quarter:
SOS and Inventorywww.rossiresidencial.com.br
SOS- % Rossi (R$ million) 1Q09 2Q09 3Q09 4Q09 1Q10 2Q10 3Q10 4Q10 1Q11 2Q11
Initial inventory 1,770 1,630 1,603 1,959 2,101 2,006 2,052 2,180 2,364 2,319
Launches 143 377 873 763 571 757 930 1,090 723 1,309
Initial inventory + Launches 1,913 2,007 2,476 2,722 2,672 2,763 2,982 3,270 3,087 3,628
SOS 283 404 517 621 666 711 802 906 768 896
SOS in the period (%) 15% 20% 21% 23% 25% 26% 27% 28% 25% 25%
Final inventory 1,630 1,603 1,959 2,101 2,006 2,052 2,180 2,364 2,319 2,732
Months of sales x Inventory
17
12 11
10 9 9
8 8 9 9
Inventory
Months of sales
11
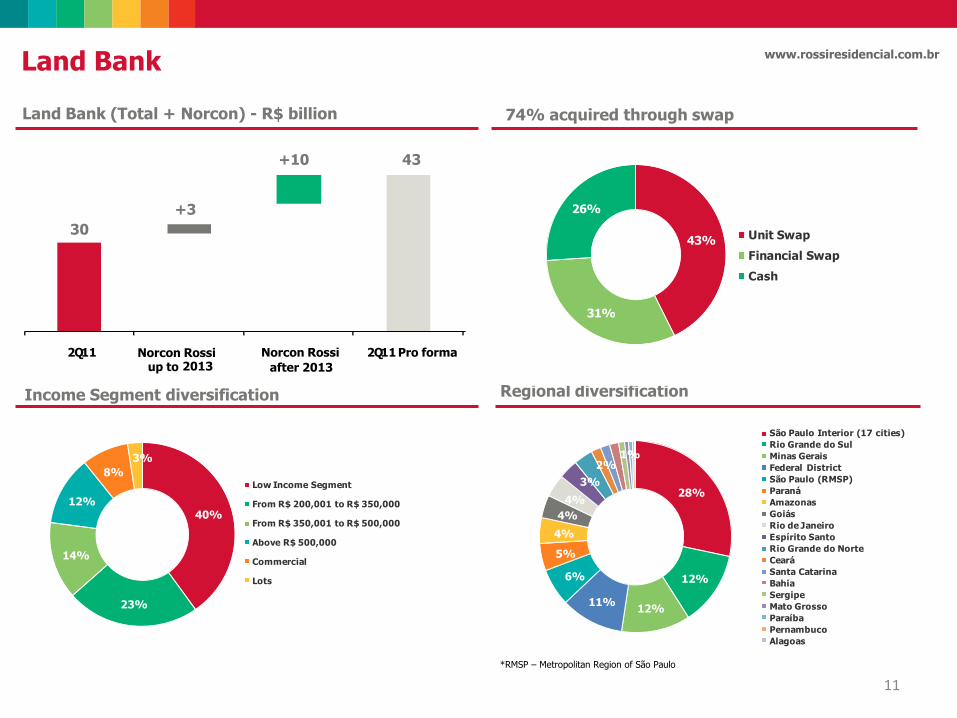
*RMSP – Metropolitan Region of São Paulo
Land Bank www.rossiresidencial.com.br
74% acquired through swap
Regional diversificationIncome Segment diversification
28%
12%
12%11%
6%
5%
4%
4%
4%
3%
2%1%
São Paulo Interior (17 cities)
Rio Grande do Sul
Minas Gerais
Federal District
São Paulo (RMSP)
Paraná
Amazonas
Goiás
Rio de Janeiro
Espírito Santo
Rio Grande do Norte
Ceará
Santa Catarina
Bahia
Sergipe
Mato Grosso
Paraíba
Pernambuco
Alagoas
40%
23%
14%
12%
8%
3%
Low Income Segment
From R$ 200,001 to R$ 350,000
From R$ 350,001 to R$ 500,000
Above R$ 500,000
Commercial
Lots
30
+3
+10 43
Land Bank (Total + Norcon) - R$ billion
2Q11 Norcon Rossi up to 2013
Norcon Rossi
after 2013
2Q11 Pro forma
43%
31%
26%
Unit Swap
Financial Swap
Cash
121212
Financial
Performance
Rossi Ideal Torquato | Amazonas – Manaus
13
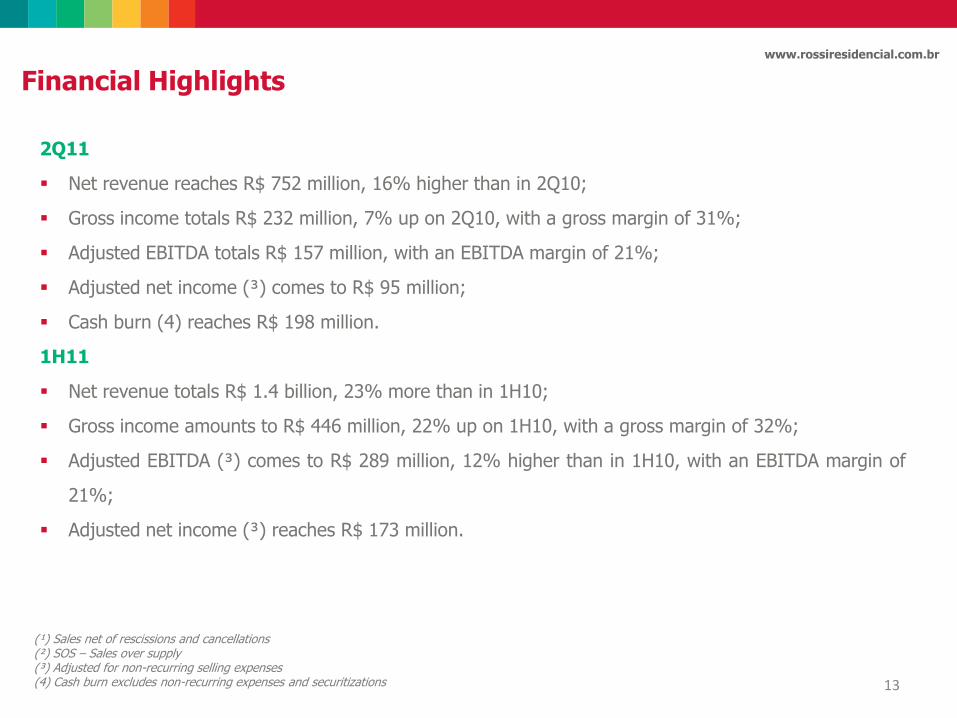
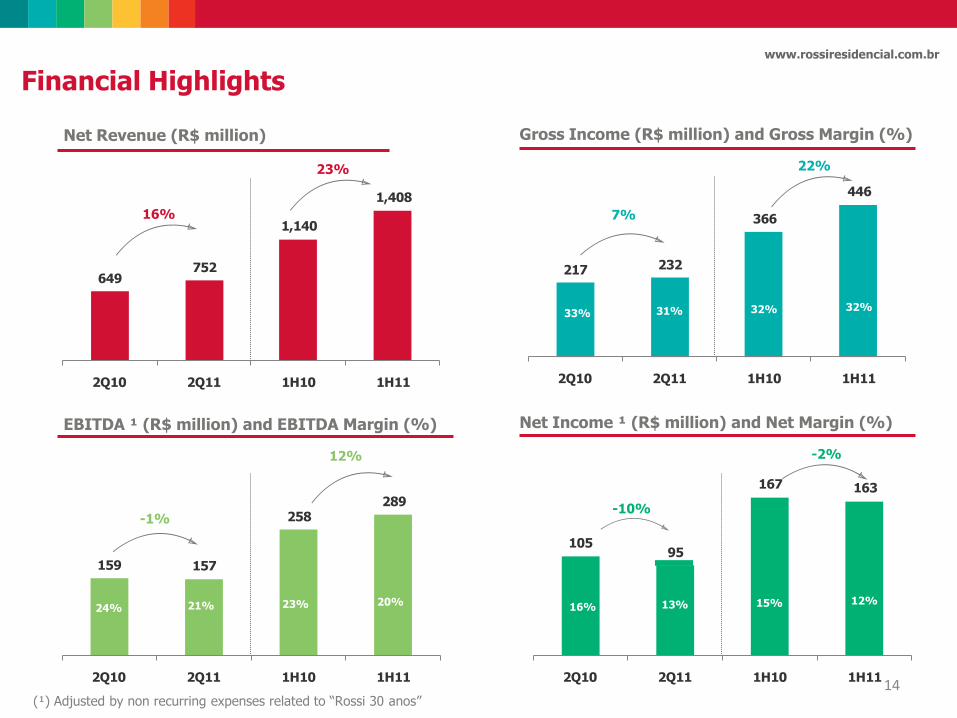
Financial Highlightswww.rossiresidencial.com.br
2Q11
Net revenue reaches R$ 752 million, 16% higher than in 2Q10;
Gross income totals R$ 232 million, 7% up on 2Q10, with a gross margin of 31%;
Adjusted EBITDA totals R$ 157 million, with an EBITDA margin of 21%;
Adjusted net income (³) comes to R$ 95 million;
Cash burn (4) reaches R$ 198 million.
1H11
Net revenue totals R$ 1.4 billion, 23% more than in 1H10;
Gross income amounts to R$ 446 million, 22% up on 1H10, with a gross margin of 32%;
Adjusted EBITDA (³) comes to R$ 289 million, 12% higher than in 1H10, with an EBITDA margin of
21%;
Adjusted net income (³) reaches R$ 173 million.
(¹) Sales net of rescissions and cancellations (²) SOS – Sales over supply(³) Adjusted for non-recurring selling expenses(4) Cash burn excludes non-recurring expenses and securitizations
10595
167 163
2Q10 2Q11 1H10 1H11
159 157
258289
2Q10 2Q11 1H10 1H11
217 232
366
446
2Q10 2Q11 1H10 1H11
649752
1,140
1,408
2Q10 2Q11 1H10 1H11
14
Net Revenue (R$ million) Gross Income (R$ million) and Gross Margin (%)
Financial Highlightswww.rossiresidencial.com.br
7%
33% 31%
EBITDA ¹ (R$ million) and EBITDA Margin (%) Net Income ¹ (R$ million) and Net Margin (%)
22%
32% 32%
-1%
24% 21%
12%
23% 20%
-10%
16% 13%
-2%
15% 12%
16%
23%
(¹) Adjusted by non recurring expenses related to “Rossi 30 anos”
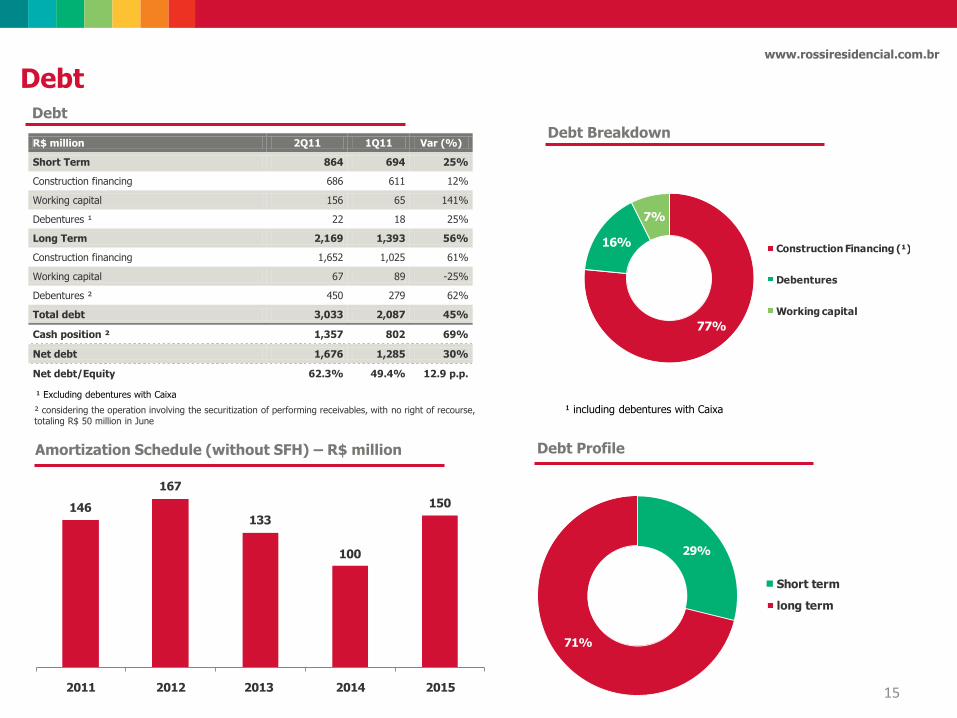
R$ million 2Q11 1Q11 Var (%)
Short Term 864 694 25%
Construction financing 686 611 12%
Working capital 156 65 141%
Debentures ¹ 22 18 25%
Long Term 2,169 1,393 56%
Construction financing 1,652 1,025 61%
Working capital 67 89 -25%
Debentures ² 450 279 62%
Total debt 3,033 2,087 45%
Cash position ² 1,357 802 69%
Net debt 1,676 1,285 30%
Net debt/Equity 62.3% 49.4% 12.9 p.p.
29%
71%
Short term
long term
146
167
133
100
150
2011 2012 2013 2014 2015
Debt Breakdown
Debt Profile
15
Debtwww.rossiresidencial.com.br
Amortization Schedule (without SFH) – R$ million
¹ including debentures with Caixa
¹ Excluding debentures with Caixa
² considering the operation involving the securitization of performing receivables, with no right of recourse, totaling R$ 50 million in June
77%
16%
7%
Construction Financing (¹)
Debentures
Working capital
Debt
16
Equipe de RI
Thank You!
Cássio Elias AudiCFO and IRO
Adriana GodinhoInvestor Relations ManagerPh. (55 11) 4058-2500
Gabriel Spera BorbaInvestor Relations Analyst
Ph. (55 11) 4058-2502
Paula OliveiraInvestor Relations AnalystPh. (55 11) 4058-2503

171717
Q&A