Embed Size (px)
Citation preview

BARCLAY’S GLOBAL CONSUMER STAPLES CONFERENCE
SEPTEMBER 6, 2017
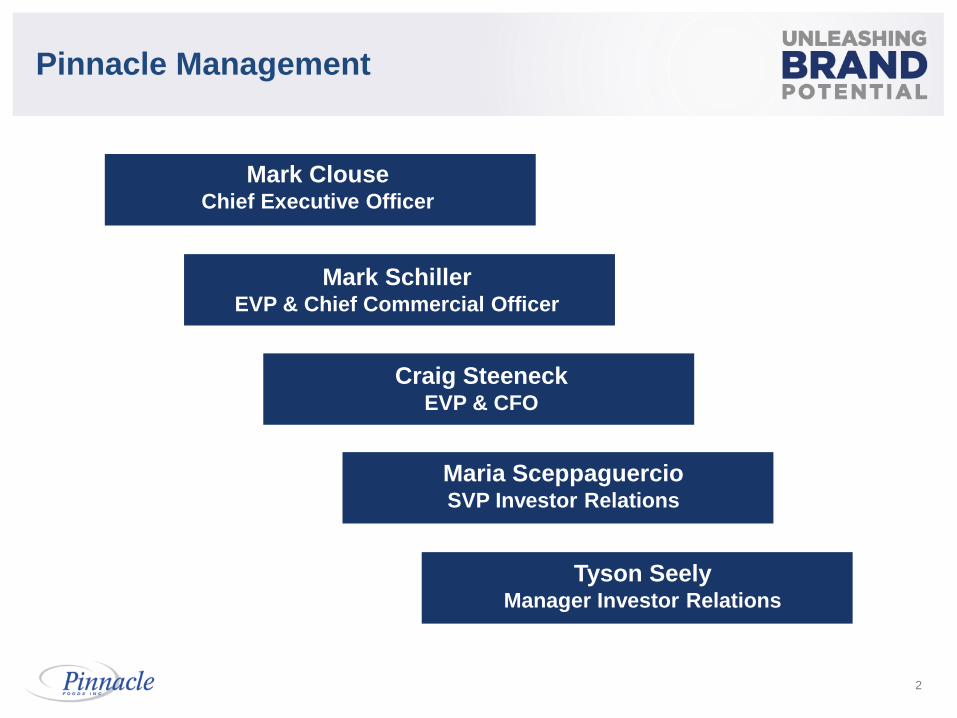
Mark Clouse Chief Executive Officer
Craig Steeneck EVP & CFO
Maria Sceppaguercio SVP Investor Relations
Tyson Seely Manager Investor Relations
Mark Schiller EVP & Chief Commercial Officer
2
Pinnacle Management
Forward-Looking Statements &
Non-GAAP Financial Measures
This presentation contains “forward-looking statements” within the meaning of U.S. federal securities laws. Forward-looking
statements are not historical facts, and are based upon management’s current expectations, beliefs, projections and targets,
many of which, by their nature, are inherently uncertain. Such expectations, beliefs, projections and targets are expressed in
good faith. However, there can be no assurance that management’s expectations, beliefs, projections and targets will be
achieved and actual results may differ materially from what is expressed in or indicated by the forward- looking statements.
Forward-looking statements are subject to significant business, economic, regulatory and competitive risks and uncertainties
that could cause actual performance or results to differ materially from those expressed in the forward-looking statements,
including risks detailed in Pinnacle Foods Inc.’s (“Pinnacle Foods,” “Pinnacle” or the “Company”) filings with the U.S.
Securities and Exchange Commission (the “SEC”). Nothing in this presentation should be regarded as a representation by
any person that these forward-looking statements will be achieved.
Forward-looking statements speak only as of the date the statements are made. The Company assumes no obligation to
update forward-looking statements to reflect actual results, subsequent events or circumstances or other changes affecting
forward-looking information except to the extent required by applicable securities laws.
This presentation includes certain non-GAAP financial measures, which differ from results using U.S. Generally Accepted
Accounting Principles (GAAP). These non-GAAP financial measures should be considered as supplements to the GAAP
reported measures, should not be considered replacements for, or superior to, the GAAP measures and may not be
comparable to similarly named measures used by other companies. Non-GAAP financial measures typically exclude certain
charges, which are not expected to occur routinely in future periods. The Company uses non-GAAP financial measures
internally to focus management on performance excluding these special charges to gauge our business operating
performance. Management believes this information is helpful to investors because it increases transparency, and assists
investors in understanding the underlying performance of the Company and in the analysis of ongoing operating trends.
Additionally, management believes that non-GAAP financial measures are frequently used by analysts and investors in their
evaluation of companies, and its continued inclusion provides consistency in financial reporting and enables analysts and
investors to perform meaningful comparisons of past, present and future operating results. The most directly comparable
GAAP financial measures and reconciliations to non-GAAP financial measures are set forth in the appendix to this
presentation and included in the Company’s filings with the SEC.
3
• The Foundation
• Unleashing Brand Potential
• Financial Performance
• Outlook
4
5
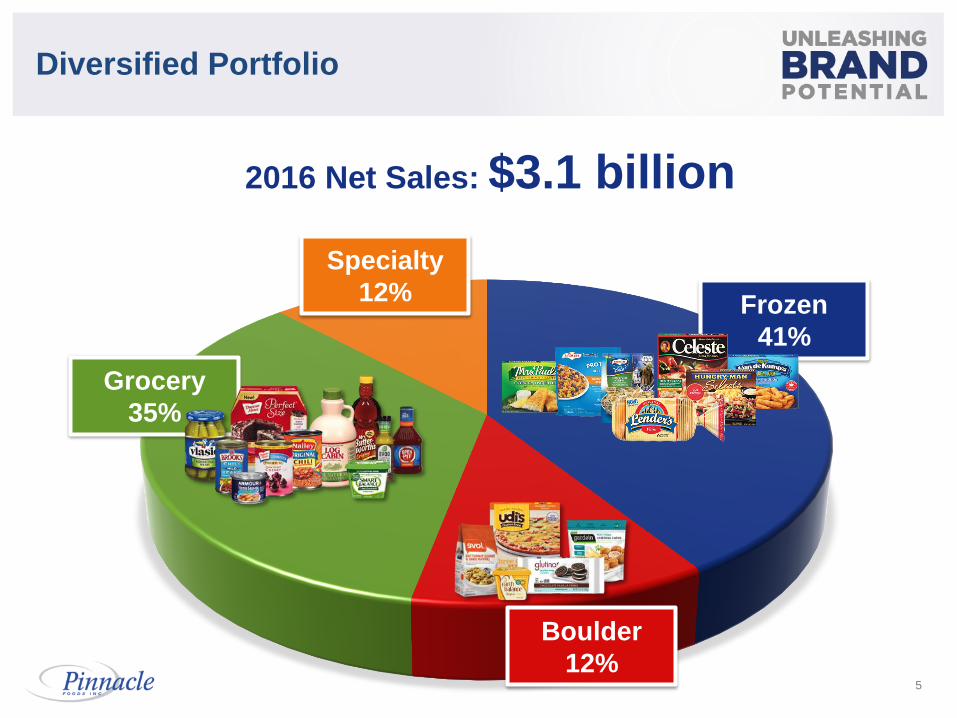
Diversified Portfolio
2016 Net Sales: $3.1 billion
Grocery
35%
Specialty
12%
Boulder
12%
Frozen
41%
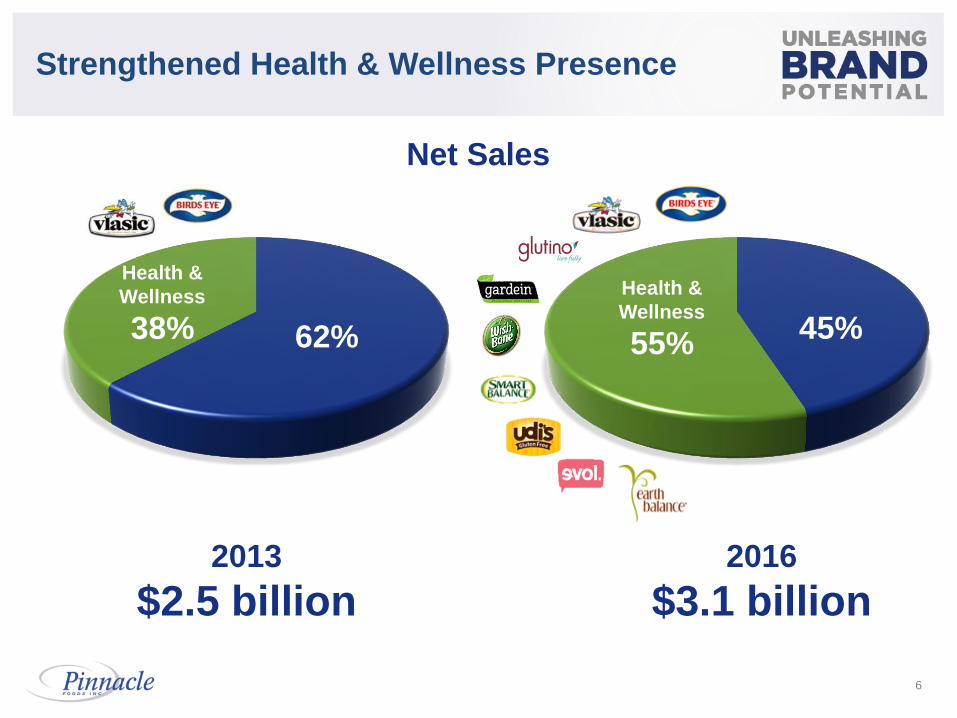
Strengthened Health & Wellness Presence
6
45%
Health &
Wellness
55%
2016
$3.1 billion
2013
$2.5 billion
Health &
Wellness
38% 62%
Net Sales
7
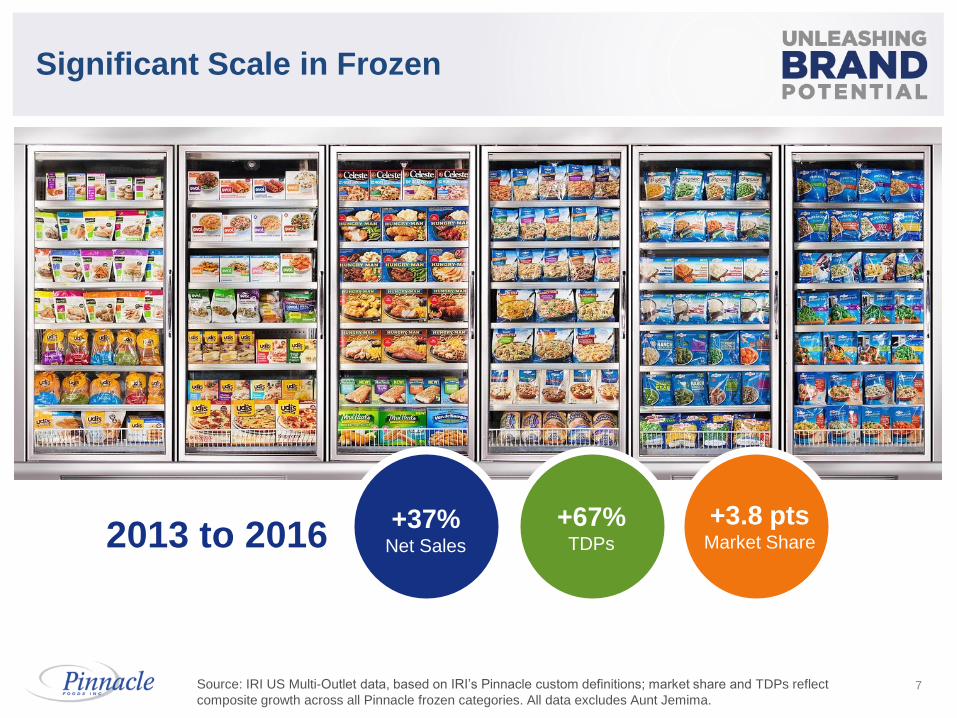
Significant Scale in Frozen
2013 to 2016 +3.8 pts
Market Share
+37% Net Sales
+67% TDPs
Source: IRI US Multi-Outlet data, based on IRI’s Pinnacle custom definitions; market share and TDPs reflect
composite growth across all Pinnacle frozen categories. All data excludes Aunt Jemima.
8
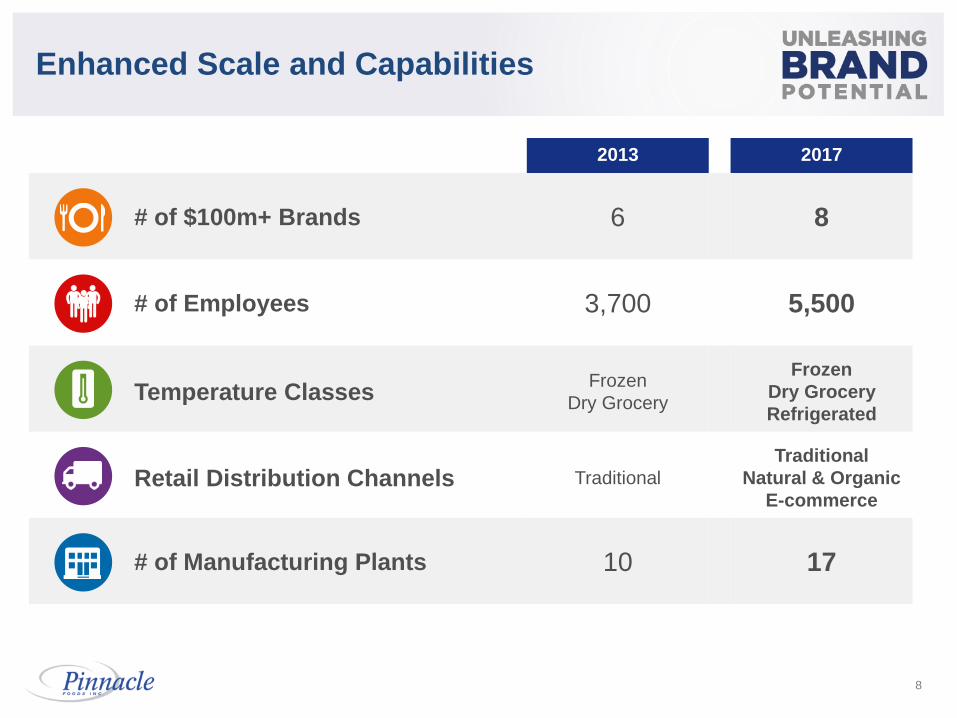
Enhanced Scale and Capabilities
2013 2017
# of $100m+ Brands 6 8
# of Employees 3,700 5,500
Temperature Classes Frozen
Dry Grocery
Frozen
Dry Grocery
Refrigerated
Retail Distribution Channels Traditional
Traditional
Natural & Organic
E-commerce
# of Manufacturing Plants 10 17

9
Macro Trends are Pressuring CPG’s
Consumer Trends Industry Trends
10
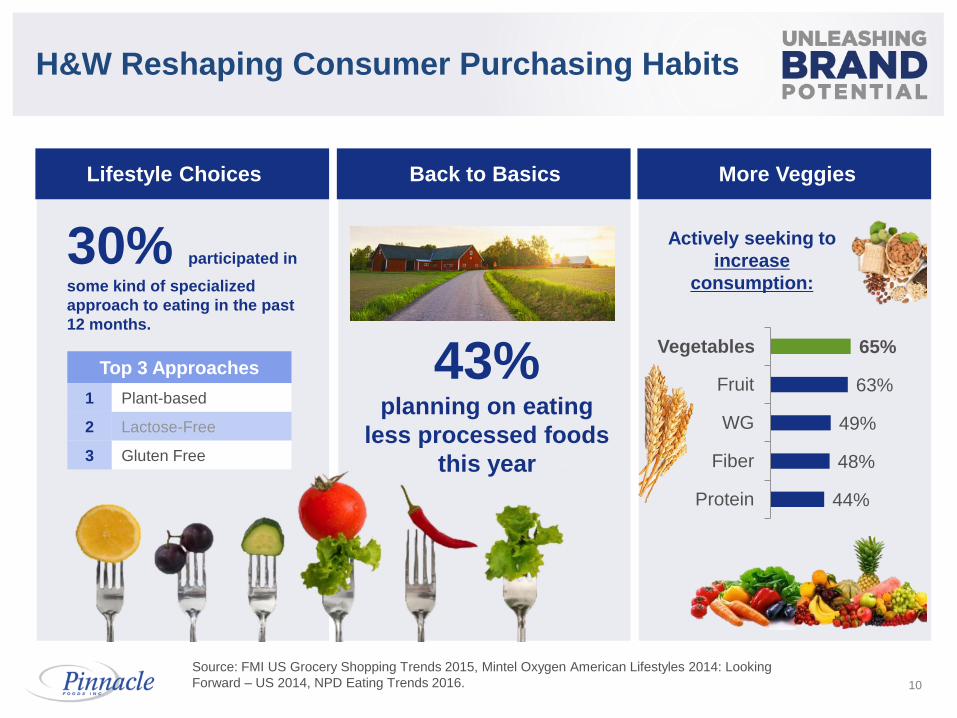
H&W Reshaping Consumer Purchasing Habits
Source: FMI US Grocery Shopping Trends 2015, Mintel Oxygen American Lifestyles 2014: Looking
Forward – US 2014, NPD Eating Trends 2016.
More Veggies
Actively seeking to
increase
consumption:
44%
48%
49%
63%
65%
Protein
Fiber
WG
Fruit
VegetablesVegetables
Lifestyle Choices
30% participated in
some kind of specialized
approach to eating in the past
12 months.
Back to Basics
43% planning on eating
less processed foods
this year
Top 3 Approaches
1 Plant-based
2 Lactose-Free
3 Gluten Free
11
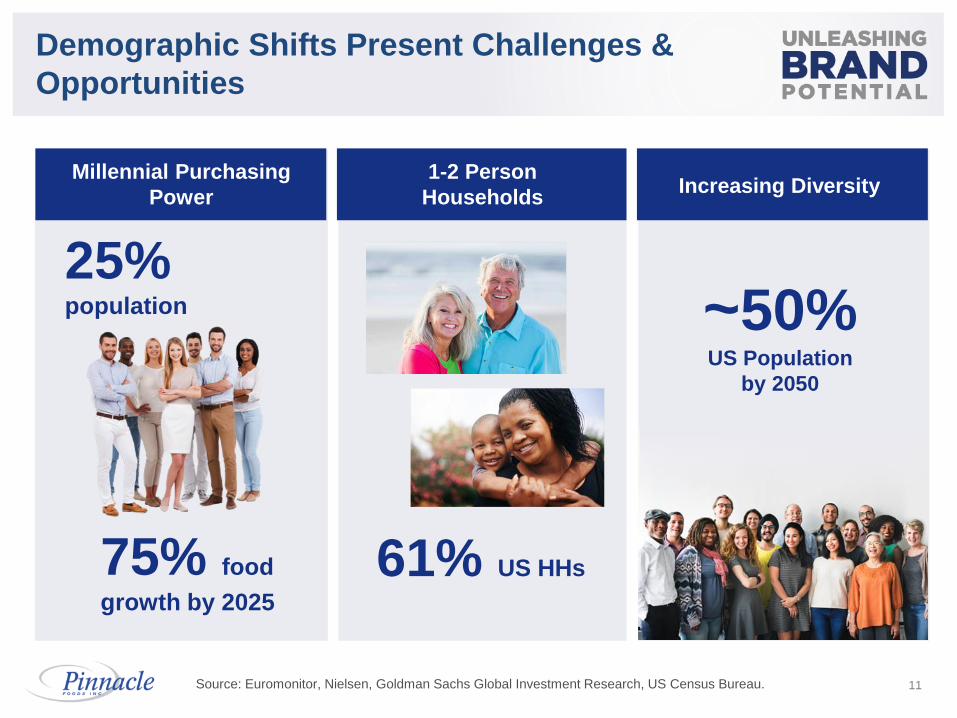
Demographic Shifts Present Challenges &
Opportunities
Source: Euromonitor, Nielsen, Goldman Sachs Global Investment Research, US Census Bureau.
1-2 Person
Households
61% US HHs
Increasing Diversity
~50% US Population
by 2050
Millennial Purchasing
Power
75% food
growth by 2025
25% population

Consumer Trends Industry Trends
12
Food Industry Environment Also Evolving
13
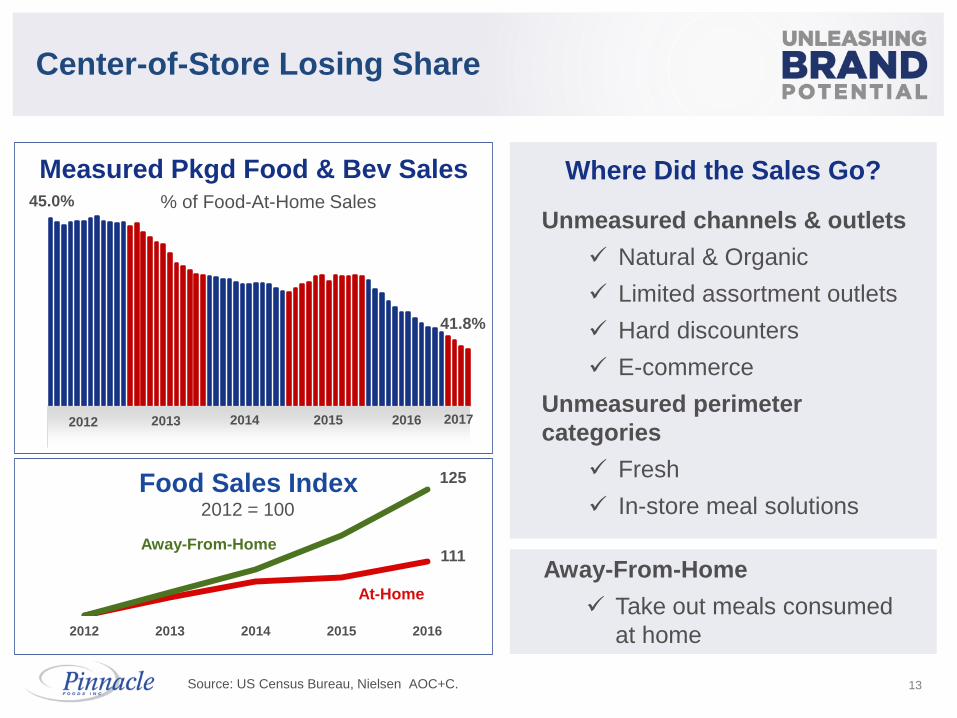
Center-of-Store Losing Share
Measured Pkgd Food & Bev Sales
Unmeasured channels & outlets
Natural & Organic
Limited assortment outlets
Hard discounters
E-commerce
Unmeasured perimeter
categories
Fresh
In-store meal solutions
Where Did the Sales Go?
Away-From-Home
Take out meals consumed
at home
Source: US Census Bureau, Nielsen AOC+C.
45.0%
41.8%
2013 2014 2015 2016 2017 2012
% of Food-At-Home Sales
2012 2013 2014 2015 2016
111 Away-From-Home
125
At-Home
Food Sales Index 2012 = 100
14
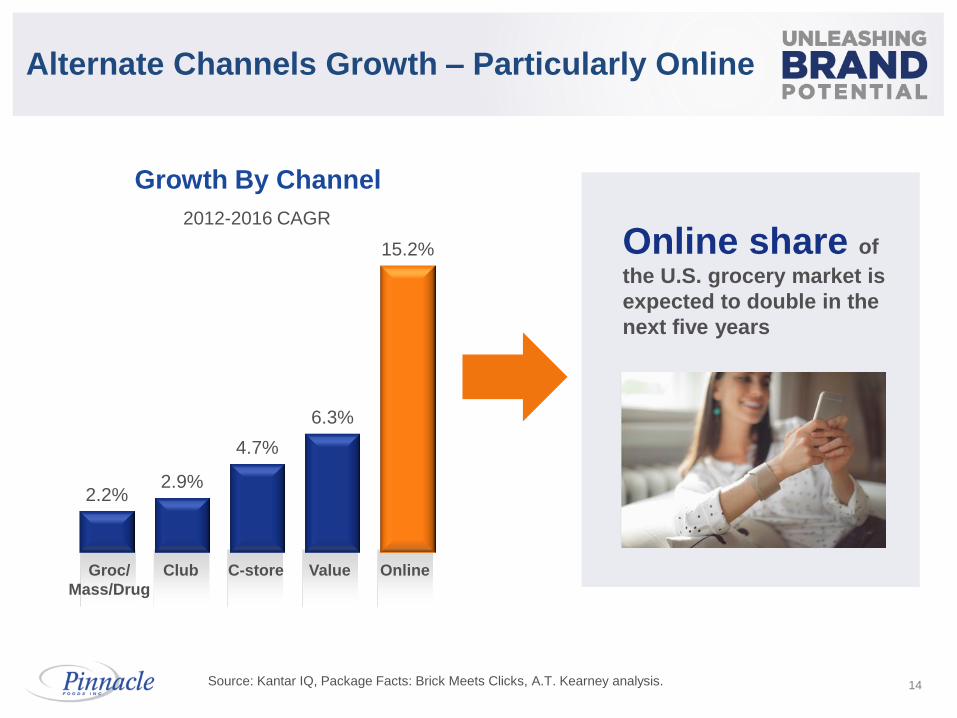
Alternate Channels Growth – Particularly Online
2.2% 2.9%
4.7%
6.3%
15.2%
Online Club C-store Groc/
Mass/Drug
Value
Growth By Channel
2012-2016 CAGR
Source: Kantar IQ, Package Facts: Brick Meets Clicks, A.T. Kearney analysis.
Online share of
the U.S. grocery market is
expected to double in the
next five years
15
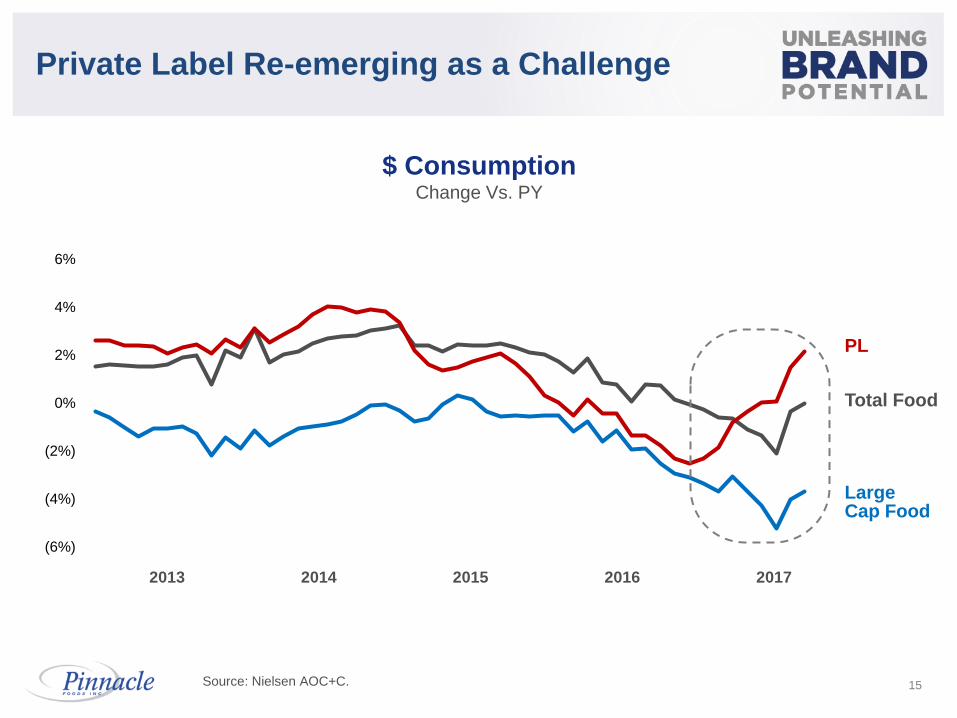
Private Label Re-emerging as a Challenge
Source: Nielsen AOC+C.
$ Consumption Change Vs. PY
(6%)
(4%)
(2%)
0%
2%
4%
6%
PL
Large Cap Food
Total Food
2017 2013 2014 2015 2016
16
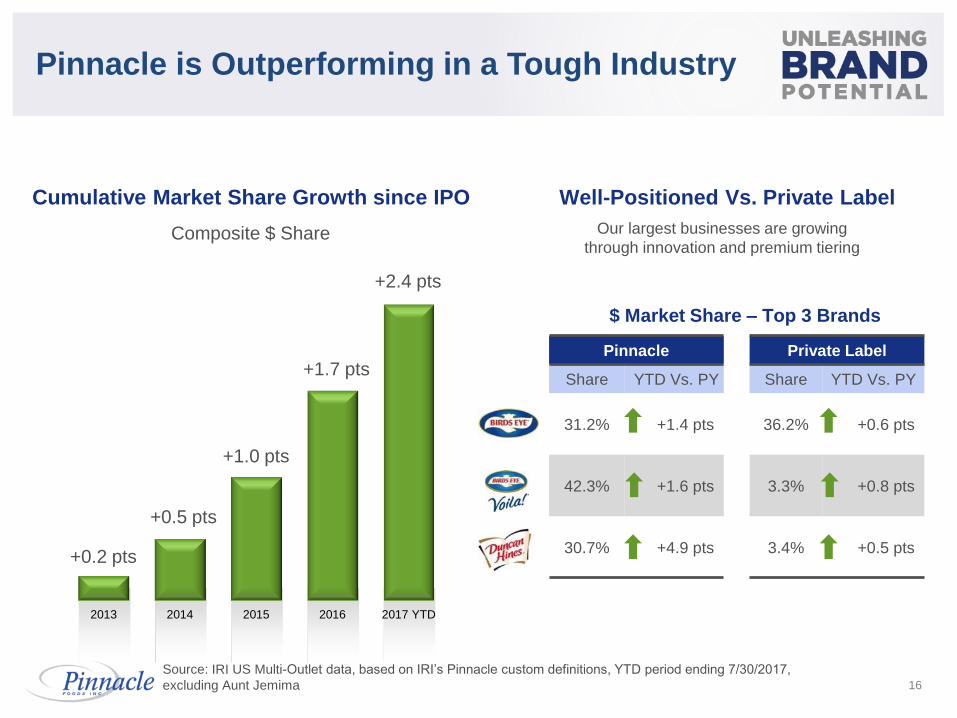
Pinnacle is Outperforming in a Tough Industry
Cumulative Market Share Growth since IPO
Composite $ Share
2013 2014 2015 2016 2017 YTD
+1.7 pts
+1.0 pts
+0.5 pts
+0.2 pts
+2.4 pts
Pinnacle Private Label
Share YTD Vs. PY Share YTD Vs. PY
31.2% +1.4 pts 36.2% +0.6 pts
42.3% +1.6 pts 3.3% +0.8 pts
30.7% +4.9 pts 3.4% +0.5 pts
Well-Positioned Vs. Private Label
$ Market Share – Top 3 Brands
Our largest businesses are growing
through innovation and premium tiering
Source: IRI US Multi-Outlet data, based on IRI’s Pinnacle custom definitions, YTD period ending 7/30/2017,
excluding Aunt Jemima
17
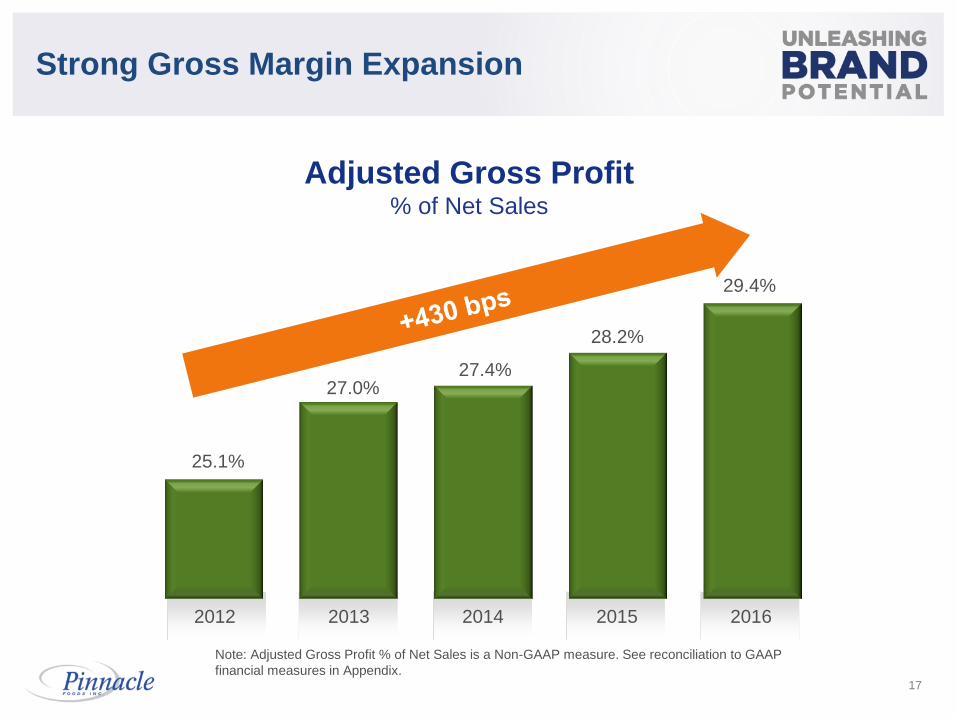
Strong Gross Margin Expansion
Note: Adjusted Gross Profit % of Net Sales is a Non-GAAP measure. See reconciliation to GAAP
financial measures in Appendix.
Adjusted Gross Profit % of Net Sales
25.1%
27.0% 27.4%
28.2%
29.4%
2012 2013 2016 2015 2014
18
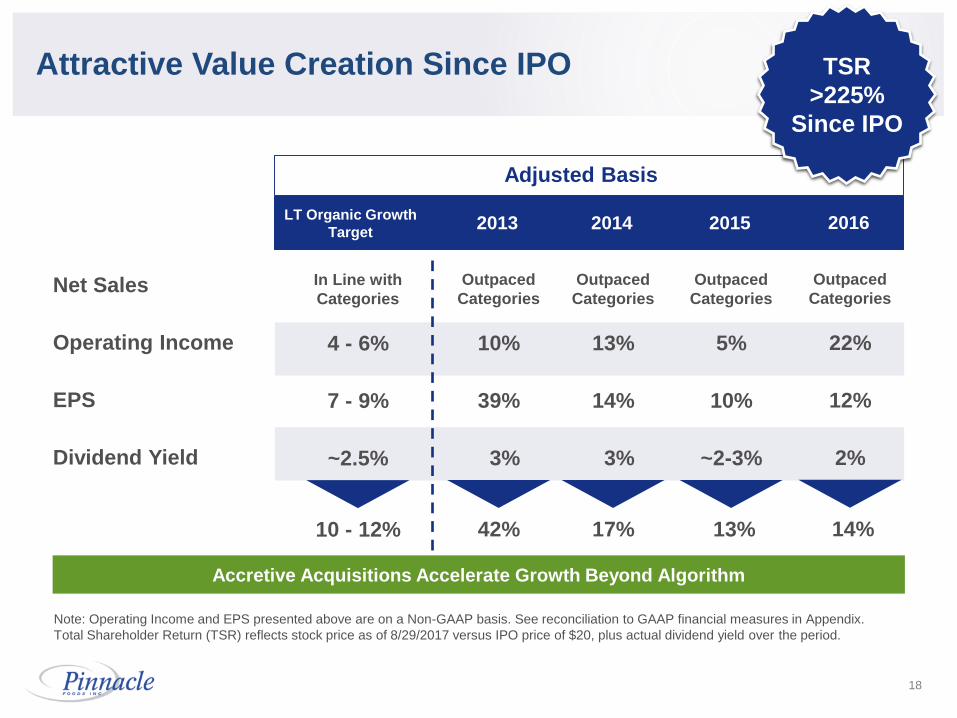
Attractive Value Creation Since IPO
Net Sales
Operating Income
EPS
Dividend Yield
13%
14%
3%
Outpaced
Categories
17%
2013
13%
Outpaced
Categories
10%
39%
3%
Outpaced
Categories
42%
2014 2015
5%
10%
~2-3%
LT Organic Growth
Target
4 - 6%
7 - 9%
~2.5%
In Line with
Categories
10 - 12%
Adjusted Basis
14%
Outpaced
Categories
2016
22%
12%
2%
Note: Operating Income and EPS presented above are on a Non-GAAP basis. See reconciliation to GAAP financial measures in Appendix.
Total Shareholder Return (TSR) reflects stock price as of 8/29/2017 versus IPO price of $20, plus actual dividend yield over the period.
TSR
>225%
Since IPO
Accretive Acquisitions Accelerate Growth Beyond Algorithm

19
• The Foundation
• Unleashing Brand Potential
• Financial Performance
• Outlook
20
21
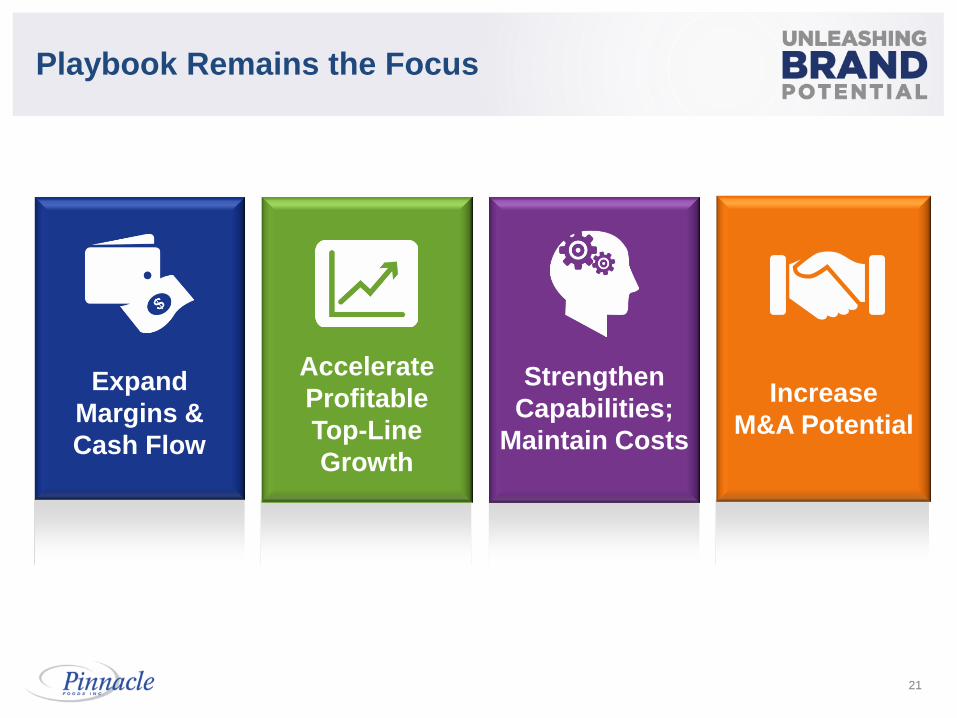
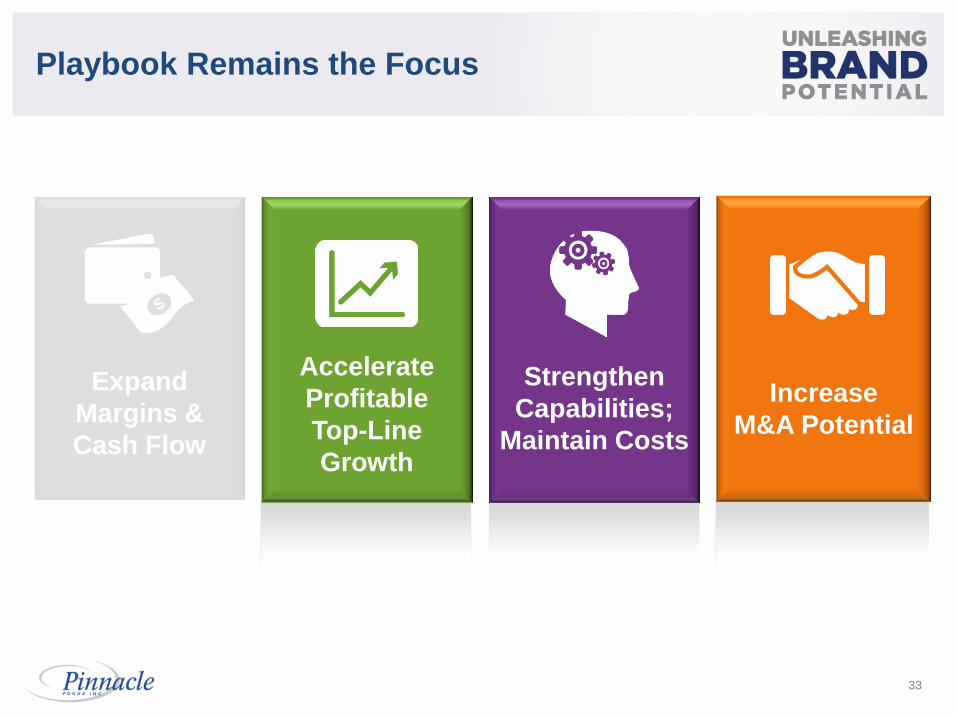
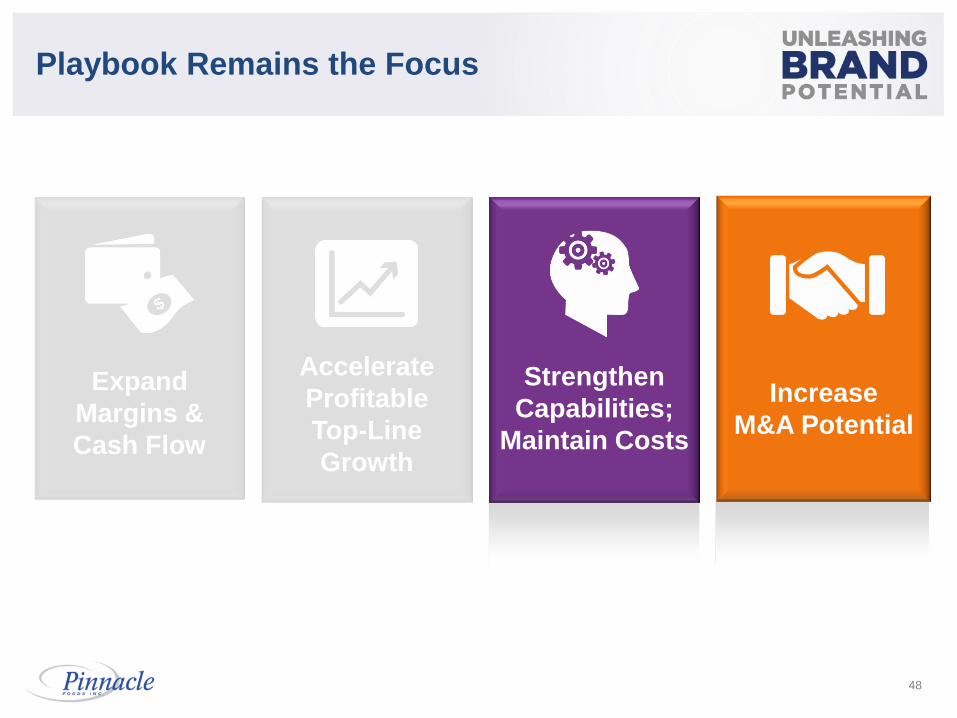
Playbook Remains the Focus
Increase
M&A Potential
Strengthen
Capabilities;
Maintain Costs
Expand
Margins &
Cash Flow
Accelerate
Profitable
Top-Line
Growth
22
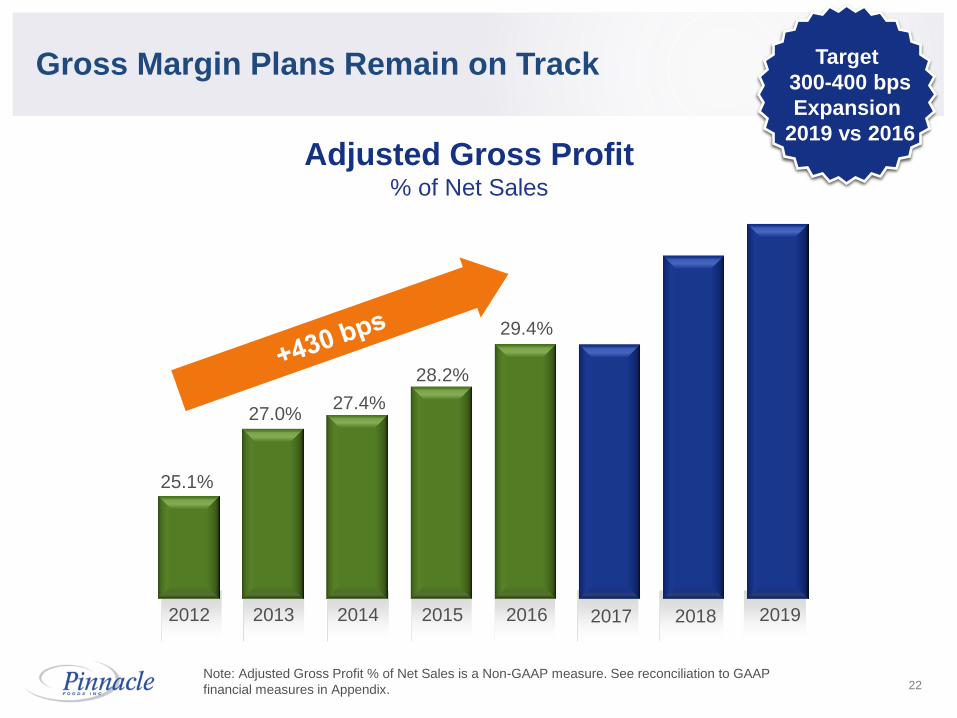
Gross Margin Plans Remain on Track
Note: Adjusted Gross Profit % of Net Sales is a Non-GAAP measure. See reconciliation to GAAP
financial measures in Appendix.
Adjusted Gross Profit % of Net Sales
25.1%
27.0% 27.4%
28.2%
29.4%
2012 2013 2016 2015 2014 2019 2017 2018
Target
300-400 bps
Expansion
2019 vs 2016
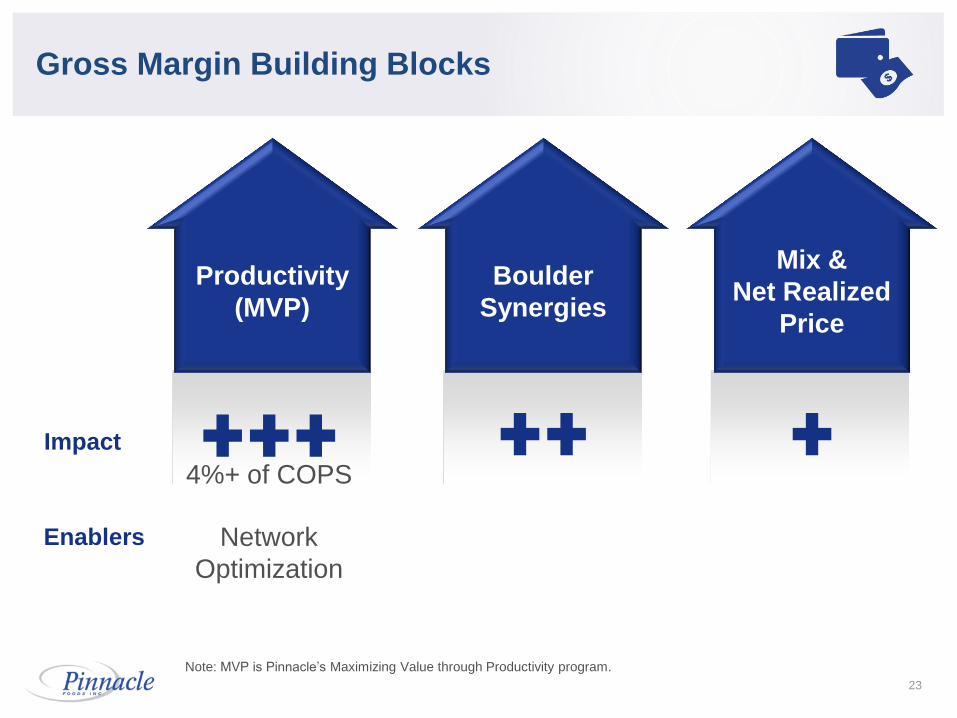
Mix &
Net Realized
Price
Boulder
Synergies
Productivity
(MVP)
23
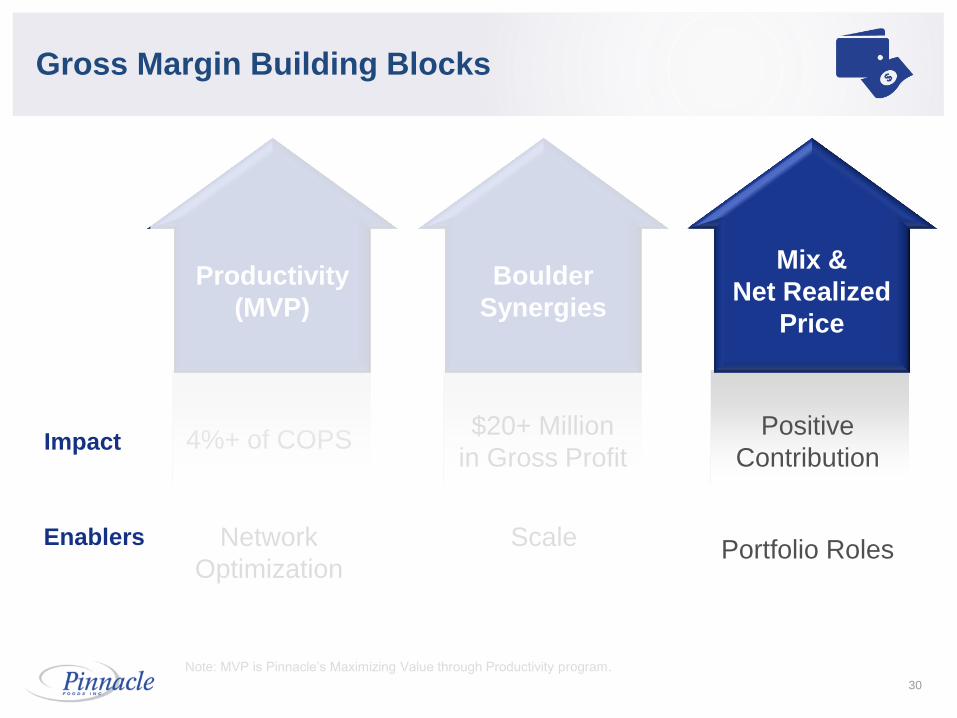
Gross Margin Building Blocks
Note: MVP is Pinnacle’s Maximizing Value through Productivity program.
Network
Optimization
Enablers
Impact
4%+ of COPS
24
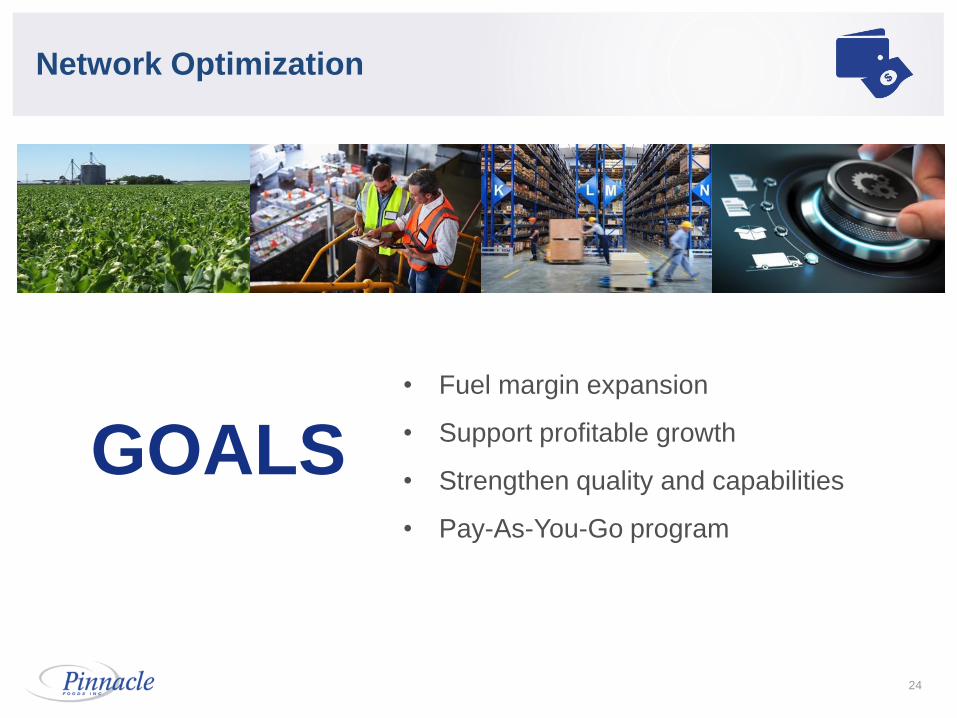
Network Optimization
Goals • Fuel margin expansion
• Support profitable growth
• Strengthen quality and capabilities
• Pay-As-You-Go program
GOALS
25
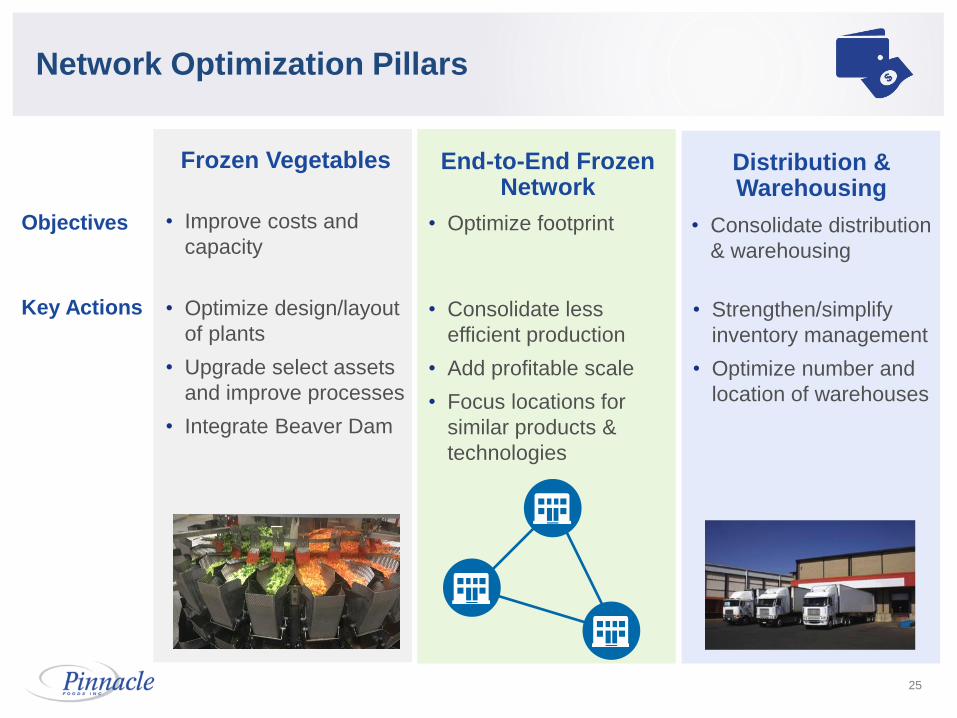
Network Optimization Pillars
End-to-End Frozen Network
Distribution & Warehousing
Frozen Vegetables
Objectives
Key Actions
• Improve costs and
capacity
• Optimize design/layout
of plants
• Upgrade select assets
and improve processes
• Integrate Beaver Dam
• Consolidate distribution
& warehousing
• Strengthen/simplify
inventory management
• Optimize number and
location of warehouses
• Optimize footprint
• Consolidate less
efficient production
• Add profitable scale
• Focus locations for
similar products &
technologies
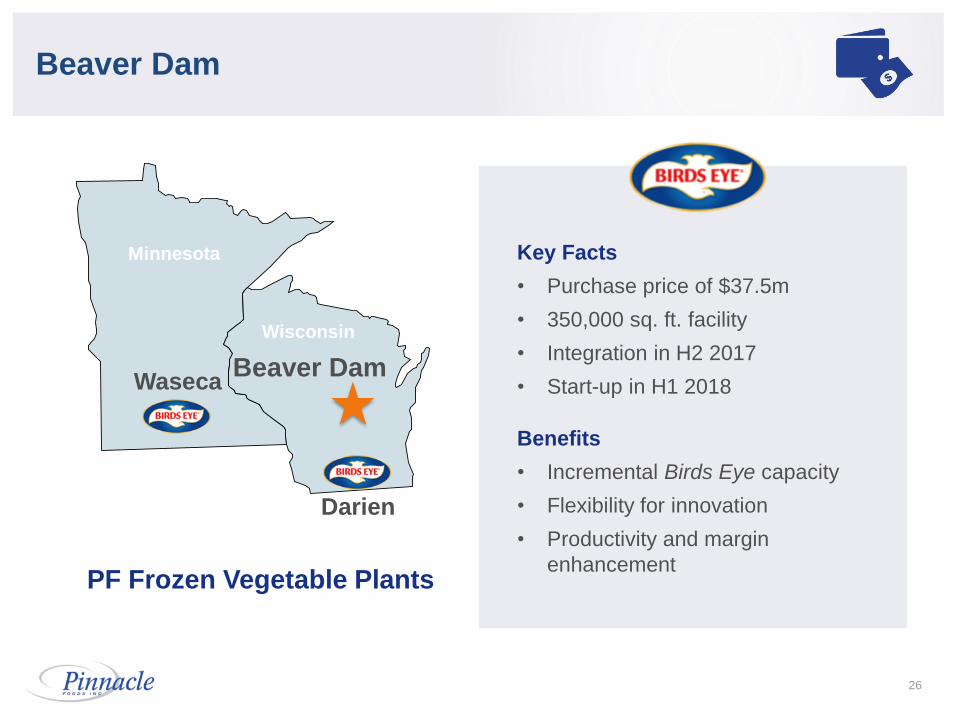
Beaver Dam
26
Key Facts
• Purchase price of $37.5m
• 350,000 sq. ft. facility
• Integration in H2 2017
• Start-up in H1 2018
Benefits
• Incremental Birds Eye capacity
• Flexibility for innovation
• Productivity and margin
enhancement
PF Frozen Vegetable Plants
Minnesota
Wisconsin
Waseca
Darien
Beaver Dam
27
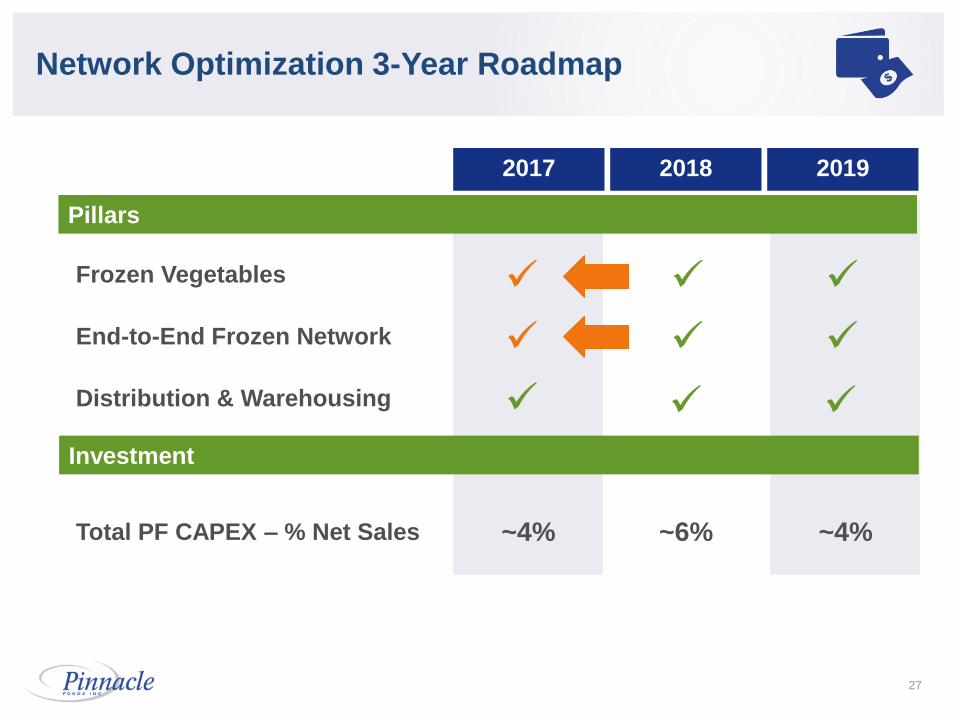
Network Optimization 3-Year Roadmap
2017 2018 2019
~4% ~6%
~4%
End-to-End Frozen Network
Distribution & Warehousing
Frozen Vegetables
Total PF CAPEX – % Net Sales
Pillars
Investment
4%+ of COPS
Mix &
Net Realized
Price
Boulder
Synergies
Productivity
(MVP)
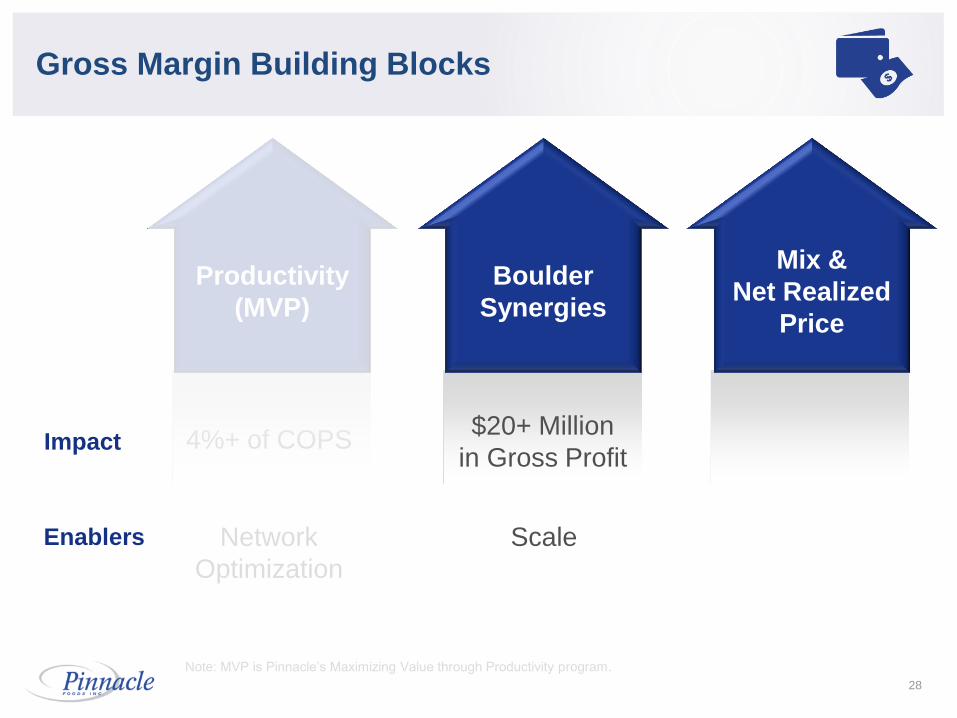
28
Gross Margin Building Blocks
Note: MVP is Pinnacle’s Maximizing Value through Productivity program.
Network
Optimization
Scale Enablers
Impact $20+ Million
in Gross Profit
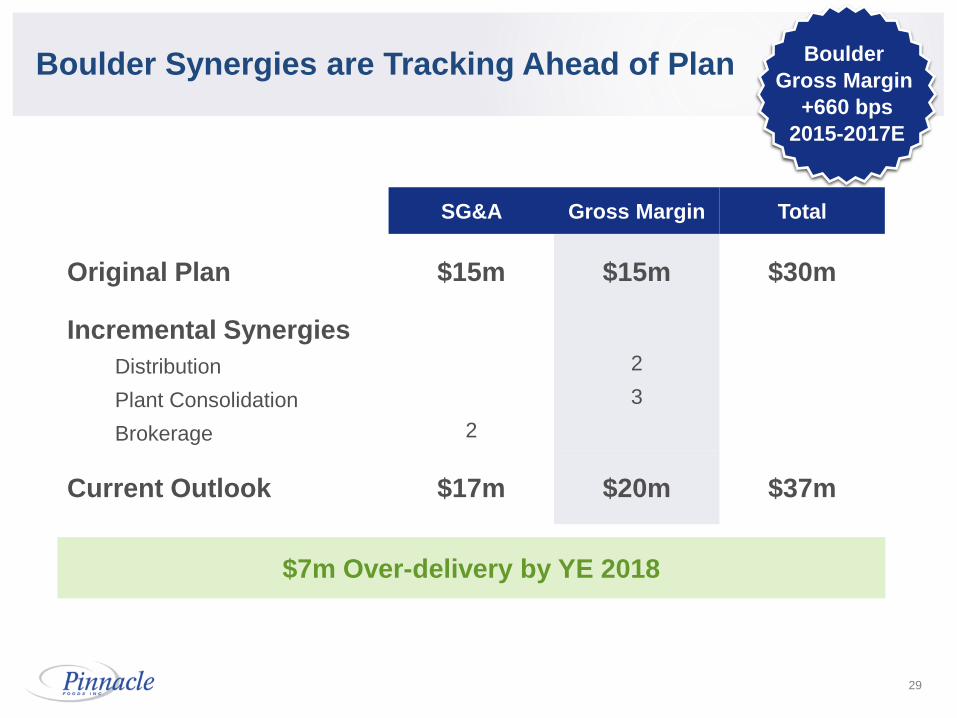
SG&A Gross Margin Total
Original Plan $15m $15m $30m
Incremental Synergies
Distribution
Plant Consolidation
Brokerage
2
2
3
Current Outlook $17m $20m $37m
29
Boulder Synergies are Tracking Ahead of Plan Boulder
Gross Margin
+660 bps
2015-2017E
$7m Over-delivery by YE 2018
4%+ of COPS
Mix &
Net Realized
Price
Boulder
Synergies
Productivity
(MVP)
30
Gross Margin Building Blocks
Note: MVP is Pinnacle’s Maximizing Value through Productivity program.
Network
Optimization
Scale Portfolio Roles
Enablers
Impact $20+ Million
in Gross Profit
Positive
Contribution
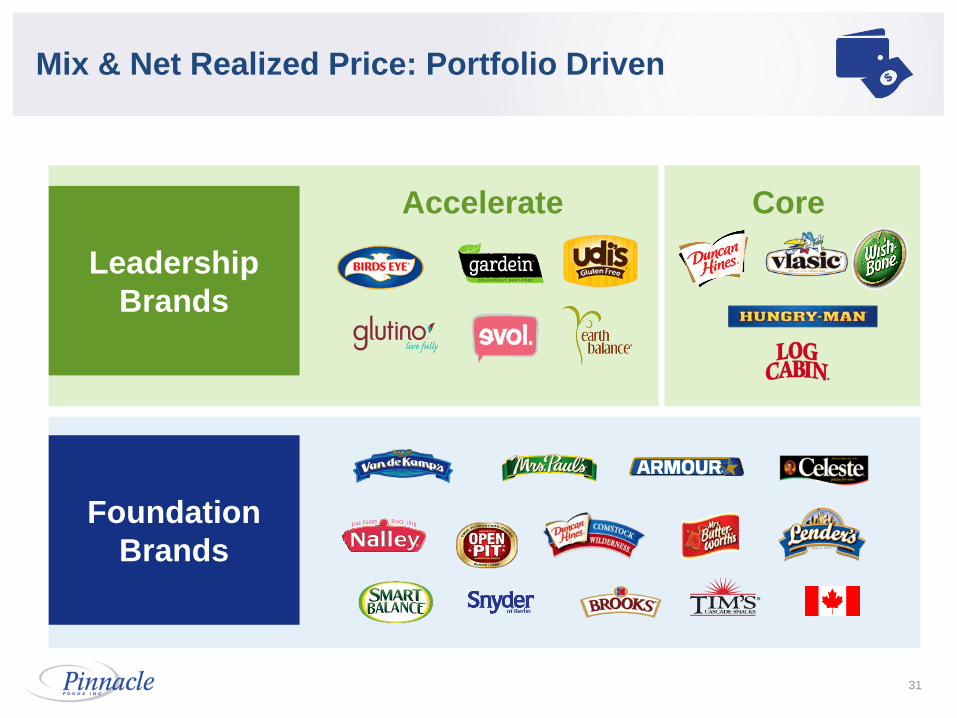
Leadership
Brands
31
Mix & Net Realized Price: Portfolio Driven
Foundation
Brands
Accelerate Core
Leadership
Brands
Foundation
Brands
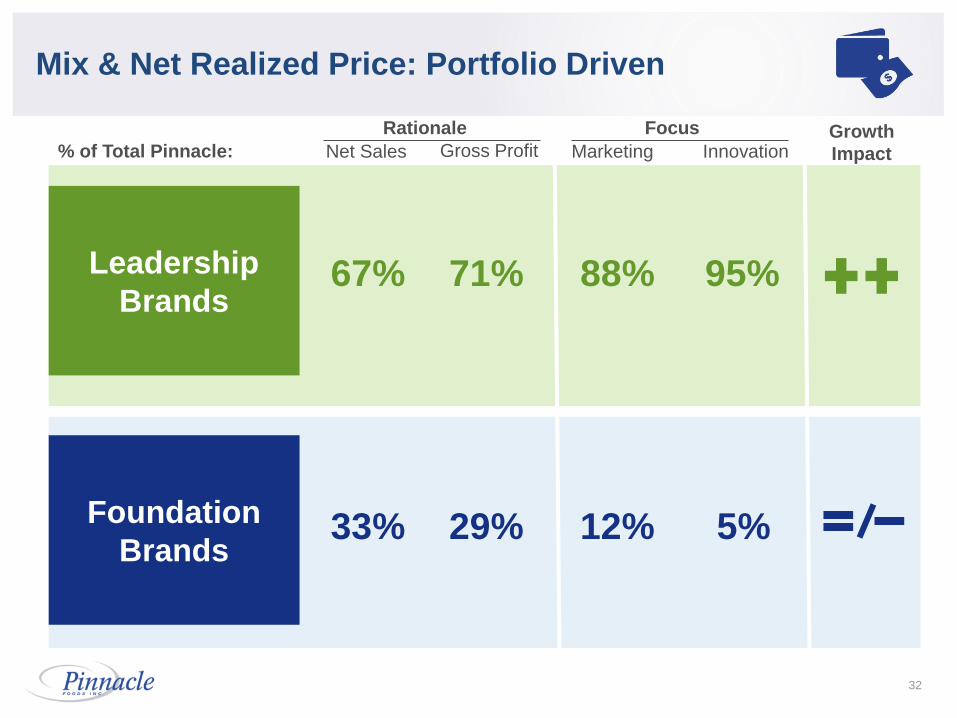
Mix & Net Realized Price: Portfolio Driven
% of Total Pinnacle:
67% 71%
33% 29%
Net Sales Gross Profit
Rationale Growth
Impact
88% 95%
12% 5%
Innovation Marketing
Focus
32
33
Playbook Remains the Focus
Increase
M&A Potential
Strengthen
Capabilities;
Maintain Costs
Accelerate
Profitable
Top-Line
Growth
Expand
Margins &
Cash Flow
34
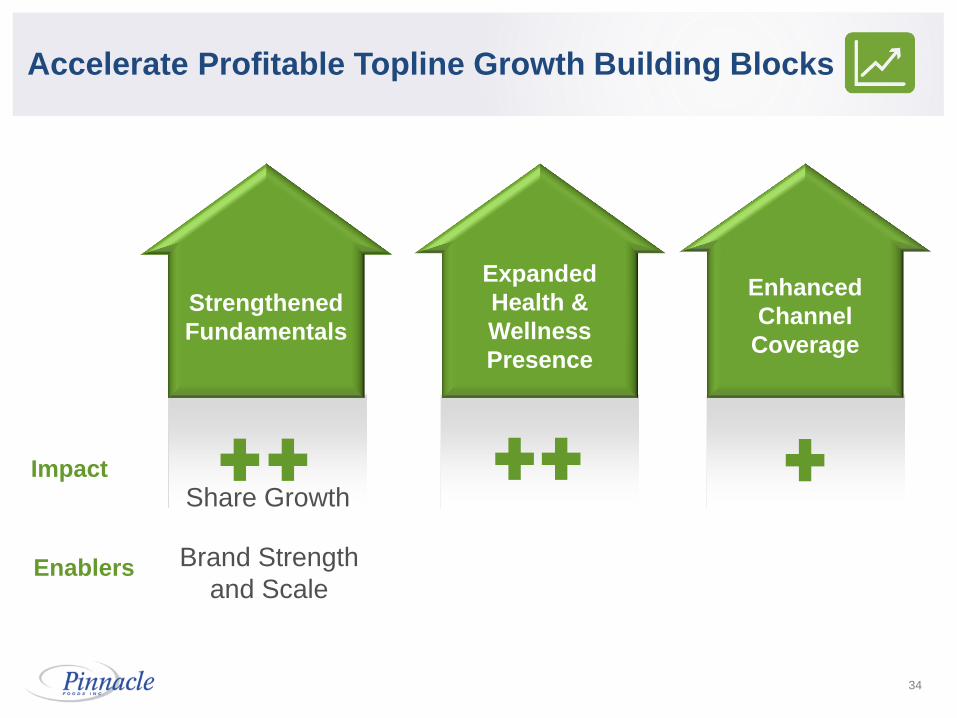
Accelerate Profitable Topline Growth Building Blocks
Strengthened
Fundamentals
Expanded
Health &
Wellness
Presence
Enhanced
Channel
Coverage
Impact
Brand Strength
and Scale Enablers
Share Growth
35
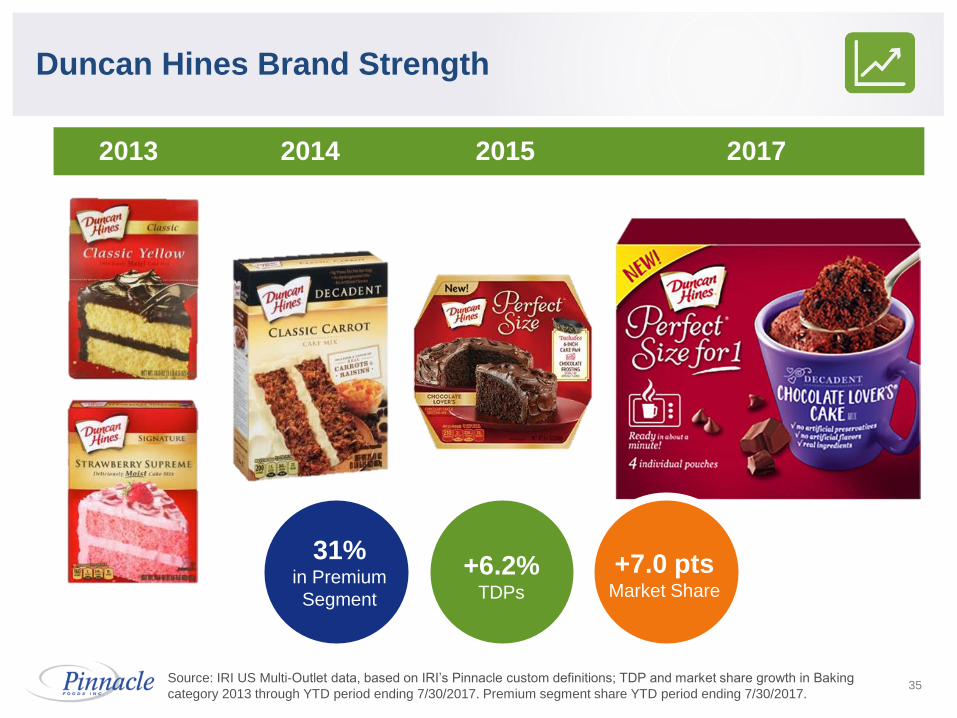
Duncan Hines Brand Strength
31% in Premium
Segment
+6.2% TDPs
Source: IRI US Multi-Outlet data, based on IRI’s Pinnacle custom definitions; TDP and market share growth in Baking
category 2013 through YTD period ending 7/30/2017. Premium segment share YTD period ending 7/30/2017.
2013 2014 2015 2017
+7.0 pts Market Share
36
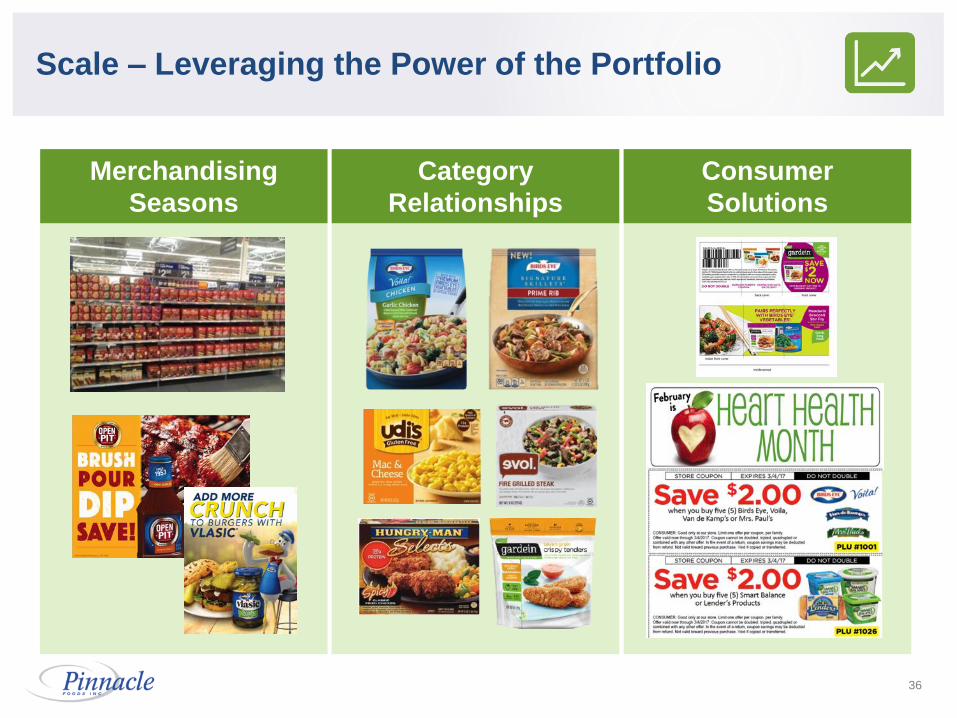
Scale – Leveraging the Power of the Portfolio
Merchandising
Seasons
Category
Relationships
Consumer
Solutions
Brand Strength
and Scale
37
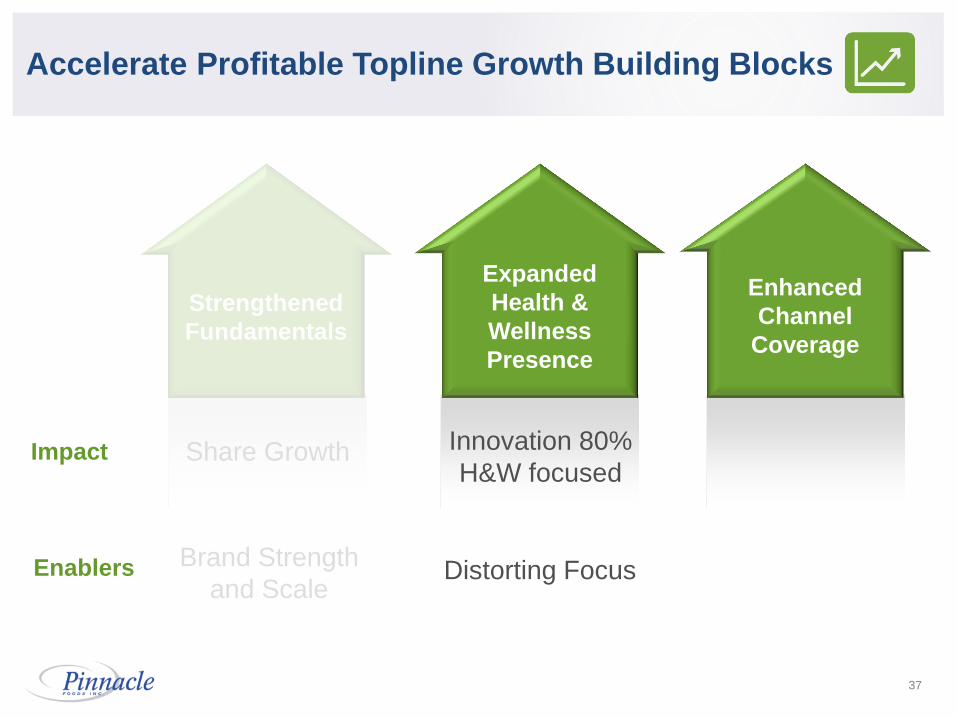
Accelerate Profitable Topline Growth Building Blocks
Strengthened
Fundamentals
Expanded
Health &
Wellness
Presence
Enhanced
Channel
Coverage
Impact
Distorting Focus
Share Growth Innovation 80%
H&W focused
Enablers
38
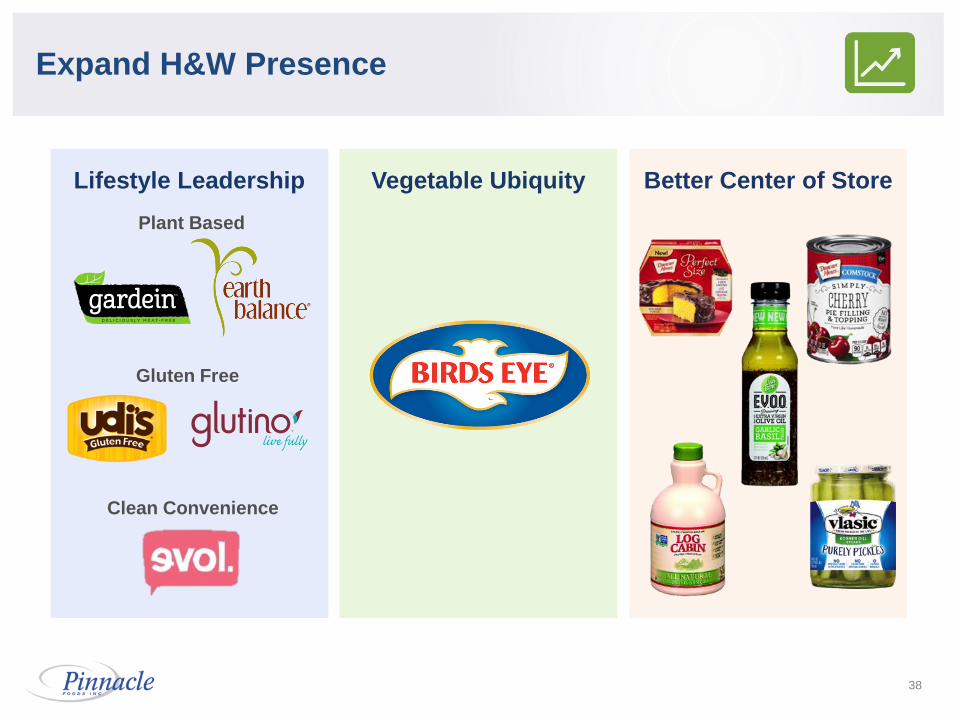
Expand H&W Presence
Vegetable Ubiquity Lifestyle Leadership
Plant Based
Clean Convenience
Gluten Free
Better Center of Store
39
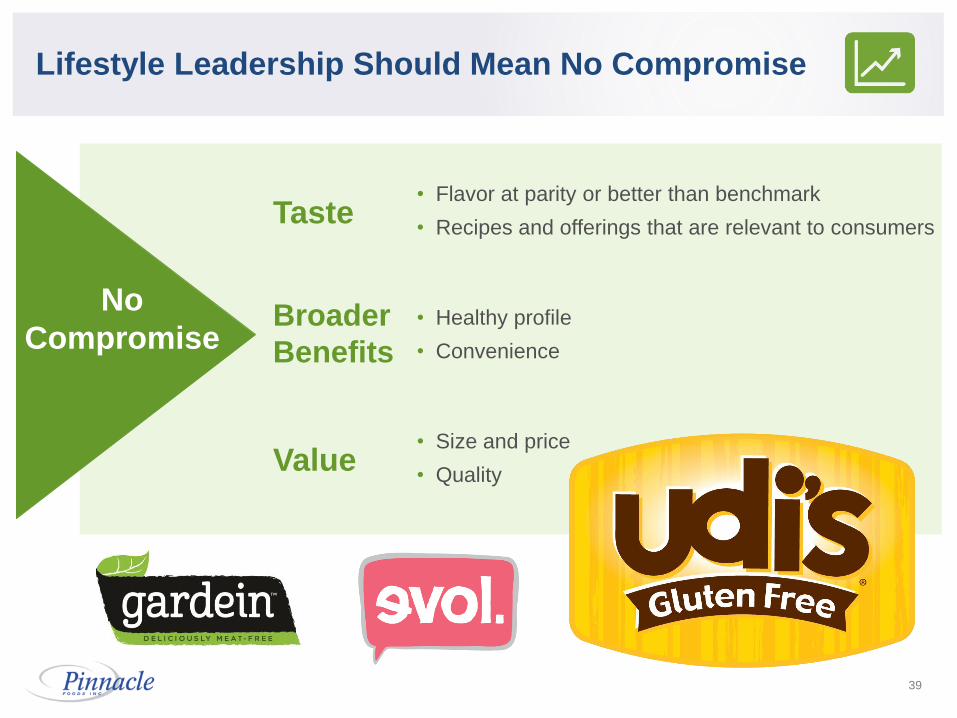
Lifestyle Leadership Should Mean No Compromise
Taste
Broader
Benefits
Value
• Flavor at parity or better than benchmark
• Recipes and offerings that are relevant to consumers
• Healthy profile
• Convenience
• Size and price
• Quality
No
Compromise

40
Udi’s Gluten Free Bread
Finally, a Gluten Free bread with slice size,
texture and taste of Gluten bread
Udi’s eliminates the compromise for
Gluten Free Bread Consumers
Bigger Slices
1 Incredible Taste
3 Better Texture
2
January 2018
Launch
41
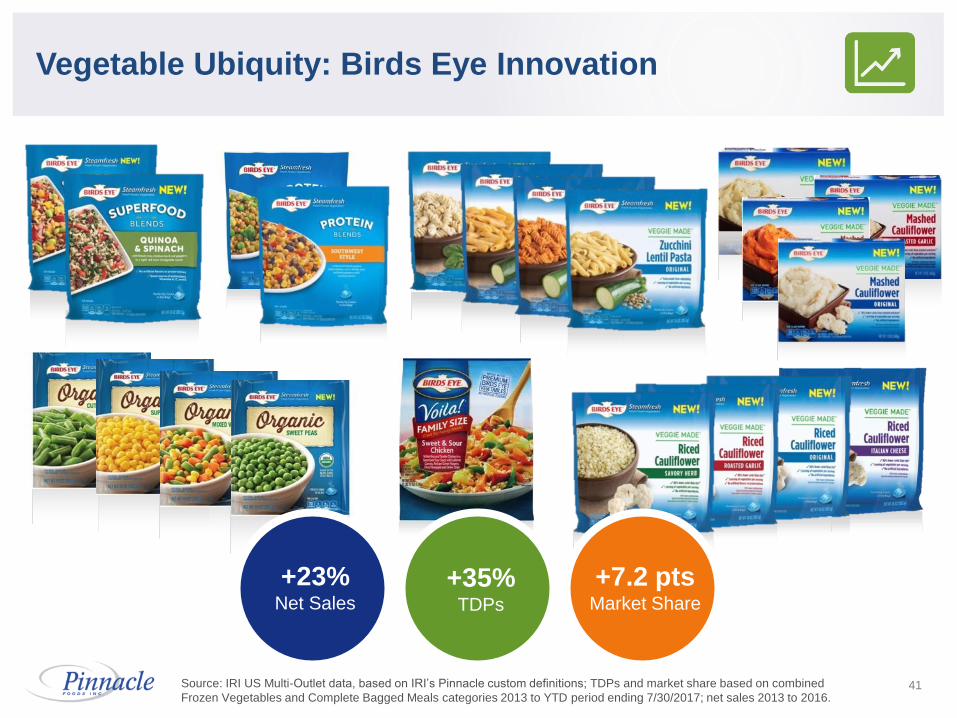
Vegetable Ubiquity: Birds Eye Innovation
Source: IRI US Multi-Outlet data, based on IRI’s Pinnacle custom definitions; TDPs and market share based on combined
Frozen Vegetables and Complete Bagged Meals categories 2013 to YTD period ending 7/30/2017; net sales 2013 to 2016.
+7.2 pts Market Share
+23% Net Sales
+35% TDPs
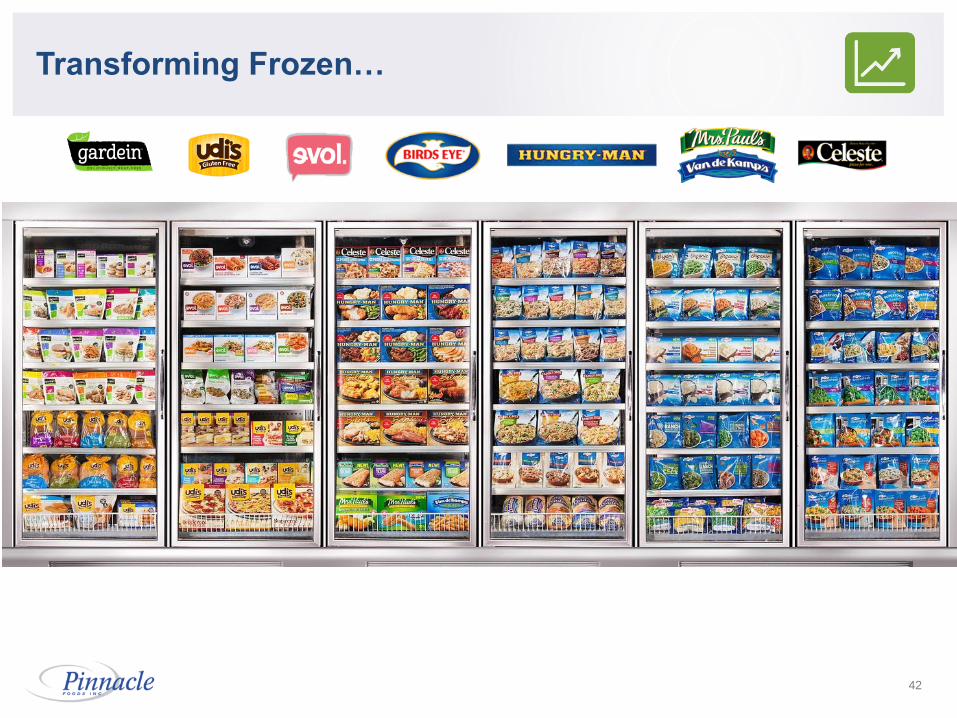
Transforming Frozen…
42
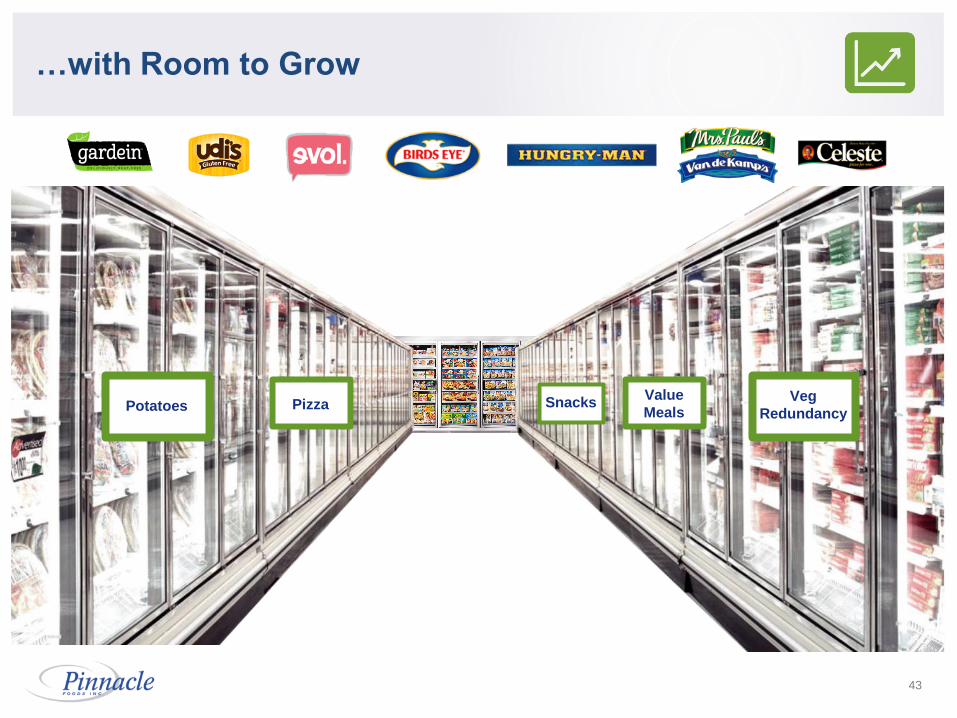
Veg
Redundancy
Value
Meals Snacks Potatoes Pizza
…with Room to Grow
43
44
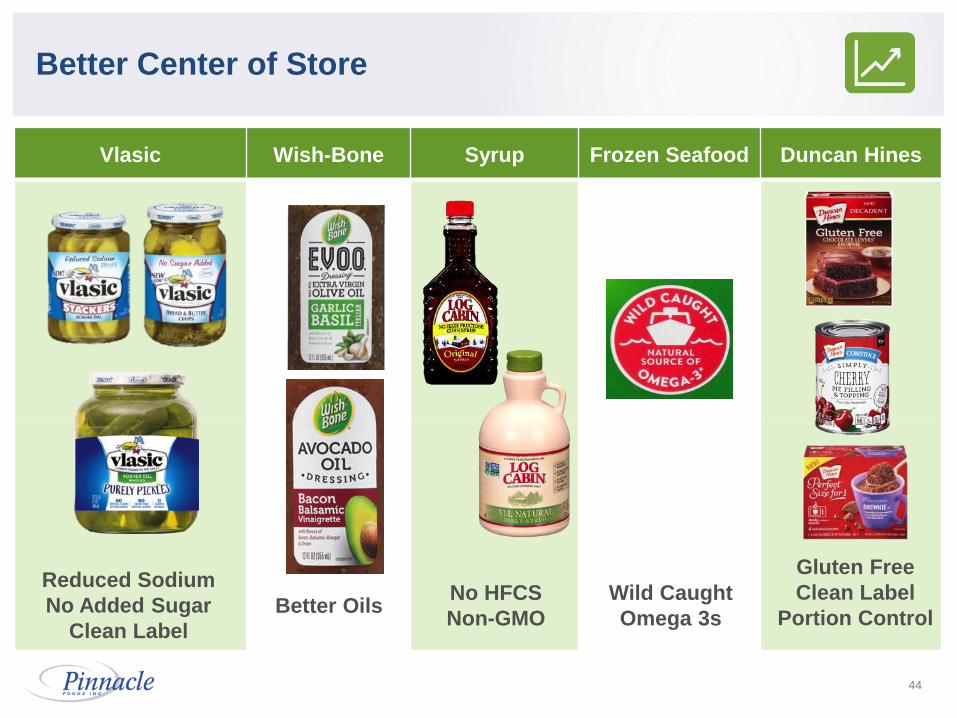
Better Center of Store
Vlasic Wish-Bone Syrup Frozen Seafood Duncan Hines
Reduced Sodium
No Added Sugar
Clean Label
Better Oils No HFCS
Non-GMO
Wild Caught
Omega 3s
Gluten Free
Clean Label
Portion Control
Brand Strength
and Scale Distorting Focus
45
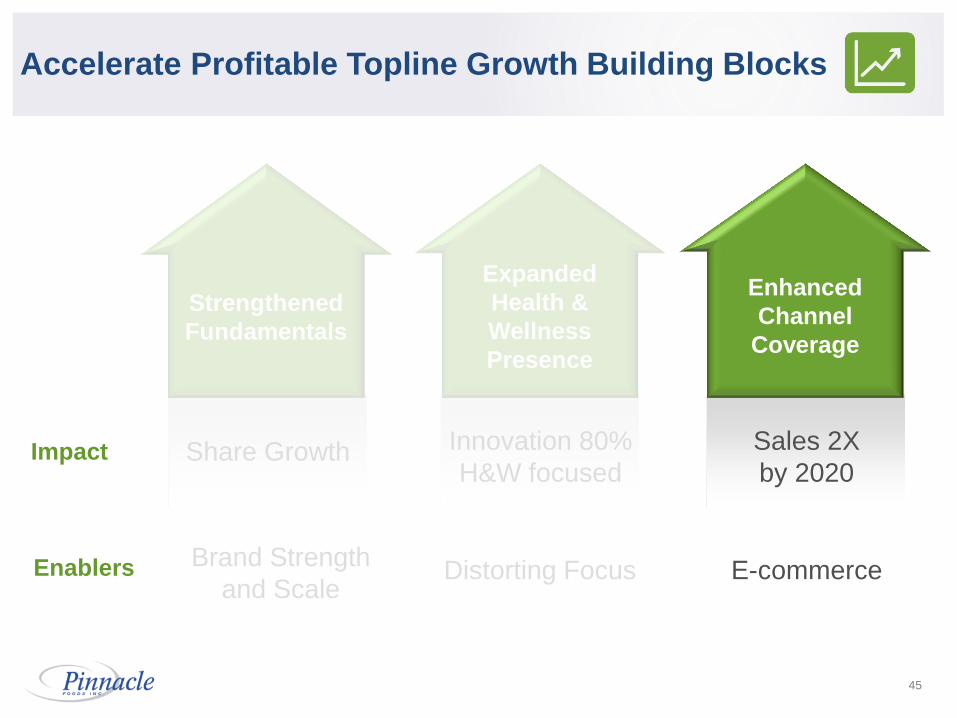
Accelerate Profitable Topline Growth Building Blocks
Strengthened
Fundamentals
Expanded
Health &
Wellness
Presence
Enhanced
Channel
Coverage
Impact
E-commerce
Share Growth Innovation 80%
H&W focused
Sales 2X
by 2020
Enablers
46
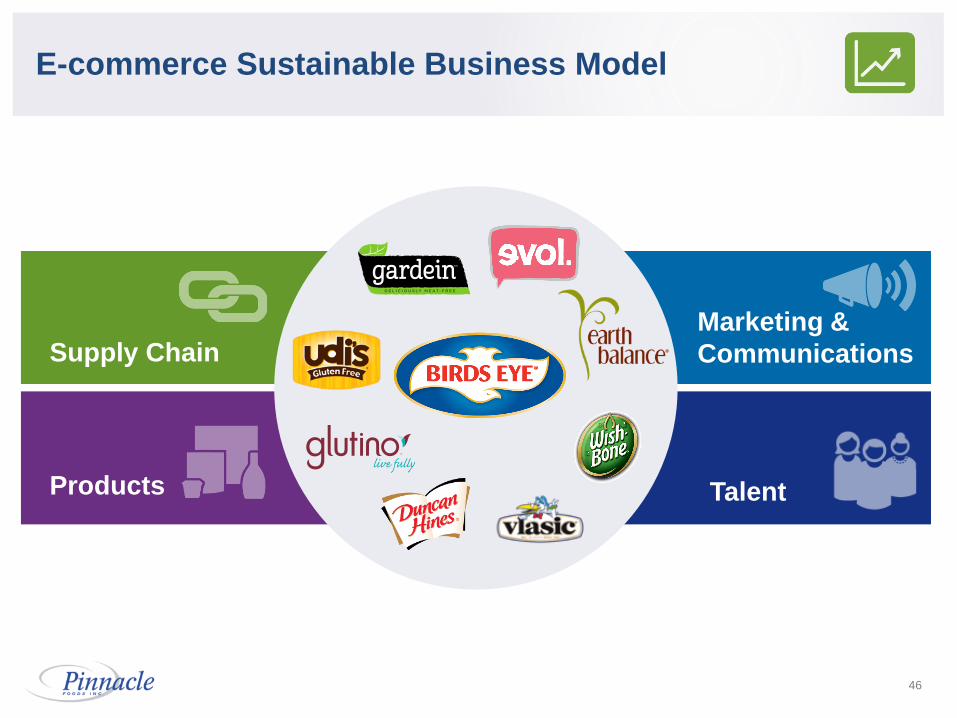
E-commerce Sustainable Business Model
Supply Chain
Products
Marketing &
Communications
Talent

47
Early e-commerce Success
48
Playbook Remains the Focus
Increase
M&A Potential
Strengthen
Capabilities;
Maintain Costs
Expand
Margins &
Cash Flow
Accelerate
Profitable
Top-Line
Growth
49
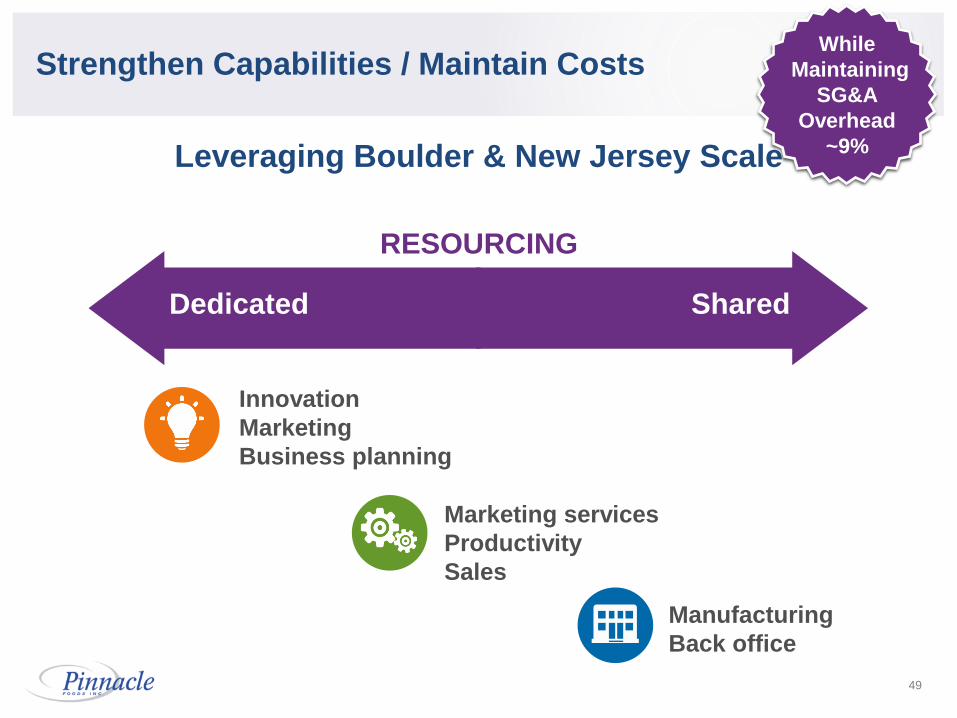
Strengthen Capabilities / Maintain Costs
Leveraging Boulder & New Jersey Scale
While
Maintaining
SG&A
Overhead
~9%
Marketing services
Productivity
Sales
Manufacturing
Back office
Innovation
Marketing
Business planning
RESOURCING
Dedicated Shared
50
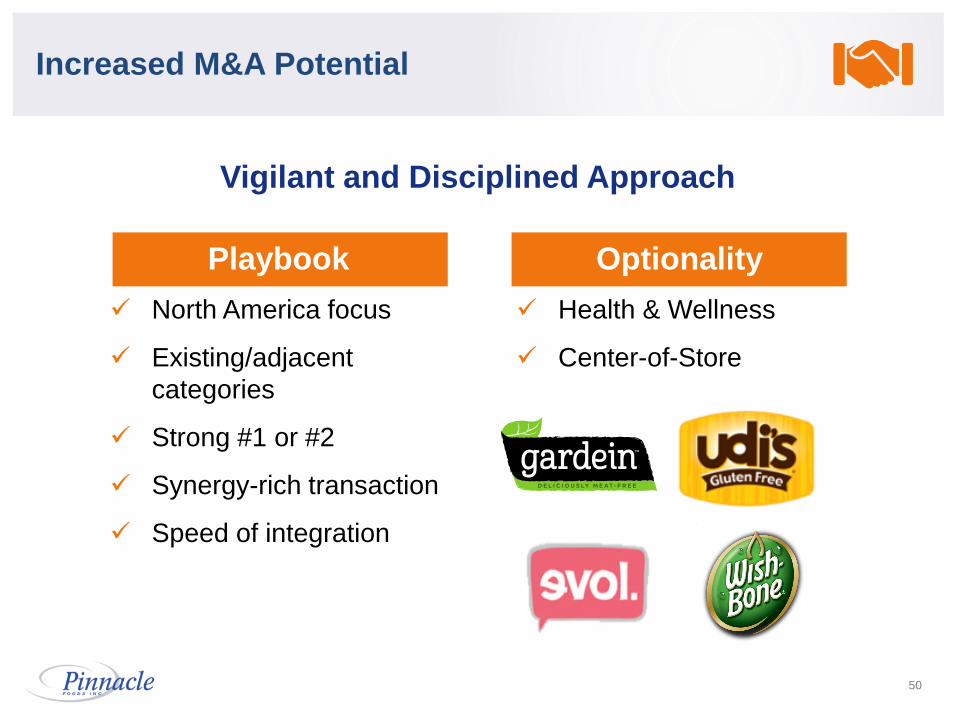
Increased M&A Potential
Vigilant and Disciplined Approach
Playbook
North America focus
Existing/adjacent
categories
Strong #1 or #2
Synergy-rich transaction
Speed of integration
Optionality
Health & Wellness
Center-of-Store
51
• The Foundation
• Unleashing Brand Potential
• Financial Performance
• Outlook
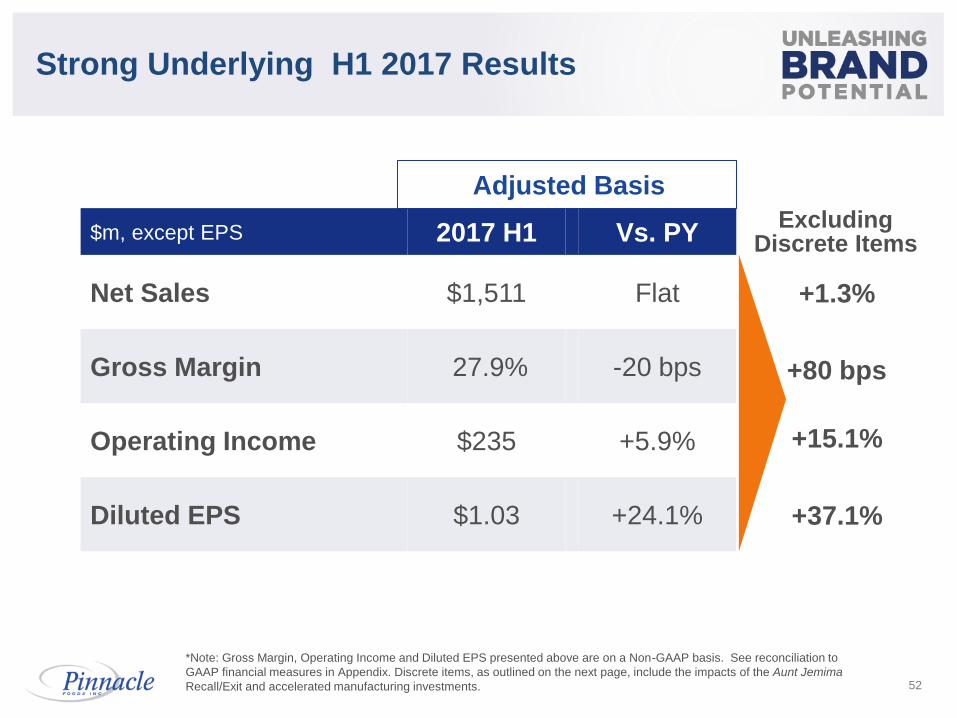
$m, except EPS 2017 H1 Vs. PY
Net Sales $1,511 Flat
Gross Margin 27.9% -20 bps
Operating Income $235 +5.9%
Diluted EPS $1.03 +24.1%
52
Strong Underlying H1 2017 Results
Adjusted Basis
+1.3%
+80 bps
+15.1%
+37.1%
Excluding Discrete Items
*Note: Gross Margin, Operating Income and Diluted EPS presented above are on a Non-GAAP basis. See reconciliation to
GAAP financial measures in Appendix. Discrete items, as outlined on the next page, include the impacts of the Aunt Jemima
Recall/Exit and accelerated manufacturing investments.
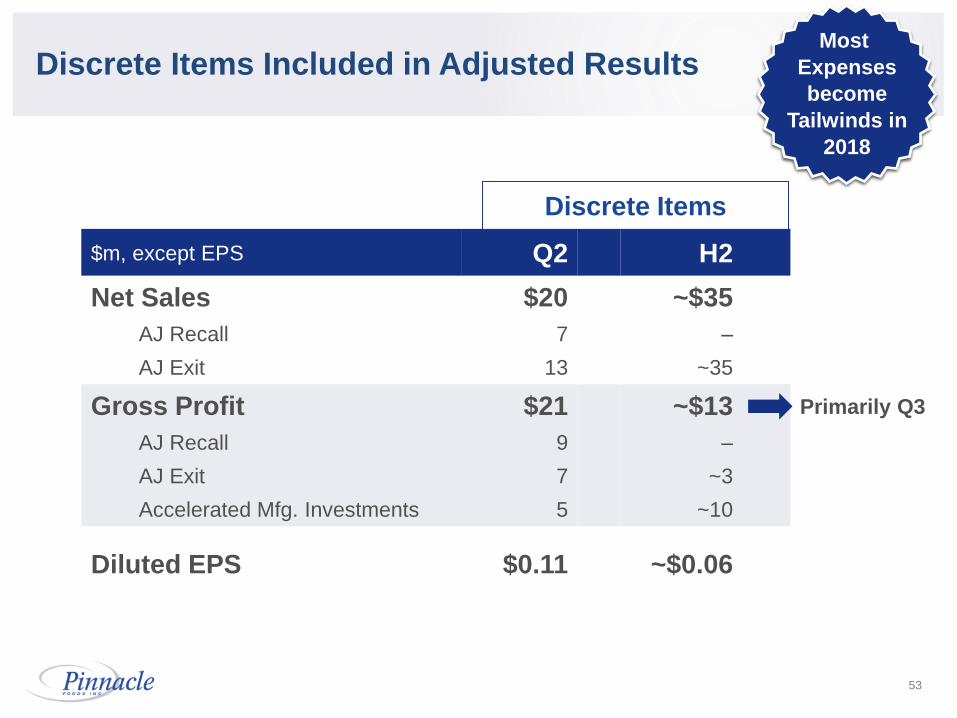
$m, except EPS Q2 H2
Net Sales
AJ Recall
AJ Exit
$20
7
13
~$35
–
~35
Gross Profit
AJ Recall
AJ Exit
Accelerated Mfg. Investments
$21
9
7
5
~$13
–
~3
~10
Diluted EPS $0.11 ~$0.06
53
Discrete Items Included in Adjusted Results
Discrete Items
Most
Expenses
become
Tailwinds in
2018
Primarily Q3
54
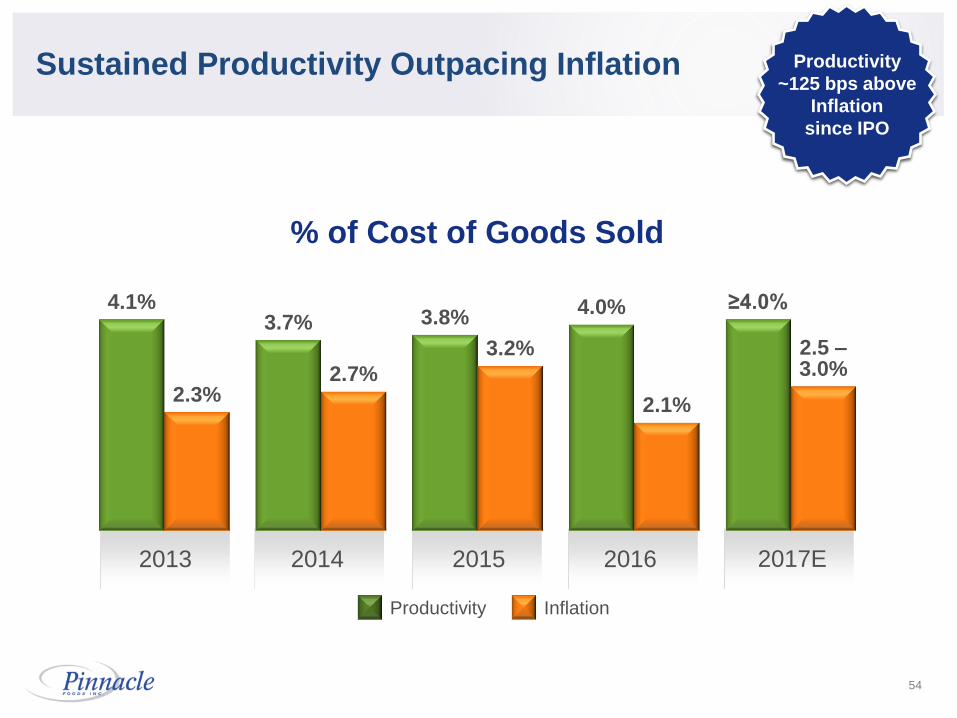
Sustained Productivity Outpacing Inflation
Inflation Productivity
4.1% 3.7% 3.8%
4.0% ≥4.0%
2.3% 2.7%
3.2%
2.1%
2.5 – 3.0%
2016 2015 2014 2013
% of Cost of Goods Sold
2017E
Productivity
~125 bps above
Inflation
since IPO
55
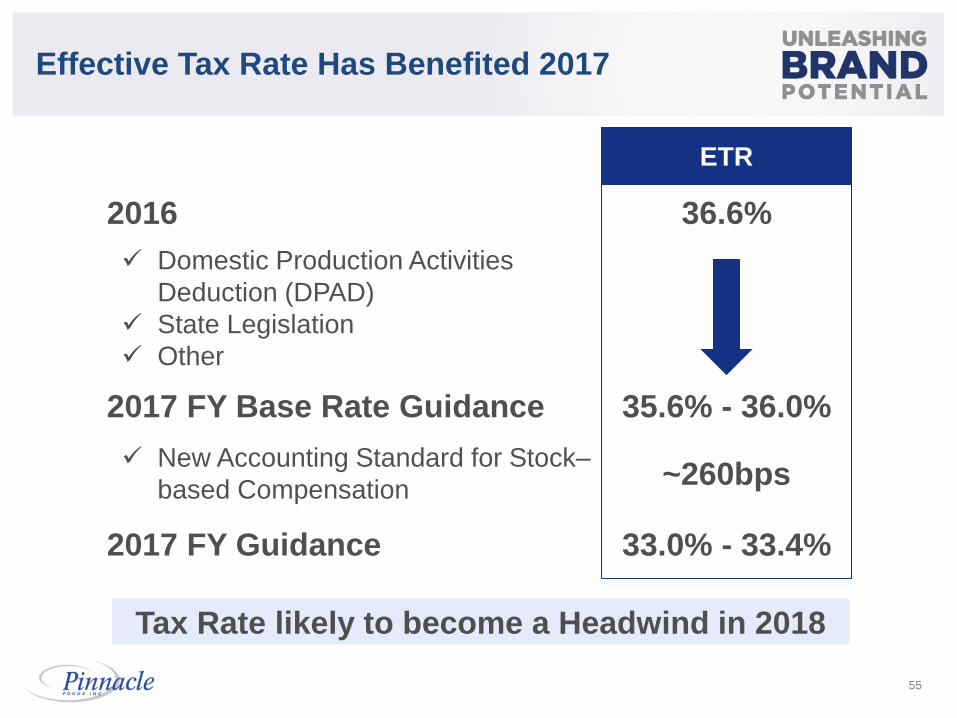
Effective Tax Rate Has Benefited 2017
2016
Domestic Production Activities
Deduction (DPAD)
State Legislation
Other
2017 FY Base Rate Guidance
New Accounting Standard for Stock–
based Compensation
2017 FY Guidance
ETR
36.6%
35.6% - 36.0%
33.0% - 33.4%
~260bps
Tax Rate likely to become a Headwind in 2018
56
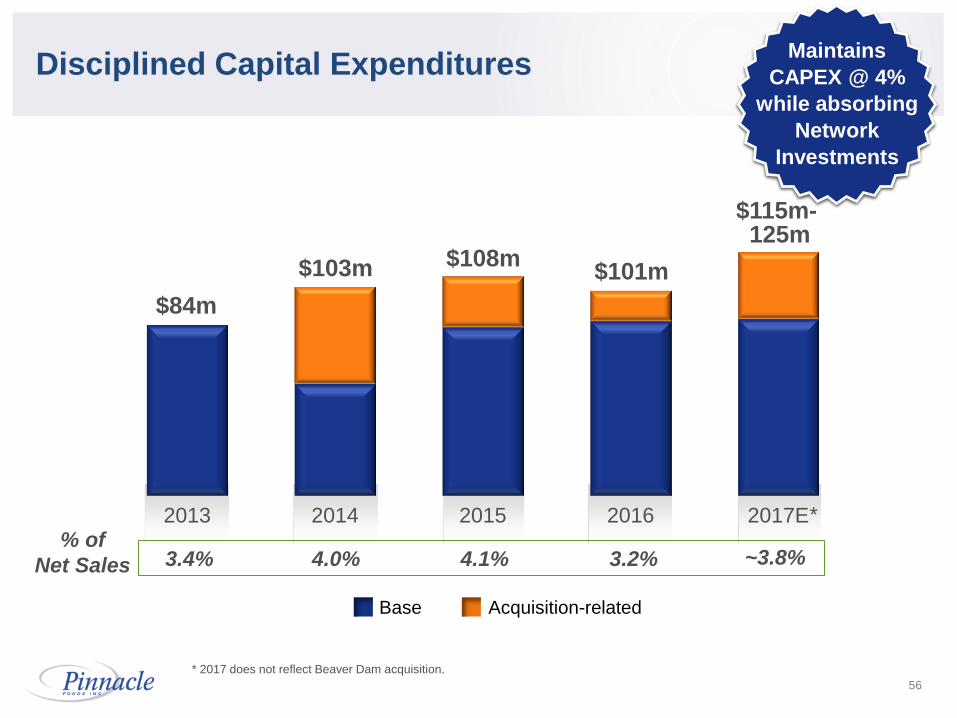
Disciplined Capital Expenditures
* 2017 does not reflect Beaver Dam acquisition.
2013 2014 2015 2016 2017E
$84m
$108m $101m $103m
$115m-$125m
% of
Net Sales 3.4% 4.0% 4.1% 3.2% ~3.8%
Base Acquisition-related
Maintains
CAPEX @ 4%
while absorbing
Network
Investments
*
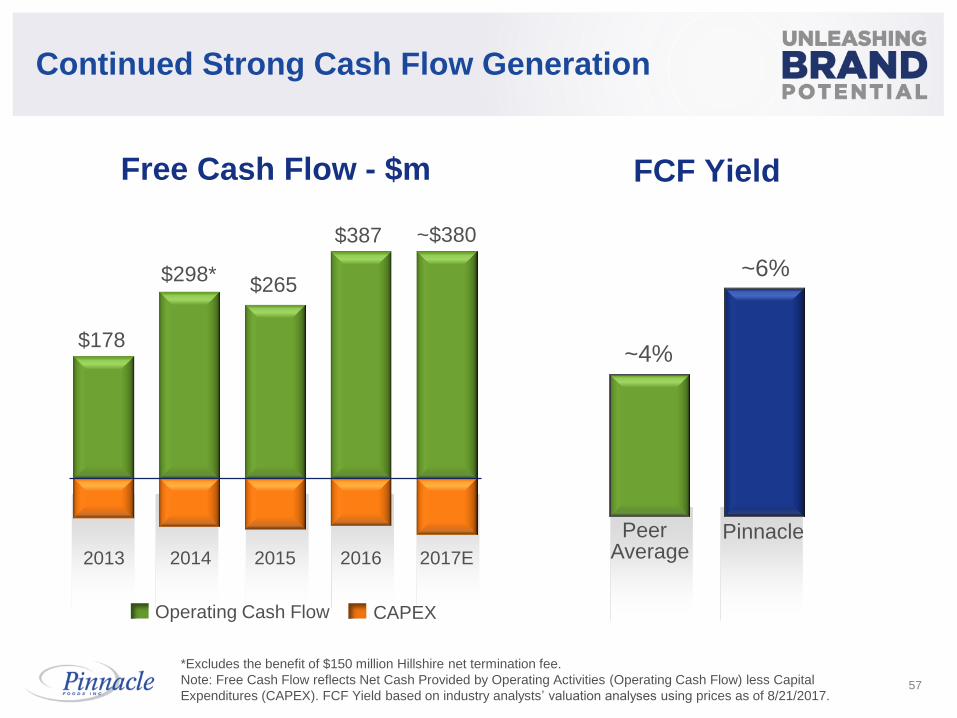
Peer Average
Pinnacle
FCF Yield
~4%
~6%
*Excludes the benefit of $150 million Hillshire net termination fee.
Note: Free Cash Flow reflects Net Cash Provided by Operating Activities (Operating Cash Flow) less Capital
Expenditures (CAPEX). FCF Yield based on industry analysts’ valuation analyses using prices as of 8/21/2017.
Free Cash Flow - $m
2013 2014 2016 2015
$178
$298* $265
Operating Cash Flow CAPEX
$387
2017E
~$380
57
Continued Strong Cash Flow Generation
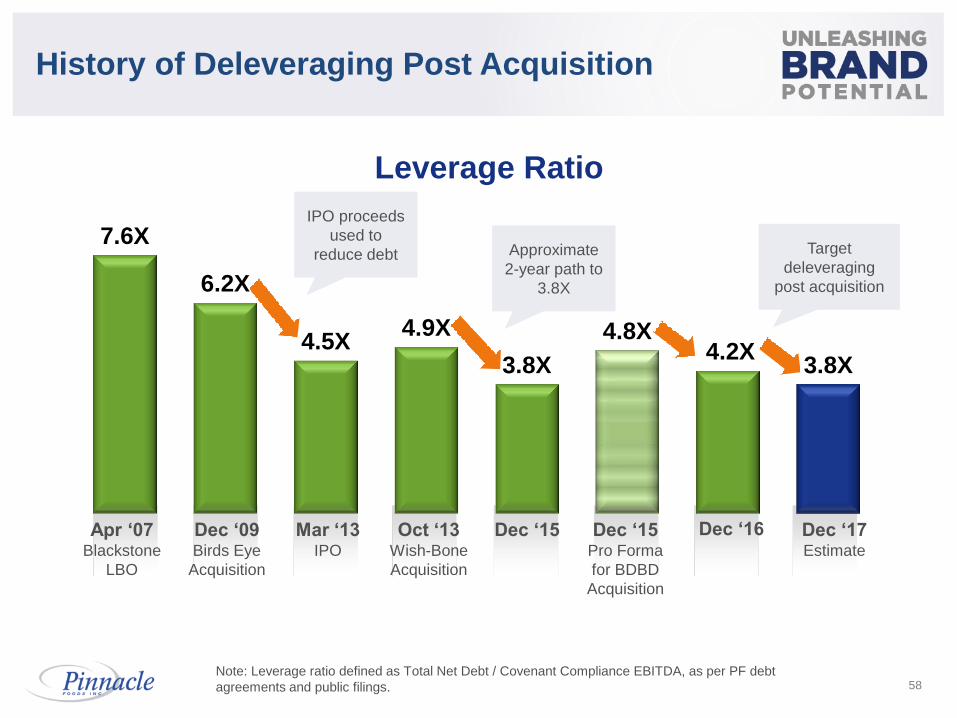
Leverage Ratio
58
History of Deleveraging Post Acquisition
Note: Leverage ratio defined as Total Net Debt / Covenant Compliance EBITDA, as per PF debt
agreements and public filings.
7.6X
6.2X
4.5X 4.9X
3.8X
4.8X 4.2X
3.8X
Apr ‘07 Blackstone
LBO
Dec ‘09 Birds Eye
Acquisition
Mar ‘13 IPO
Oct ‘13 Wish-Bone
Acquisition
Dec ‘15 Dec ‘15 Pro Forma
for BDBD
Acquisition
Dec ‘17 Estimate
Dec ‘16
IPO proceeds
used to
reduce debt Approximate
2-year path to
3.8X
Target
deleveraging
post acquisition
59
• The Foundation
• Unleashing Brand Potential
• Financial Performance
• Outlook
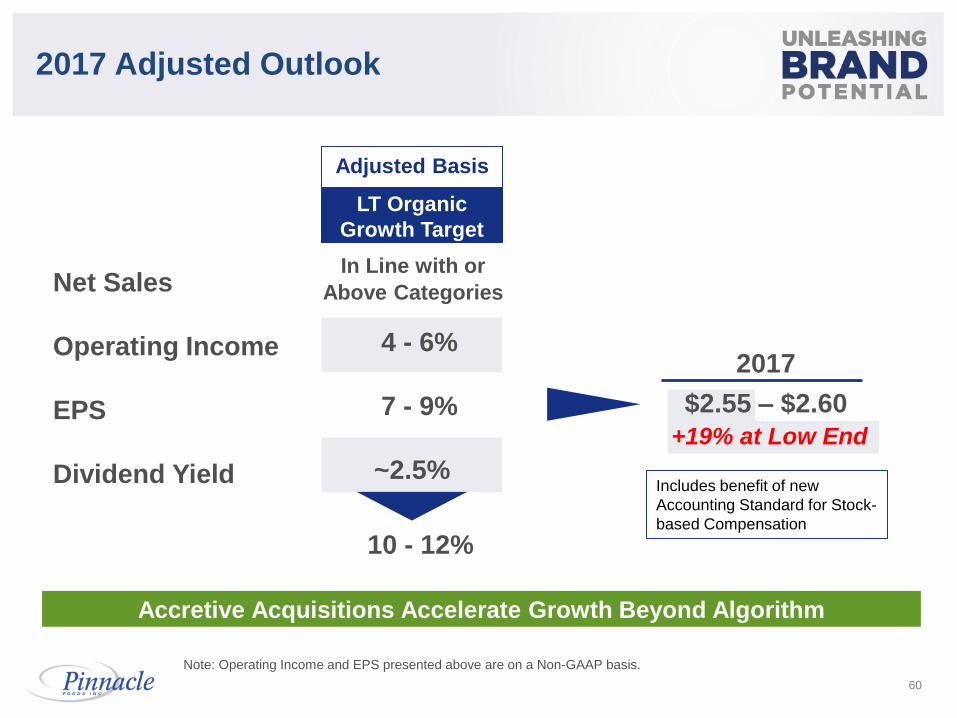
Adjusted Basis
Net Sales
Operating Income
EPS
Dividend Yield
LT Organic
Growth Target
4 - 6%
7 - 9%
~2.5%
In Line with or
Above Categories
10 - 12%
Note: Operating Income and EPS presented above are on a Non-GAAP basis.
Accretive Acquisitions Accelerate Growth Beyond Algorithm
Adjusted Basis
Net Sales
Operating Income
EPS
Dividend Yield
LT Organic
Growth Target
4 - 6%
7 - 9%
~2.5%
In Line with or
Above Categories
10 - 12%
60
2017 Adjusted Outlook
Includes benefit of new
Accounting Standard for Stock-
based Compensation
2017
$2.55 – $2.60
+19% at Low End
61
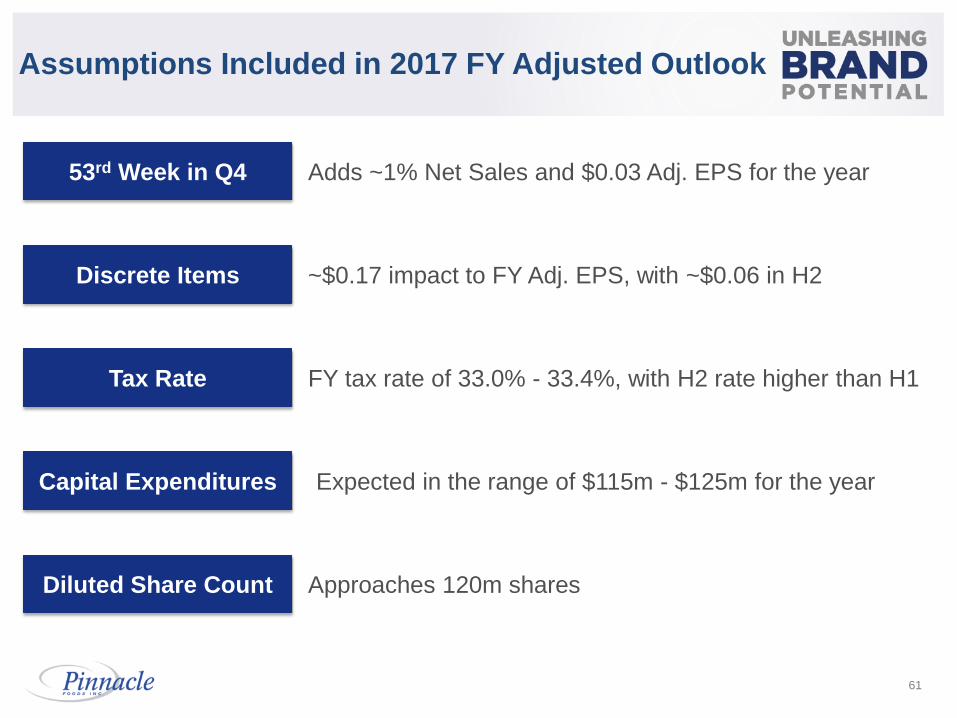
Assumptions Included in 2017 FY Adjusted Outlook
53rd Week in Q4
Discrete Items
Tax Rate
Diluted Share Count
Adds ~1% Net Sales and $0.03 Adj. EPS for the year
~$0.17 impact to FY Adj. EPS, with ~$0.06 in H2
FY tax rate of 33.0% - 33.4%, with H2 rate higher than H1
Approaches 120m shares
Capital Expenditures Expected in the range of $115m - $125m for the year
62
Margin &
Cash
M&A
Capabilities
Growth

APPENDIX
63
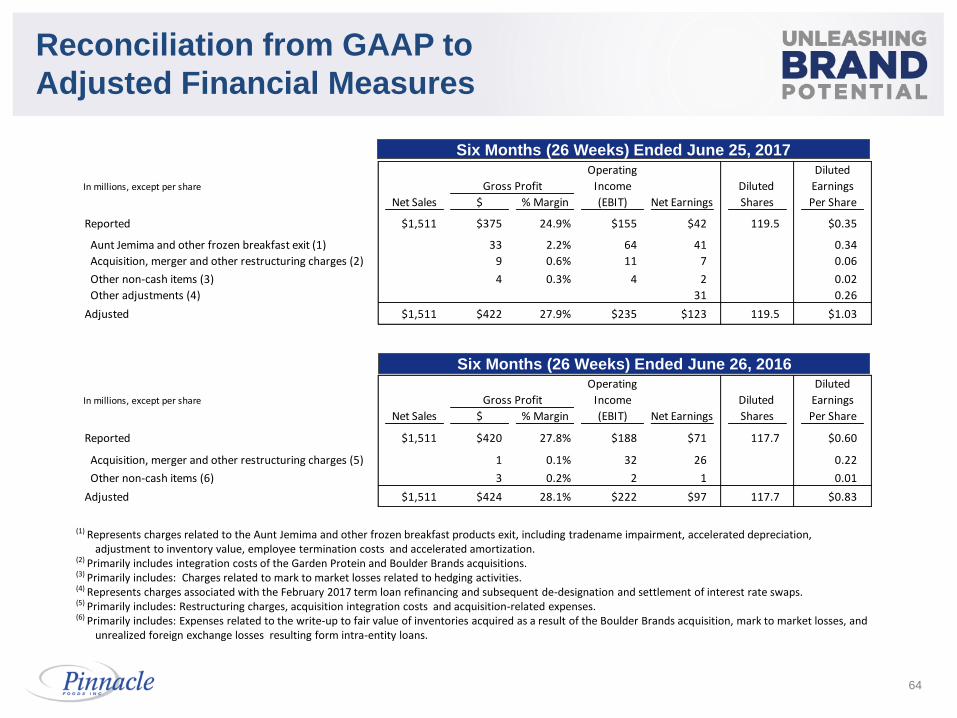
(1) Represents charges related to the Aunt Jemima and other frozen breakfast products exit, including tradename impairment, accelerated depreciation, adjustment to inventory value, employee termination costs and accelerated amortization.
(2) Primarily includes integration costs of the Garden Protein and Boulder Brands acquisitions. (3) Primarily includes: Charges related to mark to market losses related to hedging activities. (4) Represents charges associated with the February 2017 term loan refinancing and subsequent de-designation and settlement of interest rate swaps. (5) Primarily includes: Restructuring charges, acquisition integration costs and acquisition-related expenses. (6) Primarily includes: Expenses related to the write-up to fair value of inventories acquired as a result of the Boulder Brands acquisition, mark to market losses, and
unrealized foreign exchange losses resulting form intra-entity loans.
64
Reconciliation from GAAP to
Adjusted Financial Measures
Operating Diluted
In millions, except per share Income Diluted Earnings
Net Sales $ % Margin (EBIT) Net Earnings Shares Per Share
Reported $1,511 $375 24.9% $155 $42 119.5 $0.35
Aunt Jemima and other frozen breakfast exit (1) 33 2.2% 64 41 0.34
Acquisition, merger and other restructuring charges (2) 9 0.6% 11 7 0.06
Other non-cash items (3) 4 0.3% 4 2 0.02
Other adjustments (4) 31 0.26
Adjusted $1,511 $422 27.9% $235 $123 119.5 $1.03
Operating Diluted
In millions, except per share Income Diluted Earnings
Net Sales $ % Margin (EBIT) Net Earnings Shares Per Share
Reported $1,511 $420 27.8% $188 $71 117.7 $0.60
Acquisition, merger and other restructuring charges (5) 1 0.1% 32 26 0.22
Other non-cash items (6) 3 0.2% 2 1 0.01
Adjusted $1,511 $424 28.1% $222 $97 117.7 $0.83
Gross Profit
Gross Profit
Six Months (26 Weeks) Ended June 25, 2017
Six Months (26 Weeks) Ended June 26, 2016
Operating DilutedIn millions, except per share Income Diluted Earnings
Net Sales $ % Margin (EBIT) Net Earnings Shares Per Share
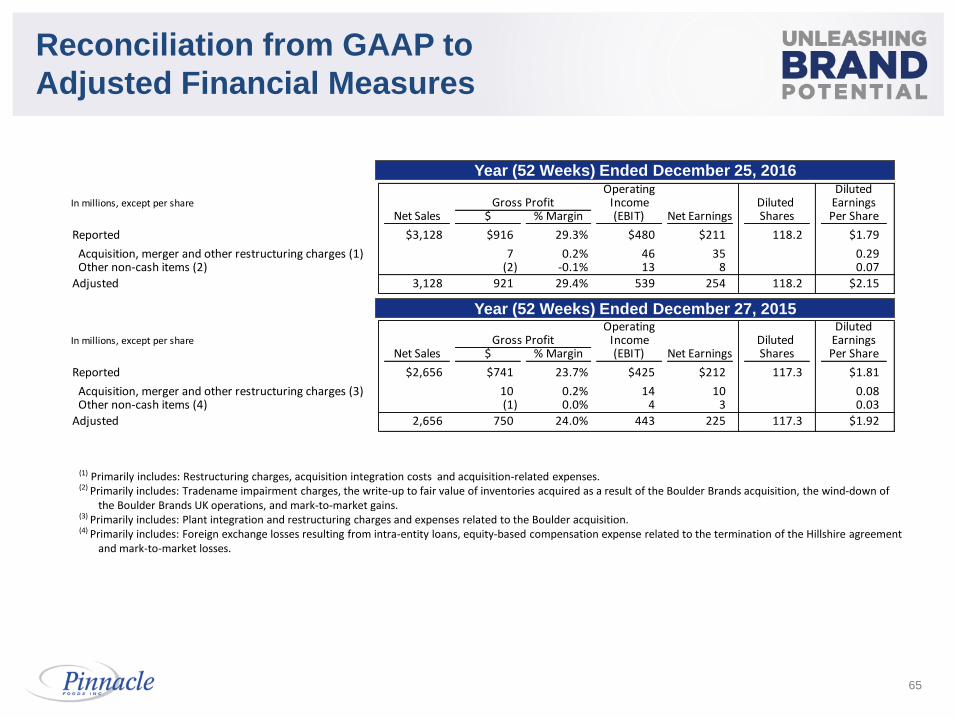
Reported $3,128 $916 29.3% $480 $211 118.2 $1.79
Acquisition, merger and other restructuring charges (1) 7 0.2% 46 35 0.29 Other non-cash items (2) (2) -0.1% 13 8 0.07
Adjusted 3,128 921 29.4% 539 254 118.2 $2.15
Operating DilutedIn millions, except per share Income Diluted Earnings
Net Sales $ % Margin (EBIT) Net Earnings Shares Per Share
Reported $2,656 $741 23.7% $425 $212 117.3 $1.81
Acquisition, merger and other restructuring charges (3) 10 0.2% 14 10 0.08 Other non-cash items (4) (1) 0.0% 4 3 0.03
Adjusted 2,656 750 24.0% 443 225 117.3 $1.92
Gross Profit
Gross Profit
65
Reconciliation from GAAP to
Adjusted Financial Measures
(1) Primarily includes: Restructuring charges, acquisition integration costs and acquisition-related expenses. (2) Primarily includes: Tradename impairment charges, the write-up to fair value of inventories acquired as a result of the Boulder Brands acquisition, the wind-down of
the Boulder Brands UK operations, and mark-to-market gains. (3) Primarily includes: Plant integration and restructuring charges and expenses related to the Boulder acquisition. (4) Primarily includes: Foreign exchange losses resulting from intra-entity loans, equity-based compensation expense related to the termination of the Hillshire agreement
and mark-to-market losses.
Year (52 Weeks) Ended December 25, 2016
Year (52 Weeks) Ended December 27, 2015
Operating DilutedIn millions, except per share Income Diluted Earnings
Net Sales $ % Margin (EBIT) Net Earnings Shares Per Share
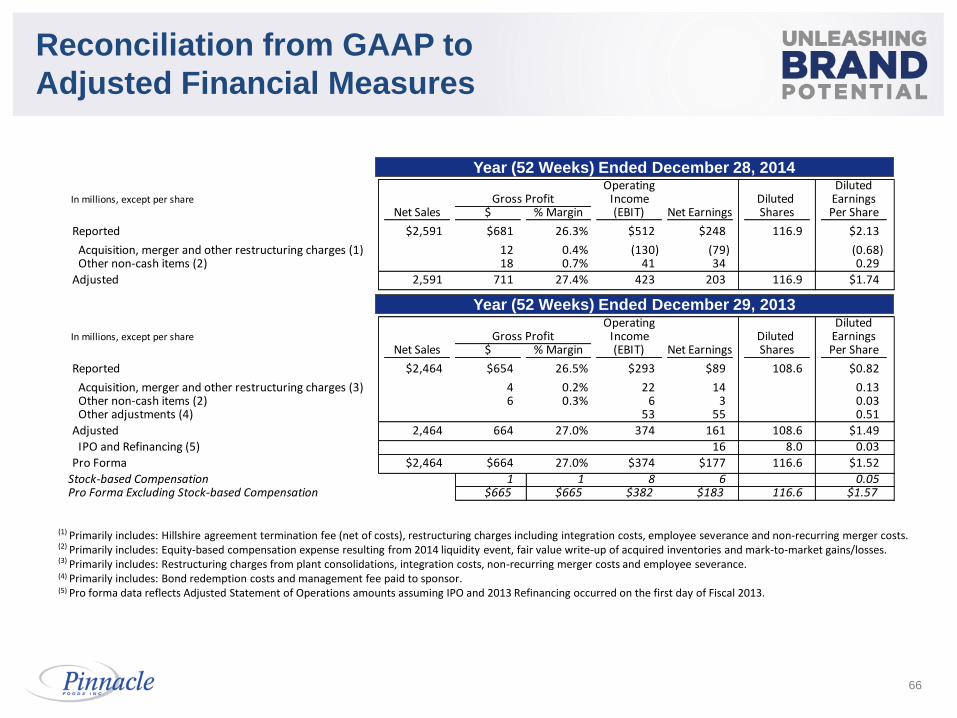
Reported $2,591 $681 26.3% $512 $248 116.9 $2.13
Acquisition, merger and other restructuring charges (1) 12 0.4% (130) (79) (0.68) Other non-cash items (2) 18 0.7% 41 34 0.29
Adjusted 2,591 711 27.4% 423 203 116.9 $1.74
Operating DilutedIn millions, except per share Income Diluted Earnings
Net Sales $ % Margin (EBIT) Net Earnings Shares Per Share
Reported $2,464 $654 26.5% $293 $89 108.6 $0.82
Acquisition, merger and other restructuring charges (3) 4 0.2% 22 14 0.13 Other non-cash items (2) 6 0.3% 6 3 0.03 Other adjustments (4) 53 55 0.51
Adjusted 2,464 664 27.0% 374 161 108.6 $1.49
IPO and Refinancing (5) 16 8.0 0.03
Pro Forma $2,464 $664 27.0% $374 $177 116.6 $1.52
Stock-based Compensation 1 1 8 6 0.05 Pro Forma Excluding Stock-based Compensation $665 $665 $382 $183 116.6 $1.57
Gross Profit
Gross Profit
66
Reconciliation from GAAP to
Adjusted Financial Measures
(1) Primarily includes: Hillshire agreement termination fee (net of costs), restructuring charges including integration costs, employee severance and non-recurring merger costs. (2) Primarily includes: Equity-based compensation expense resulting from 2014 liquidity event, fair value write-up of acquired inventories and mark-to-market gains/losses. (3) Primarily includes: Restructuring charges from plant consolidations, integration costs, non-recurring merger costs and employee severance. (4) Primarily includes: Bond redemption costs and management fee paid to sponsor. (5) Pro forma data reflects Adjusted Statement of Operations amounts assuming IPO and 2013 Refinancing occurred on the first day of Fiscal 2013.
Year (52 Weeks) Ended December 29, 2013
Year (52 Weeks) Ended December 28, 2014
(1) Primarily includes: Accelerated depreciation from plant consolidations, restructuring charges including integration costs and employee severance. (2) Primarily mark to market gains. (3) Primarily includes: Bond redemption costs. (4) Pro forma data reflects Adjusted Statement of Operations amounts assuming IPO occurred on the first day of Fiscal 2012.
67
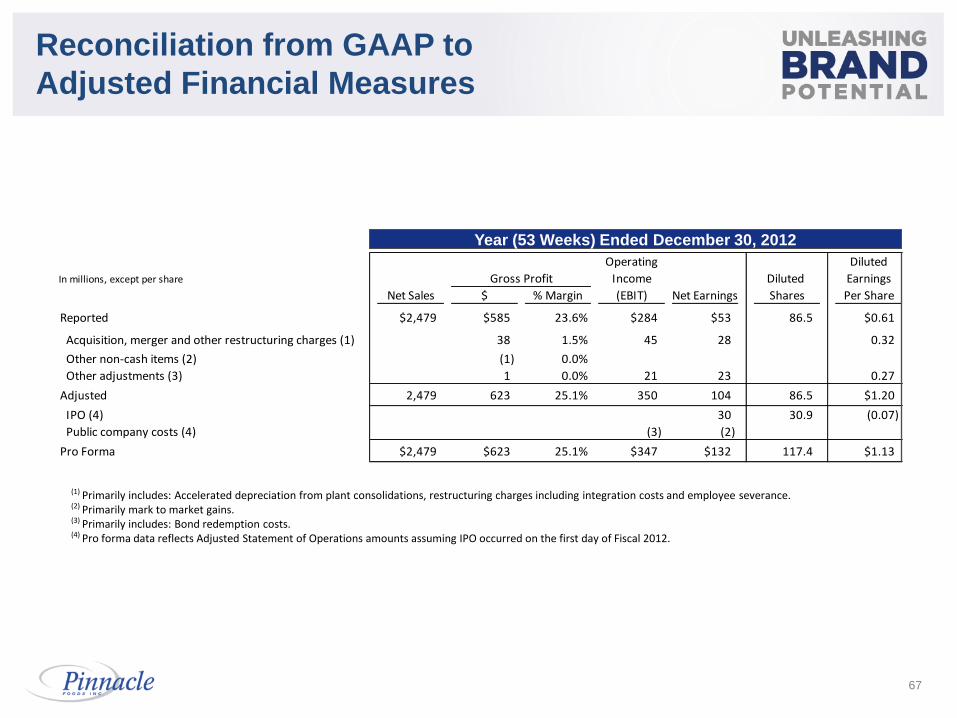
Reconciliation from GAAP to
Adjusted Financial Measures
Operating Diluted
In millions, except per share Income Diluted Earnings
Net Sales $ % Margin (EBIT) Net Earnings Shares Per Share
Reported $2,479 $585 23.6% $284 $53 86.5 $0.61
Acquisition, merger and other restructuring charges (1) 38 1.5% 45 28 0.32
Other non-cash items (2) (1) 0.0%
Other adjustments (3) 1 0.0% 21 23 0.27
Adjusted 2,479 623 25.1% 350 104 86.5 $1.20
IPO (4) 30 30.9 (0.07)
Public company costs (4) (3) (2)
Pro Forma $2,479 $623 25.1% $347 $132 117.4 $1.13
Gross Profit
Year (53 Weeks) Ended December 30, 2012