Embed Size (px)
Citation preview

2014 Full Year Results Bruno Lafont and Jean-Jacques Gauthier
February 18, 2015
© M
édia
thèque L
afa
rge -
Charles P
lum
ey-
Fa
ye -
Rudy
Ric
cio
tti (a
rchitect)
France, Marseille – Mucem (Museum of European & Mediterranean Civilizations)

Disclaimer
2
This document contains forward-looking statements. Although Lafarge believes that the expectations
reflected in such forward-looking statements are based on reasonable assumptions as at the time of
publishing this document, investors are cautioned that these statements are not guarantees of future
performance. Actual results may differ materially from the forward-looking statements as a result of a
number of risks and uncertainties, many of which are difficult to predict and generally beyond the control
of Lafarge, including but not limited to the risks described in the Lafarge’s annual report available on its
Internet website (www.lafarge.com) and uncertainties related to the market conditions and the
implementation of our plans. Nothing contained herein is, or shall be relied on as, a promise or
representation as to the future performance of Lafarge. Accordingly, we caution you against relying on
forward looking statements. Lafarge does not undertake to provide updates of these forward-looking
statements.
Furthermore, these forward-looking statements are applicable to the Lafarge group on a standalone basis
only and are not applicable to the LafargeHolcim group as from the date of completion of the planned
merger of equals announced on April 7, 2014.
More comprehensive information about Lafarge may be obtained on its internet website
(www.lafarge.com), including in the “Regulated Information” section.
This document does not constitute an offer to purchase or exchange or the solicitation of an offer to sell
or exchange any securities of Lafarge.
In compliance with the IFRS accounting standards, the Group has applied the new standard IFRS 11
from January 1st, 2014. IFRS requires restating the corresponding period of 2013 to have comparable
information from one year to the other.

Algeria, City of Algiers – Building better cities - Notre-Dame d'Afrique cable car
Copyr
ight: ©
Lib
rary
Lafa
rge
M. K
adri -
CA
PA
Pic
ture
s
Bruno Lafont Chairman and CEO
4
A Successful Transformation Solid Results in 2014 in a Volatile Environment
Solid growth like for like, demonstrating the strength of our portfolio
Solid performance of Middle East Africa, despite some specific
situations
North America continue to benefit from solid trends in the United States
Europe progressively stabilizing with some countries already recovering
like the UK
2012 – 2015 cost reduction and innovation targets achieved one year
ahead of schedule

5
Focusing on Our Customers and Our Markets Innovation Driving Solid, Sustainable and More Profitable Growth
An organization deeply transformed
All segments contributing to results
€230M delivered this year
The most advanced portfolio of
valued added products and solutions
More than 400 new products launched since 2012
Network of micro retail outlets in Tanzania © L
afa
rge
Me
dia
lib
rary
Construction Development Lab in Algeria
© L
afa
rge
Me
dia
lib
rary
- M
. K
ad
ri -
CA
PA
Pic
ture
s
Affordable housing in the Philippines © L
afa
rge M
edia
libra
ry
Ronnel C
uis
on

6
An Optimized Cost Base €370M Cost Savings in 2014; A Proven Track Record Since 2006
34%
12%
23% 19%
12%
Split of 2014 cost savings SG&A
Industrial fixed
costs
Energy
Logistics
Production
and other variable costs
© L
afa
rge m
edia
libra
ry - A
. B
arr
ière
- C
AP
A P
ictu
res
© L
afa
rge m
edia
libra
ry - Ignus G
erb
er
© L
afa
rge m
edia
libra
ry - Ignus G
erb
er
New operating model in our plants
21% of alternative fuels in 2014
(vs. 14% in 2011)
Optimization of energy procurement, notably power
costs
7
Capital Expenditure Sustainably Lowered Maintenance Capex to Remain below 60% of Depreciation
Proven track record optimizing maintenance capex
Development focused on debottlenecking
Additional 9mT produced in 2014 vs. 2012 for a minimal investment
New grinding station in M’Sila – Algeria © M
ed
ialib
rary
- M
. K
ad
ri -
CA
PA
Pic
ture
s
Conveyor of the Ferzikovo plant in Russia © L
afa
rge
Me
dia
lib
rary
- A
nto
n Z
ab
rod
skiy

EBITDA of Between €3.0bn and €3.2bn in 2015
8
Significant Growth of Results Expected in 2015
Expected 2 to 5 cement volume growth in 2015
Objective to generate more than €550m through cost cutting and
innovation is confirmed
Improving exchange rates
We will continue to apply a strict capital allocation discipline
9
Our Planned Merger is Four Months Ahead Significant Steps Taken Towards Completion
15 December 2014 EU Clearance obtained
23 December 2014 Announcement of the future Executive
Committee
2 February 2015 Announcement of an agreement aiming at
selling to CRH for €6.5bn a large set of assets
from Lafarge and Holcim in Europe, Brazil, the
Philippines and Canada

Jean-Jacques Gauthier
Chief Financial Officer France, Paris – Philarmonic society
© G
uy
Monta
gu-P
ollo
ck
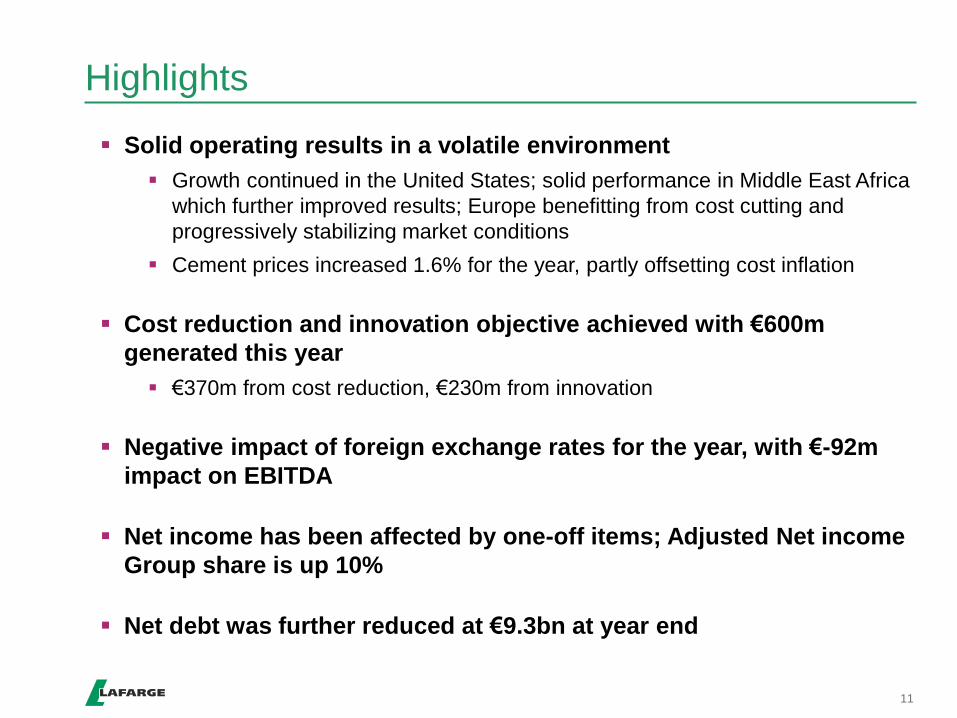
Highlights
11
Solid operating results in a volatile environment
Growth continued in the United States; solid performance in Middle East Africa
which further improved results; Europe benefitting from cost cutting and
progressively stabilizing market conditions
Cement prices increased 1.6% for the year, partly offsetting cost inflation
Cost reduction and innovation objective achieved with €600m
generated this year
€370m from cost reduction, €230m from innovation
Negative impact of foreign exchange rates for the year, with €-92m
impact on EBITDA
Net income has been affected by one-off items; Adjusted Net income
Group share is up 10%
Net debt was further reduced at €9.3bn at year end

Key Figures
12
(1) At constant scope and exchange rates, and excluding one-time elements:
A €20m one-time gain recorded in Q1 2013 in North America, CO2 sales and the loss of volumes in Iraq in H2 2014 in the current situation
(2) Adjusted for non-recurring items, net of tax: merger-related costs, gains and losses on divestments, non-cash impairments and one-
time effects on the deferred tax positions to reflect newly applicable tax rates, notably in Algeria and Spain.
(3) Subject to the approval of Annual General Meeting. In addition, Lafarge may decide to increase its dividend to equalize it with that to
be announced by Holcim as per the Combination Agreement between Lafarge and Holcim signed on July 7, 2014. Payment date of the
Lafarge dividend can be accelerated compared to past practices of Lafarge and will be communicated at a later stage.
12 Months 4th Quarter
2014 2013 Variation lfl(1) 2014 2013 Variation lfl(1)
Volumes
Cement (MT) 116.4 114.4 2% 4% 28.4 28.7 -1% 1%
Pure aggregates (MT) 161.4 165.0 -2% -1% 41.1 41.8 -2% -1%
Ready-Mix Concrete (Mm3) 26.4 26.7 -1% -2% 6.5 6.5 -1% -3%
Sales 12,843 13,091 -2% 3% 3,207 3,157 2% 1%
EBITDA 2,721 2,794 -3% 5% 679 707 -4% -1%
EBITDA Margin 21.2% 21.3% -10bps 40bps 21.2% 22.4% -120bps -30bps
Current Operating Income 1,881 1,937 -3% 7% 450 488 -8% -3%
Net income Group share 143 601 nm (145) 213 nm
Adjusted net income (2) 423 384 10% 68 96 -29%
Adjusted EPS (in €) (2) 1.47 1.34 10% 0.24 0.33 -27%
Net dividend (in €) (3) 1.00 1.00
Free cash flow 592 754 -21% 392 418 -6%
Net debt 9,310 9,846 -5%

Operational Review Nigeria, City of Lagos
© L
afa
rge M
edia
libra
ry -
A. E
sie
bo -
CA
PA
Pic
ture
s
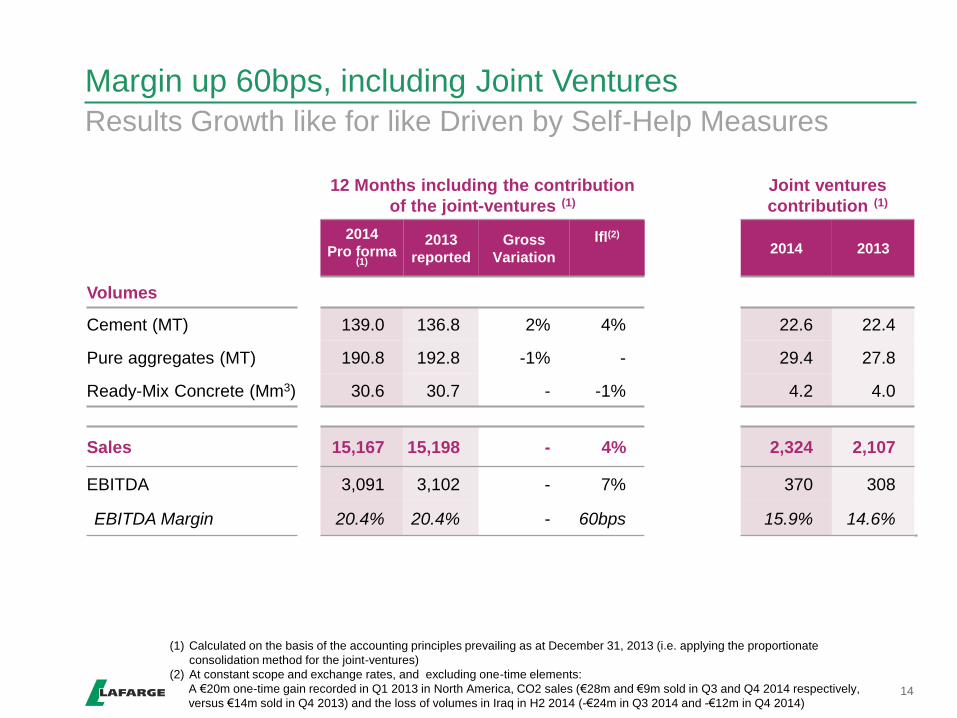
Margin up 60bps, including Joint Ventures
14
(1) Calculated on the basis of the accounting principles prevailing as at December 31, 2013 (i.e. applying the proportionate
consolidation method for the joint-ventures)
(2) At constant scope and exchange rates, and excluding one-time elements:
A €20m one-time gain recorded in Q1 2013 in North America, CO2 sales (€28m and €9m sold in Q3 and Q4 2014 respectively,
versus €14m sold in Q4 2013) and the loss of volumes in Iraq in H2 2014 (-€24m in Q3 2014 and -€12m in Q4 2014)
12 Months including the contribution
of the joint-ventures (1)
Joint ventures
contribution (1)
2014
Pro forma (1)
2013
reported
Gross
Variation
lfl(2)
2014 2013
Volumes
Cement (MT) 139.0 136.8 2% 4% 22.6 22.4
Pure aggregates (MT) 190.8 192.8 -1% - 29.4 27.8
Ready-Mix Concrete (Mm3) 30.6 30.7 - -1% 4.2 4.0
Sales 15,167 15,198 - 4% 2,324 2,107
EBITDA 3,091 3,102 - 7% 370 308
EBITDA Margin 20.4% 20.4% - 60bps 15.9% 14.6%
Results Growth like for like Driven by Self-Help Measures

North America
15
Volumes Growth in the US and Pricing Gains – Strong Trends in Q4 12 Months 4th Quarter
Volumes 2014 2013 Variation lfl(1) 2014 2013 Variation lfl
Cement (MT)
Pure aggregates (MT)
Ready-Mix Concrete (Mm3)
11.7
85.5
5.5
11.3
90.5
5.6
4%
-6%
-3%
4%
-2%
-5%
3.0
23.1
1.3
2.9
22.9
1.3
6%
1%
-2%
6%
5%
-5%
Sales 3,008 3,064 -2% 4% 813 747 9% 6%
EBITDA 578 552 5% 19% 179 140 28% 32%
EBITDA Margin 19.2% 18.0% 120bps 250bps 22.0% 18.7% 330bps 440bps
Current Operating Income 441 398 11% 28% 143 103 39% 46%
(1) At constant scope and exchange rates, and excluding a €20m one-time gain recorded in Q1 2013 in North America
Like-for-like sales increased both in the quarter and over the year, with price gains across all product lines and higher
cement volumes.
In the United States, the residential sector was positively oriented throughout the year. In this respect, cement
volumes improved 6% both in the quarter and versus last year. Aggregates volumes were also positively oriented,
while ready-mix volumes decreased 8% versus last year, with a lower number of projects.
In Canada, cement volumes improved 7% both in the West and the East in the fourth quarter and 2% for the year.
Aggregates and ready-mix volumes were slightly down compared with last year, reflecting the phasing of some large
projects completed in 2013 in Western Provinces, while our aggregates business benefited from a positive growth in
Ontario with several infrastructure and civil engineering projects.
EBITDA and EBITDA margin improved solidly in the quarter and in the year, supported by higher cement volumes, higher
prices across all product lines in response to cost inflation, cost savings and innovation measures.

Western Europe
16
Forceful Cost-Cutting Initiatives Mitigating Lower Volumes in France 12 Months 4th Quarter
Volumes 2014 2013 Variation lfl(1) 2014 2013 Variation lfl(1)
Cement (MT)
Pure aggregates (MT)
Ready-Mix Concrete (Mm3)
11.8
33.0
7.3
12.0
34.4
7.7
-2%
-4%
-6%
-2%
-3%
-6%
2.9
7.5
1.8
2.9
8.3
1.9
-2%
-10%
-8%
-2%
-8%
-9%
Sales 2,109 2,208 -4% -4% 506 536 -6% -6%
EBITDA 291 264 10% 4% 51 69 -26% -16%
EBITDA Margin 13.8% 12.0% 180bps 100bps 10.1% 12.9% -280bps -110bps
Current Operating Income 104 81 28% 13% (6) 19 nm nm
(1) At constant scope and exchange rates, and excluding carbon credit sales (€26m recorded in Q3 2014, and €3m in Q4
2014, versus €11m in Q4 2013)
Sales decreased both in the quarter and versus 2013, reflecting lower volumes in France.
In France, in line with our expectations, construction activity was soft comparing to a strong Q4 2013.
In Spain, some signs of economic recovery have been perceived and the construction sector stabilized, with some
improvements noticed in the fourth quarter.
Activity in Greece continued to show signs of improvement and domestic cement volumes sold rose both in the
quarter and versus last year.
At constant scope and exchange rates, and excluding carbon credit sales, EBITDA margin increased 100bps versus
2013, supported by significant cost-cutting measures.
Strong improvement in the contribution to the net result of our joint-venture in the UK, where synergies are ramping-up
as planned and the market continues to recover.

Central and Eastern Europe
17
EBITDA Margin Improvement Driven by Self-Help Measures 12 Months 4th Quarter
Volumes 2014 2013 Variation lfl (1) 2014 2013 Variation lfl (1)
Cement (MT)
Pure aggregates (MT)
Ready-Mix Concrete (Mm3)
12.1
21.7
2.0
12.5
20.7
1.6
-3%
6%
21%
2%
-1%
21%
2.8
5.4
0.4
2.7
5.6
0.4
-
-1%
-8%
-
-7%
-8%
Sales 1,067 1,145 -7% 4% 229 258 -11% -1%
EBITDA 226 201 12% 15% 50 50 - -5%
EBITDA Margin 21.2% 17.6% 360bps 200bps 21.8% 19.4% 250bps -80bps
Current Operating Income 135 112 21% 20% 26 27 -4% nm
(1) At constant scope and exchange rates, and excluding carbon credit sales (€2m recorded in Q3 2014, and €6m in Q4 2014,
versus €3m in Q4 2013)
On a comparable basis, sales rose 4% versus last year supported by a strong first semester, and stabilized in Q4.
In Poland, sales were up 4% versus last year. Construction market growth was subdued in the second semester, as
the former EU infrastructure plan ended while the effect of the new plan is expected to be more visible from the
second half of 2015.
In Romania, cement volumes rose both in the quarter and full year, with a strong rebound in the residential segment
compensating for a contraction of infrastructure work.
In Russia, cement volumes sold increased both in the quarter and for the year, reflecting the progressive ramp-up of
our new 2 MT plant located in the south of the Moscow region that started production in April, and despite a slowdown
of the construction market in the fourth quarter.
EBITDA and EBITDA margin for the year significantly improved, underpinned by cost saving and innovation measures in a
low volume environment.

Middle East and Africa
18
Robust Performance Despite some Challenging Situations in H2
(1) At constant scope and exchange rates, and excluding the impact of the loss of volumes in Iraq in H2 2014 in the current context.
When including the drop in volumes in Iraq in H2 : 12M: domestic volumes: 1% , sales: 5%, EBITDA: 4%
Q4 : domestic volumes: -8% , sales: -4%, EBITDA: -6%
(2) Domestic only
12 Months 4th Quarter
Volumes 2014 2013 Variation lfl (1) 2014 2013 Variation lfl (1)
Cement (MT)
Pure aggregates (MT)
Ready-Mix Concrete (Mm3)
41.6
9.7
5.5
40.2
8.5
5.2
4%
14%
7%
4%
14%
4%
9.8
2.2
1.4
10.6
2.2
1.4
-7%
3%
8%
-5%
3%
4%
Sales 3,711 3,632 2% 6% 908 915 -1% -2%
EBITDA 1,043 1,032 1% 8% 255 267 -4% -2%
EBITDA Margin 28.1% 28.4% -30bps 40bps 28.1% 29.2% -110bps 20bps
Current Operating Income 778 762 2% 10% 185 200 -7% -2%
2014 performance was robust despite several adverse events, demonstrating the strength of our asset portfolio. At constant
scope and exchange rates, sales rose 5% and EBITDA 4% versus last year, with a positive contribution of most markets
more than offsetting the impact of lower volumes in Iraq in the second half of the year.
Excluding this impact, sales were up 6% like-for-like versus last year. They were slightly down in Q4, due to lower
production levels in South Africa and the suspension of our operations in Syria from mid-September 2014.
In Nigeria, our cement volumes increased both in Q4 and versus 2013 while prices temporarily dropped in Q4
despite cost inflation. Year-end prices reflected the Q1 increase.
In Algeria, sales rose 8% versus last year with a continuous focus on innovative products.
In Egypt, our cement volumes improved significantly over the year, as the utilization rate of our plant rose. Prices
grew in a context of increased costs, notably costs to implement alternative sources of fuels.
EBITDA margin like-for-like improved both in Q4 and for the year, supported by successful cost savings and innovation
measures, and reflecting significant earnings increases in Nigeria, East Africa and Algeria.
(2) (2)

Latin America
19
Subdued Market and Strong Inflation Environment
Sales increased 3% versus last year and slightly contracted in the fourth quarter, when excluding the effect of the
devaluation of the Brazilian real against the euro and the impact of the divestments achieved on the last 18 months.
In Brazil, the construction market experienced mild trends throughout the year, impacted by the summer sports
events and the election in the second half of the year. In this environment, cement volumes slightly dropped,
while pricing gains were achieved in response to significant cost inflation.
EBITDA contracted in the quarter and versus last year, under the combined effect of lower volumes, sustained cost
inflation and one-time adverse elements notably impacting the fourth quarter.
12 Months 4th Quarter
Volumes 2014 2013 Variation lfl 2014 2013 Variation lfl
Cement (MT)
Pure aggregates (MT)
Ready-Mix Concrete (Mm3)
7.3
3.0
1.4
8.8
2.8
1.2
-18%
9%
16%
-2%
2%
16%
1.7
0.8
0.3
2.0
0.8
0.3
-17%
8%
-4%
-4%
-7%
-4%
Sales 712 869 -18% 3% 163 192 -15% -3%
EBITDA 150 240 -37% -10% 29 55 -47% -30%
EBITDA Margin 21.1% 27.6% -650bps -310bps 17.8% 28.6% -1090bps -740bps
Current Operating Income 119 202 -41% -14% 22 46 -52% -35%

Asia
20
Higher Sales Mitigated Significant Cost Inflation 12 Months 4th Quarter
Volumes 2014 2013 Variation lfl 2014 2013 Variation lfl
Cement (MT)
Pure aggregates (MT)
Ready-Mix Concrete (Mm3)
31.9
8.5
4.7
29.6
8.2
5.4
8%
3%
-12%
8%
-3%
-12%
8.2
2.1
1.2
7.6
2.1
1.2
9%
-3%
4%
9%
-10%
4%
Sales 2,236 2,173 3% 6% 588 509 16% 8%
EBITDA 433 505 -14% -11% 115 126 -9% -15%
EBITDA Margin 19.4% 23.2% -380bps -370bps 19.6% 24.8% -520bps -500bps
Current Operating Income 304 382 -20% -17% 80 93 -14% -19%
Sales grew both in the fourth quarter and versus last year, mainly driven by the ramp-up of our new plant in India and
strong level of construction activity in the Philippines.
In India, the construction market began to regain momentum after the general elections and the monsoon season.
Our cement volumes increased strongly, supported by our 2.6 MT new plant in Rajasthan which started in Q3 2013.
Prices were lower than last year levels.
In the Philippines, our cement volumes increased quarter after quarter, experiencing double-digit growth in the
second half of the year. Cement sales improved 7% versus last year.
In South Korea and in Malaysia, our cement volumes slightly contracted, with some production limitations in
Malaysia and a soft construction market in South Korea.
In Indonesia, cement sales rose, mostly driven by price increases in response to cost inflation.
Despite solid cost reductions, EBITDA decreased, impacted by overall high cost inflation within the region, notably higher
energy costs, production limitations and an adverse impact of purchases of clinker.

Net Income France, Paris – Fondation Louis Vuitton
©Iw
an B
aan 2
014

Net Income
22
Adjusted Net Income up 10% for the Year, Supported by
Reduced Financial Costs and a Higher Contribution of our JV
(1) Net income attributable to the owners of the parent company
(2) Adjusted for non-recurring items, net of tax: merger-related costs, gains and losses on divestments (including the gain on the
divestment of our Gypsum operations in the United States, presented in the 2013 net income from discontinued operations), non-
cash impairments, and one-time effects on the deferred tax positions to reflect newly applicable tax rates, notably in Algeria and
Spain.
12 Months 4th Quarter
€m 2014 2013 2014 2013
EBITDA 2,721 2,794 679 707
Depreciation (840) (857) (229) (219)
Current Operating Income 1,881 1,937 450 488
Other income (expenses) (421) (4) (264) 68
Net financial costs (870) (984) (169) (233)
Income from JV and associates 69 - 6 (3)
Income taxes (385) (242) (145) (62)
Income from discontinued operations - 46 - (1)
Non-controlling interests (131) (152) (23) (44)
Net income, Group Share (1) 143 601 (145) 213
Adjusted net income, Group Share (2) 423 384 68 96

Cash Flow and Debt Highlights
France, Paris – Fondation Louis Vuitton
©Iw
an B
aan 2
014

Cash Flow
24
12 Months 4th Quarter
€m 2014 2013 2014 2013
CFFO excluding merger costs
Net cash merger costs
Change in working capital
Sustaining capex
1,130
(90)
(92)
(356)
1,161
-
(56)
(351)
232
(47)
344
(137)
165
-
406
(153)
Free cash flow 592 754 392 418
Development investments (1)
Divestments (2)
(669)
1,145
(630)
1,248
(111)
621
(118)
219
Cash flow after investments 1,068 1,372 902 519
Dividends
Equity issuance (repurchase)
Currency fluctuation impact
Change in fair value
Others
(436)
(6)
17
(16)
(91)
(486)
3
4
25
(54)
(39)
1
96
(2)
3
(25)
-
4
30
(17)
Net debt reduction (increase) 536 864 961 511
Net debt at the beginning of period 9,846 10,710 10,271 10,357
Net debt at period end 9,310 9,846 9,310 9,846
(1) Including net debt acquired and the acquisitions of ownership interests with no gain of control.
The acquisitions of ownership interests with no gain of control were negligible in 2014 and in 2013, excluding puts, already
recorded as debt, exercised in the period (€11m put exercised in the second quarter 2014)
(2) Including net debt disposed of, and the disposals of ownership interests with no loss of control.

Outlook 2015 United States - Elmwood, New Jersey – Refurbishment in Ductal, the ultra-high performance concrete of Lafarge, of the Pulaski Skyway Bridge
carrying a four-lane freeway over the Passaic and Hackensack rivers linking Jersey City to Newark airport.
©
Lafa
rge M
edia
libra
ry -
Ron S
aari

2015 Outlook – Market (1) Overview
26
Cement
(1) Market growth forecast at national level – Lafarge volumes trends can differ from this outlook
Volumes (%) Price Highlights
North America 3 to 6 +
Market growth, notably supported by
positive trends in the US residential and
commercial sectors and in Eastern Canada
Western Europe 0 to 3 =/+ Improvement expected in most markets;
slight decrease in France
Central and Eastern Europe -2 to 1 + Market growth in most markets with the
exception of Russia
Middle East and Africa 5 to 8 + Solid market trends across the region
Latin America 0 to 3 + Moderate growth in Brazil, driven by the Rio
region
Asia 4 to 7 + Market growth expected in most markets
Overall 2 to 5 + Growth in most markets

2015 Outlook – Other Elements
27
EBITDA for the year 2015 between €3.0bn and €3.2bn
-1% for energy cost inflation (-0.1 euro per tonne), reflecting a drop in
fuel prices (petcoke and coal), partly compensated by increases in power
in regulated markets
Continuous focus on our Cost reduction and Innovation plan:
Cost reduction: €300m
Innovation: €250m
Cost of debt (gross): ~6%
Tax rate: 34%(1)
Capital expenditures: €1.1bn
Net debt between €8.5bn and €9.0bn at year-end
(1) Excluding one-off effects

Conclusion Philippines – Affordable Housing

I. Other Information
Outlook 2015 – Market Overview United States - Elmwood, New Jersey – Refurbishment in Ductal, the ultra-high performance concrete of Lafarge, of the Pulaski Skyway Bridge
carrying a four-lane freeway over the Passaic and Hackensack rivers linking Jersey City to Newark airport.
©
Lafa
rge M
edia
libra
ry -
Ron S
aari

2015 Outlook – Market (1) overview
30
Cement
Market Volumes (%)
North America
United States
Canada
3 to 6
5 to 8
-1 to 2
Western Europe
France
United Kingdom
Spain
Greece
0 to 3
-2 to 1
5 to 8
4 to 7
3 to 6
Central and Eastern Europe
Poland
Romania
Russia
-2 to 1
2 to 5
2 to 5
-12 to -9
Latin America
Brazil
0 to 3
0 to 3
Market Volumes (%)
Middle East and Africa
Algeria
Egypt
Iraq
Kenya
Morocco
Nigeria
South Africa
5 to 8
4 to 7
4 to 7
7 to 10
8 to 11
-1 to 2
3 to 6
2 to 5
Asia
China
India
Indonesia
Malaysia
Philippines
South Korea
4 to 7
1 to 4
5 to 8
3 to 6
5 to 8
9 to 12
-2 to 1
Overall 2 to 5
(1) Market growth forecast at national level except for United States, Russia, China, India and Indonesia for which only relevant markets are considered

2015 Outlook – Market overview
Main markets
North America: Market growth, notably supported by positive trends in the US
residential and commercial sectors.
Western Europe: Overall stabilization at a low level. Growth expected in the UK,
supported by the residential sector; decrease in France
Emerging markets: Market growth expected in most markets
Prices
Price improvement expected for both Pure Aggregates and Ready-Mix concrete.
Aggregates and Concrete
31

II. Other information Scope and Foreign Exchange Effects
France, City of Lyon – Lyon Confluence district, in the Lyon former Docks district. Shopping center designed
by architect Jean-Paul Viguier. Lafarge concrete has been used for the exterior surfaces around the center.
Copyrig
ht:
© L
ibra
ry L
afa
rge
T. C
am
pagne -
CA
PA
Pic
ture
s -
Jean-P
aul V
iguie
r (a
rchitect)

Sales by Geographical Area
33
Scope and Foreign Exchange Effects
In million euros
12 Months
2014 2013 Variation Scope FX effect Impact of
one-off (1) lfl
North America 3,008 3,064 -2% -1% -5% - 4%
Western Europe 2,109 2,208 -4% - - - -4%
Central and Eastern
Europe 1,067 1,145 -7% -5% -6% - 4%
Middle East and Africa 3,711 3,632 2% - -3% -1% 6%
Latin America 712 869 -18% -14% -7% - 3%
Asia 2,236 2,173 3% - -3% - 6%
TOTAL 12,843 13,091 -2% -2% -3% - 3%
(1) At constant scope and exchange rates, and excluding the loss of volumes in Iraq in H2 2014 in the current context.
When including the drop in volumes in Iraq in H2 2014, like-for-like MEA sales variations are up 5% FY.

EBITDA by Geographical Area
34
Scope and Foreign Exchange Effects
In million euros
12 Months
2014 2013 Variation Scope FX effect Impact of
one-off (1) lfl(1)
North America 578 552 5% -3% -6% -5% 19%
Western Europe 291 264 10% -1% - 7% 4%
Central and Eastern Europe 226 201 12% -3% -2% 2% 15%
Middle East and Africa 1,043 1,032 1% - -3% -4% 8%
Latin America 150 240 -37% -22% -5% - -10%
Asia 433 505 -14% - -3% - -11%
TOTAL 2,721 2,794 -3% -3% -4% -1% 5%
(1) At constant scope and exchange rates, and excluding a €20m one-time gain recorded in Q1 2013 in North America, carbon credit
sales and the impact of the loss of volumes in Iraq in H2 2014 in the current context

II. Other information Information per Activity
Nigeria, City of Lagos
© L
afa
rge M
edia
libra
ry -
A. E
sie
bo -
CA
PA
Pic
ture
s

Cement
36
12 Months 4th Quarter
2014 2013 Variation lfl (1) 2014 2013 Variation lfl (1)
Sales (€m) 9,166 9,256 -1% 5% 2,263 2,207 3% 2%
EBITDA 2,380 2,438 -2% 5% 593 616 -4% -1%
EBITDA Margin 26.0% 26.3% -30bps -10bps 26.2% 27.9% -170bps -80bps
By geographical zone Sales 12M
2014
EBITDA
12M 2014
Total 9,166 2,380
North America 1,287 327
Western Europe 1,157 246
Central and Eastern Europe 804 203
Middle East and Africa 3,314 1,016
Latin America 597 155
Asia 2,007 433
(1) At constant scope and exchange rates, and excluding a €20m one-time gain recorded in Q1 2013 in North America, carbon credit
sales and the impact of lower cement volumes in Iraq due to the transport limitations in the second semester 2014
Aggregates and Concrete
37
12 Months 4th Quarter
2014 2013 Variation lfl(1) 2014 2013 Variation lfl(1)
Sales (€m) 4,271 4,412 -3% 1% 1,084 1,081 - -1%
Out of which Pure aggregates 1,866 1,923 -3% 3% 477 476 - 1%
Out of which Ready-Mix 2,322 2,387 -3% -1% 580 572 1% -3%
EBITDA 394 411 -4% 5% 115 120 -4% 1%
Out of which Pure aggregates 267 242 10% 23% 75 68 10% 22%
Out of which Ready-Mix 75 111 -32% -28% 26 38 -32% -33%
(1) At constant scope and exchange rates, and excluding a one-time gain recorded in Q1 2013 in North America

Aggregates and other related activities
38
By geographical zone Sales 12M
2014
EBITDA
12M 2014
Total 2,151 289
Out of which Pure aggregates 1,866 267
North America 978 162
Western Europe 481 61
Other 407 44
(1) At constant scope and exchange rates, and excluding a one-time gain recorded in Q1 2013 in North America
12 Months 4th Quarter
2014 2013 Variation lfl (1) 2014 2013 Variation lfl (1)
Sales (€m) 2,151 2,234 -4% 2% 554 557 -1% 1%
EBITDA 289 272 6% 18% 81 74 9% 19%
EBITDA Margin 13.4% 12.2% 120bps 14.6% 13.3% 130bps

Ready-Mix and Concrete Products
39
By geographical zone Sales
12M 2014
EBITDA
12M 2014
Total 2,447 105
Out of which Ready-Mix 2,322 75
North America 697 30
Western Europe 781 37
Other 844 8
(1) At constant scope and exchange rates, and excluding a one-time gain recorded in Q1 2013 in North America
12 Months 4th Quarter
2014 2013 Variation lfl (1) 2014 2013 Variation lfl (1)
Sales (€m) 2,447 2,506 -2% -1% 611 598 2% -2%
EBITDA 105 139 -24% -20% 34 46 -26% -26%
EBITDA Margin 4.3% 5.5% -120bps 5.6% 7.7% -210bps

II. Other information Sales variances for a selection of countries
Nigeria, City of Lagos
© L
afa
rge M
edia
libra
ry -
A. E
sie
bo -
CA
PA
Pic
ture
s

YTD Like-for-Like Sales Variance – Cement
41
Analysis by Region and Major
Market as at December 31, 2014 Volume effect Other effects (1) Activity variation vs. 2013
North America United States Canada
3.9%
5.5%
1.8%
2.0%
4.1%
0.2%
5.9%
9.6%
2.0%
Western Europe
France Spain Greece
-1.9%
-6.7%
-0.4%
5.1%
-1.4%
-1.8%
-3.8%
7.1%
-3.3%
-8.5%
-4.2%
12.2%
Central and Eastern Europe Poland Romania Russia
1.9%
-0.1%
2.1%
8.9%
0.1%
-0.8%
-1.2%
1.8%
2.0%
-0.9%
0.9%
10.7%
Middle East and Africa Algeria Egypt Iraq Kenya Nigeria South Africa
0.7%
3.6%
16.9%
-16.7%
1.6%
4.0%
-9.6%
4.1%
4.1%
20.9%
-7.2%
-1.9%
2.8%
0.6%
4.8%
7.7%
37.8%
-23.9%
-0.3%
6.8%
-9.0%
Latin America Brazil Ecuador
-2.2%
-2.2%
-2.0%
4.3%
4.1%
1.4%
2.1%
1.9%
-0.6%
Asia India Indonesia Malaysia Philippines South Korea
8.6%
34.8%
-3.0%
-1.5%
7.6%
-3.7%
0.3%
-9.6%(3)
7.9%
3.3%
-0.4%
1.2%
8.9%
25.2%
4.9%
1.8%
7.2%
-2.5%
Cement domestic markets 2.9% 1.4% 4.3%
Main Joint ventures UK Morocco China
4.4%
-5.9%
1.0%
5.1%
3.4%
-3.0%
9.5%
-2.5% -2.0%
(1) Other effects: including price effects, product and customer mix effects (2) Lime, grey and white cement (3) Impacted by geographical mix – prices in East down 4%
Pure price: + 1.6%
Geo mix & other effects: -0.2%
(disclosed for information and not included in the regional sub-totals disclosed above
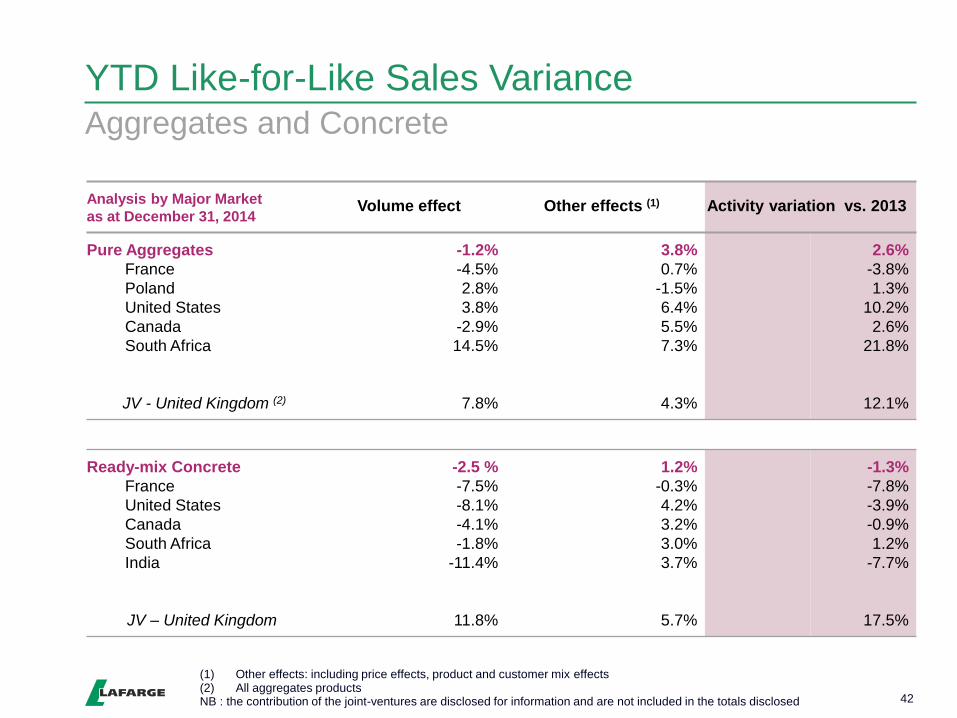
Analysis by Major Market
as at December 31, 2014 Volume effect Other effects (1) Activity variation vs. 2013
Pure Aggregates
France
Poland
United States
Canada
South Africa
JV - United Kingdom (2)
-1.2%
-4.5%
2.8%
3.8%
-2.9%
14.5%
7.8%
3.8%
0.7%
-1.5%
6.4%
5.5%
7.3%
4.3%
2.6%
-3.8%
1.3%
10.2%
2.6%
21.8%
12.1%
Ready-mix Concrete
France
United States
Canada
South Africa
India
JV – United Kingdom
-2.5 %
-7.5%
-8.1%
-4.1%
-1.8%
-11.4%
11.8%
1.2%
-0.3%
4.2%
3.2%
3.0%
3.7%
5.7%
-1.3%
-7.8%
-3.9%
-0.9%
1.2%
-7.7%
17.5%
YTD Like-for-Like Sales Variance
42
Aggregates and Concrete
(1) Other effects: including price effects, product and customer mix effects (2) All aggregates products NB : the contribution of the joint-ventures are disclosed for information and are not included in the totals disclosed

VI. Other Information Income statement
France, City of Lyon – Lyon Confluence district, in the Lyon former Docks district. Shopping center designed
by architect Jean-Paul Viguier. Lafarge concrete has been used for the exterior surfaces around the center.
Copyrig
ht:
© L
ibra
ry L
afa
rge
T. C
am
pagne -
CA
PA
Pic
ture
s -
Jean-P
aul V
iguie
r (a
rchitect)

Other Income (Expenses)
44
12 Months 4th Quarter
€m 2014 2013 2014 2013
Net gains (losses) on disposals 292 291 259 200
Impairment of assets (385) (110) (366) (60)
Restructuring (80) (131) (21) (51)
Merger-related costs (126) - (79) -
Others (122) (54) (57) (21)
Total (421) (4) (264) 68

Finance Costs and Average Interest Rate
45 (1) Excluding puts and derivative instruments : -€0.1Bn as at December 31, 2014 and negligible as at December 31, 2013
12 Months 4th Quarter
€m 2014 2013 2014 2013
Financial charges on net debt (736) (779) (174) (201)
Foreign exchange 28 (51) 49 12
Others (162) (154) (44) (44)
Total (870) (984) (169) (233)
December 31, 2014 December 31, 2013
Average interest rate Interest rate Interest rate
Spot Average Spot Average
Total gross debt (1) €11.4Bn 6.4% 6.3% €12.9Bn 6.6% 6.2%
Of which: Fixed rate 71% 8.0% 74% 7.9%
Floating rate 29% 2.6% 26% 2.7%

VI. Other Information Statement of Financial Position & Cash Flow Statement
© L
afa
rge M
edia
libra
ry -
Ronnel C
uis
on
Philippines - Affordable housing, colored houses in the village of Iliga

Statement of Financial position
47
€m Dec.
31, 2014
Dec.
31, 2013
Capital Employed
Out of which:
Goodwill
Prop, plant & equip.
Intangible assets
Investments in JV and
associates
Working Capital
27,403
11,360
12,052
349
3,056
586
27,073
11,027
12,049
370
3,174
453
Financial assets 739 667
Total 28,142 27,740
€m Dec.
31, 2014
Dec.
31, 2013
Equity
Out of which:
Equity attributable to the
owners of the parent
company
Non controlling interests
17,289
15,453
1,836
16,285
14,555
1,730
Net debt 9,310 9,846
Provisions 1,543 1,609
Total 28,142 27,740
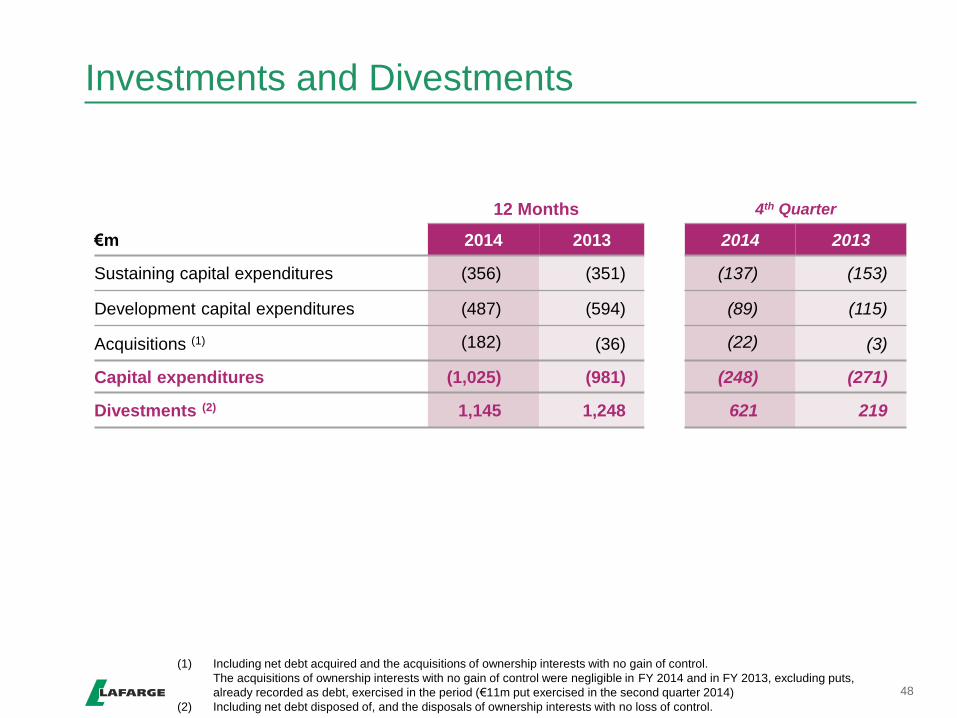
Investments and Divestments
48
12 Months 4th Quarter
€m 2014 2013 2014 2013
Sustaining capital expenditures (356) (351) (137) (153)
Development capital expenditures (487) (594) (89) (115)
Acquisitions (1) (182) (36) (22) (3)
Capital expenditures (1,025) (981) (248) (271)
Divestments (2) 1,145 1,248 621 219
(1) Including net debt acquired and the acquisitions of ownership interests with no gain of control.
The acquisitions of ownership interests with no gain of control were negligible in FY 2014 and in FY 2013, excluding puts,
already recorded as debt, exercised in the period (€11m put exercised in the second quarter 2014)
(2) Including net debt disposed of, and the disposals of ownership interests with no loss of control.

Balanced Debt Maturity Schedule
49
Average maturity of gross debt is 4 years and 1 month
0
200
400
600
800
1000
1200
1400
1600
1800
2000
2200
2015 2016 2017 2018 2019 2020 2021 After 2035
As at December 31, 2014 (1)
Lafarge SA short-term borrowings
Lafarge SA Bonds & other MLT instruments
Subsidiaries debt instruments
Securitization programs
In million euros
(1) Excluding puts on shares and derivatives instruments
NB : €0.3Bn Lafarge SA short-term borrowings are classified as long-term in the Group’s Statement of Financial Position, as they
can be refinanced on a medium and long-term basis through the committed credit lines.

Gross Debt (1) by Currency and by Source of Financing
50
As at December 31, 2014
Total Gross Debt (1): € 11.4Bn
(1) Excluding puts on shares and derivatives instruments
(2) After swaps
73%
12%
6%
9%
Split by currency (2)
EUR USD
GBP Other
77%
9%
14%
Split by source of financing
Debentures Notes / private placements Banks

Strong Liquidity Backed by Well Balanced Committed Credit Lines
51
Lafarge SA committed credit lines of 3.0 billion euros with average maturity of 2.7 years
(1) Classified as long-term in the Group’s Statement of Financial Position, as they can be refinanced on a medium and
long-term basis through the committed credit lines.
€bn, as at December 31, 2014 Amount 2015 2016 2017 2018
Syndicated committed credit lines 1.5 - - 1.5 -
Bilateral committed credit lines 1.5 - 0.2 0.6 0.7
Cash and cash equivalents 2.0
Total sources of liquidity 5.0
Short-term debt and short-term portion of long-term debt (2.0)
Credit lines drawn as of December 31, 2014 (1) -
Overnight debt and other short-term borrowings (1) (0.4)
Total available liquidity 2.6
VII. Other Information IFRS 11 on Joint Arrangements - Main Impacts on Group Key Figures
© L
afa
rge M
edia
libra
ry -
Ronnel C
uis
on
Philippines - Affordable housing, colored houses in the village of Iliga

IFRS 11 - New Accounting Standard on Joint Arrangements
53
(1) Calculated on the basis of the accounting principles prevailing as at December 31, 2013 (i.e. applying the proportionate
consolidation method for the joint-ventures)
(2) Net income attributable to the owners of the parent company
12 Months, after
IFRS 11 application
Joint ventures
contribution
12 Months before IFRS
11 application
FY 2014
reported
FY 2013
restated FY 2014 FY 2013
FY 2014
Pro forma (1)
FY 2013
reported
Volumes
Cement (MT) 116.4 114.4 22.6 22.4 139.0 136.8
Pure aggregates (MT) 161.4 165.0 29.4 27.8 190.8 192.8
Ready-Mix Concrete (Mm3) 26.4 26.7 4.2 4.0 30.6 30.7
Sales 12,843 13,091 2,324 2,107 15,167 15,198
EBITDA 2,721 2,794 370 308 3,091 3,102
EBITDA Margin 21.2% 21.3% 15.9% 14.6% 20.4% 20.4%
Current Operating Income 1,881 1,937 203 138 2,084 2,075
Net income Group share (2) 143 601 143 601
Cash Flow from operations 1,040 1,161 150 130 1,190 1,291
Net debt 9,310 9,846 495 484 9,805 10,330
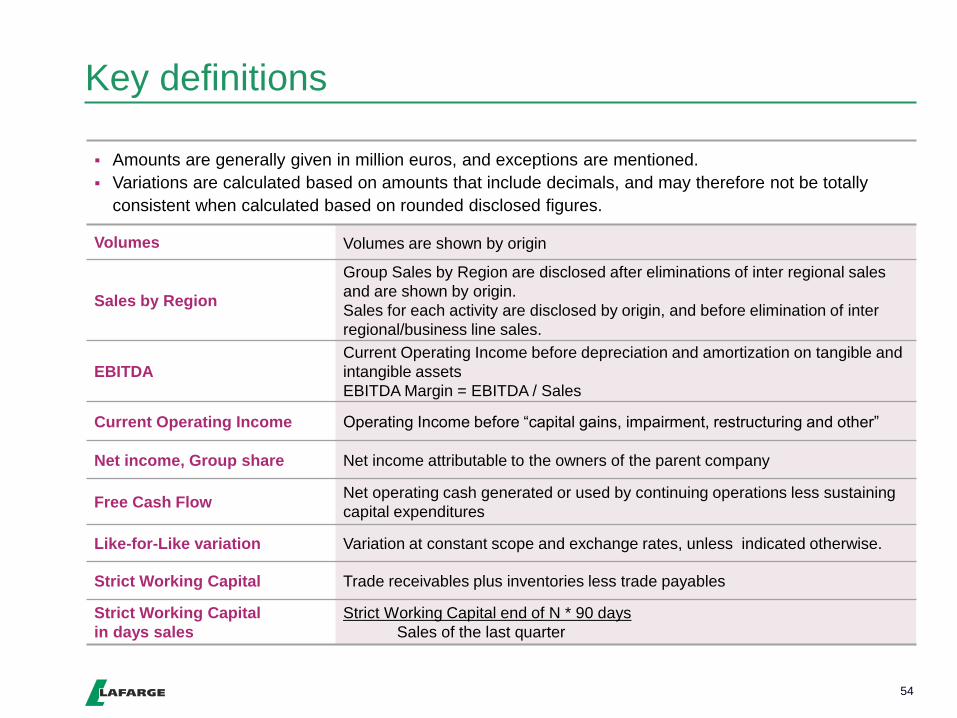
Key definitions
54
Amounts are generally given in million euros, and exceptions are mentioned.
Variations are calculated based on amounts that include decimals, and may therefore not be totally
consistent when calculated based on rounded disclosed figures.
Volumes Volumes are shown by origin
Sales by Region
Group Sales by Region are disclosed after eliminations of inter regional sales
and are shown by origin.
Sales for each activity are disclosed by origin, and before elimination of inter
regional/business line sales.
EBITDA
Current Operating Income before depreciation and amortization on tangible and
intangible assets
EBITDA Margin = EBITDA / Sales
Current Operating Income Operating Income before “capital gains, impairment, restructuring and other”
Net income, Group share Net income attributable to the owners of the parent company
Free Cash Flow Net operating cash generated or used by continuing operations less sustaining
capital expenditures
Like-for-Like variation Variation at constant scope and exchange rates, unless indicated otherwise.
Strict Working Capital Trade receivables plus inventories less trade payables
Strict Working Capital
in days sales
Strict Working Capital end of N * 90 days
Sales of the last quarter

![WELCOME TO THE ASCOM MEDIA & ANALYST CONFERENCE 2011 FULL ... · WELCOME TO THE ASCOM MEDIA & ANALYST CONFERENCE 2011 FULL -YEAR RESULTS [ ] 2011 FULL-YEAR RESULTS. FRITZ MUMENTHALER,](https://img.pdfslide.us/doc/110x75/5e6c2c8e7a9971707e2a491f/welcome-to-the-ascom-media-analyst-conference-2011-full-welcome-to-the.jpg)