Embed Size (px)
Citation preview
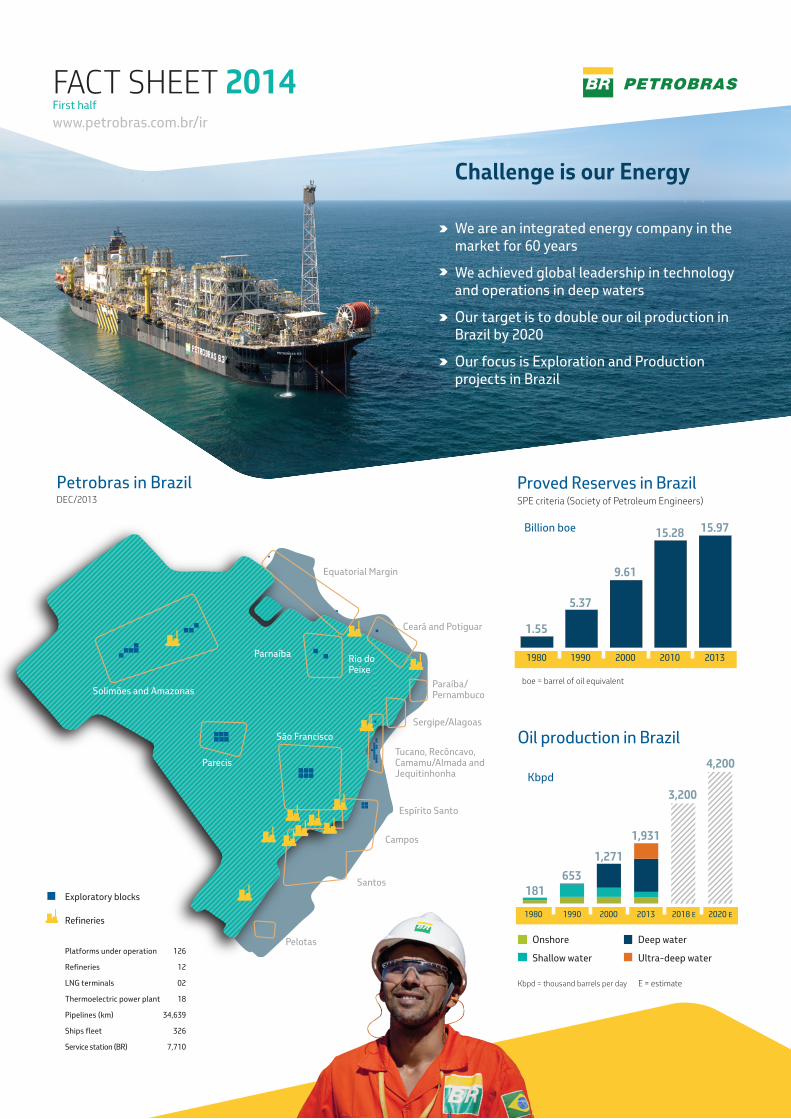
Challenge is our Energy
We are an integrated energy company in the market for 60 years
We achieved global leadership in technology and operations in deep waters
Our target is to double our oil production in Brazil by 2020
Our focus is Exploration and Production projects in Brazil
Proved Reserves in BrazilSPE criteria (Society of Petroleum Engineers)
Billion boe
boe = barrel of oil equivalent
Oil production in Brazil
Kbpd
Onshore
Shallow water
Deep water
Ultra-deep water
Kbpd = thousand barrels per day E = estimate
Platforms under operation
Refineries
126
12
LNG terminals 02
Thermoelectric power plant 18
Pipelines (km) 34,639
Ships fleet 326
Service station (BR) 7,710
Exploratory blocks
Refineries
Petrobras in BrazilDEC/2013
Equatorial Margin
Ceará and Potiguar
Parnaíba Rio do Peixe
Solimões and Amazonas
Parecis
São Francisco
Pelotas
Santos
Campos
Espírito Santo
Sergipe/Alagoas
Paraíba/ Pernambuco
Tucano, Recôncavo,Camamu/Almada and Jequitinhonha
1980 1990 2010 20132000
1.55
5.37
15.28 15.97
9.61
1980 1990 2000 2013 2018 E 2020 E
181653
1,271
1,931
3,200
4,200
FACT SHEET 2014www.petrobras.com.br/irFirst half

Production Growth andPre-salt Record
Our oil production in Brazil will grow by 7.5% in 2014. The target for 2020 is 4.2 million barrels/day
Nine new platforms were completed in 2013, adding 1 million barrels of production capacity per day, and two more units will support production growth in 2014
We reached a new daily production record on the Pre-salt fields of 412,000 barrels on February, 2014, confirming the high productivity of this region
Our Reserves Replacement Ratio in 2013 was 131% (22 consecutive years above 100%)
2030 Strategic Plan Oil production increases up to 2020 and sustains at an average of 4 million barrels of oil per day for the 2020-2030 period.
2014-2018 Business and Management Plan
Exploration & Production
Downstream
Gas & Energy
International
Biofuels
Distribution
Engineering, Technology and Materials
Financial Area, Strategy and
Corporate - Services
70%(US$ 153.9 billion)
18% (US$ 38.7 billion)
5% (US$ 10.1 billion)
4% (US$ 9.7 billion)
1% (US$ 2.3 billion)
1.2% (US$ 2.7 billion)
1% (US$ 2.2 billion)
0.4% (US$ 1.0 billion)Consolidated Financial ResultsUS$ Billion
201211.03
42.95
27.63
72.34
169.04
30%
2.62
201120.10
43.16
37.30
54.90
177.11
24%
1.47
201019.18
45.08
32.62
36.70
183.40
17%
1.12
201311.09
48.09
29.42
94.57
149.12
39%
3.21
Net Income
Capex and Investments
EBITDA
Net debt
Shareholder’s Equity
Net Debt / Net Capitalization
Net Debt / EBITDA
An Investment Grade Company
Petrobras Rating
Baa1
BBB
BBB-
Credit Rating Agency
Moody’s
FitchRatings
Standard & Poor’s
PBR/APBR
14.6913.78
NYSE (US$ per ADR)
2nd most traded ADRs (American Depositary Receipt)of NYSE in 2013
Ticker
Price in 12/31/2013
Dividend Yield*
PBR/A PBR
4.0%3.5%
4.4%4.1%
5.0%5.5%
2.4%3.2%
2010 2012 20132011
* Dividend per share proposed in General Ordinary Meeting /Share price in the last day of the year
Source: Bloomberg
Total Dividends
35% 34%41%
36%
6,780 6,905
4,4993,970
2010 2012 20132011
US$ million
Total Dividends (US$ million)
Total Dividends / Net Income (%)
TotalUS$ 220.6 billion