Embed Size (px)
Citation preview
Q2 2015 FINANCIAL & OPERATING
HIGHLIGHTS
July 30, 2015
This presentation contains certain statements that constitute forward-looking information within the meaning of applicable securities laws (“forward-looking
statements”), which reflects management’s expectations regarding Teranga Gold Corporation’s (“Teranga” or the “Company”) future growth, results of operations
(including, without limitation, future production and capital expenditures), performance (both operational and financial) and business prospects (including the timing
and development of new deposits and the success of exploration activities) and opportunities. Wherever possible, words such as “plans”, “expects”, “does not
expect”, “budget”, “scheduled”, “estimates”, “forecasts”, “anticipate” or “does not anticipate”, “believe”, “intend”, “ability to” and similar expressions or statements that
certain actions, events or results “may”, “could”, “would”, “might” or “will” be taken, occur or be achieved, have been used to identify such forward looking
information. Although the forward-looking information contained in this presentation reflect management’s current beliefs based upon information currently available
to management and based upon what management believes to be reasonable assumptions, Teranga cannot be certain that actual results will be consistent with
such forward looking information. Such forward-looking statements are based upon assumptions, opinions and analysis made by management in light of its
experience, current conditions and its expectations of future developments that management believe to be reasonable and relevant. These assumptions include,
among other things, the ability to obtain any requisite Senegalese governmental approvals, the accuracy of mineral reserve and mineral resource estimates, gold
price, exchange rates, fuel and energy costs, future economic conditions, anticipated future estimates of free cash flow, and courses of action. Teranga cautions
you not to place undue reliance upon any such forward-looking statements, which speak only as of the date they are made.
The risks and uncertainties that may affect forward-looking statements include, among others: the inherent risks involved in exploration and development of mineral
properties, including government approvals and permitting, changes in economic conditions, changes in the worldwide price of gold and other key inputs, changes
in mine plans and other factors, such as project execution delays, many of which are beyond the control of Teranga, as well as other risks and uncertainties which
are more fully described in the Company’s Annual Information Form dated March 31, 2015, and in other company filings with securities and regulatory authorities
which are available at www.sedar.com. Teranga does not undertake any obligation to update forward-looking statements should assumptions related to these plans,
estimates, projections, beliefs and opinions change. Nothing in this report should be construed as either an offer to sell or a solicitation to buy or sell Teranga
securities.
This presentation is dated as of the date on the front cover. All references to the Company include its subsidiaries unless the context requires otherwise.
This presentation contains references to Teranga using the words “we”, “us”, “our” and similar words and the reader is referred to using the words “you”, “your” and
similar words.
All dollar amounts stated are denominated in U.S. dollars unless specified otherwise.
FORWARD-LOOKING STATEMENTS
2
RICHARD YOUNGPRESIDENT & CEO
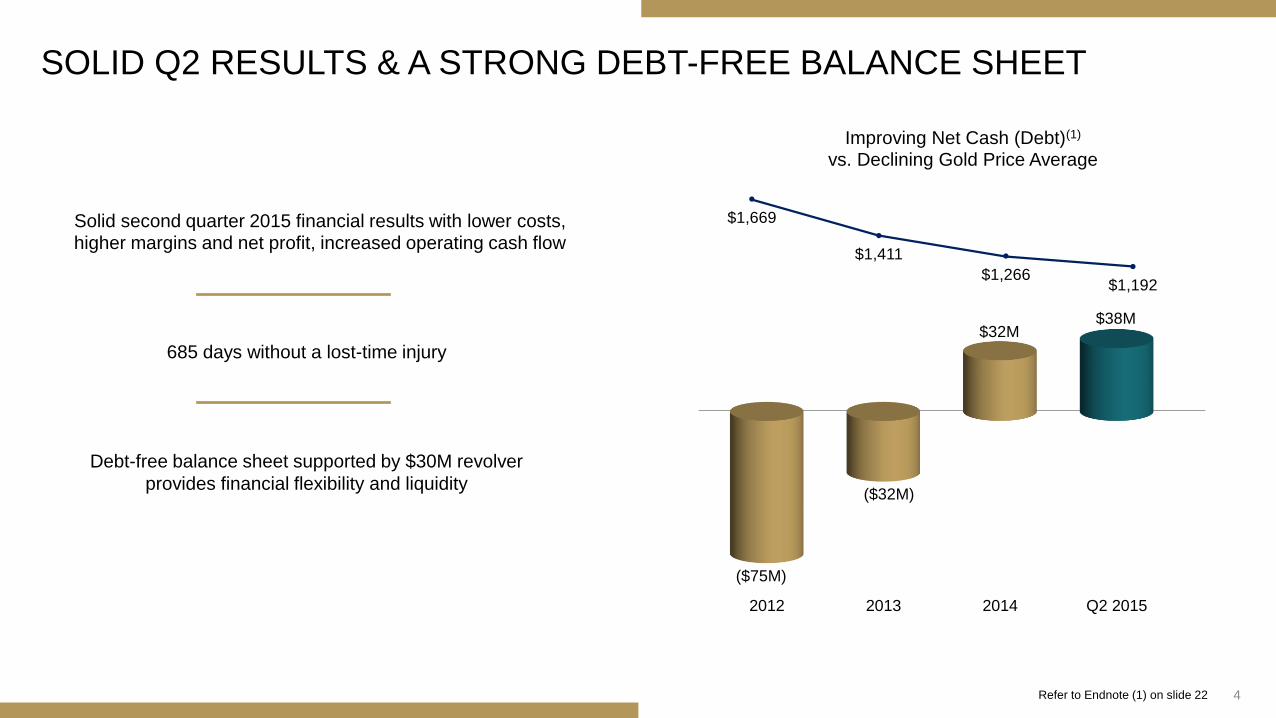
SOLID Q2 RESULTS & A STRONG DEBT-FREE BALANCE SHEET
Solid second quarter 2015 financial results with lower costs, higher margins and net profit, increased operating cash flow
4Refer to Endnote (1) on slide 22
2012 2013 2014 Q2 2015
($75M)
($32M)
$32M$38M
Improving Net Cash (Debt)(1)
vs. Declining Gold Price Average
685 days without a lost-time injury
Debt-free balance sheet supported by $30M revolver
provides financial flexibility and liquidity
$1,669
$1,411
$1,266 $1,192
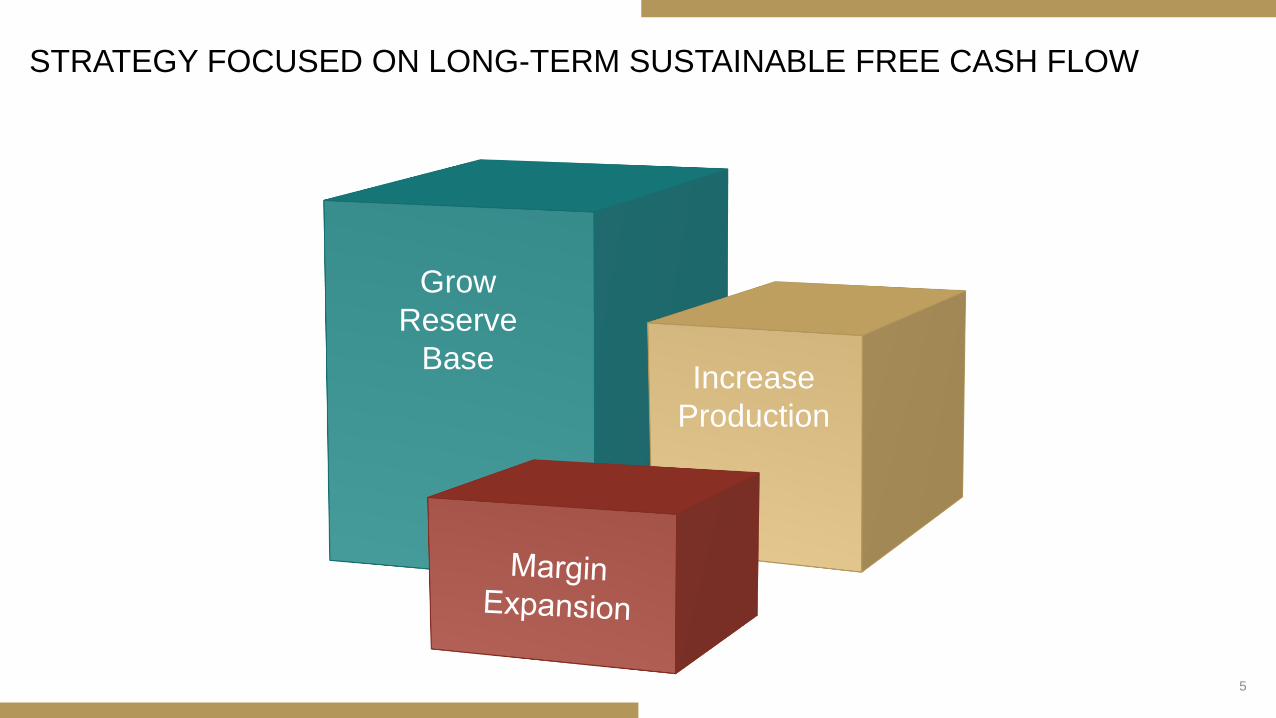
STRATEGY FOCUSED ON LONG-TERM SUSTAINABLE FREE CASH FLOW
Increase
Production
Grow
Reserve
Base
5
$1,192/oz
6
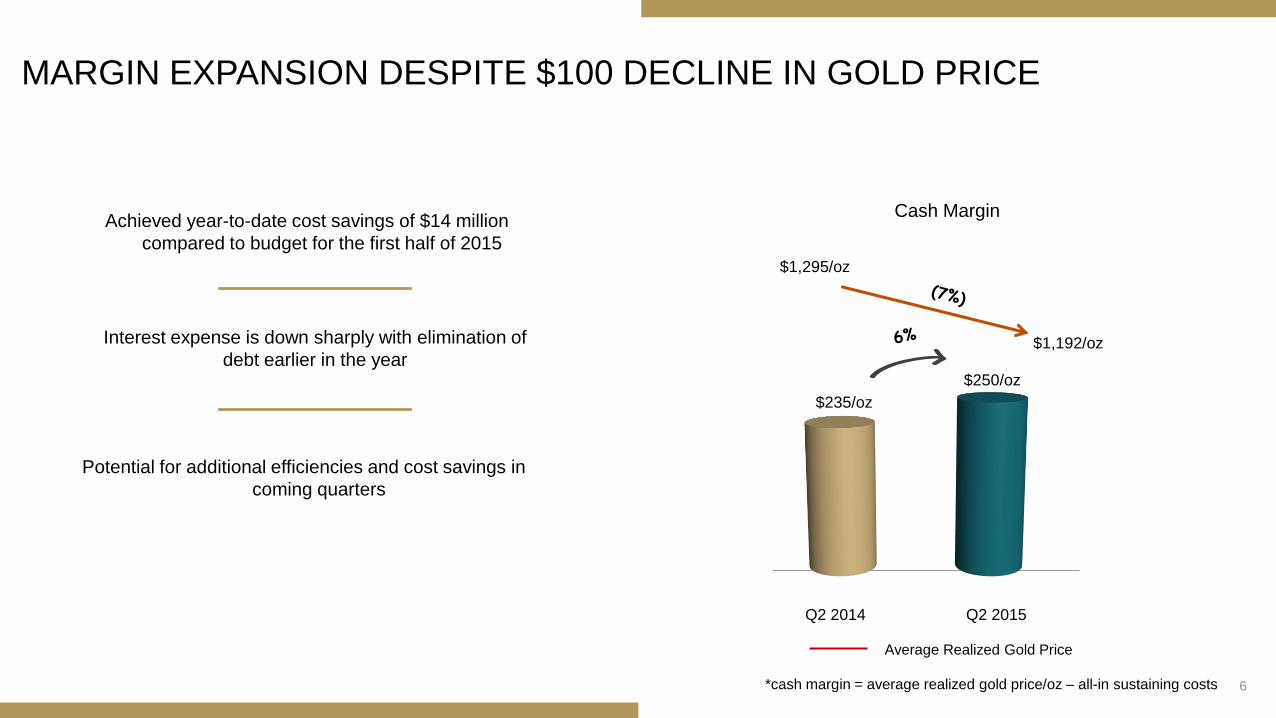
MARGIN EXPANSION DESPITE $100 DECLINE IN GOLD PRICE
Interest expense is down sharply with elimination of
debt earlier in the year
Potential for additional efficiencies and cost savings in
coming quarters
Achieved year-to-date cost savings of $14 million
compared to budget for the first half of 2015
$235/oz
$250/oz
$1,295/oz
Cash Margin
*cash margin = average realized gold price/oz – all-in sustaining costs
Q2 2014 Q2 2015
Average Realized Gold Price
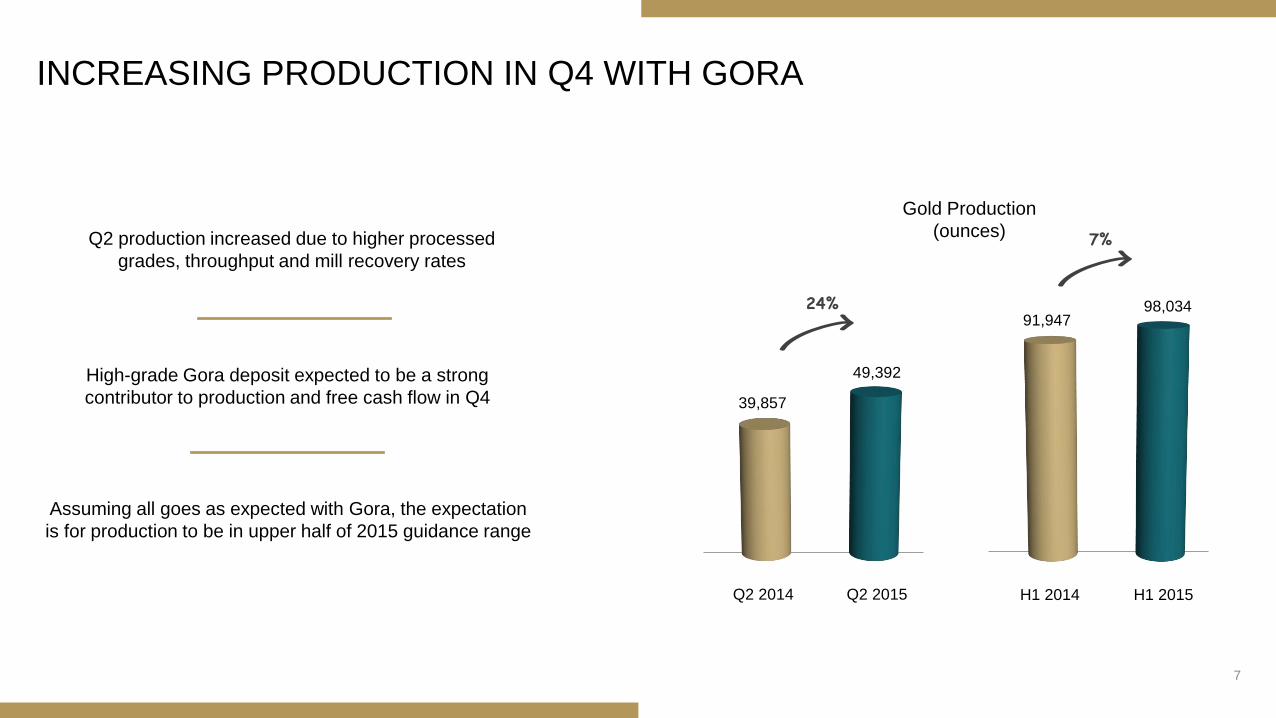
High-grade Gora deposit expected to be a strong
contributor to production and free cash flow in Q4
INCREASING PRODUCTION IN Q4 WITH GORA
Q2 2014 Q2 2015
39,857
49,392 200-
230
7
Q2 production increased due to higher processed
grades, throughput and mill recovery rates
Assuming all goes as expected with Gora, the expectation
is for production to be in upper half of 2015 guidance range
H1 2014 H1 2015
91,94798,034
Gold Production
(ounces)
24%
7%
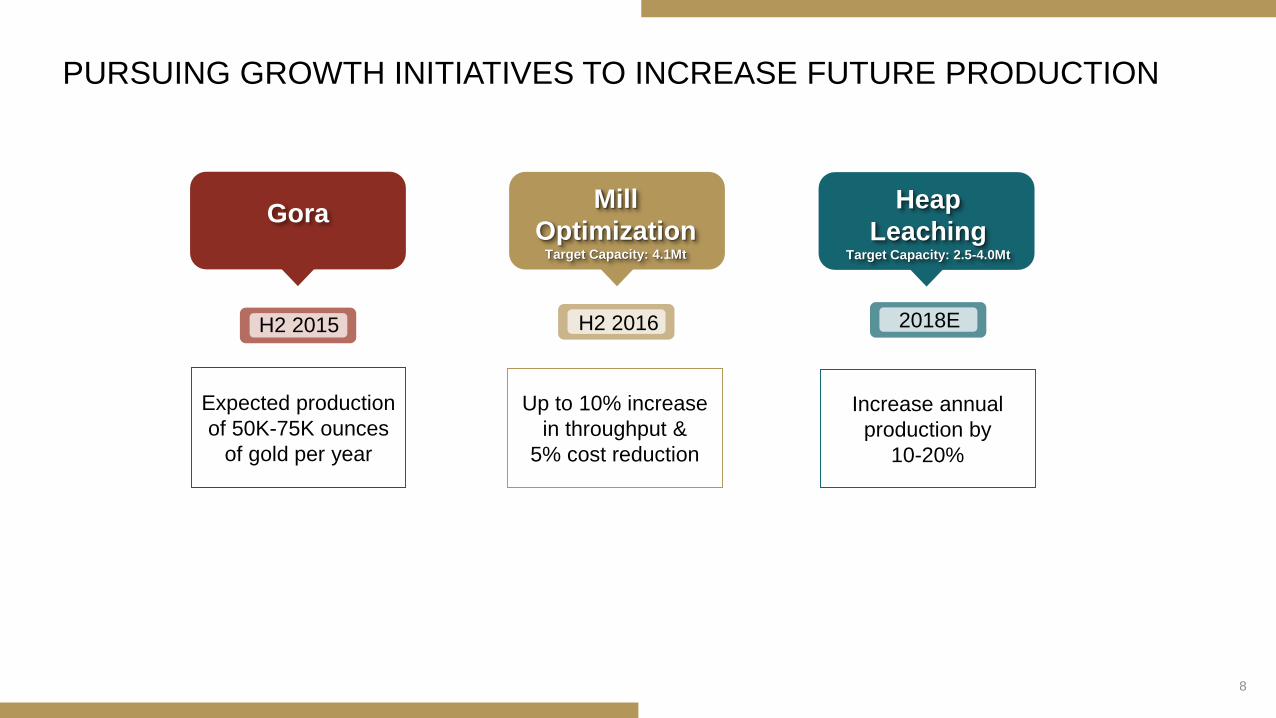
PURSUING GROWTH INITIATIVES TO INCREASE FUTURE PRODUCTION
Mill
OptimizationTarget Capacity: 4.1Mt
H2 2016
Gora
H2 2015
Expected production
of 50K-75K ounces
of gold per year
Up to 10% increase
in throughput &
5% cost reduction
Heap
LeachingTarget Capacity: 2.5-4.0Mt
2018E
Increase annual
production by
10-20%
8
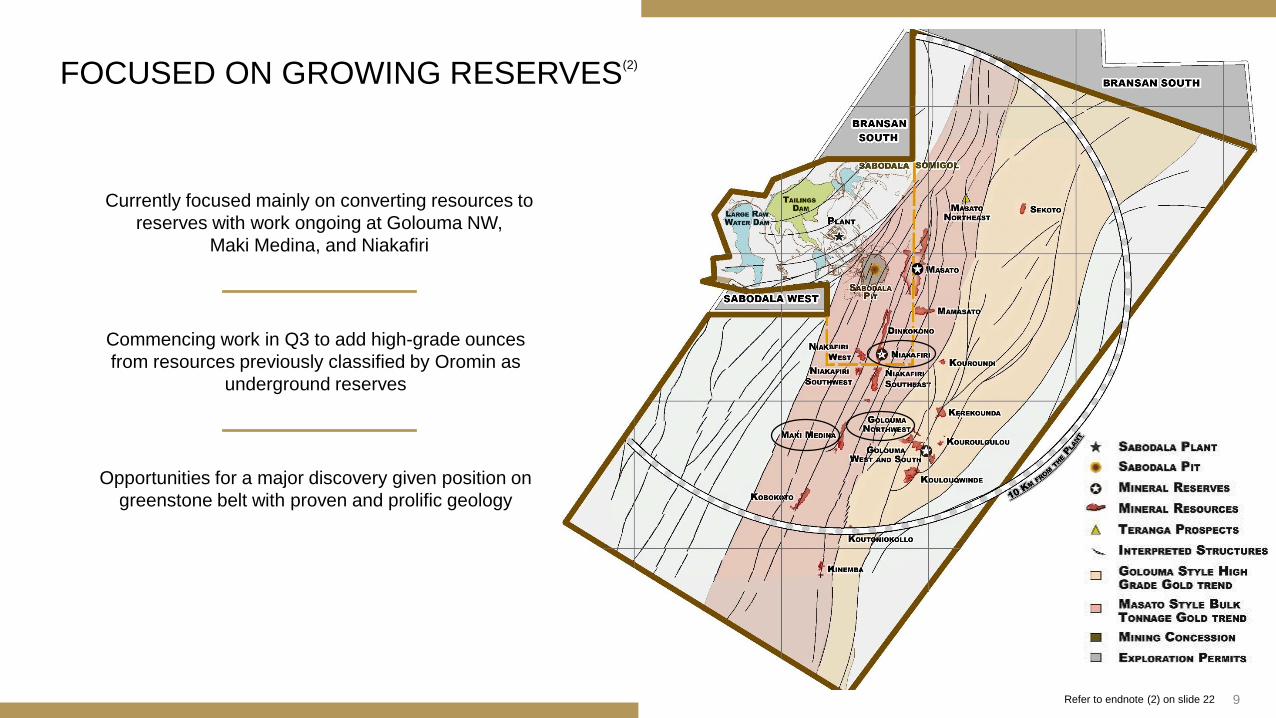
FOCUSED ON GROWING RESERVES(2)
Refer to endnote (2) on slide 22
Opportunities for a major discovery given position on
greenstone belt with proven and prolific geology
Currently focused mainly on converting resources to
reserves with work ongoing at Golouma NW,
Maki Medina, and Niakafiri
Commencing work in Q3 to add high-grade ounces
from resources previously classified by Oromin as
underground reserves
9
10
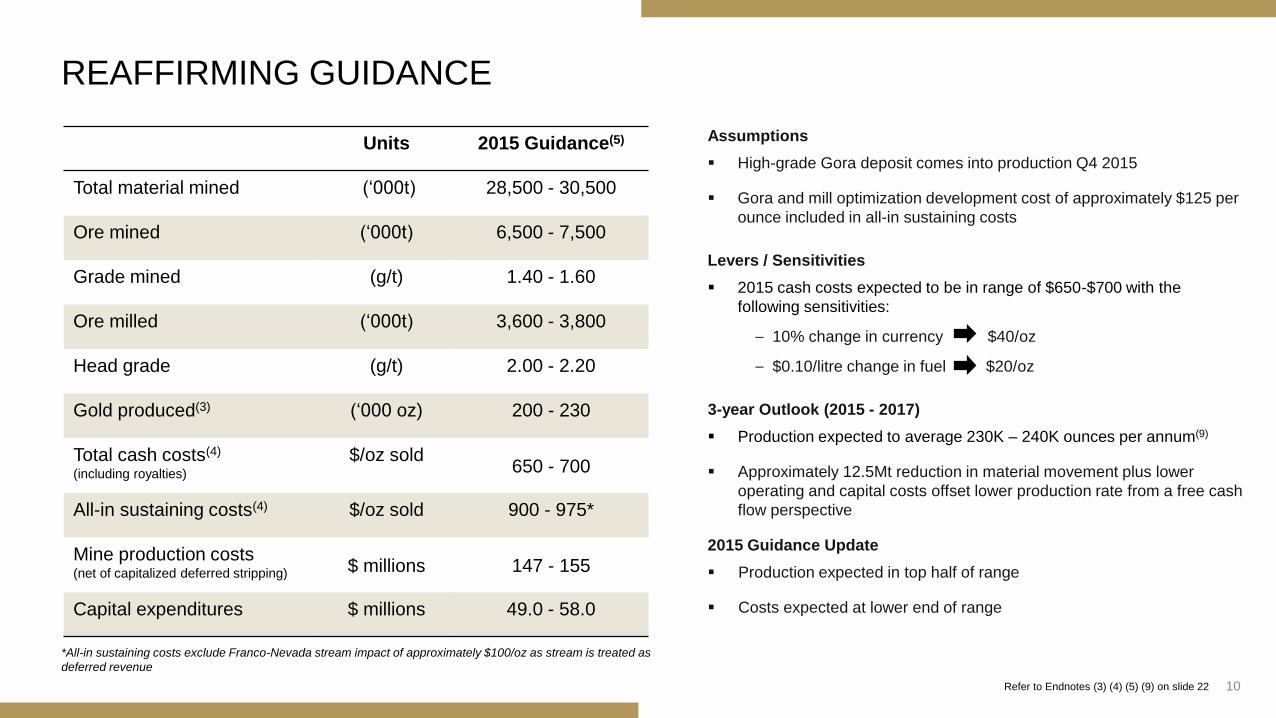
REAFFIRMING GUIDANCE
Refer to Endnotes (3) (4) (5) (9) on slide 22
Units 2015 Guidance(5)
Total material mined (‘000t) 28,500 - 30,500
Ore mined (‘000t) 6,500 - 7,500
Grade mined (g/t) 1.40 - 1.60
Ore milled (‘000t) 3,600 - 3,800
Head grade (g/t) 2.00 - 2.20
Gold produced(3) (‘000 oz) 200 - 230
Total cash costs(4)
(including royalties)
$/oz sold650 - 700
All-in sustaining costs(4) $/oz sold 900 - 975*
Mine production costs(net of capitalized deferred stripping) $ millions 147 - 155
Capital expenditures $ millions 49.0 - 58.0
Assumptions
High-grade Gora deposit comes into production Q4 2015
Gora and mill optimization development cost of approximately $125 per
ounce included in all-in sustaining costs
Levers / Sensitivities
2015 cash costs expected to be in range of $650-$700 with the
following sensitivities:
– 10% change in currency $40/oz
– $0.10/litre change in fuel $20/oz
3-year Outlook (2015 - 2017)
Production expected to average 230K – 240K ounces per annum(9)
Approximately 12.5Mt reduction in material movement plus lower
operating and capital costs offset lower production rate from a free cash
flow perspective
2015 Guidance Update
Production expected in top half of range
Costs expected at lower end of range
*All-in sustaining costs exclude Franco-Nevada stream impact of approximately $100/oz as stream is treated as
deferred revenue
NAVIN DYALVICE PRESIDENT & CFO
12
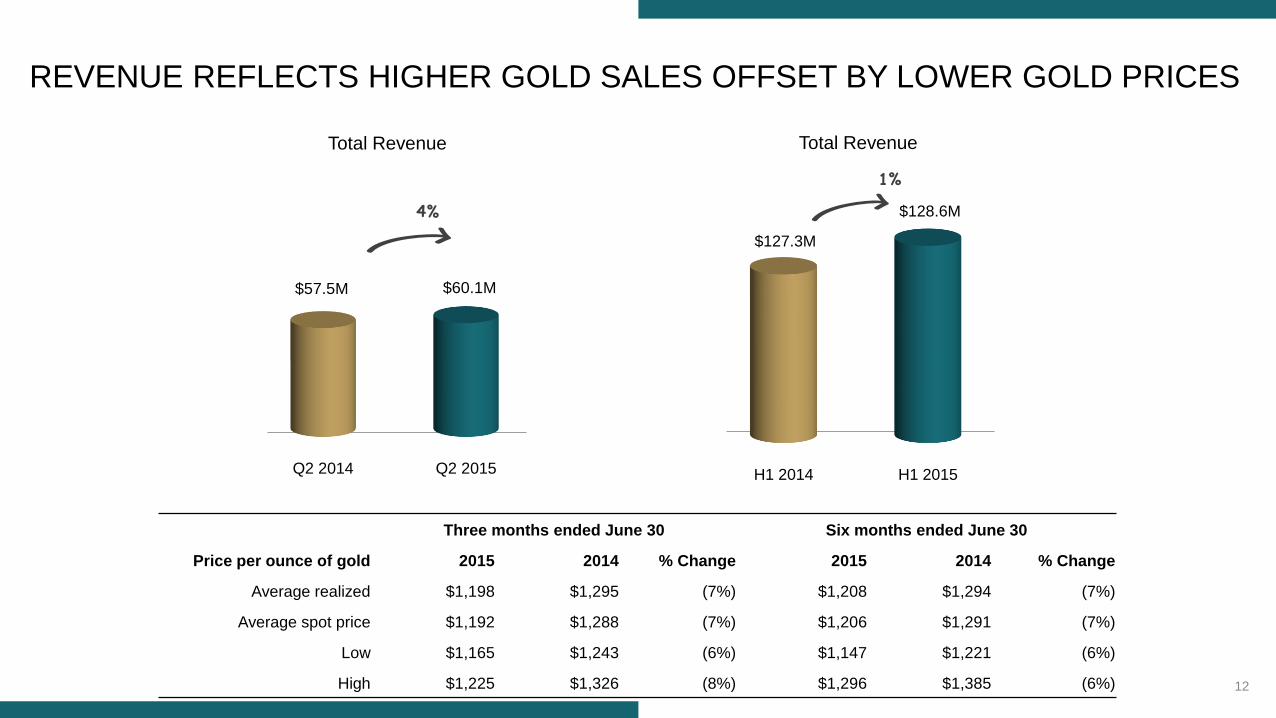
REVENUE REFLECTS HIGHER GOLD SALES OFFSET BY LOWER GOLD PRICES
Three months ended June 30 Six months ended June 30
Price per ounce of gold 2015 2014 % Change 2015 2014 % Change
Average realized $1,198 $1,295 (7%) $1,208 $1,294 (7%)
Average spot price $1,192 $1,288 (7%) $1,206 $1,291 (7%)
Low $1,165 $1,243 (6%) $1,147 $1,221 (6%)
High $1,225 $1,326 (8%) $1,296 $1,385 (6%)
1%
Total Revenue Total Revenue
H1 2014 H1 2015
$127.3M
$128.6M
Q2 2014 Q2 2015
$57.5M $60.1M
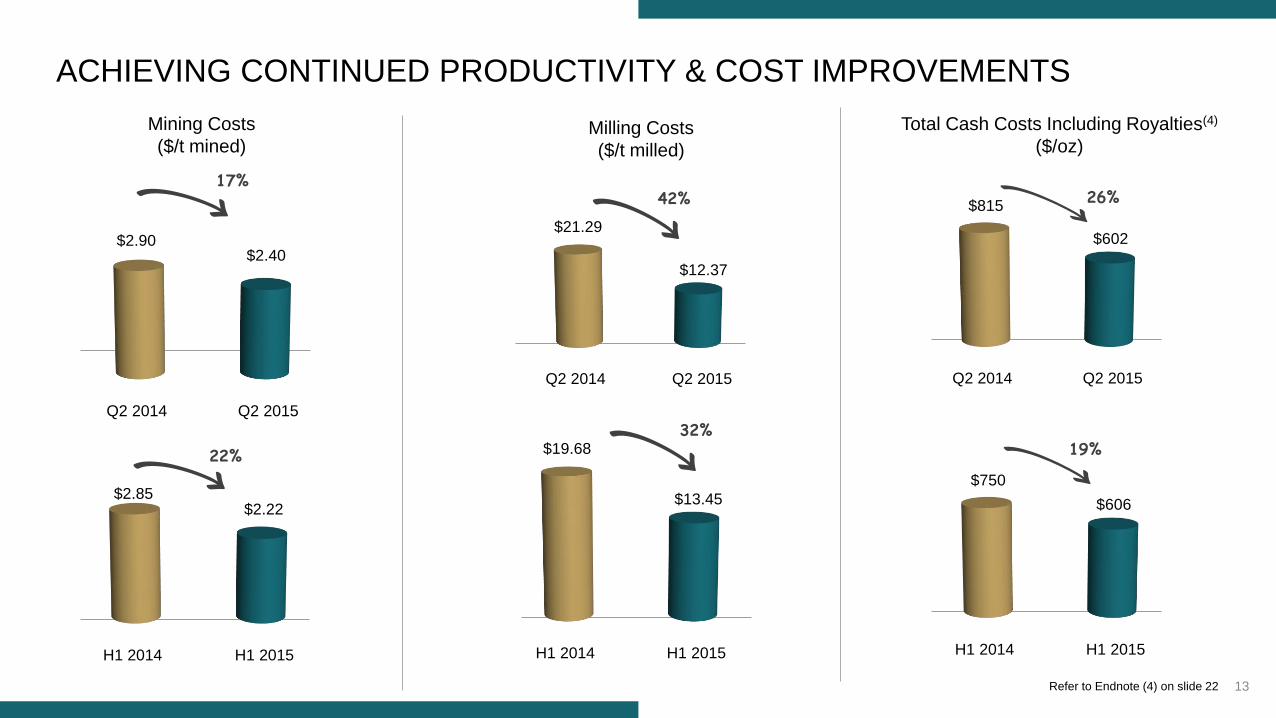
13
Q2 2014 Q2 2015
$815
$602
26%
ACHIEVING CONTINUED PRODUCTIVITY & COST IMPROVEMENTS
22%
42%17%
32%
Mining Costs
($/t mined)Milling Costs
($/t milled)
Total Cash Costs Including Royalties(4)
($/oz)
Q2 2014 Q2 2015
$2.90$2.40
H1 2014 H1 2015
$2.85$2.22
H1 2014 H1 2015
$19.68
$13.45
Refer to Endnote (4) on slide 22
Q2 2014 Q2 2015
$21.29
$12.37
H1 2014 H1 2015
$750
$606
19%
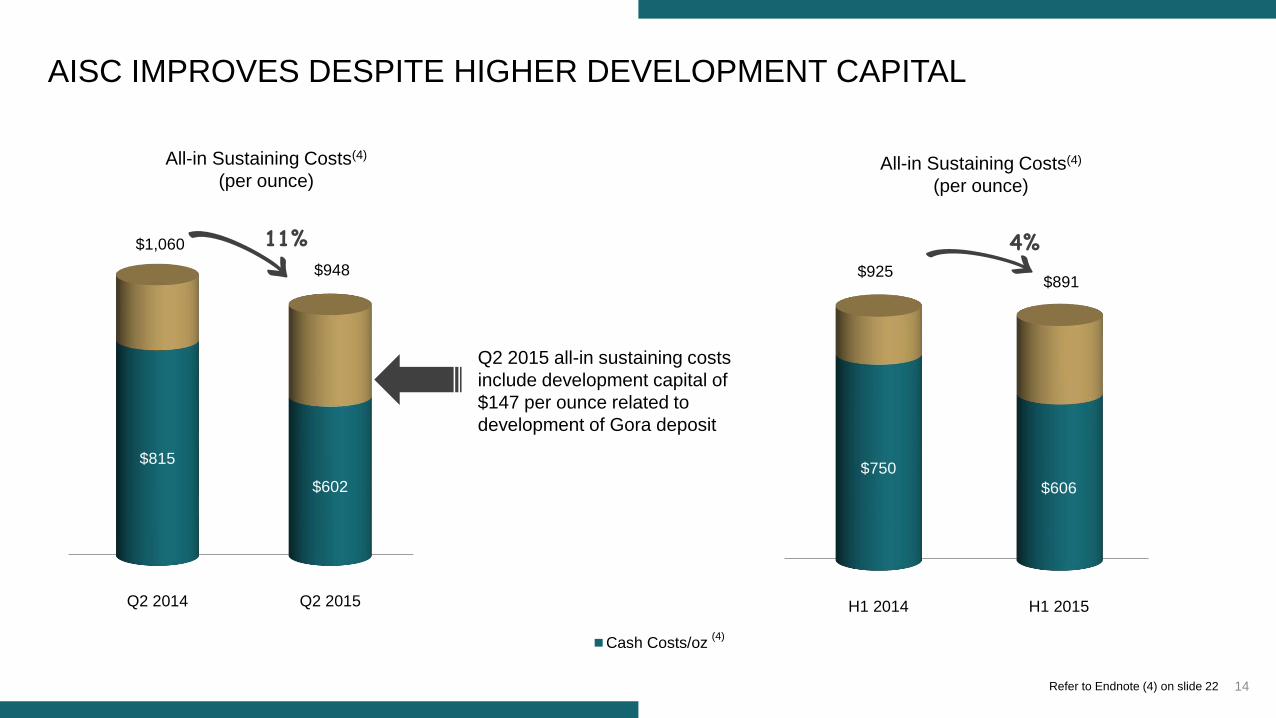
14
AISC IMPROVES DESPITE HIGHER DEVELOPMENT CAPITAL
Refer to Endnote (4) on slide 22
11% 4%
Q2 2015 all-in sustaining costs
include development capital of
$147 per ounce related to
development of Gora deposit
All-in Sustaining Costs(4)
(per ounce)All-in Sustaining Costs(4)
(per ounce)
(4)
Q2 2014 Q2 2015
$815
$602
$948
$1,060
H1 2014 H1 2015
$750
$606
Cash Costs/oz
$891$925
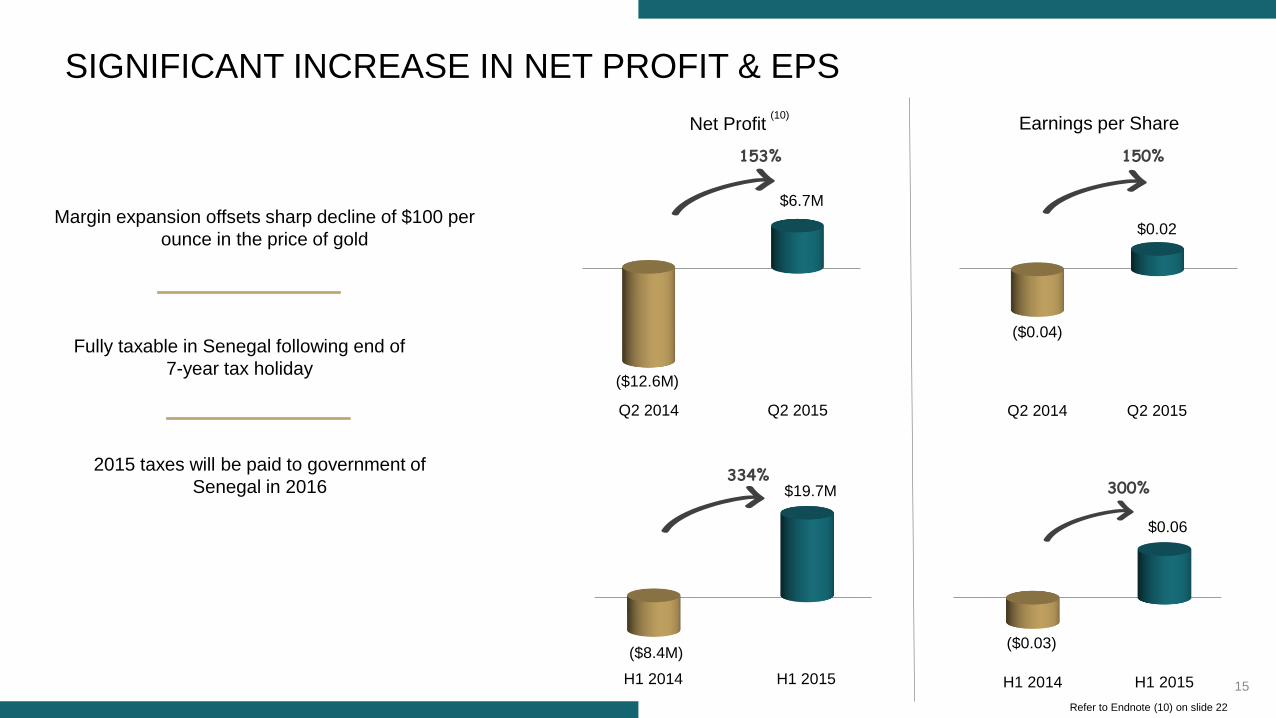
15H1 2014 H1 2015
($0.03)
$0.06
Q2 2014 Q2 2015
($0.04)
$0.02
Q2 2014 Q2 2015
($12.6M)
$6.7M
Net Profit
Fully taxable in Senegal following end of
7-year tax holiday
SIGNIFICANT INCREASE IN NET PROFIT & EPS
2015 taxes will be paid to government of
Senegal in 2016
Margin expansion offsets sharp decline of $100 per
ounce in the price of gold
(10)
Refer to Endnote (10) on slide 22
153% 150%
300%
Earnings per Share
H1 2014 H1 2015
($8.4M)
$19.7M334%
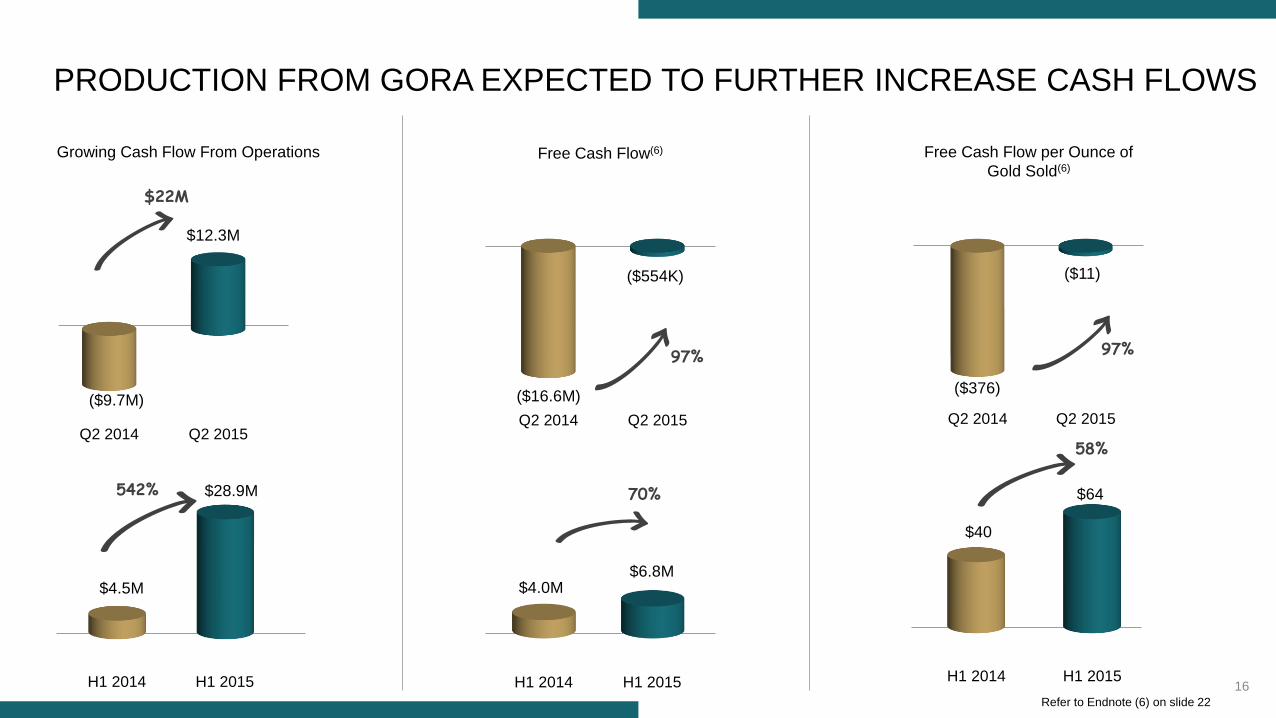
16
$28.9M
$4.5M
Refer to Endnote (6) on slide 22
($9.7M)
$12.3M
542%
Growing Cash Flow From Operations
PRODUCTION FROM GORA EXPECTED TO FURTHER INCREASE CASH FLOWS
$22M
Free Cash Flow(6) Free Cash Flow per Ounce of
Gold Sold(6)
97%
70%
97%
Q2 2014 Q2 2015
$4.0M$6.8M
($376)
($11)
$40
$64
($16.6M)
($554K)
H1 2014 H1 2015 H1 2014 H1 2015
58%
H1 2014 H1 2015
Q2 2014 Q2 2015Q2 2014 Q2 2015
17
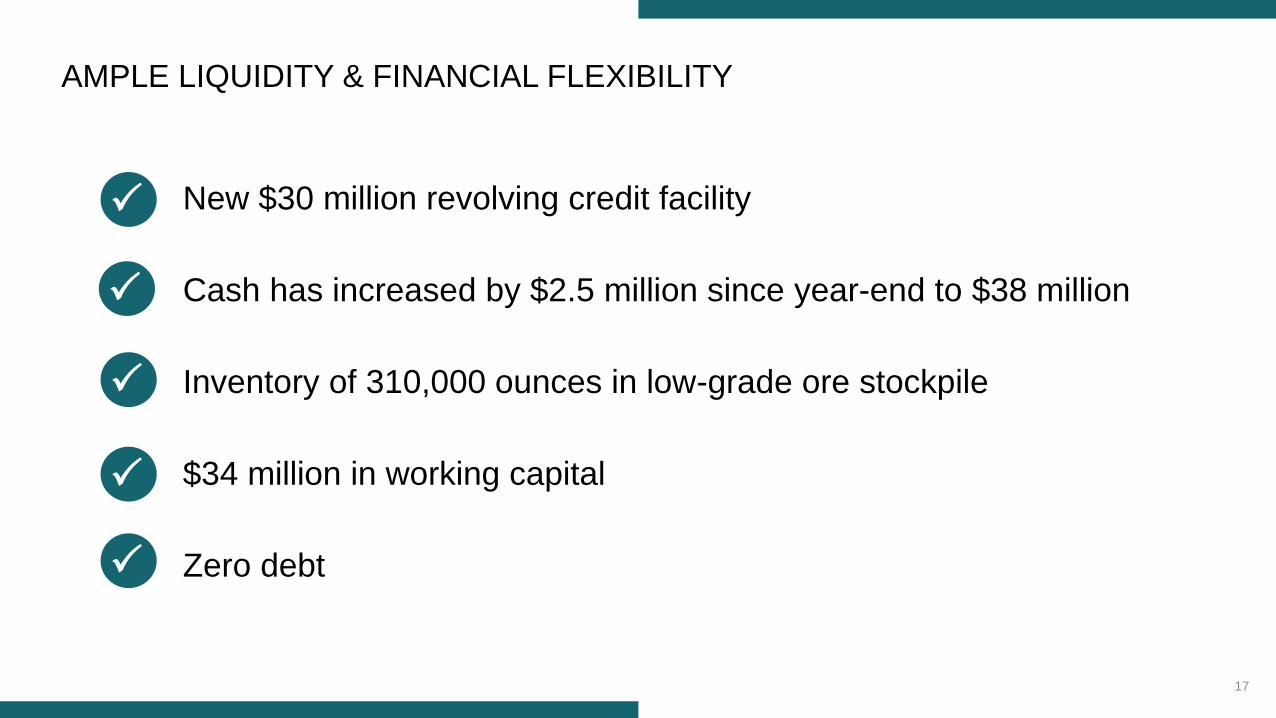
AMPLE LIQUIDITY & FINANCIAL FLEXIBILITY
New $30 million revolving credit facility
Cash has increased by $2.5 million since year-end to $38 million
Inventory of 310,000 ounces in low-grade ore stockpile
$34 million in working capital
Zero debt

RICHARD YOUNGPRESIDENT & CEO
CREATING SHAREHOLDER VALUE
Maximizing free cash flow and profitability
Strengthening our balance sheet
Successfully pursuing growth
19

Q&A

The technical information contained in this presentation relating to mine plans and associated costs is based on, and fairly represents, information compiled by
Mr. William Paul Chawrun, P. Eng who is a member of the Professional Engineers of Ontario, which is currently included as a "Recognized Overseas
Professional Organization" in a list promulgated by the ASX from time to time. Mr. Chawrun is a full-time employee of Teranga and is a "qualified person" as
defined in NI 43-101 and a "competent person" as defined in the 2012 Edition of the "Australasian Code for Reporting of Exploration Results, Mineral Resources
and Ore Reserves". Mr. Chawrun has sufficient experience relevant to the style of mineralization and type of deposit under consideration and to the activity he is
undertaking to qualify as a Competent Person as defined in the 2012 Edition of the "Australasian Code for Reporting of Exploration Results, Mineral Resources
and Ore Reserves". Mr. Chawrun has consented to the inclusion in this document of the matters based on his compiled information in the form and context in
which it appears in this presentation.
COMPETENT AND QUALIFIED PERSONS STATEMENT
21
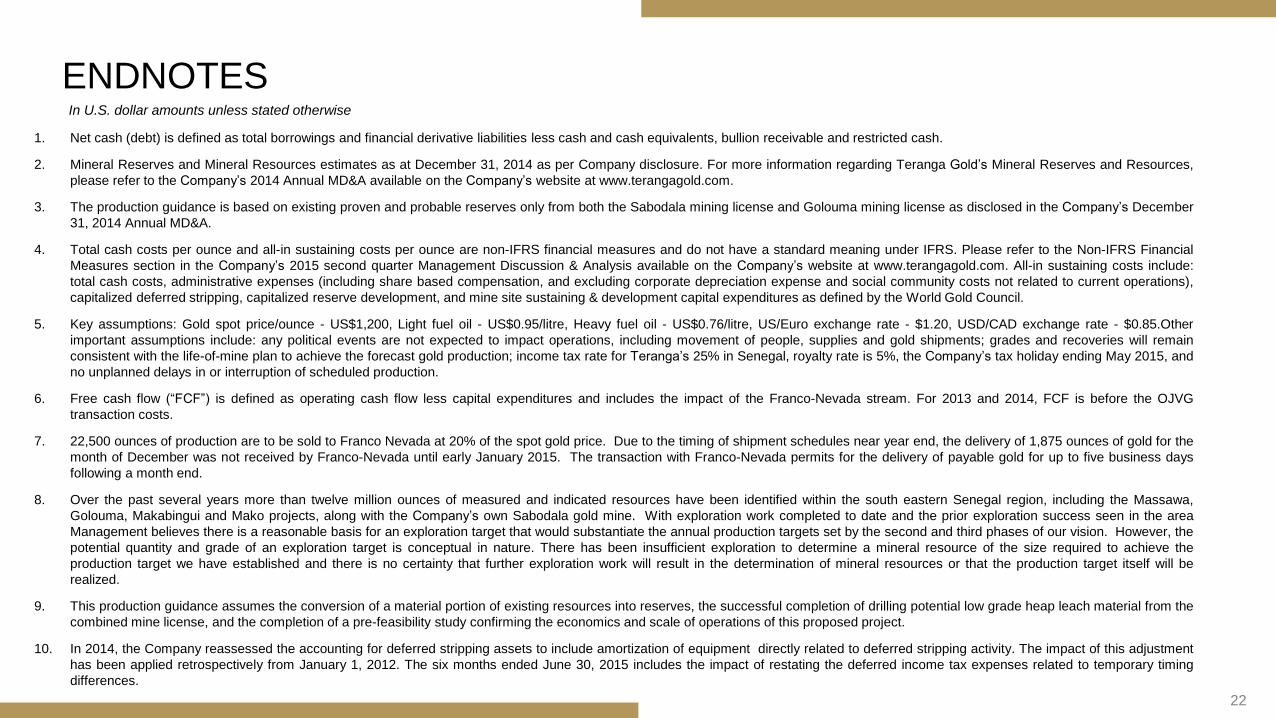
1. Net cash (debt) is defined as total borrowings and financial derivative liabilities less cash and cash equivalents, bullion receivable and restricted cash.
2. Mineral Reserves and Mineral Resources estimates as at December 31, 2014 as per Company disclosure. For more information regarding Teranga Gold’s Mineral Reserves and Resources,
please refer to the Company’s 2014 Annual MD&A available on the Company’s website at www.terangagold.com.
3. The production guidance is based on existing proven and probable reserves only from both the Sabodala mining license and Golouma mining license as disclosed in the Company’s December
31, 2014 Annual MD&A.
4. Total cash costs per ounce and all-in sustaining costs per ounce are non-IFRS financial measures and do not have a standard meaning under IFRS. Please refer to the Non-IFRS Financial
Measures section in the Company’s 2015 second quarter Management Discussion & Analysis available on the Company’s website at www.terangagold.com. All-in sustaining costs include:
total cash costs, administrative expenses (including share based compensation, and excluding corporate depreciation expense and social community costs not related to current operations),
capitalized deferred stripping, capitalized reserve development, and mine site sustaining & development capital expenditures as defined by the World Gold Council.
5. Key assumptions: Gold spot price/ounce - US$1,200, Light fuel oil - US$0.95/litre, Heavy fuel oil - US$0.76/litre, US/Euro exchange rate - $1.20, USD/CAD exchange rate - $0.85.Other
important assumptions include: any political events are not expected to impact operations, including movement of people, supplies and gold shipments; grades and recoveries will remain
consistent with the life-of-mine plan to achieve the forecast gold production; income tax rate for Teranga’s 25% in Senegal, royalty rate is 5%, the Company’s tax holiday ending May 2015, and
no unplanned delays in or interruption of scheduled production.
6. Free cash flow (“FCF”) is defined as operating cash flow less capital expenditures and includes the impact of the Franco-Nevada stream. For 2013 and 2014, FCF is before the OJVG
transaction costs.
7. 22,500 ounces of production are to be sold to Franco Nevada at 20% of the spot gold price. Due to the timing of shipment schedules near year end, the delivery of 1,875 ounces of gold for the
month of December was not received by Franco-Nevada until early January 2015. The transaction with Franco-Nevada permits for the delivery of payable gold for up to five business days
following a month end.
8. Over the past several years more than twelve million ounces of measured and indicated resources have been identified within the south eastern Senegal region, including the Massawa,
Golouma, Makabingui and Mako projects, along with the Company’s own Sabodala gold mine. With exploration work completed to date and the prior exploration success seen in the area
Management believes there is a reasonable basis for an exploration target that would substantiate the annual production targets set by the second and third phases of our vision. However, the
potential quantity and grade of an exploration target is conceptual in nature. There has been insufficient exploration to determine a mineral resource of the size required to achieve the
production target we have established and there is no certainty that further exploration work will result in the determination of mineral resources or that the production target itself will be
realized.
9. This production guidance assumes the conversion of a material portion of existing resources into reserves, the successful completion of drilling potential low grade heap leach material from the
combined mine license, and the completion of a pre-feasibility study confirming the economics and scale of operations of this proposed project.
10. In 2014, the Company reassessed the accounting for deferred stripping assets to include amortization of equipment directly related to deferred stripping activity. The impact of this adjustment
has been applied retrospectively from January 1, 2012. The six months ended June 30, 2015 includes the impact of restating the deferred income tax expenses related to temporary timing
differences.
In U.S. dollar amounts unless stated otherwise
ENDNOTES
22