Embed Size (px)
Citation preview
REGULATION IN THE CONVERGED
MEDIA-INTERNET-TELECOM VALUE WEB
INTRODUCING THE DAMIAN METHOD FOR SYSTEMATIC
ANALYSIS OF THE INTERDEPENDENCIES BETWEEN
SERVICES, ORGANISATIONS AND REGULATION
BY PIETER NOOREN, WIETSKE KOERS, MENNO BANGMA, FRANK BERKERS AND ERIK BOERTJES
REGULATION IN THE CONVERGED
MEDIA-INTERNET-TELECOM VALUE WEB
INTRODUCING THE DAMIAN METHOD FOR SYSTEMATIC
ANALYSIS OF THE INTERDEPENDENCIES BETWEEN
SERVICES, ORGANISATIONS AND REGULATION
BY PIETER NOOREN, WIETSKE KOERS, MENNO BANGMA, FRANK BERKERS AND ERIK BOERTJES
TNO REPORT R11428, OCTOBER 2014
EXECUTIVE SUMMARY
3
The convergence between media, internet
and telecoms has brought many new
services, devices and distribution models.
One of the key outcomes of convergence is
that the traditional value chain has evolved
into a value web, with multiple, parallel
routes that services can follow between
creation and consumption. The availability of
multiple routes for delivery of services to end
users helps to remove a number of traditional
bottlenecks. At the same time, new
bottlenecks can appear as the routes bring
new technical and business dependencies
between organisations in the web. The
dynamics in the value web are also affected
by various types of regulation. The analysis in
this white paper shows that services that are
very similar to end users can be subject to
different regulations, depending on the route
through the value web and the organisations
involved. This is one of the challenges that
policy makers and regulators face when they
aim to adapt regulation to technical and
business developments.
In this white paper, we introduce the
DAMIANTM method that TNO has developed
for the systematic analysis of the converged
value web, including the effects of regulation.
This is done by identifying the roles that
organisations have, their roles and activities,
the markets in which they operate, the assets
that they own and the assets that they need
to obtain from other organisations in order to
offer their services. This leads to an
integrated view of influence and
interdependencies and how these are
affected by regulation. Every step in the
DAMIAN method reflects the crucial transition
from value chains to an integrated value
web.
The DAMIAN method has been successfully
applied in workshops with many
stakeholders, including operators, content
providers, ministries, regulators, device
makers and consumer interest groups. In the
workshops, DAMIAN has been used to
analyse interactive television services, video
distribution in general and neutrality
throughout the value web. In this paper, we
illustrate the DAMIAN method by applying it
to a new case: recommendation services for
audiovisual content, again based on inputs
provided by a variety of stakeholders during a
workshop.
In their feedback, the workshop participants
have indicated that DAMIAN helps to keep all
participants ‘on the same page’ in their
analysis of a complex value web, resulting in
a more productive and efficient discussion.
Moreover, they state that the careful scoping
in terms of end-user services helps to prevent
a short-sighted analysis focused at points
that happen to receive media attention at the
time of the analysis. Finally, the discussion
on openness and alternatives for assets
brings a deeper understanding of the
different views among the participants.
Based on their experience with the DAMIAN
method and tool, most of the participants
expect that they will apply the method
themselves or will be involved in DAMIAN
analyses of other cases. 4

TABLE OF CONTENTS
5
EXECUTIVE SUMMARY
1 INTRODUCTION
2 FROM VALUE CHAIN TO VALUE WEB: CONVERGENCE BETWEEN MEDIA, INTERNET
AND TELECOM
2.1 THE CONVERGENCE BETWEEN MEDIA, INTERNET AND TELECOM
2.2 CONVERGENCE IN PRACTICE: DELIVERY OF VIDEO SERVICES TO CONSUMERS
2.3 THE MANY TYPES OF REGULATION IN THE CONVERGED VALUE WEB
3 INTRODUCING THE DAMIAN METHOD
3.1 THE DAMIAN METHOD AT A GLANCE
3.2 OBSERVING POTENTIAL ISSUES IN THE MEDIA-INTERNET-TELECOM VALUE WEB
3.3 INVESTIGATING THE SERVICE DELIVERY: ORGANISATIONS, ROUTES AND ASSETS
3.4 UNDERSTANDING VALUE WEB DYNAMICS: EFFECTS OF ASSETS AND REGULATION
3.5 ANALYSING AND DISCUSSING THE INTERDEPENDENCIES IN THE VALUE WEB
3.6 “WHAT IF…”–SCENARIOS AND FOLLOW-UP
4 CONCLUSION
BIBLIOGRAPHY
6

1. INTRODUCTION
7
The convergence between media, internet
and telecoms is a game changer that has
brought many new services, devices and
distribution models. As a result of
convergence, services that look similar to end
users can take very different routes through
the value web. For example, the catch-up
services for TV content offered by triple-play
providers, broadcasters and on-line video
service providers use different business
models and distribution routes to reach end
users.
Zooming in, we see that many organisations
are involved in the co-existing routes between
creation and consumption. The organisations
cooperate and compete at the same time
and, as a result, they depend on one another
in complicated ways. Another key observation
is that although the services are very similar
and compete for the same end users, they
can be subject to different regulation,
depending on the route through the value
web and the organisations involved.
In this white paper, we introduce the DAMIAN
method that TNO has developed for the
systematic analysis of the converged value
web. The first aim of the DAMIAN method is
to identify and unravel the many
interdependencies between organisations in
the web. Second, DAMIAN determines how
regulation affects the interdependencies and
the conditions in which organisations offer
their services.
A core activity in the DAMIAN method is the
visualisation of service delivery routes,
organisations, assets and regulation in the
value web. Step-by-step, these crucial
components are identified and recorded in
the graphical DAMIAN tool to build a
comprehensive value web for the case under
consideration. Then, filters and selections
can be applied to investigate
interdependencies and assess the effects of
(new) policies and regulations.
In section 2, we first explain the background
of the converged media-internet-telecom
value web by looking at different service and
distribution models for catch-up TV services
offered by different providers. Then, in
section 3, we introduce the DAMIAN method
and illustrate it step-by-step using the case of
personalised recommendation services for
video content.
The DAMIAN method and tool have been
developed in two projects by TNO, partially
co-funded by the Dutch public broadcaster
NPO and the operators Ziggo, UPC, Vodafone
and KPN. DAMIAN has been applied in
workshops with many additional
stakeholders, including other operators,
content providers, ministries, regulators,
device makers and consumer interest
groups, which have provided value inputs for
the approach. TNO is responsible for the
content of this whitepaper and the way the
inputs from the stakeholders have been used
in its development.
PLEASE NOTE THAT THE SERVICE
DELIVERY ROUTES AND COMPANY LOGOS
SHOWN IN THIS WHITE PAPER ARE FOR
ILLUSTRATION PURPOSES ONLY 8
2. FROM VALUE CHAIN TO VALUE
WEB: CONVERGENCE BETWEEN
MEDIA, INTERNET AND TELECOM
9
The convergence between media, internet
and telecoms has brought many new
services, devices and distribution models.
Attracted by the large customer groups that
can be reached over the internet, device
vendors (such as Apple and Samsung), media
organisations (RTL, Netflix) and service
providers (Google, Microsoft) have enriched
the ecosystem with various combinations of
hardware and software, such as
smartphones, tablets, content delivery
networks and cloud infrastructures. These
organisations provide media and
communication applications themselves, but
also enable other organisations, small and
large, to develop and distribute their own
applications.
As a result, many new technical and business
relations have developed in this ecosystem at
the level of networks, services and markets.
This has profoundly changed the way in
which content and services are produced,
distributed and used. Organisations in the
converged value web actively search for
technical and commercial opportunities that
present themselves in order to gain a
competitive advantage. They carefully
position their services and devices in the
converged media-internet-telecom web, well
aware of the competition they face from
organisations that used to operate in other,
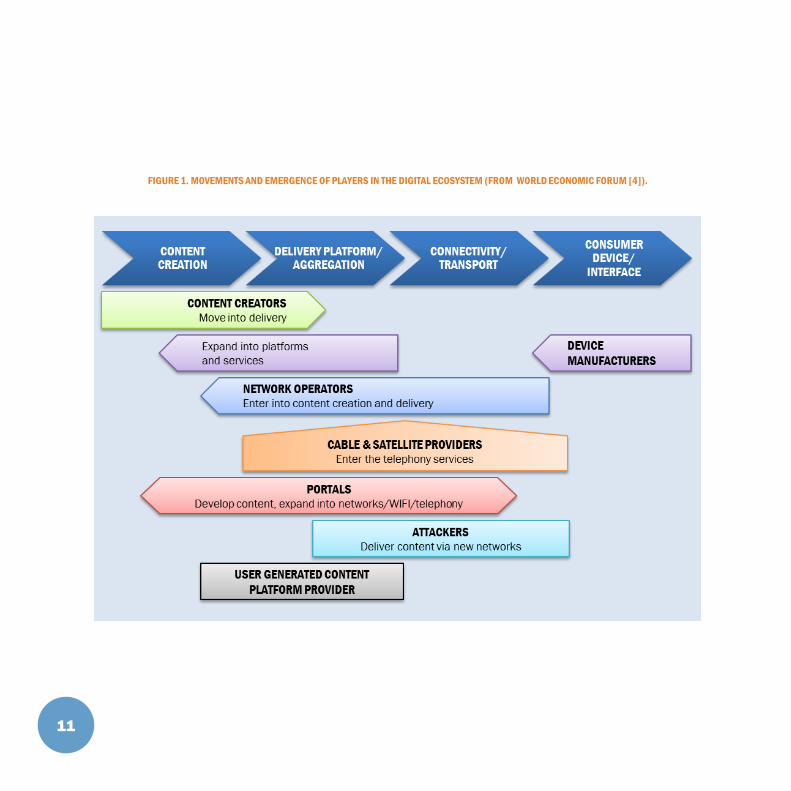
previously separate markets (Figure 1).
Policy makers and regulators face the
challenge to keep up with the ongoing
developments and adapt regulation to new
technologies, services and commercial
models. This is not an easy task, as
regulation is, for historical and institutional
reasons, still largely aimed at the three
separate sectors. Moreover, media and
telecoms, with their longer history, are
generally subject to more sector-specific
regulation than the internet.
Policy makers at the European and national
level are seeking input from stakeholders in
the media-internet-telecom value web on the
way to proceed [1,2,3]. The consultations
and the many reactions they have generated
show the complexity that policy makers face.
In their considerations on the formulation of
policies and, where needed, regulations, they
need to take into account many new varieties
of services and applications, provided by
many organisations that typically use their
assets to perform multiple activities in
different roles and markets. Examples of
assets are content rights, an internet access
network, a large customer base and an
operating system on a mobile device.
10
2.1 CONVERGENCE BETWEEN MEDIA, INTERNET AND
TELECOM
11
FIGURE 1. MOVEMENTS AND EMERGENCE OF PLAYERS IN THE DIGITAL ECOSYSTEM (FROM WORLD ECONOMIC FORUM [4]).
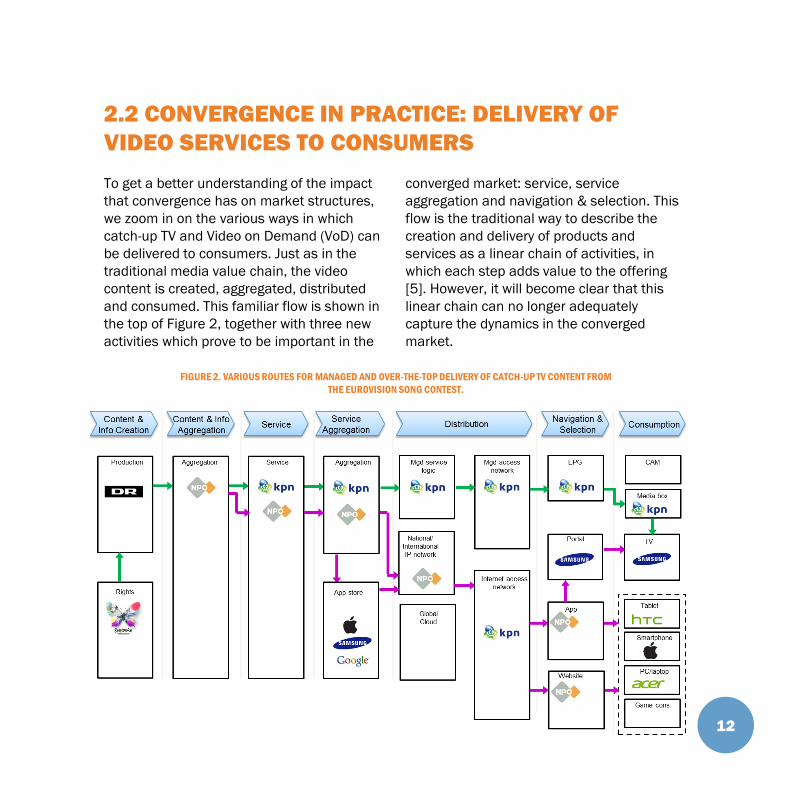
To get a better understanding of the impact
that convergence has on market structures,
we zoom in on the various ways in which
catch-up TV and Video on Demand (VoD) can
be delivered to consumers. Just as in the
traditional media value chain, the video
content is created, aggregated, distributed
and consumed. This familiar flow is shown in
the top of Figure 2, together with three new
activities which prove to be important in the
converged market: service, service
aggregation and navigation & selection. This
flow is the traditional way to describe the
creation and delivery of products and
services as a linear chain of activities, in
which each step adds value to the offering
[5]. However, it will become clear that this
linear chain can no longer adequately
capture the dynamics in the converged
market.
12
2.2 CONVERGENCE IN PRACTICE: DELIVERY OF
VIDEO SERVICES TO CONSUMERS
FIGURE 2. VARIOUS ROUTES FOR MANAGED AND OVER-THE-TOP DELIVERY OF CATCH-UP TV CONTENT FROM
THE EUROVISION SONG CONTEST.
First, we look at the different ways in which
consumers can watch catch-up TV. We use
the example of Dutch viewers of the
Eurovision Song Contest. In the content &
info creation zone on the left, the figure
shows a single green route for the Eurovision
content starting from the European
Broadcasting Union (EBU), that owns the
rights to the Eurovision song contest format.
The 2014 edition has been produced by
Danish public broadcaster DR. In the
Netherlands, the song contest was
broadcasted live by the public broadcaster
NPO. In order to do so, NPO has aggregated
the song contest together with other TV
programs on one of its linear TV channels
(content & info aggregation). After the live
broadcast has occurred, there are two main
routes for the distribution of the videos from
the contest: the green and the purple route.
THE MANAGED ROUTE
The first route, in green, is what we call the
managed route. Here, a TV service provider,
such as KPN in the Netherlands, offers a
catch-up service as a part of its digital TV
package. The consumer buys access to the
catch-up service through a TV subscription,
which is often part of a triple-play offer that
combines TV, internet access and telephony
(service aggregation). KPN distributes the
catch-up TV using its own TV platform and
managed network. In this context, ‘managed’
means that there is a guaranteed reservation
of network capacity for the distribution of the
catch-up TV service. The consumer can
navigate & select the catch-up TV videos from
the Electronic Program Guide (EPG) running
on a media box (often called a Set-Top Box)
supplied by KPN. In this example, the media
box is connected to a smart TV from
Samsung that a consumer uses to watch the
video (consumption).
THE OVER-THE-TOP ROUTE
The second route is an over-the-top (OTT)
route, shown in purple. In this route, users go
to the NPO website to access the catch-up
service. Thus, the end-user service is offered
by the broadcaster, NPO, rather than by the
TV service provider, KPN. NPO also offers this
service via apps for a variety of smartphones,
tablets and smart TVs. Consumers typically
download the app they need from the app
store associated with their device’s operating
system. In this context, app store providers,
such as Apple and Google, are also service
aggregators in the sense that they offer many
different services in a uniform way in their
stores. For the purposes of this example, we
assume that NPO plays out its own catch-up
videos and also has an IP network
infrastructure to deliver the videos to the so-
called eyeball Internet Service Providers
(ISPs). We also assume that the consumer
has a triple-play package from KPN, so that
13
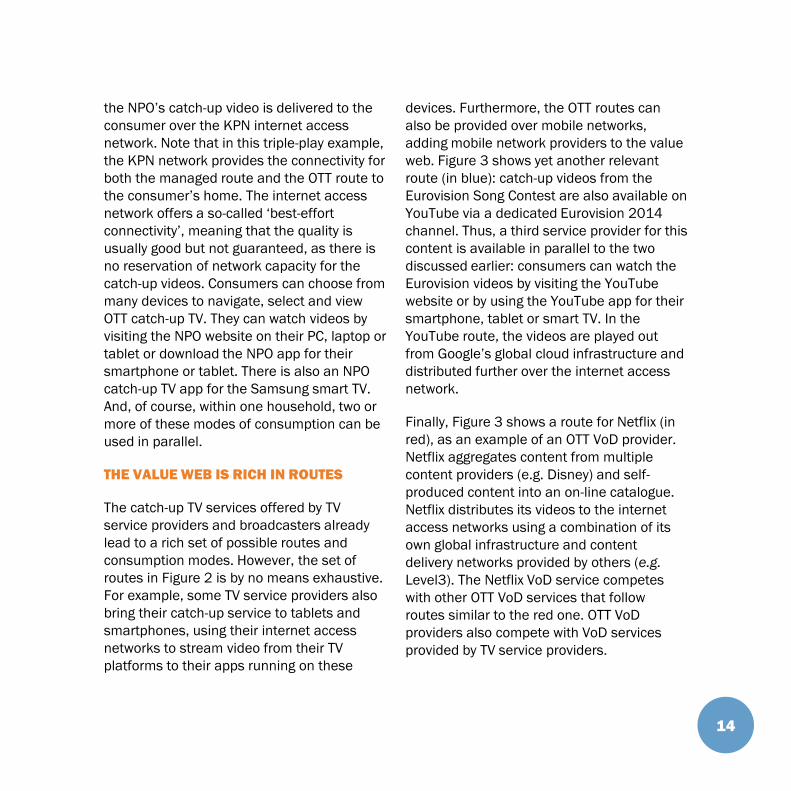
the NPO’s catch-up video is delivered to the
consumer over the KPN internet access
network. Note that in this triple-play example,
the KPN network provides the connectivity for
both the managed route and the OTT route to
the consumer’s home. The internet access
network offers a so-called ‘best-effort
connectivity’, meaning that the quality is
usually good but not guaranteed, as there is
no reservation of network capacity for the
catch-up videos. Consumers can choose from
many devices to navigate, select and view
OTT catch-up TV. They can watch videos by
visiting the NPO website on their PC, laptop or
tablet or download the NPO app for their
smartphone or tablet. There is also an NPO
catch-up TV app for the Samsung smart TV.
And, of course, within one household, two or
more of these modes of consumption can be
used in parallel.
THE VALUE WEB IS RICH IN ROUTES
The catch-up TV services offered by TV
service providers and broadcasters already
lead to a rich set of possible routes and
consumption modes. However, the set of
routes in Figure 2 is by no means exhaustive.
For example, some TV service providers also
bring their catch-up service to tablets and
smartphones, using their internet access
networks to stream video from their TV
platforms to their apps running on these
devices. Furthermore, the OTT routes can
also be provided over mobile networks,
adding mobile network providers to the value
web. Figure 3 shows yet another relevant
route (in blue): catch-up videos from the
Eurovision Song Contest are also available on
YouTube via a dedicated Eurovision 2014
channel. Thus, a third service provider for this
content is available in parallel to the two
discussed earlier: consumers can watch the
Eurovision videos by visiting the YouTube
website or by using the YouTube app for their
smartphone, tablet or smart TV. In the
YouTube route, the videos are played out
from Google’s global cloud infrastructure and
distributed further over the internet access
network.
Finally, Figure 3 shows a route for Netflix (in
red), as an example of an OTT VoD provider.
Netflix aggregates content from multiple
content providers (e.g. Disney) and self-
produced content into an on-line catalogue.
Netflix distributes its videos to the internet
access networks using a combination of its
own global infrastructure and content
delivery networks provided by others (e.g.
Level3). The Netflix VoD service competes
with other OTT VoD services that follow
routes similar to the red one. OTT VoD
providers also compete with VoD services
provided by TV service providers.
14
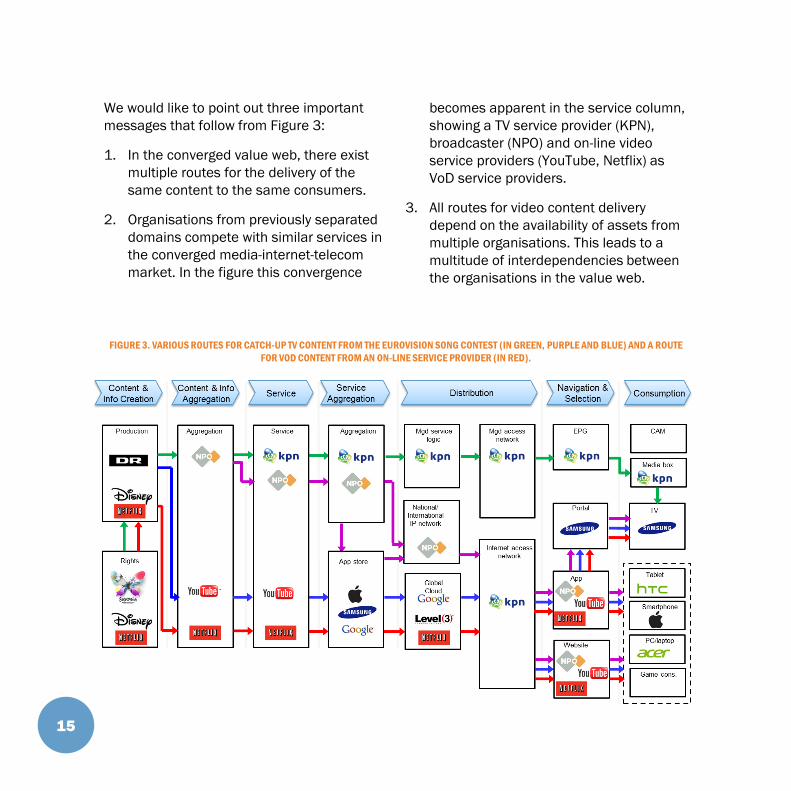
We would like to point out three important
messages that follow from Figure 3:
1. In the converged value web, there exist
multiple routes for the delivery of the
same content to the same consumers.
2. Organisations from previously separated
domains compete with similar services in
the converged media-internet-telecom
market. In the figure this convergence
becomes apparent in the service column,
showing a TV service provider (KPN),
broadcaster (NPO) and on-line video
service providers (YouTube, Netflix) as
VoD service providers.
3. All routes for video content delivery
depend on the availability of assets from
multiple organisations. This leads to a
multitude of interdependencies between
the organisations in the value web.
15
FIGURE 3. VARIOUS ROUTES FOR CATCH-UP TV CONTENT FROM THE EUROVISION SONG CONTEST (IN GREEN, PURPLE AND BLUE) AND A ROUTE
FOR VOD CONTENT FROM AN ON-LINE SERVICE PROVIDER (IN RED).
The development of new services,
applications and distribution models is also
subject to various types of regulation. As
explained earlier, the influence of regulation
on the development of the value web is
explicitly included in the DAMIAN method. The
converged value web brings together
regulation from, primarily, the telecoms and
media sectors.
UNDESIRABLE AND UNINTENDED EFFECTS
OF REGULATION
Sector-specific regulations intended to
promote the objectives of media, telecom or
internet policies typically subject specific
services or organisations to specific rules.
This often does not match the dynamics in
the converged value web. For example,
broadcasters who make their content
available through on-line channels have to
comply with rules on the amount of
commercials and protection of minors, while
other providers of on-line video services are
not subject to these rules. Another example,
from communications services, is the access
to the 112 emergency service. Organisations
that provide a traditional fixed or mobile
telephony service have to offer 112 access,
while their competitors that provide an over-
the-top VoIP service do not have this
obligation. The background of such
obligations is clear, but it is also clear that
their sector-specific implementation can have
unintended and undesirable effects. They
can be at odds with the creation of a level
playing field for organisations from different
backgrounds that offer similar services.
Moreover, they can stimulate organisations
to seek ways to avoid regulation by opening
up new routes through the value web.
Figure 4 shows some of the key classes of
regulation that are important in the value
web for video, together with the approximate
area in the value web where they apply.
16
2.3 THE MANY TYPES OF REGULATION IN THE
CONVERGED VALUE WEB
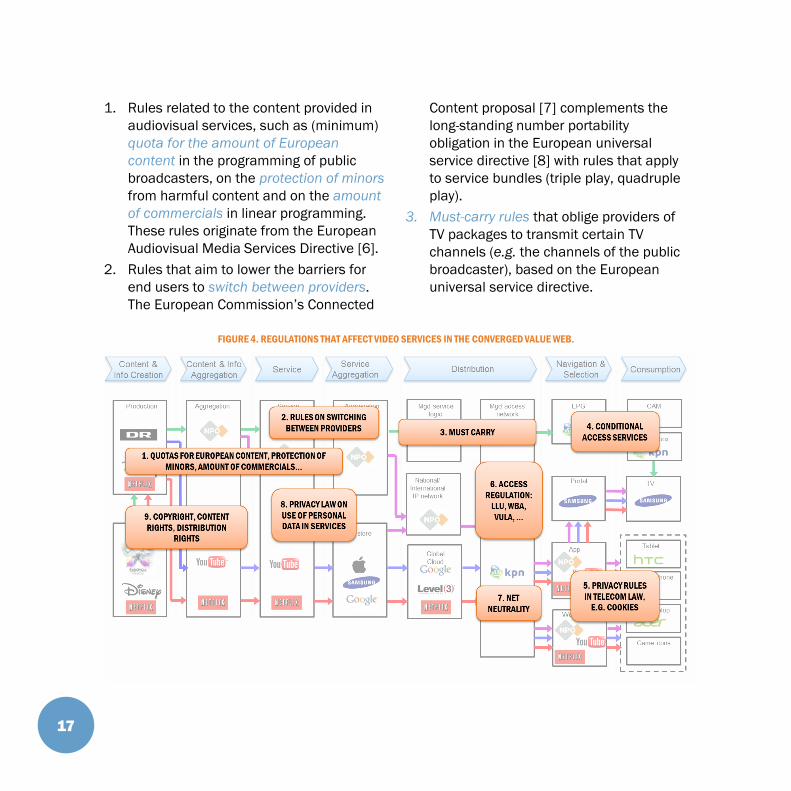
1. Rules related to the content provided in
audiovisual services, such as (minimum)
quota for the amount of European
content in the programming of public
broadcasters, on the protection of minors
from harmful content and on the amount
of commercials in linear programming.
These rules originate from the European
Audiovisual Media Services Directive [6].
2. Rules that aim to lower the barriers for
end users to switch between providers.
The European Commission’s Connected
Content proposal [7] complements the
long-standing number portability
obligation in the European universal
service directive [8] with rules that apply
to service bundles (triple play, quadruple
play).
3. Must-carry rules that oblige providers of
TV packages to transmit certain TV
channels (e.g. the channels of the public
broadcaster), based on the European
universal service directive.
17
FIGURE 4. REGULATIONS THAT AFFECT VIDEO SERVICES IN THE CONVERGED VALUE WEB.
4. Rules on conditional access services.
These older rules from the European
conditional access directive [9] were
developed to promote the development
of pay TV services based on conditional
access through the single market.
5. Rules on transparency and end-user
consent for “cookies”. The cookie rules,
originating from the European e-Privacy
directive [10], determine how service
providers can use cookies and other
technologies to store information about
users on their devices.
6. Local Loop Unbundling (LLU), Wholesale
Broadband Access (WBA) and Virtually
Unbundled Local Access (VULA) are
among the wholesale access remedies
that can be imposed on network
operators with significant market power.
The access regulation is based on the
European Access Directive [11] and the
associated list of relevant markets [12].
7. The current universal service directive
deals with net neutrality through
transparency provisions that aim to give
end users a meaningful insight into the
traffic management methods employed
by network operators in their internet
access services. In the Netherlands, the
transparency has been complemented by
explicit no blocking/throttling rules and
rules that prevent tariff discrimination
based on the OTT applications that end
users choose [13,14]. The European
Commission’s Connected Content
proposal contains similar (but not
identical) rules.
8. The regulatory context for protection of
privacy is provided by the European data
protection directive [15]. This 1995
directive is currently in the process of a
major reform with a view to bring more
control of end users over their personal
data in the vast amount of services and
applications provided in digital
ecosystems, such as the internet-media-
telecom value web.
9. The legal basis for copyrights in the
European Union is provided in the
Copyright Directive [16]. Based on this
directive, content creators, aggregators
and service providers enter into
commercial agreements on the right to
distribute content and make it available
to the public.
18
NEED FOR A NEW METHOD TO
UNDERSTAND THE EFFECTS ON
REGULATION IN CONVERGING MARKETS
Figure 4 illustrates why it is important to take
regulation into account when looking at the
service delivery routes through the value web
and the interdependencies between
organisations. Regulation has an effect on
the way organisations in the converging
markets can leverage their strategic assets,
such as their content, network, or customer
base. By doing so, regulation affects the
balance of power between organisations in
the web. Figure 4 also shows that services
that look very similar to end users can be
subject to different types of regulation,
depending on the route through the value
web and the organisations involved. This
seems to be at odds with the level playing
field that many organisations favour.
The figure also shows that it is not
straightforward to assess the consequences
of the introduction of new regulations or the
removal of existing ones on the overall
balance between organisations in the value
web. The many interdependencies between
organisations can lead to situations in which
a rule that seems to make sense at one
position in the web can have adverse
consequences in other parts.
TNO’s observation is that all organisations try
to build on the strengths of their own assets
but, at the same time, are led to share their
assets with other organisations by business
considerations or regulation. Regulation
affects the ways in which organisations can
use their own assets and can rely on other
organisations’ assets, which implies that
regulation affects the balance in the value
web. This asset-based analysis is at the core
of the DAMIANTM method. DAMIAN is short for
Digital Asset Modelling of Interdependencies
in Actor Networks. The value web figures with
service delivery flows, such as Figure 3, are
important intermediate results in DAMIAN
that are needed to determine the relevant
assets, interdependencies and regulation.
19
3. INTRODUCING THE DAMIAN
METHOD
20
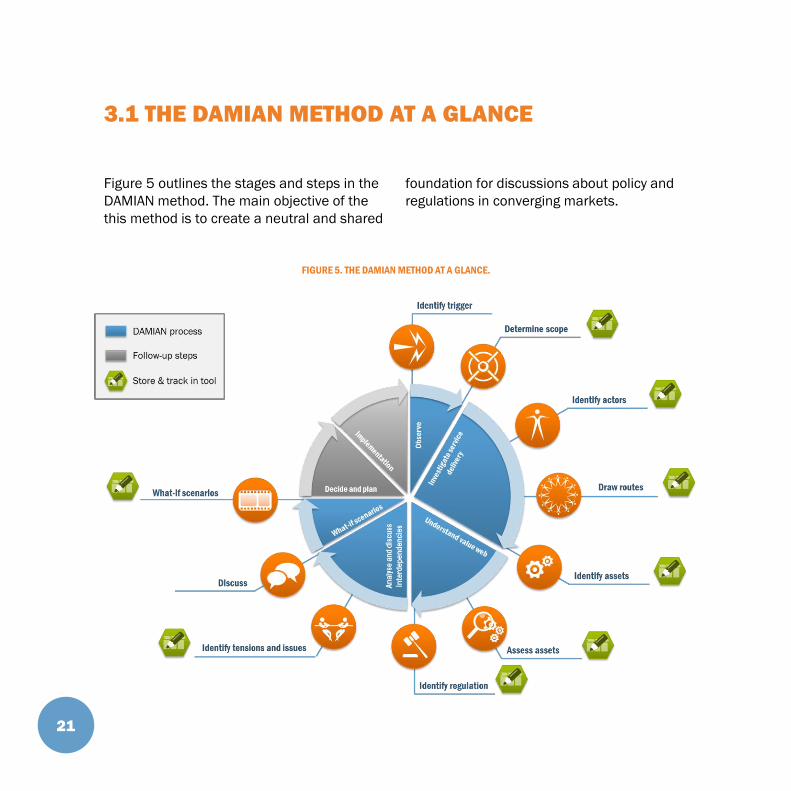
Figure 5 outlines the stages and steps in the
DAMIAN method. The main objective of the
this method is to create a neutral and shared
foundation for discussions about policy and
regulations in converging markets.
21
3.1 THE DAMIAN METHOD AT A GLANCE
FIGURE 5. THE DAMIAN METHOD AT A GLANCE.
This neutral and shared foundation is based
on a systematic analysis and description of
the service delivery flows in the value web,
consisting of 1) the activities that need to be
performed in order to deliver a specific
service to the intended end-users; 2) the
organisations who carry out these activities;
3) the strategic assets that the organisations
use and exchange to fulfil their activities in
the value web; and 4) the rules and
regulations that affect the positions and
interactions in the web. The outcomes of the
DAMIAN method are recorded in the DAMIAN
tool. Through this method and tool, the many
interdependencies between organisations in
the web can be unravelled, the complexity of
the converging value web can be understood,
and the effect of (new) policies and
regulations can be evaluated.
In the following sections we will illustrate the
use of the DAMIAN method by applying it to
the case of personalised recommendation
services in audiovisual media. The service
delivery flows for audiovisual media
recommendations have been defined,
analysed and discussed during a workshop
with participants from different areas of the
media-internet-telecom web, including
telecom providers, broadcasters, device
manufacturers, consumer interest groups,
software developers, regulators and
ministries.
22
The starting point for the DAMIAN method is
a current case that causes (potential)
tensions in the media-internet-telecom
market. Such tensions can have different
causes:
• The emergence of new service delivery
flows as suppliers expand their activities in
the value web (e.g. cable providers
experience competition for their television
services from the live and VoD services of
media organisations).
• New entrants that offer similar services as
incumbent organisations in the web, but
under different commercial and regulatory
conditions (e.g. over-the-top provider
Netflix competes with the television
services of cable providers and
broadcasters, but may not be regulated by
the same rules that apply to traditional
media organisations).
• The growing importance of certain
strategic assets, which influences the
balance of power in the value web (e.g. as
personal content recommendations
become more important, databases with
user profiles on viewing behaviour become
more important assets).
TRIGGER: PERSONALISED RECOMMEN-
DATIONS IN AUDIOVISUAL MEDIA
The availability of fast broadband internet
access and the arrival of new devices such as
tablets and smart TVs have led to many new
services and distribution models for TV and
video. As illustrated by Figure 3, traditional
and new service providers compete for the
attention of viewers, often referred to as
eyeballs. The eyeballs are important as they
provide the basis for the business models of
the providers, typically based on advertising
or subscriptions. One of the approaches that
providers use to guide viewers towards their
content is to provide them with content
recommendations, see Figure 6.
23
3.2 OBSERVING POTENTIAL ISSUES IN THE MEDIA-
INTERNET-TELECOM VALUE WEB

24
FIGURE 6. EXAMPLES OF CONTENT RECOMMENDATIONS PROVIDED BY NETFLIX, NPO, KPN AND YOUTUBE.
In basic recommendation schemes, providers
recommend content items based on their
overall popularity among their customers.
Increasingly, providers are developing more
advanced systems for personalised
recommendations geared towards the taste
of individual customers. Their goal may be to
more effectively attract viewers to their
content and to prevent them from searching
for content in other services. For such
personalised recommendations, providers
rely on information on their customers’
viewing behaviour that they collect as they
navigate and watch content. Depending on
the route of the services through the value
web, usage data are generated in the domain
of certain services providers. These service
providers are in the best position to make
personalised recommendations (e.g., NPO
providing recommendations on its catch-up
offering, Netflix offering recommendations on
content in the Netflix catalogue).
There are now also organisations that provide
recommendations across several audiovisual
services. Samsung, for example, provides a
recommendation service on its recent Smart
TV models that covers the content offered in
services from multiple providers, such as
broadcast TV, VoD, apps and social media
[17]. New recommendation service providers
may depend on user data from other
providers to make their own personalised
recommendations. The increasing value of
usage data can thus introduce new technical
and commercial interdependencies between
organisations in the value web.
Apart from the interdependencies that they
introduce, personalised recommendations
also affect two other areas that are relevant
for providers and policy makers:
• The processing and storage of usage data
needed for personalised
recommendations is strongly related to
the privacy of the viewers. The protection
of personal data in recommendation
services is already on the agenda of
regulators and policy makers.
• There are concerns among policy makers
that certain content will be more difficult
to find for viewers. In the converged value
web, viewers have a very rich choice in
content. At the same time, an additional
effort on behalf of the viewer may be
required to access content that has a less
prominent position in recommendations
provided by providers. The concern is that
providers will use recommendations
primarily to promote content in which they
have a commercial interest, thus reducing
the visibility of other content.
25
SCOPE: AUDIOVISUAL RECOMMENDATION
SERVICES
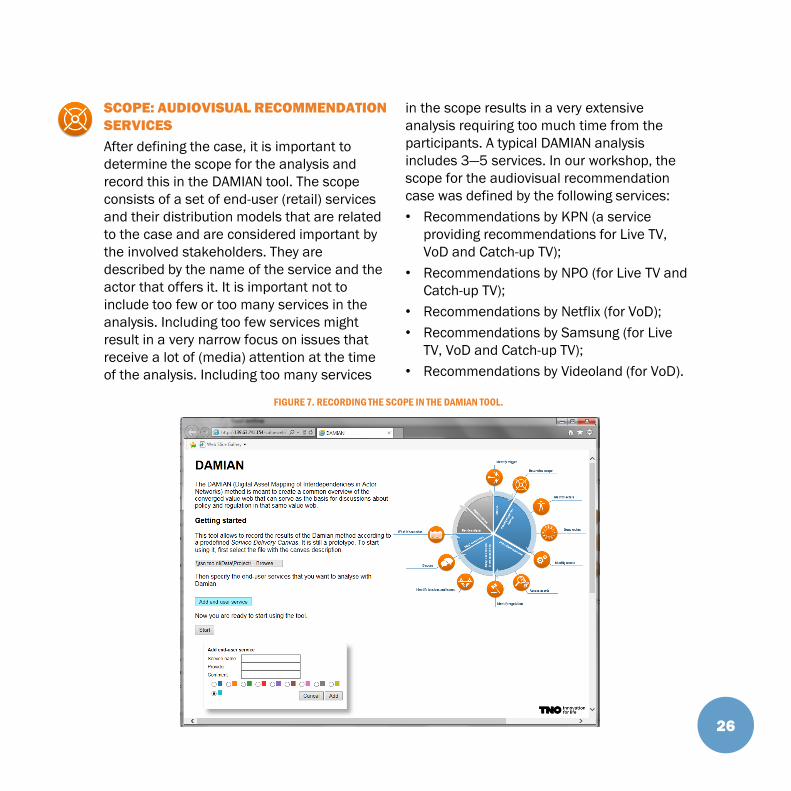
After defining the case, it is important to
determine the scope for the analysis and
record this in the DAMIAN tool. The scope
consists of a set of end-user (retail) services
and their distribution models that are related
to the case and are considered important by
the involved stakeholders. They are
described by the name of the service and the
actor that offers it. It is important not to
include too few or too many services in the
analysis. Including too few services might
result in a very narrow focus on issues that
receive a lot of (media) attention at the time
of the analysis. Including too many services
in the scope results in a very extensive
analysis requiring too much time from the
participants. A typical DAMIAN analysis
includes 3—5 services. In our workshop, the
scope for the audiovisual recommendation
case was defined by the following services:
• Recommendations by KPN (a service
providing recommendations for Live TV,
VoD and Catch-up TV);
• Recommendations by NPO (for Live TV and
Catch-up TV);
• Recommendations by Netflix (for VoD);
• Recommendations by Samsung (for Live
TV, VoD and Catch-up TV);
• Recommendations by Videoland (for VoD).
26
FIGURE 7. RECORDING THE SCOPE IN THE DAMIAN TOOL.
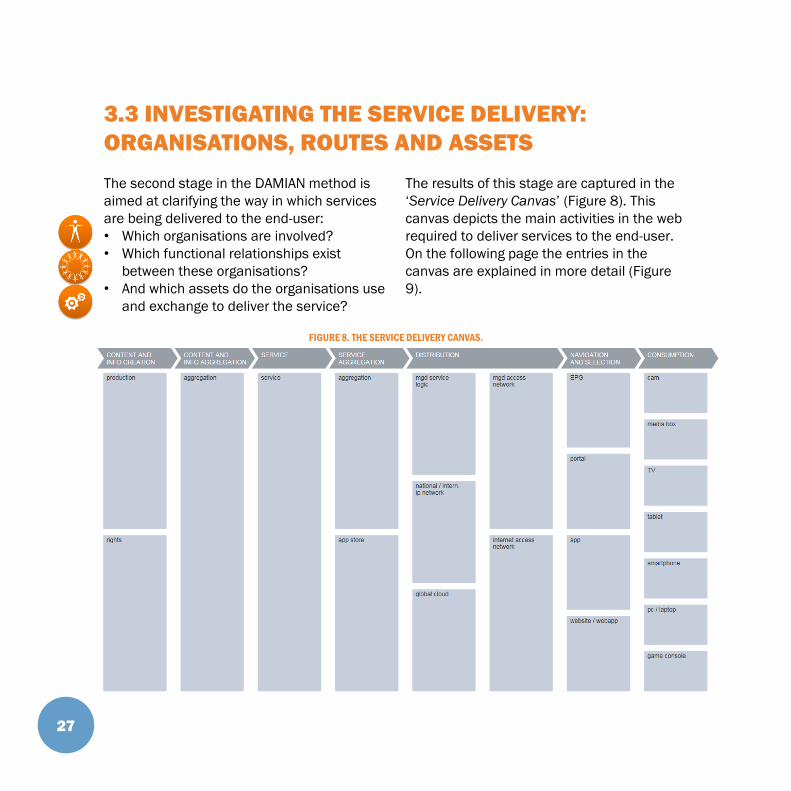
The second stage in the DAMIAN method is
aimed at clarifying the way in which services
are being delivered to the end-user:
• Which organisations are involved?
• Which functional relationships exist
between these organisations?
• And which assets do the organisations use
and exchange to deliver the service?
The results of this stage are captured in the
‘Service Delivery Canvas’ (Figure 8). This
canvas depicts the main activities in the web
required to deliver services to the end-user.
On the following page the entries in the
canvas are explained in more detail (Figure
9).
27
3.3 INVESTIGATING THE SERVICE DELIVERY:
ORGANISATIONS, ROUTES AND ASSETS
FIGURE 8. THE SERVICE DELIVERY CANVAS.

28
CONTENT AND INFO
CREATION
In most cases
audiovisual content is
produced based on
existing (format) rights.
During production,
new rights are often
created, such as
distribution rights.
Communication
services, unlike media
services, are not based
on content that is
produced in advance.
The service delivery for
these services starts in
the service column.
CONTENT AND INFO
AGGREGATION
Content is aggregated
in, for example, TV
channels and on-line
video catalogues.
SERVICE
In this column, the
actor that offers the
service to the end-
consumer should be
recorded.
SERVICE AGGREGATION
Just like content,
services can be
aggregated (bundled),
for example in triple
play offers or in app
stores.
DISTRIBUTION
Distribution of a service usually involves core infrastructure and access
infrastructure.
• The core infrastructure consists of national and international IP
networks, cloud infrastructure and content delivery networks.
• In managed access networks, there is a guaranteed reservation of
capacity for each service. Internet access networks offer so-called best-
effort connectivity, meaning that the quality is usually good but not
guaranteed.
NAVIGATION AND SELECTION
To search and choose between and within
services, the end-user can use various
software environments, which can be linked to
specific devices: Electronic Program Guides
(EPG) on Set-Top Boxes (STBs); Portals on
Smart TVs and several media boxes such as
the Apple TV; Apps on smart phones, tablets
and smart TVs; and Websites.
CONSUMPTION
The end user can
receive and view
content through a
Set-Top Box or
Conditional Access
Module (CAM) or
on a variety of
other consumer
devices (TV, tablet,
smart phone,
laptop, PC, game
console).
FIGURE 9. THE SERVICE DELIVERY CANVAS EXPLAINED.
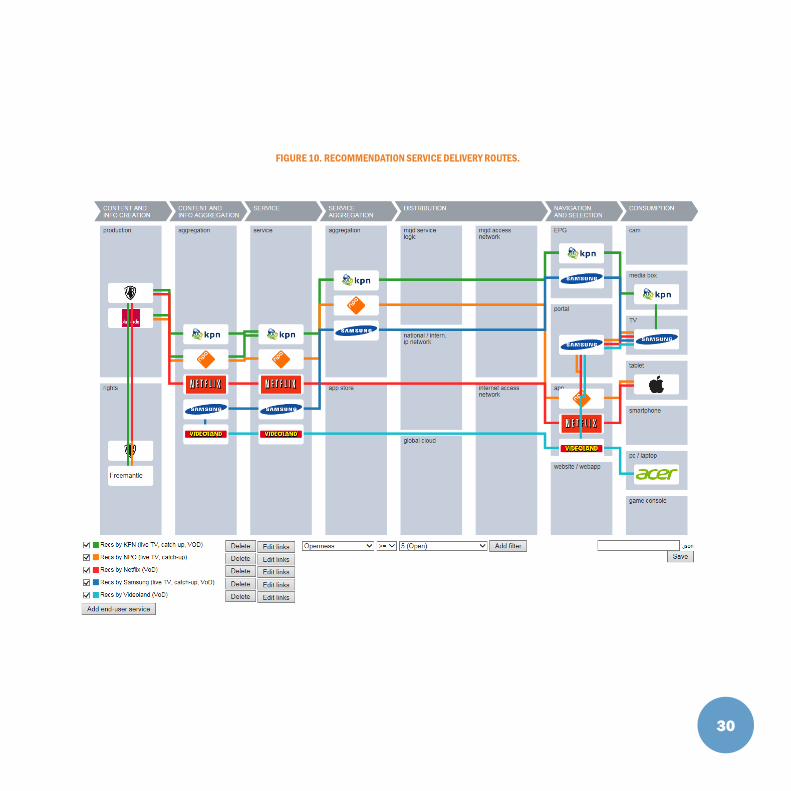
To create an overview of the service delivery
routes, first the organisations and
relationships between them are recorded in
the canvas. Then, the method zooms in at
the capabilities of the individual
organisations in the value web by analysing
which tangible and intangible strategic assets
(e.g. distribution networks, content, brand,
customers, etcetera) they control and
leverage to capture value in the service
delivery route. An organisation gains
influence in the value web when its assets
are scarce and in high demand by other
organisations in the web. Conversely,
organisations that are mainly using other
organisations’ assets to deliver their service
to the end-user have a more dependent
position.
The results for the selected audiovisual
recommendation services can be found in
Figure 10. The coloured lines show the
service delivery for each of the services.
The workshop participants judged the
following assets to be the most important
ones for the dynamics in the value web,
starting from the left column in the figure to
the right:
• the content itself;
• metadata about the content;
• data about the viewer;
• the recommendation algorithm;
• cross service recommendations;
• the user interface through which the
content is accessed and which determines
the order in which content is presented to
the viewer;
• data about the viewer’s behaviour.
These assets have also been recorded in the
tool and become visible when a relevant
organisation or service is selected (not shown
in the figure).
29
30
FIGURE 10. RECOMMENDATION SERVICE DELIVERY ROUTES.
To create an understanding of the dynamics
in the value web, the DAMIAN method
systematically analyses the
interdependencies between organisations in
the web through their strategic assets and
the rules and regulations that apply to these
assets. Assets determine where and how
organisations can capture value and
generate revenues from the web and can
exert influence. In other words, assets can
provide organisations with control points:
parts of the value web in which they can
project (economic) power [18,19,20]. The
influence that an actor can leverage through
the asset can be defined based on both the
competitive advantage of the asset [21,22]
and how much it would cost other
organisations to obtain the same type of
asset [23,24]. Regulation affects the ways in
which organisations can control their own
assets to exert influence and can rely on
other organisations’ assets.
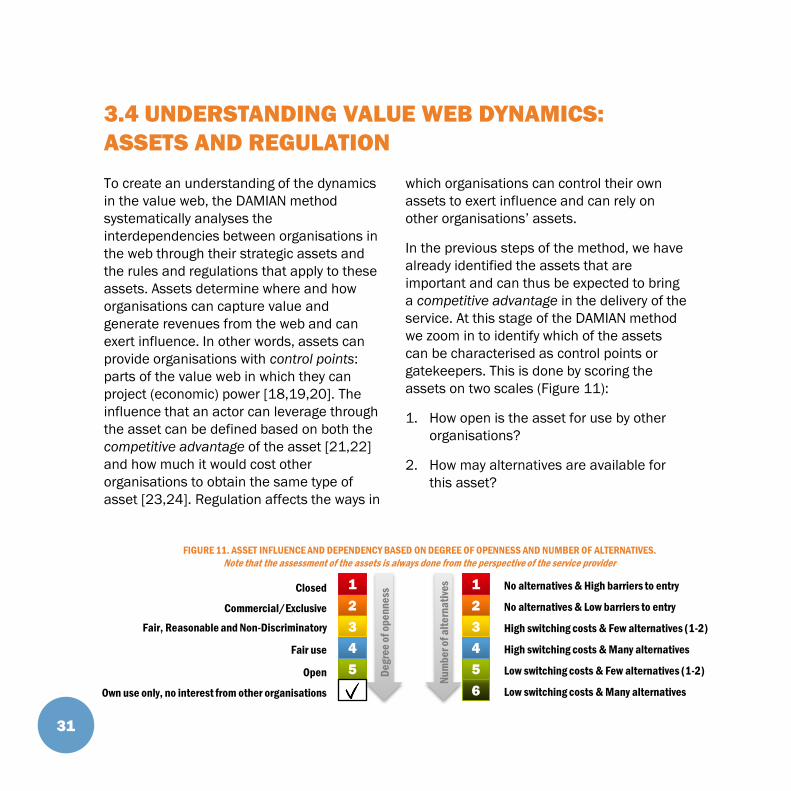
In the previous steps of the method, we have
already identified the assets that are
important and can thus be expected to bring
a competitive advantage in the delivery of the
service. At this stage of the DAMIAN method
we zoom in to identify which of the assets
can be characterised as control points or
gatekeepers. This is done by scoring the
assets on two scales (Figure 11):
1. How open is the asset for use by other
organisations?
2. How may alternatives are available for
this asset?
31
3.4 UNDERSTANDING VALUE WEB DYNAMICS:
ASSETS AND REGULATION
6
5
4
3
2
Low switching costs & Few alternatives (1-2)
High switching costs & Many alternatives
No alternatives & Low barriers to entry
High switching costs & Few alternatives (1-2)
No alternatives & High barriers to entry 1
Low switching costs & Many alternatives
Nu
mb
er
of
alt
ern
ati
ves
5
4
3
2
1
Open
Fair use
Commercial/Exclusive
Fair, Reasonable and Non-Discriminatory
Closed
De
gre
e o
f o
pe
nn
ess
Own use only, no interest from other organisations
FIGURE 11. ASSET INFLUENCE AND DEPENDENCY BASED ON DEGREE OF OPENNESS AND NUMBER OF ALTERNATIVES.
Note that the assessment of the assets is always done from the perspective of the service provider
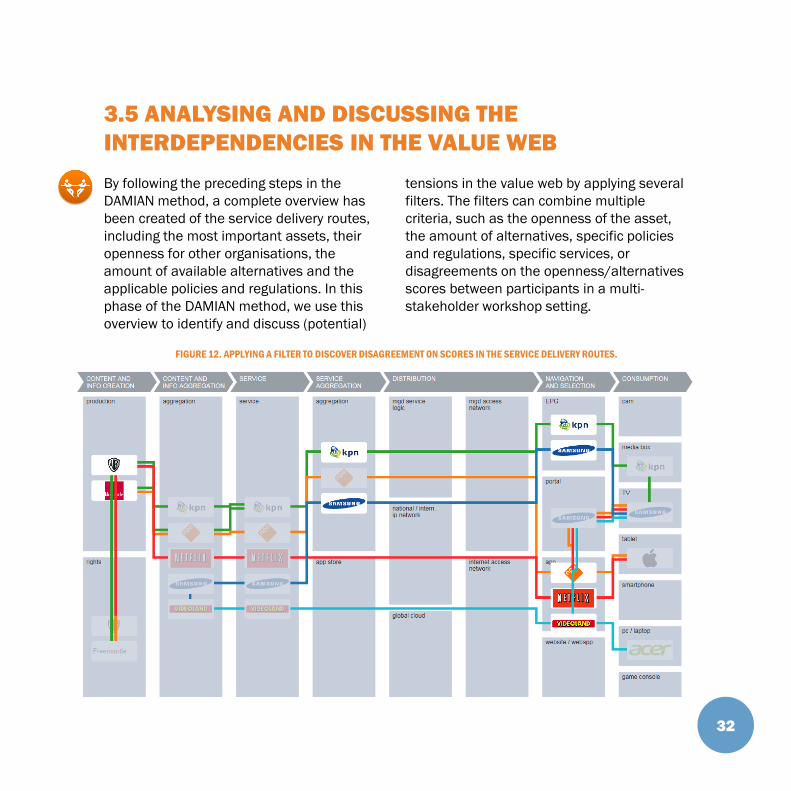
By following the preceding steps in the
DAMIAN method, a complete overview has
been created of the service delivery routes,
including the most important assets, their
openness for other organisations, the
amount of available alternatives and the
applicable policies and regulations. In this
phase of the DAMIAN method, we use this
overview to identify and discuss (potential)
tensions in the value web by applying several
filters. The filters can combine multiple
criteria, such as the openness of the asset,
the amount of alternatives, specific policies
and regulations, specific services, or
disagreements on the openness/alternatives
scores between participants in a multi-
stakeholder workshop setting.
32
3.5 ANALYSING AND DISCUSSING THE
INTERDEPENDENCIES IN THE VALUE WEB
FIGURE 12. APPLYING A FILTER TO DISCOVER DISAGREEMENT ON SCORES IN THE SERVICE DELIVERY ROUTES.

THE DISCUSSION OF
INTERDEPENDENCIES
Again, we look at the case of audiovisual
recommendation services. The assets in the
service delivery flows have been scored
during our workshop through a real-time,
anonymous voting system. Figure 12
highlights some of the disagreements that
occurred during the workshop, by displaying
the logos of the organisations whose assets
did not receive a unanimous score on the
number of available alternatives. We will
discuss some of the workshop insights in
more detail below.
Overall we can conclude there is more
consensus on the openness of assets than
on the availability of alternatives for them. As
an example, when we asked the participants
to assess the metadata owned by content
producers, they scored the openness almost
unanimously as commercial/exclusive (Figure
13). However, there was disagreement on the
amount of alternatives (Figure 14). In this
case the discussion that followed helped to
clarify the various scores: Some of the
participants knew of the existence of
intermediaries for metadata in the
marketplace. These intermediaries can offer
an alternative for metadata of content
producers, depending on the specific content.
33
1= Closed
2= Commercial/Exclusive
3= FRAND
4= Fair use
5= Open
6= Own use only
FIGURE 13. PARTICIPANT SCORES OF OPENNESS OF METADATA FROM
THE PERSPECTIVE OF THE RECOMMENDATION SERVICE PROVIDER.
1= No alternatives & high barriers
2= No alternatives & low barriers
3= High switching costs & few alternatives
4= High switching costs & many alternatives
5= Low switching costs & few alternatives
6= Low switching costs & many alternatives
FIGURE 14. PARTICIPANT SCORES OF ALTERNATIVES FOR METADATA FROM
THE PERSPECTIVE OF THE RECOMMENDATION SERVICE PROVIDER.
The same type of disagreement was found
when scoring the openness and alternatives
for the user interface that guides the viewer
to the content. Again, the participants agreed
that the openness was commercial/
exclusive, but there were different views on
the amount of alternatives based on the
question whether or not viewers are likely to
switch portals and/or software environments
to reach content.
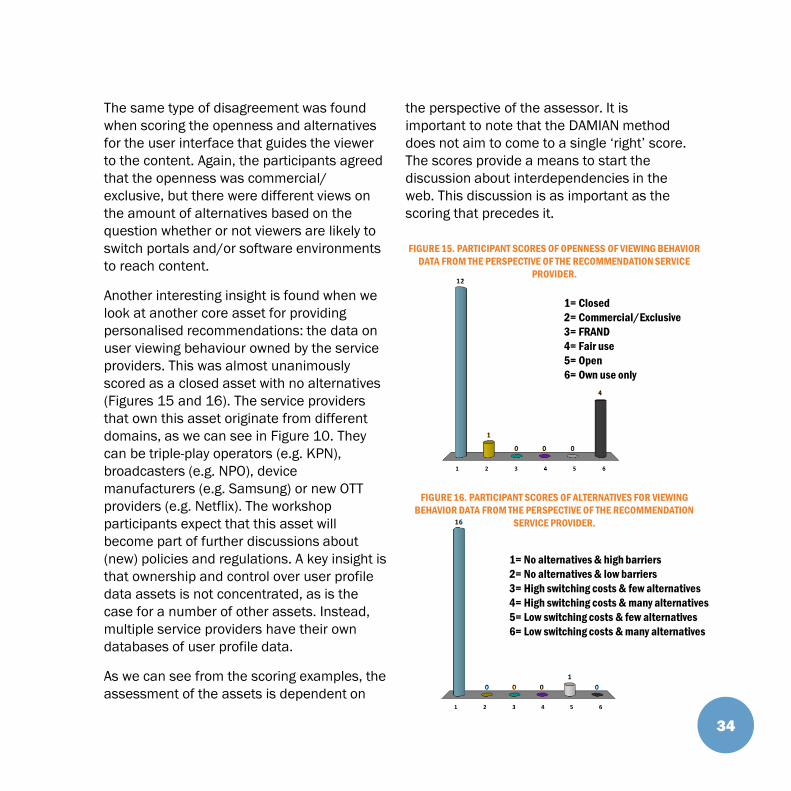
Another interesting insight is found when we
look at another core asset for providing
personalised recommendations: the data on
user viewing behaviour owned by the service
providers. This was almost unanimously
scored as a closed asset with no alternatives
(Figures 15 and 16). The service providers
that own this asset originate from different
domains, as we can see in Figure 10. They
can be triple-play operators (e.g. KPN),
broadcasters (e.g. NPO), device
manufacturers (e.g. Samsung) or new OTT
providers (e.g. Netflix). The workshop
participants expect that this asset will
become part of further discussions about
(new) policies and regulations. A key insight is
that ownership and control over user profile
data assets is not concentrated, as is the
case for a number of other assets. Instead,
multiple service providers have their own
databases of user profile data.
As we can see from the scoring examples, the
assessment of the assets is dependent on
the perspective of the assessor. It is
important to note that the DAMIAN method
does not aim to come to a single ‘right’ score.
The scores provide a means to start the
discussion about interdependencies in the
web. This discussion is as important as the
scoring that precedes it.
34
1= Closed
2= Commercial/Exclusive
3= FRAND
4= Fair use
5= Open
6= Own use only
FIGURE 15. PARTICIPANT SCORES OF OPENNESS OF VIEWING BEHAVIOR
DATA FROM THE PERSPECTIVE OF THE RECOMMENDATION SERVICE
PROVIDER.
1= No alternatives & high barriers
2= No alternatives & low barriers
3= High switching costs & few alternatives
4= High switching costs & many alternatives
5= Low switching costs & few alternatives
6= Low switching costs & many alternatives
FIGURE 16. PARTICIPANT SCORES OF ALTERNATIVES FOR VIEWING
BEHAVIOR DATA FROM THE PERSPECTIVE OF THE RECOMMENDATION
SERVICE PROVIDER.
The what-if scenarios in DAMIAN represent an
optional step that provides a link between the
joint effort to develop a shared view of the
value web and the decision making within
individual organisations and regulators. A
joint discussion of what-if scenarios provides
a way to ‘test the water’ with initial thoughts
on ways forward, against the shared
background in the value web. In the end, the
follow-up actions are decided by individual
organisations and regulators. This step is
intentionally not covered by the DAMIAN
process. Of course, in their decision making,
all stakeholders benefit from the insights
they have obtained in the value web from
DAMIAN.
During our workshop on content
recommendations, we did not include the
what-if scenario step. Based on the
contributions of the participants, candidate
scenarios could have been:
• What if a content provider thinks his
content is not presented prominently
enough in other organisations’
recommendations and portals?
• What if a service provider wants to use
other organisations’ profiles on users’
viewing behaviour?
• What if rules on EPG prominence would be
extended to other types of guides and
recommendations, as currently under
discussion in the UK?
35
3.6 “WHAT IF…”–SCENARIOS AND FOLLOW-UP
4. CONCLUSION
36

One of the key outcomes of convergence is
that the traditional value chain has evolved
into a value web, with multiple, parallel
routes between service creation and
consumption. However, it is crucial to
recognize that the mere existence of many
parallel routes has not removed the
interdependencies between organisations
and has even created new ones. Therefore, a
systematic analysis of the interdependencies
between organisations in the value web is
called for.
In TNO’s view, such an analysis should start
from the so-called strategic assets that
organisations have, such as content, a
network, a large customer base or a strong
brand. This asset-based approach is at the
core of the DAMIAN method. DAMIAN has
been successfully applied in workshops with
many stakeholders, including operators,
content providers, ministries, regulators,
device makers and consumer interest
groups, In the workshops, DAMIAN has been
used to analyse interactive television
services, video distribution in general,
content recommendations for video services
and neutrality deeper in the value web.
The feedback of the workshop participants
bring out three important benefits of DAMIAN.
1. The structured process and the
visualisation in the service delivery
canvas provide a common shared
background and knowledge base for the
participants. This helps to keep people
‘on the same page’, resulting in a more
productive and efficient discussion.
2. The initial scoping step in terms of end
user (retail) services ensures that all
relevant elements are taken on board in
the discussion, thus avoiding the risk of a
short-sighted focus on specific points
receiving media attention.
3. The scoring of openness and alternatives
for assets shows that workshop
participants have different opinions.
However, the discussion on the score
helps to determine whether the
differences are caused by fundamentally
different views or merely by different
interpretations of the same situation.
Based on their experience with the DAMIAN
method and tool, a majority of the workshop
participants expect that they will apply the
method themselves or be involved in DAMIAN
analyses of other cases. They have also
provided a range of suggestions to extend the
method and tool, for example with
quantitative information on revenue streams
and number of customers, more extensive
filtering options and a multi-user on-line
version of the tool for use in consultations. 37
CONCLUSION

BIBLIOGRAPHY
38

[1] European Commission Green Paper “Preparing for a
Fully Converged Audiovisual World: Growth, Creation
and Values”, Brussels, COM(2013) 231 final, 24 April
2013, https://ec.europa.eu/digital-
agenda/sites/digital-
agenda/files/convergence_green_paper_en_0.pdf
[2] Vision on telecommunications, media and internet:
the next steps, Ministry of Economic Affairs, December
23, 2013, http://www.government.nl/documents-and-
publications/reports/2014/02/07/vision-on-
telecommunications-media-and-internet-the-next-
steps.html
[3] Medium-term vision for telecommunications, media
and internet, Ministry of Economic Affairs, December
23, 2013, http://www.government.nl/documents-and-
publications/parliamentary-
documents/2013/12/23/medium-term-vision-for-
telecommunications-media-and-internet.html
[4] World Economic Forum: Digital Ecosystem -
Convergence between IT, Telecoms, Media and
Entertainment: Scenarios to 2015. World Scenario
Series, 2007, http://www3.weforum.org/docs/WEF_
DigitalEcosystem_Scenario2015_Executive
Summary_2010.pdf
[5] Porter, M. (1985). Competitive advantage. New York:
Free Press.
[6] Directive 2010/13/EU of the European Parliament
and of the Council (“Audiovisual Media Services
Directive”), 10 March 2010, http://eur-
lex.europa.eu/legal-
content/EN/TXT/PDF/?uri=CELEX:32010L0013
[7] Proposal for a Regulation of the European
Parliament and of the Council (“Connected Continent”),
Brussels, 11 September 2013, COM(2013) 627 final
[8] Directive 2002/22/EC of the European Parliament
and of the Council (“Universal Service Directive”), 7
March 2002, http://eur-lex.europa.eu/legal-
content/EN/TXT/PDF/?uri=CELEX:32002L0022,
amended by Directive 2009/136/EC (“Citizens' Rights
Directive”), 25 November 2009, http://eur-
lex.europa.eu/legal-
content/EN/TXT/PDF/?uri=CELEX:32009L0136
[9] Directive 98/84/EC of the European Parliament and
of the Council (“Conditional Access Directive”), 20
November 1998, http://eur-lex.europa.eu/legal-
content/EN/TXT/PDF/?uri=CELEX:31998L0084
[10] Directive 2002/58/EC of the European Parliament
and of the Council (“ePrivacy Directive”), 12 July 2002,
http://eur-
lex.europa.eu/LexUriServ/LexUriServ.do?uri=CELEX:32
002L0058:en:HTML, amended by Directive
2009/136/EC (“Citizens' Rights Directive”), 25
November 2009, http://eur-lex.europa.eu/legal-
content/EN/TXT/PDF/?uri=CELEX:32009L0136
[11] Directive 2002/19/EC of the European Parliament
and of the Council (“Access Directive”), 7 March 2002,
http://eur-lex.europa.eu/legal-
content/EN/TXT/PDF/?uri=CELEX:32002L0019,
amended by Directive 2009/140/EC (“Better
Regulation Directive”), 25 November 2009, http://eur-
lex.europa.eu/legal-
content/EN/TXT/PDF/?uri=CELEX:32009L0140
[12] Commission recommendation 2007/879/EC, 17
December 2007, http://eur-
lex.europa.eu/LexUriServ.do?uri=OJ:L:2007:344:0065:
0069:en:PDF
[13] Dutch Telecommunication law, article 7.4a
39
[14] Pieter Nooren, Andra Leurdijk, Nico van Eijk,
(2012),"Net neutrality and the value chain for video",
info, Vol. 14 Iss: 6 pp. 45 – 58.
[15] Directive 95/46/EC of the European Parliament
and of the Council (“Data Protection Directive”), 24
October 1995, http://eur-lex.europa.eu/legal-
content/EN/TXT/PDF/?uri=CELEX:31995L0046
[16] Directive 2001/29/EC of the European Parliament
and of the Council (“Copyright Directive”), 22 May
2001, http://eur-lex.europa.eu/legal-
content/EN/TXT/PDF/?uri=CELEX:32001L0029
[17] Samsung Transforms the Home Entertainment
Experience with Intelligent Navigation and Discovery,
http://eur-lex.europa.eu/legal-
content/EN/TXT/PDF/?uri=CELEX:32001L0029
(retrieved July 23, 2014).
[18] Allee, V. (2002). The Future of Knowledge:
Increasing Prosperity through Value Networks,
Butterworth Heinemann, Boston.
[19] Value Chain Dynamics Working Group (2005).
Mobile services in the communication industry, MIT
Communications Future programme.
[20] Eaton, B. D., Elaluf-Calderwood, S. M., & Sørensen,
C. (2010). The role of control points in determining
business models for future mobile generative systems.
In Mobile Business and 2010 Ninth Global Mobility
Roundtable (ICMB-GMR), 2010 Ninth International
Conference on (pp. 459-463).
[21] Wernerfelt, B. (1984). A resource‐based view of
the firm. Strategic management journal, 5(2), 171-180.
[22] Prahalad, C. K., & Hamel, G. (1990). The core
competence of the corporation. Boston (MA).
[23] Coase, R. H. (1937). The nature of the firm.
Economica, 4(16), 386-405.
[24] Williamson, O. E. (1981). The economics of
organization: the transaction cost approach. American
journal of sociology, 548-577.
40
41
All rights reserved. No part of this publication may be reproduced and/or published
by print, photoprint, microfilm or any other means without the previous written
consent of TNO.
In case this report was drafted on instructions, the rights and obligations of
contracting parties are subject to either the General Terms and Conditions for
commissions to TNO, or the relevant agreement concluded between the contracting
parties. Submitting the report for inspection to parties who have a direct interest is
permitted.
© 2014 TNO
FOR MORE INFORMATION ON THE DAMIAN METHOD AND TOOL PLEASE
CONTACT:


![P.O. Box 80015 TNO report TNO 2016 R10352 Heat load ...TNO report | TNO 2016 R10352 7 / 70 The HAZID report [6] has provided an overview of relevant LNG scenarios with safety issues](https://img.pdfslide.us/doc/110x75/5a7260c27f8b9abb538d7607/po-box-80015-tno-report-tno-2016-r10352-heat-load-tno-report-tno-2016-r10352.jpg)