Embed Size (px)
Citation preview

The State of IP Addresses
Geoff HustonAPNIC
IPv6
2
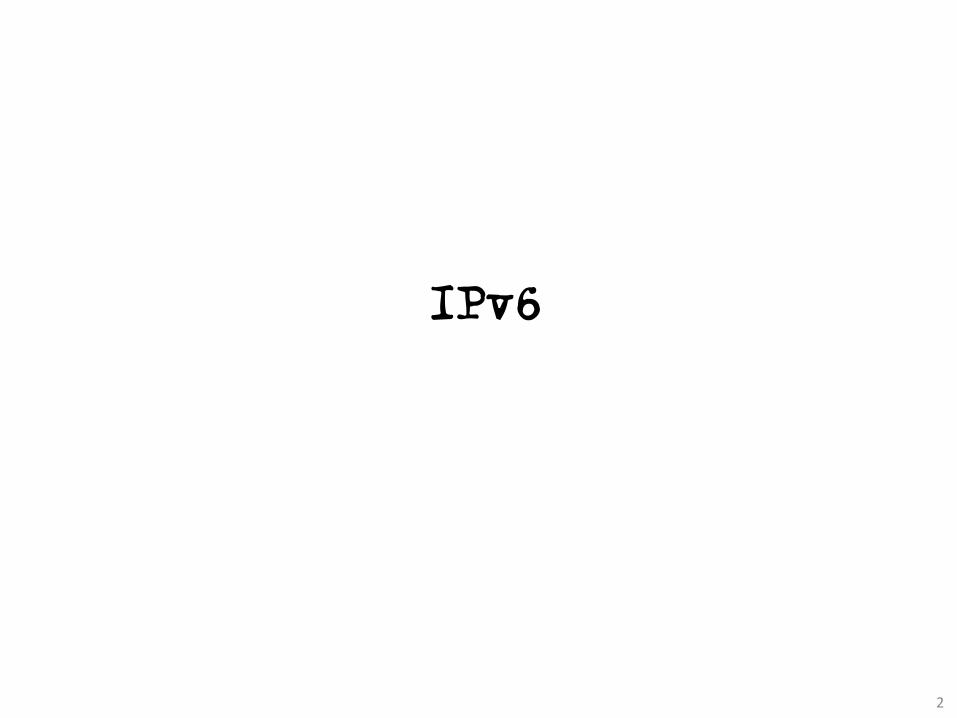
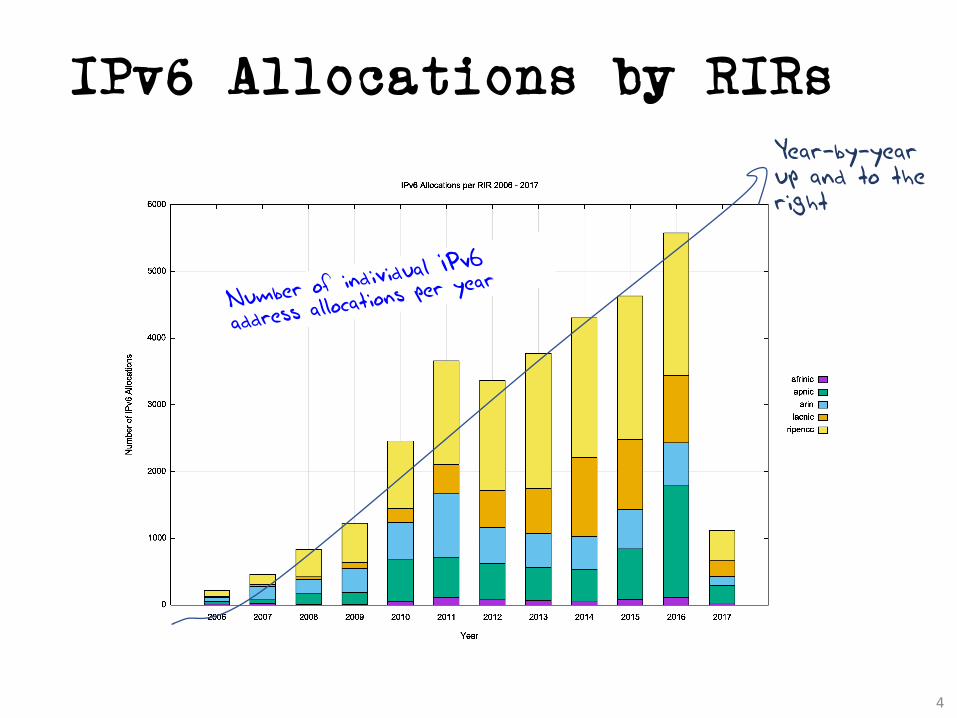
IPv6 Allocations by RIRs
3
IPv6 Allocations by RIRs
4
Year-by-yearup and to the right
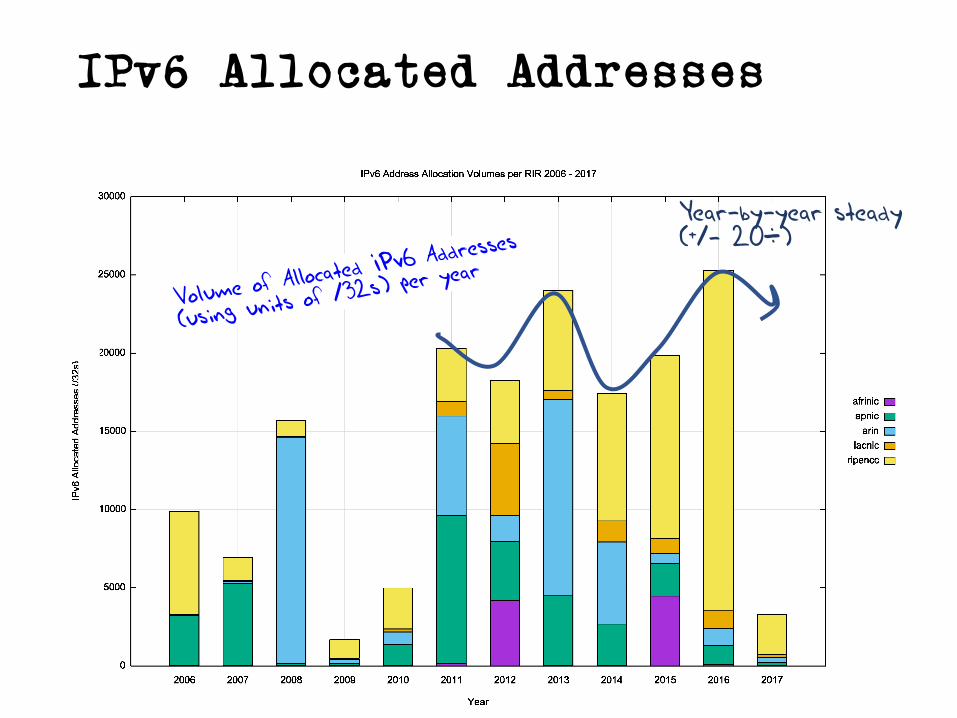
IPv6 Allocated Addresses
Year-by-year steady(+/- 20%)
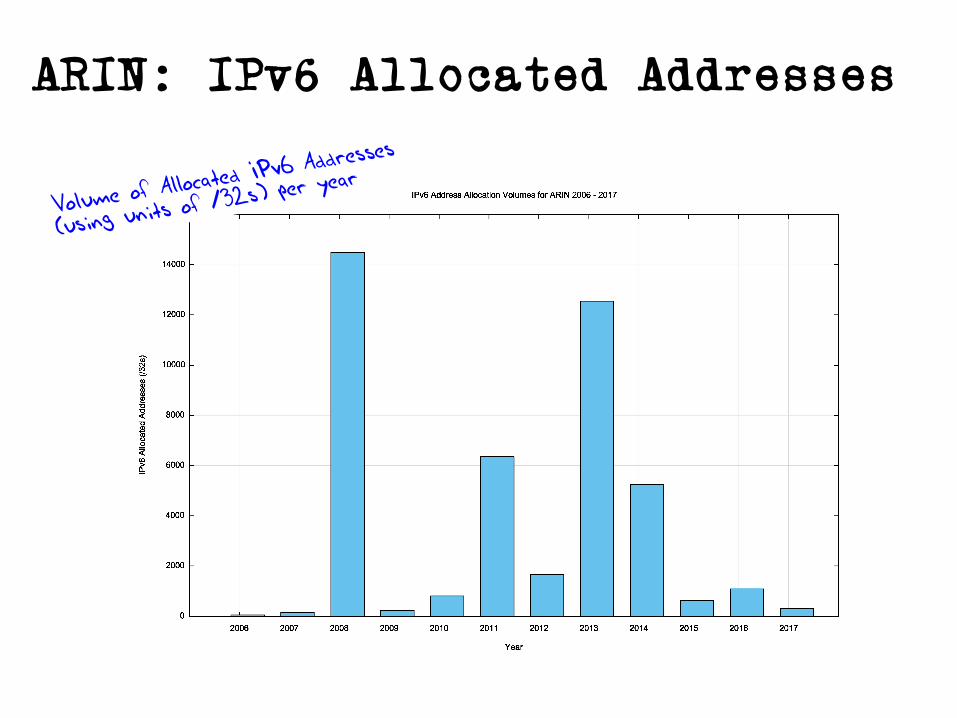
ARIN: IPv6 Allocated Addresses
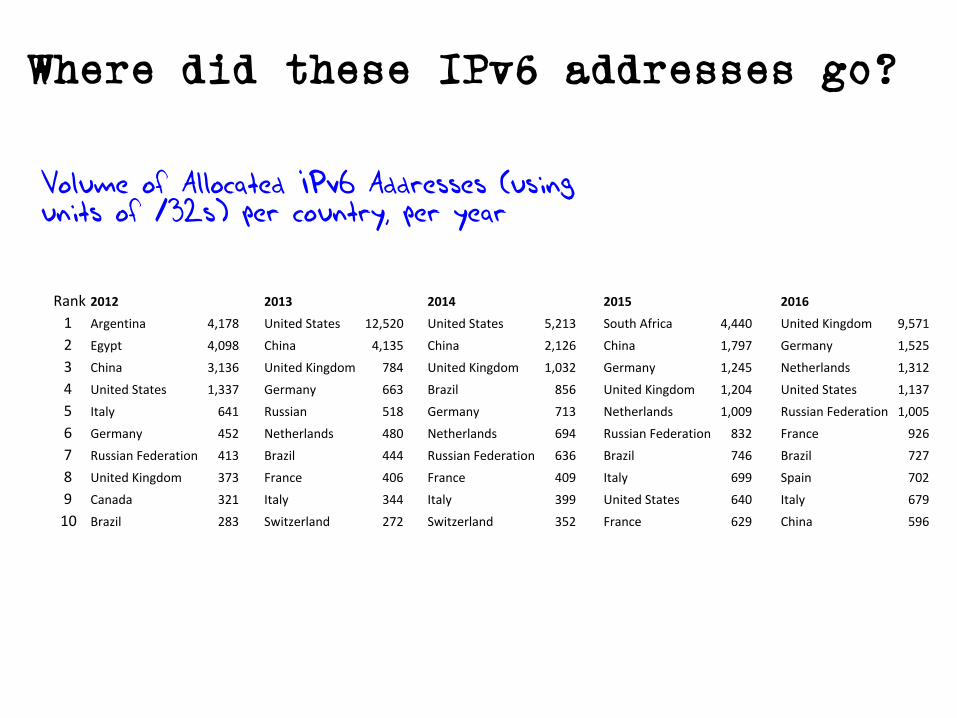
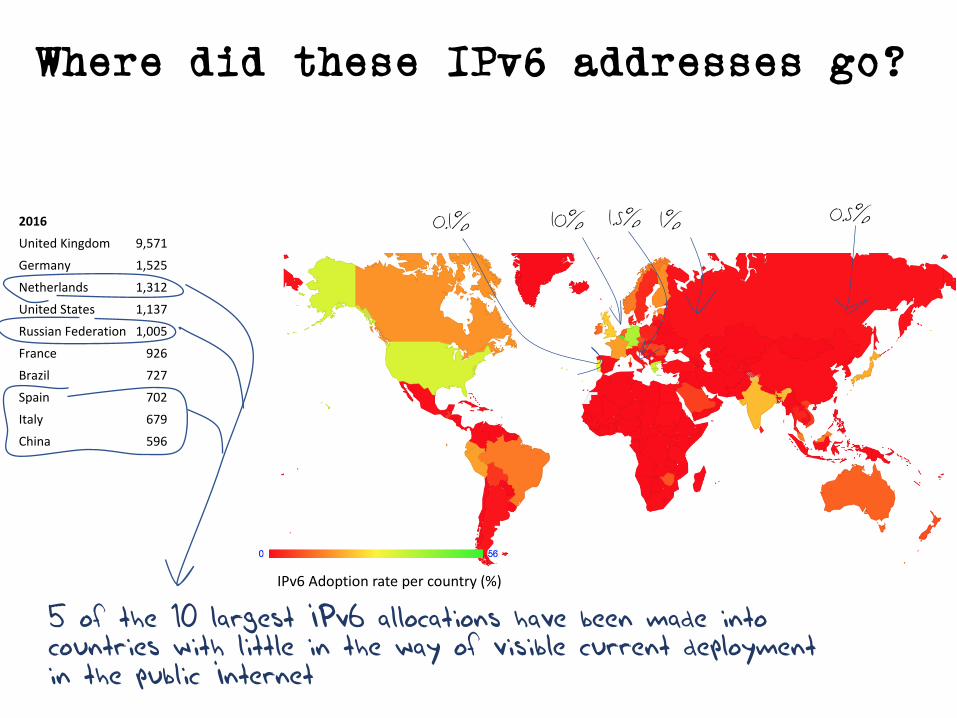
Where did these IPv6 addresses go?
Volume of Allocated IPv6 Addresses (using units of /32s) per country, per year
Rank 2012 2013 2014 2015 20161 Argentina 4,178 UnitedStates 12,520 UnitedStates 5,213 SouthAfrica 4,440 UnitedKingdom 9,5712 Egypt 4,098 China 4,135 China 2,126 China 1,797 Germany 1,5253 China 3,136 UnitedKingdom 784 UnitedKingdom 1,032 Germany 1,245 Netherlands 1,3124 UnitedStates 1,337 Germany 663 Brazil 856 UnitedKingdom 1,204 UnitedStates 1,1375 Italy 641 Russian 518 Germany 713 Netherlands 1,009 RussianFederation 1,0056 Germany 452 Netherlands 480 Netherlands 694 RussianFederation 832 France 9267 RussianFederation 413 Brazil 444 RussianFederation 636 Brazil 746 Brazil 7278 UnitedKingdom 373 France 406 France 409 Italy 699 Spain 7029 Canada 321 Italy 344 Italy 399 UnitedStates 640 Italy 67910 Brazil 283 Switzerland 272 Switzerland 352 France 629 China 596
Where did these IPv6 addresses go?
Rank 2012 2013 2014 2015 20161 Argentina 4,178 UnitedStates 12,520 UnitedStates 5,213 SouthAfrica 4,440 UnitedKingdom 9,5712 Egypt 4,098 China 4,135 China 2,126 China 1,797 Germany 1,5253 China 3,136 UnitedKingdom 784 UnitedKingdom 1,032 Germany 1,245 Netherlands 1,3124 UnitedStates 1,337 Germany 663 Brazil 856 UnitedKingdom 1,204 UnitedStates 1,1375 Italy 641 Russian 518 Germany 713 Netherlands 1,009 RussianFederation 1,0056 Germany 452 Netherlands 480 Netherlands 694 RussianFederation 832 France 9267 RussianFederation 413 Brazil 444 RussianFederation 636 Brazil 746 Brazil 7278 UnitedKingdom 373 France 406 France 409 Italy 699 Spain 7029 Canada 321 Italy 344 Italy 399 UnitedStates 640 Italy 67910 Brazil 283 Switzerland 272 Switzerland 352 France 629 China 596
IPv6Adoptionratepercountry(%)
5 of the 10 largest IPv6 allocations have been made into countries with little in the way of visible current deployment in the public Internet
10% 1%0.1% 1.5% 0.5%
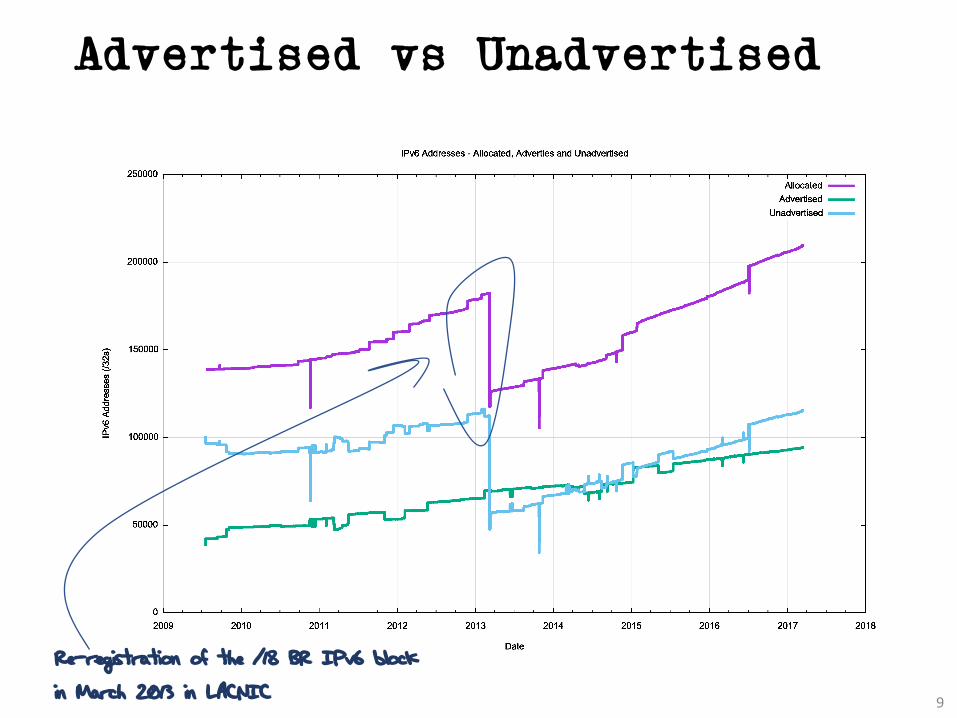
Advertised vs Unadvertised
9
Re-registration of the /18 BR IPv6 block
in March 2013 in LACNIC
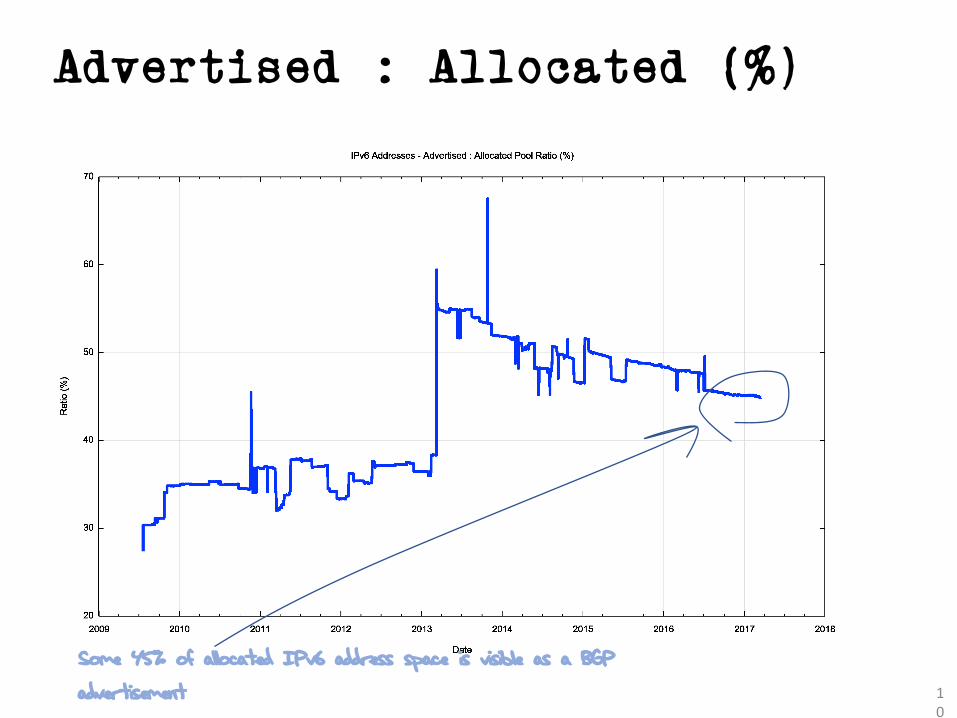
Advertised : Allocated (%)
10
Some 45% of allocated IPv6 address space is visible as a BGP
advertisement
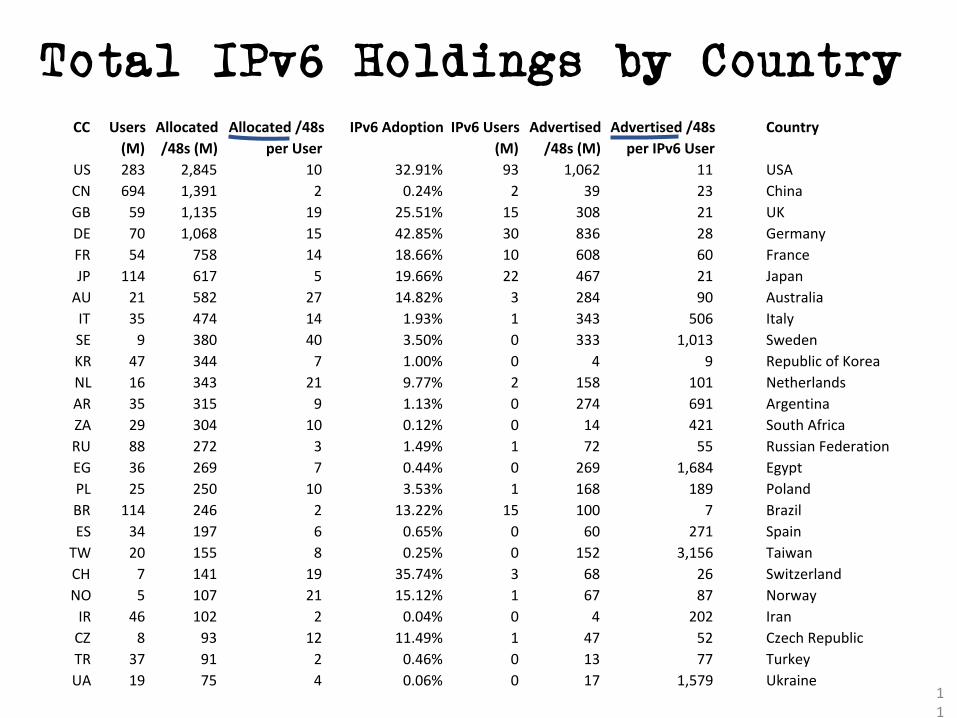
CC Users Allocated Allocated/48s IPv6Adoption IPv6Users Advertised Advertised/48s Country(M) /48s(M) perUser (M) /48s(M) perIPv6User
US 283 2,845 10 32.91% 93 1,062 11 USACN 694 1,391 2 0.24% 2 39 23 ChinaGB 59 1,135 19 25.51% 15 308 21 UKDE 70 1,068 15 42.85% 30 836 28 GermanyFR 54 758 14 18.66% 10 608 60 FranceJP 114 617 5 19.66% 22 467 21 JapanAU 21 582 27 14.82% 3 284 90 AustraliaIT 35 474 14 1.93% 1 343 506 ItalySE 9 380 40 3.50% 0 333 1,013 SwedenKR 47 344 7 1.00% 0 4 9 RepublicofKoreaNL 16 343 21 9.77% 2 158 101 NetherlandsAR 35 315 9 1.13% 0 274 691 ArgentinaZA 29 304 10 0.12% 0 14 421 SouthAfricaRU 88 272 3 1.49% 1 72 55 RussianFederationEG 36 269 7 0.44% 0 269 1,684 EgyptPL 25 250 10 3.53% 1 168 189 PolandBR 114 246 2 13.22% 15 100 7 BrazilES 34 197 6 0.65% 0 60 271 SpainTW 20 155 8 0.25% 0 152 3,156 TaiwanCH 7 141 19 35.74% 3 68 26 SwitzerlandNO 5 107 21 15.12% 1 67 87 NorwayIR 46 102 2 0.04% 0 4 202 IranCZ 8 93 12 11.49% 1 47 52 CzechRepublicTR 37 91 2 0.46% 0 13 77 TurkeyUA 19 75 4 0.06% 0 17 1,579 Ukraine
Total IPv6 Holdings by Country
11
IPv6 Allocations
ManyIPv6addressholdersappeartowanttoavoidbeing“caughtshort”withIPv6,andhavereceivedIPv6addressallocationsthatarefarlargerthantheircurrentneedsforpublicIPv6addresses
Thisisconsistentwithanoveralladdressmanagementframeworkthatisnotprimarilydrivenbyaddressconservationobjectives
This,inturn,isconsistentwiththeIPv6designchoicetouseaverylargeaddressfield,sothatsuchliberaladdressallocationpracticescanbesustainedformanydecades
12
IPv4
13
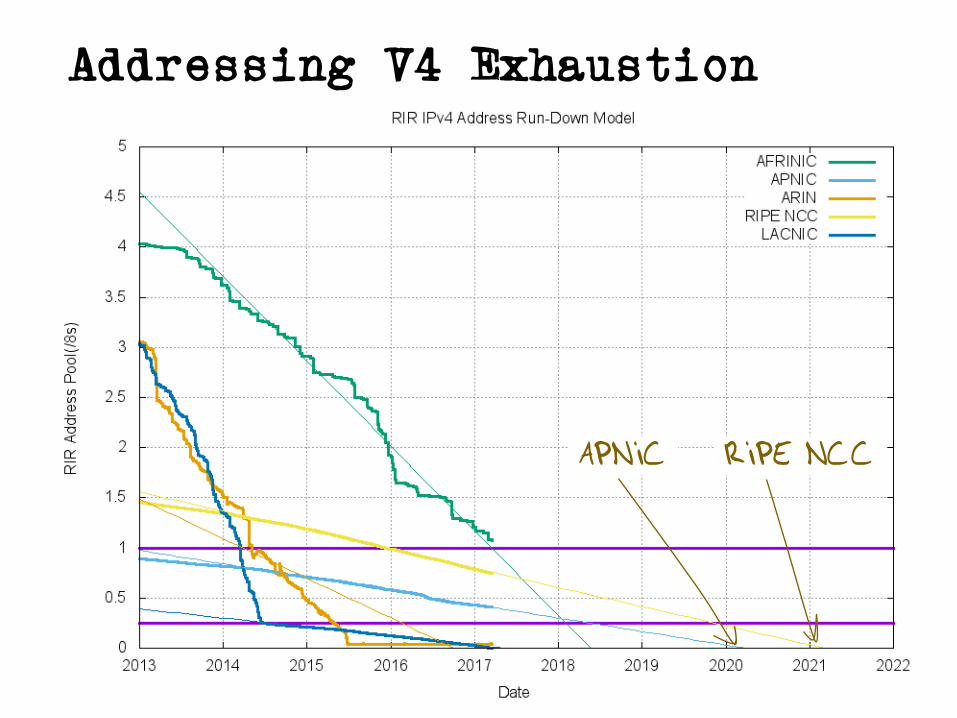
Addressing V4 Exhaustion
RIPE NCCAPNIC
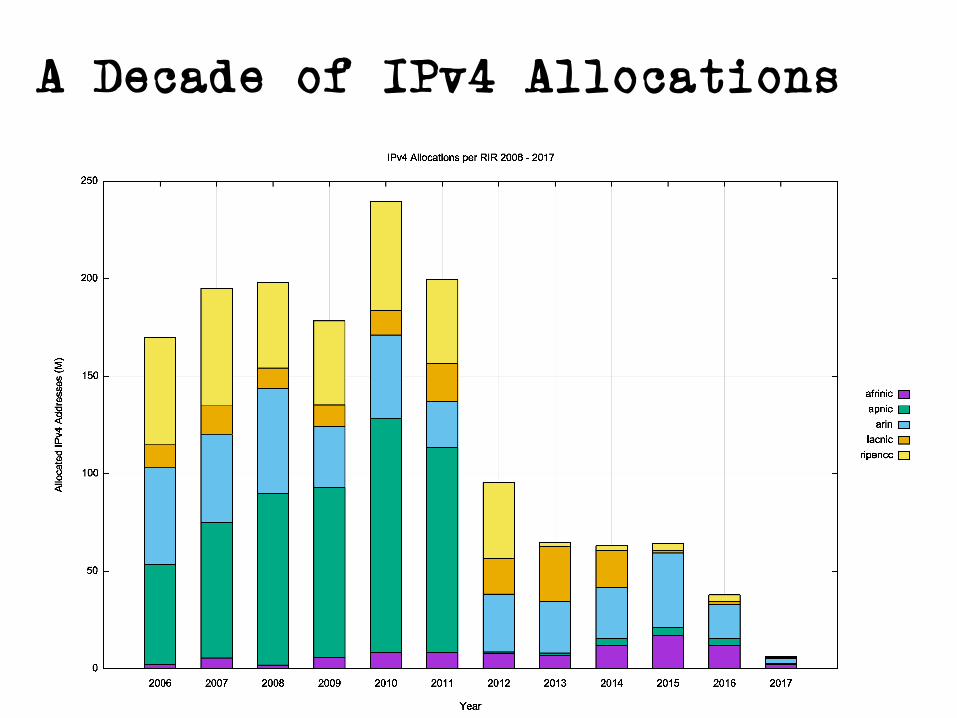
A Decade of IPv4 Allocations
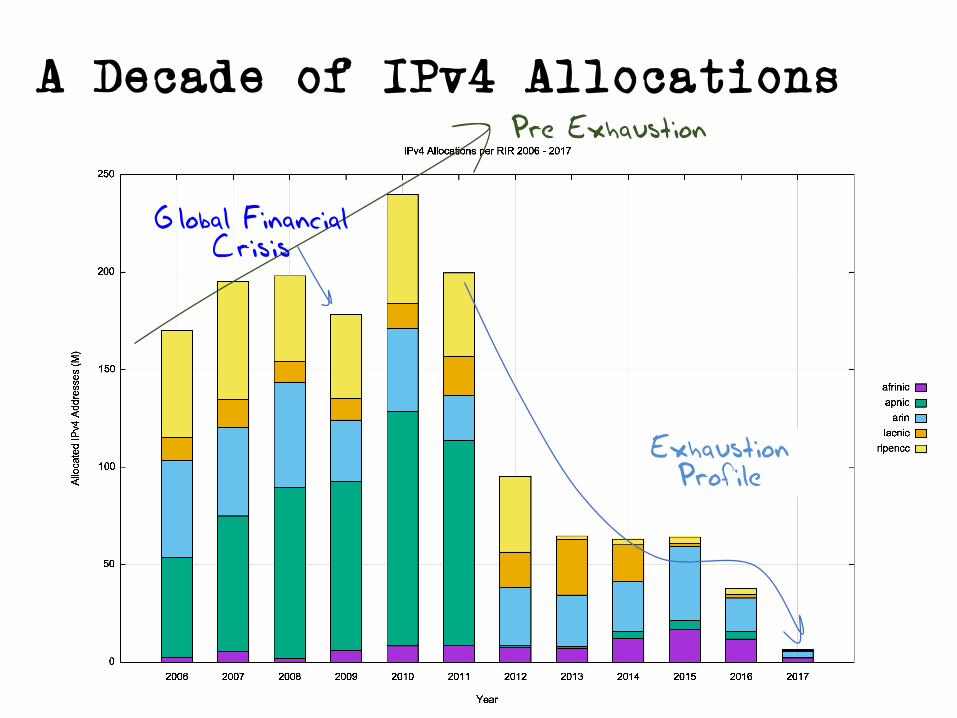
A Decade of IPv4 AllocationsPre Exhaustion
Global FinancialCrisis
ExhaustionProfile
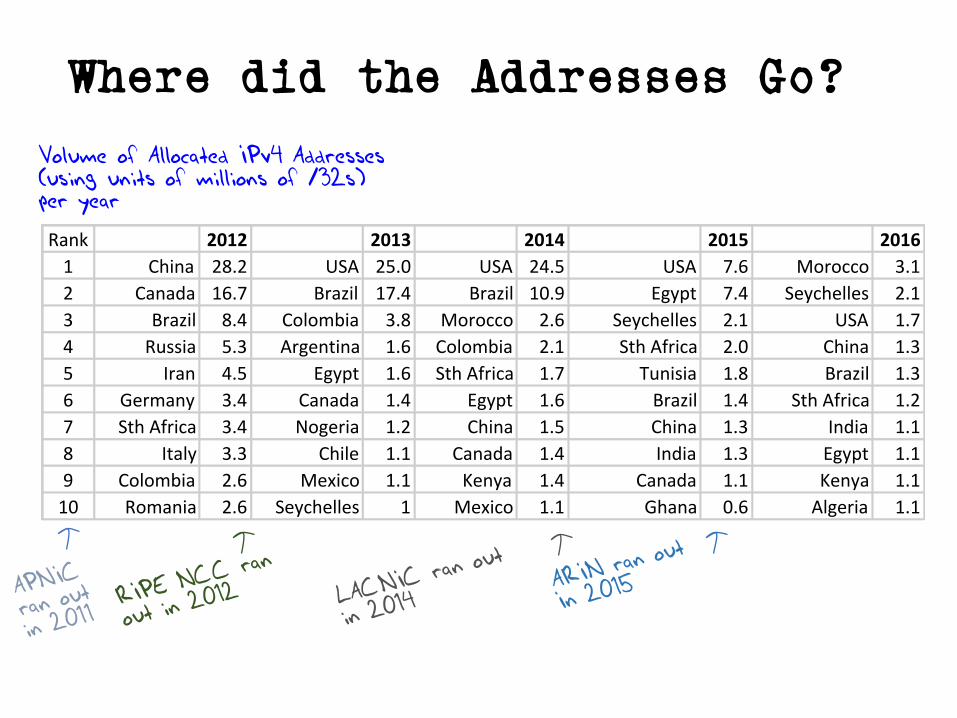
Where did the Addresses Go?Volume of Allocated IPv4 Addresses (using units of millions of /32s) per year
Rank 2012 2013 2014 2015 20161 China 28.2 USA 25.0 USA 24.5 USA 7.6 Morocco 3.1
2 Canada 16.7 Brazil 17.4 Brazil 10.9 Egypt 7.4 Seychelles 2.1
3 Brazil 8.4 Colombia 3.8 Morocco 2.6 Seychelles 2.1 USA 1.7
4 Russia 5.3 Argentina 1.6 Colombia 2.1 SthAfrica 2.0 China 1.3
5 Iran 4.5 Egypt 1.6 SthAfrica 1.7 Tunisia 1.8 Brazil 1.3
6 Germany 3.4 Canada 1.4 Egypt 1.6 Brazil 1.4 SthAfrica 1.2
7 SthAfrica 3.4 Nogeria 1.2 China 1.5 China 1.3 India 1.1
8 Italy 3.3 Chile 1.1 Canada 1.4 India 1.3 Egypt 1.1
9 Colombia 2.6 Mexico 1.1 Kenya 1.4 Canada 1.1 Kenya 1.1
10 Romania 2.6 Seychelles 1 Mexico 1.1 Ghana 0.6 Algeria 1.1
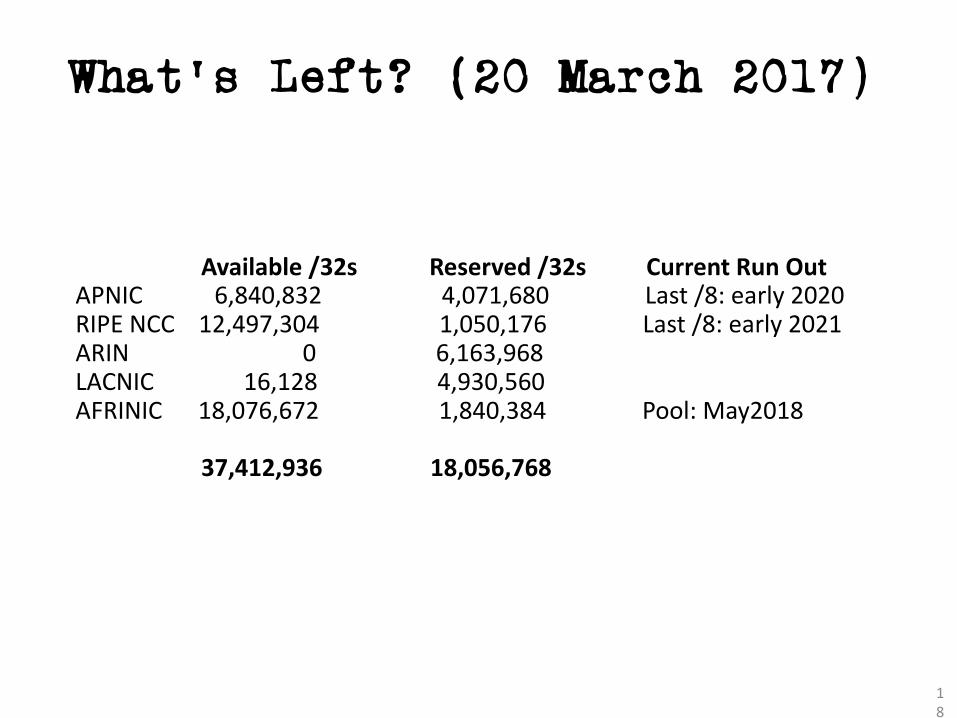
What’s Left? (20 March 2017)
Available/32sReserved/32sCurrentRunOutAPNIC6,840,8324,071,680 Last/8:early2020RIPENCC12,497,3041,050,176Last/8:early2021ARIN06,163,968LACNIC16,1284,930,560AFRINIC18,076,6721,840,384Pool:May2018
37,412,93618,056,768
18
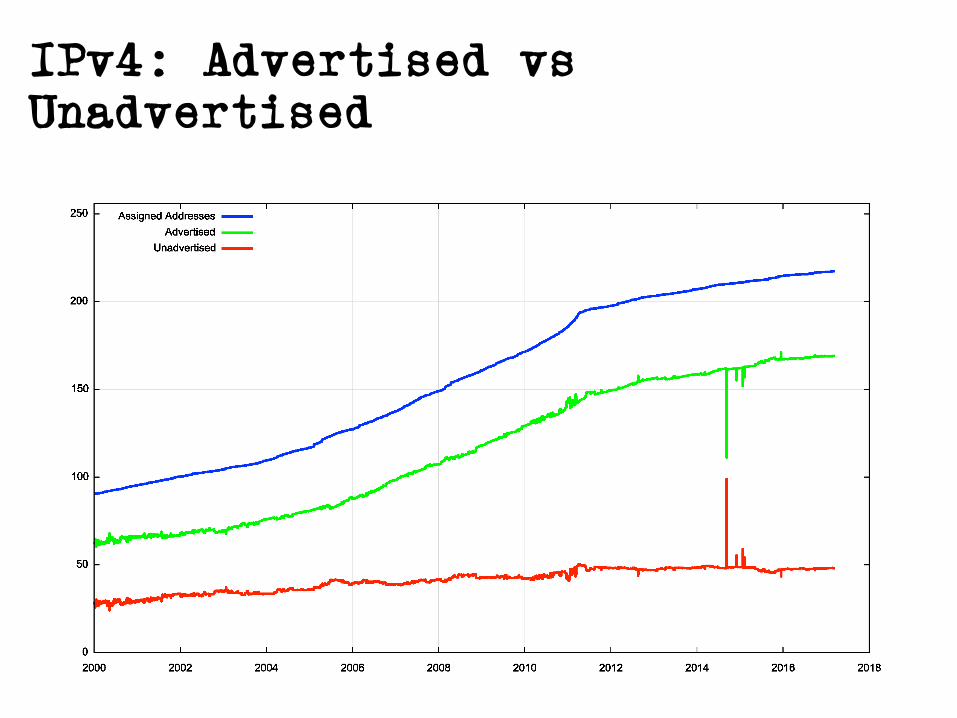
IPv4: Advertised vs Unadvertised
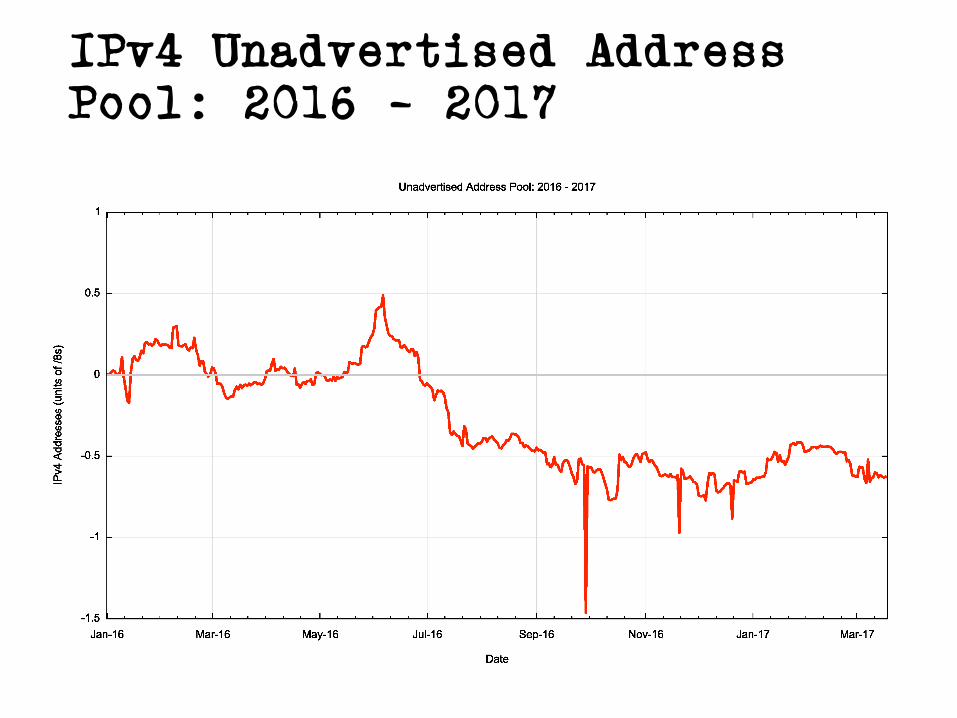
IPv4 Unadvertised Address Pool: 2016 - 2017
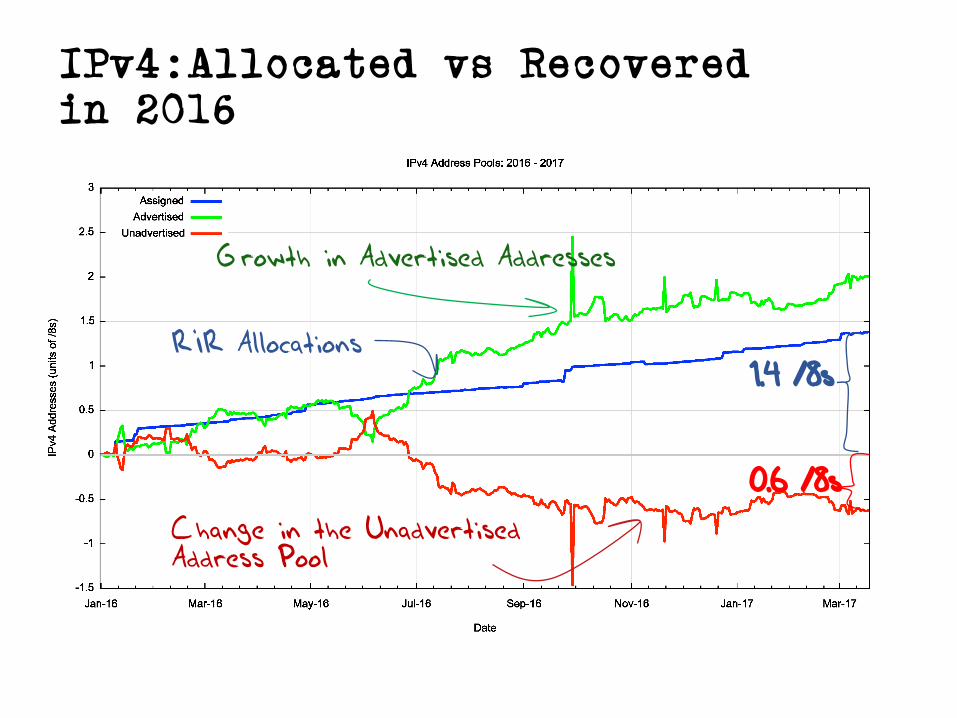
IPv4:Allocated vs Recovered in 2016
Growth in Advertised Addresses
Change in the Unadvertised Address Pool
RIR Allocations1.4 /8s
0.6 /8s
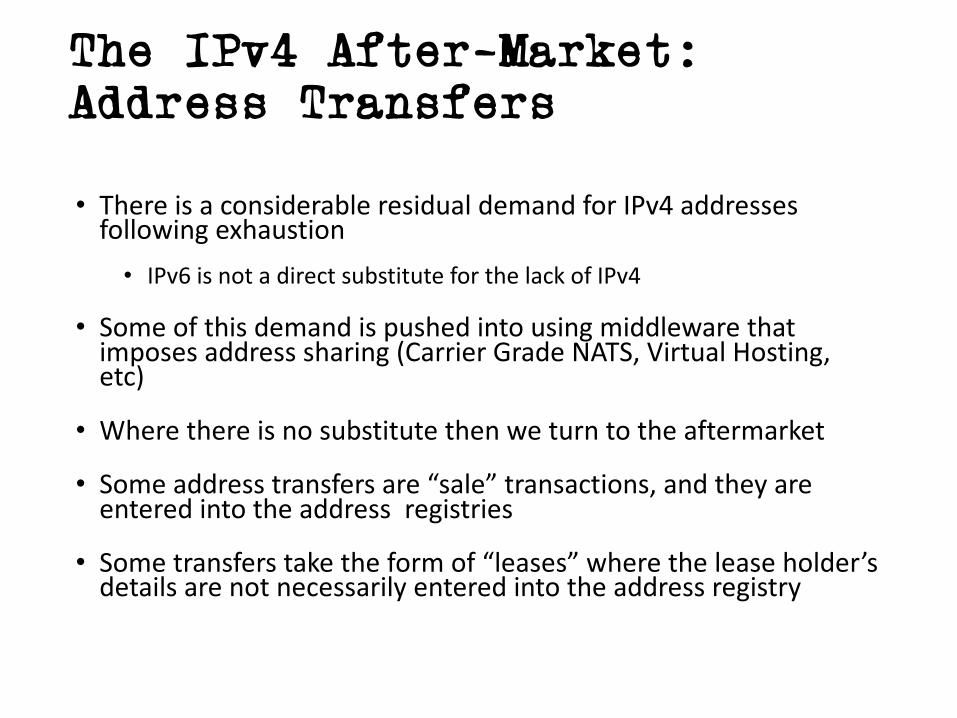
The IPv4 After-Market: Address Transfers
• ThereisaconsiderableresidualdemandforIPv4addressesfollowingexhaustion• IPv6isnotadirectsubstituteforthelackofIPv4
• Someofthisdemandispushedintousingmiddlewarethatimposesaddresssharing(CarrierGradeNATS,VirtualHosting,etc)
• Wherethereisnosubstitutethenweturntotheaftermarket
• Someaddresstransfersare“sale”transactions,andtheyareenteredintotheaddressregistries
• Sometransferstaketheformof“leases”wheretheleaseholder’sdetailsarenotnecessarilyenteredintotheaddressregistry
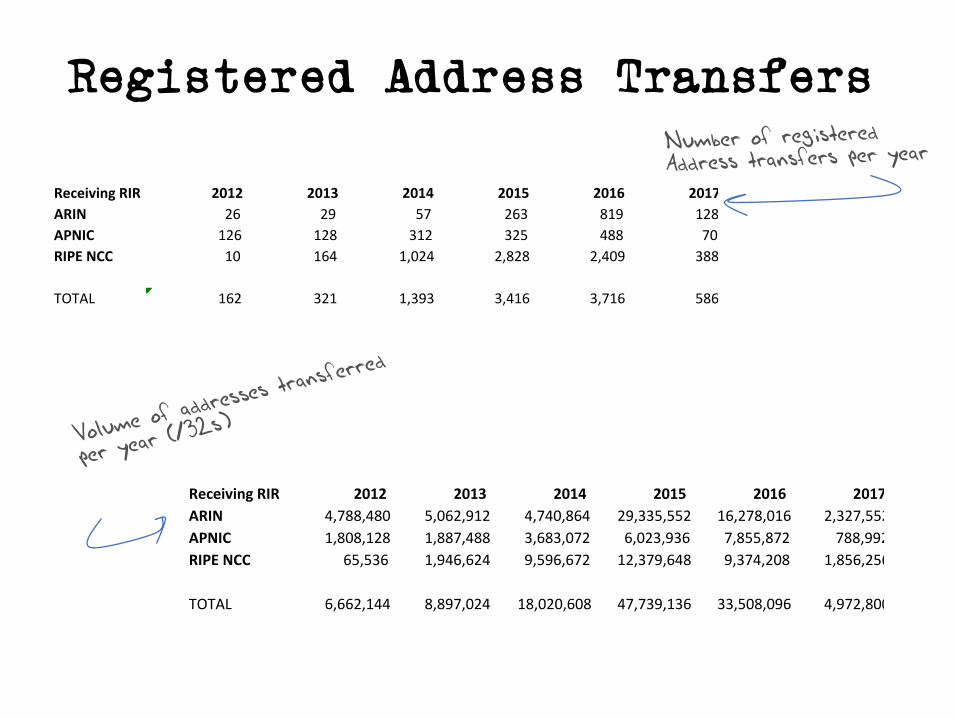
Registered Address Transfers
ReceivingRIR 2012 2013 2014 2015 2016 2017ARIN 26 29 57 263 819 128APNIC 126 128 312 325 488 70RIPENCC 10 164 1,024 2,828 2,409 388
TOTAL 162 321 1,393 3,416 3,716 586
ReceivingRIR 2012 2013 2014 2015 2016 2017ARIN 4,788,480 5,062,912 4,740,864 29,335,552 16,278,016 2,327,552APNIC 1,808,128 1,887,488 3,683,072 6,023,936 7,855,872 788,992RIPENCC 65,536 1,946,624 9,596,672 12,379,648 9,374,208 1,856,256
TOTAL 6,662,144 8,897,024 18,020,608 47,739,136 33,508,096 4,972,800
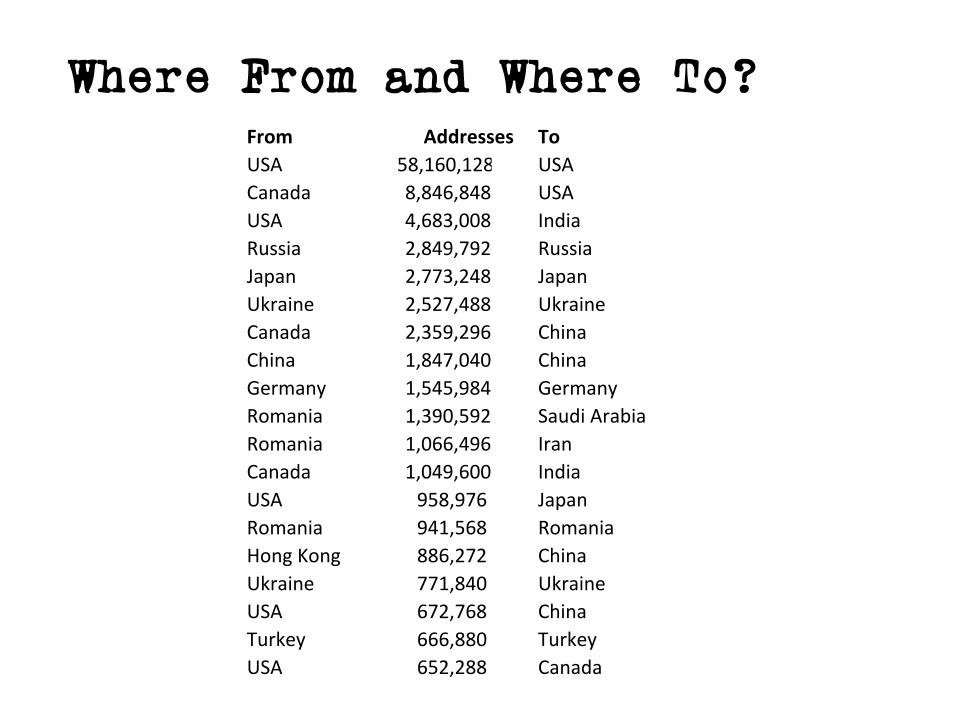
Where From and Where To?From Addresses ToUSA 58,160,128.00 USACanada 8,846,848.00 USAUSA 4,683,008.00 IndiaRussia 2,849,792.00 RussiaJapan 2,773,248.00 JapanUkraine 2,527,488.00 UkraineCanada 2,359,296.00 ChinaChina 1,847,040.00 ChinaGermany 1,545,984.00 GermanyRomania 1,390,592.00 SaudiArabiaRomania 1,066,496.00 IranCanada 1,049,600.00 IndiaUSA 958,976.00 JapanRomania 941,568.00 RomaniaHongKong 886,272.00 ChinaUkraine 771,840.00 UkraineUSA 672,768.00 ChinaTurkey 666,880.00 TurkeyUSA 652,288.00 Canada
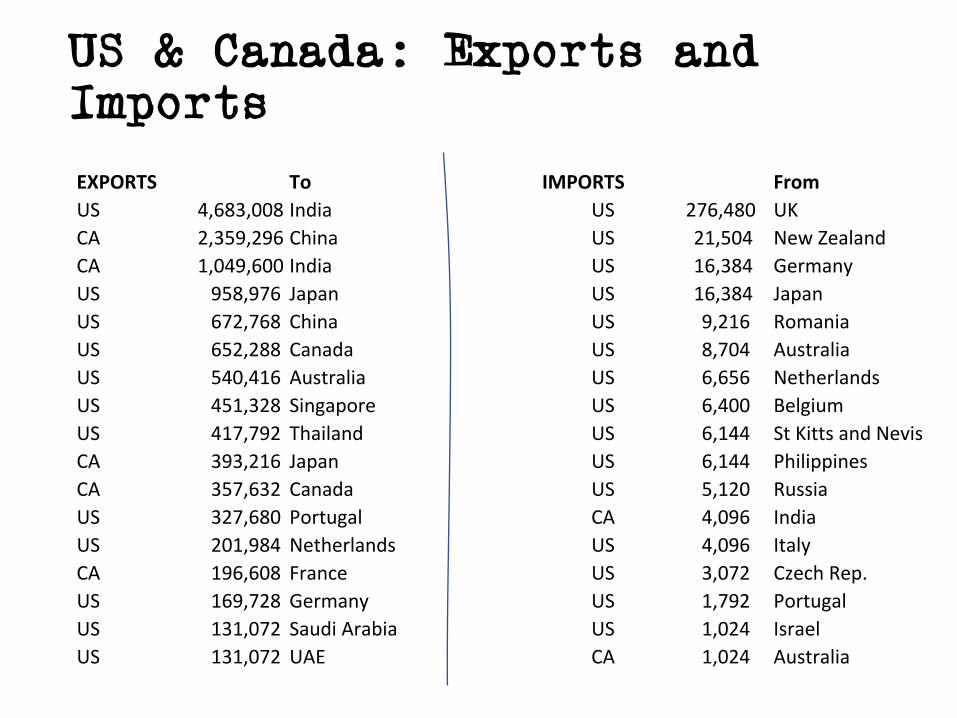
US & Canada: Exports and ImportsEXPORTS To IMPORTS FromUS IN 4,683,008 India GB US 276,480 UKCA CN 2,359,296 China NZ US 21,504 NewZealandCA IN 1,049,600 India DE US 16,384 GermanyUS JP 958,976 Japan JP US 16,384 JapanUS CN 672,768 China RO US 9,216 RomaniaUS CA 652,288 Canada AU US 8,704 AustraliaUS AU 540,416 Australia NL US 6,656 NetherlandsUS SG 451,328 Singapore BE US 6,400 BelgiumUS TH 417,792 Thailand KN US 6,144 StKittsandNevisCA JP 393,216 Japan PH US 6,144 PhilippinesCA CA 357,632 Canada RU US 5,120 RussiaUS PT 327,680 Portugal IN CA 4,096 IndiaUS NL 201,984 Netherlands IT US 4,096 ItalyCA FR 196,608 France CZ US 3,072 CzechRep.US DE 169,728 Germany PT US 1,792 PortugalUS SA 131,072 SaudiArabia IL US 1,024 IsraelUS AE 131,072 UAE AU CA 1,024 Australia
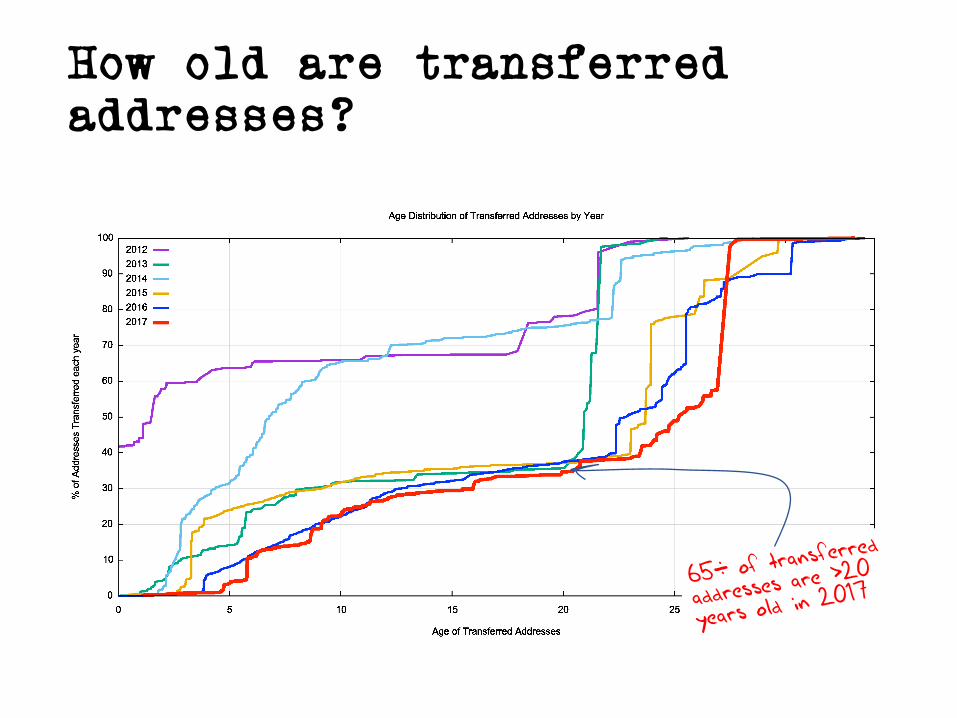
How old are transferred addresses?
But
TheRIRTransferLogsarenottheentirestory:• Forexample,theRIPENCC’saddresstransferlogsappearnottocontainrecordsoftransfersoflegacyspace• Addressleasesandsimilar“offmarket”addresstransactionsarenotnecessarilyrecordedintheRIRs’transferlogs
CanBGPtellusanythingaboutthismissingdata?
27
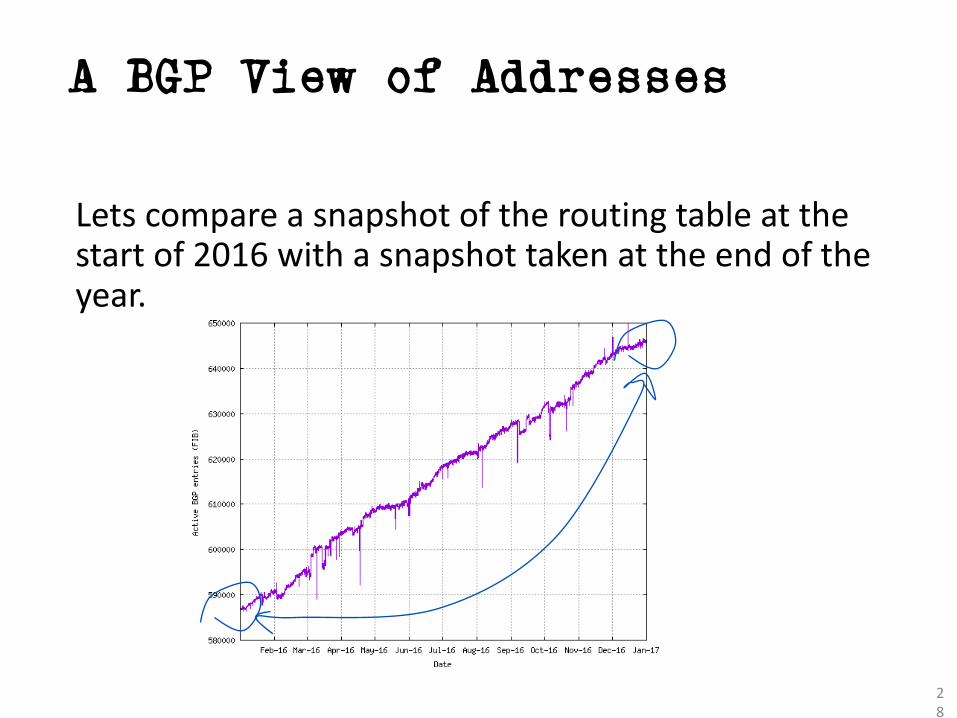
A BGP View of Addresses
Letscompareasnapshotoftheroutingtableatthestartof2016withasnapshottakenattheendoftheyear.
28
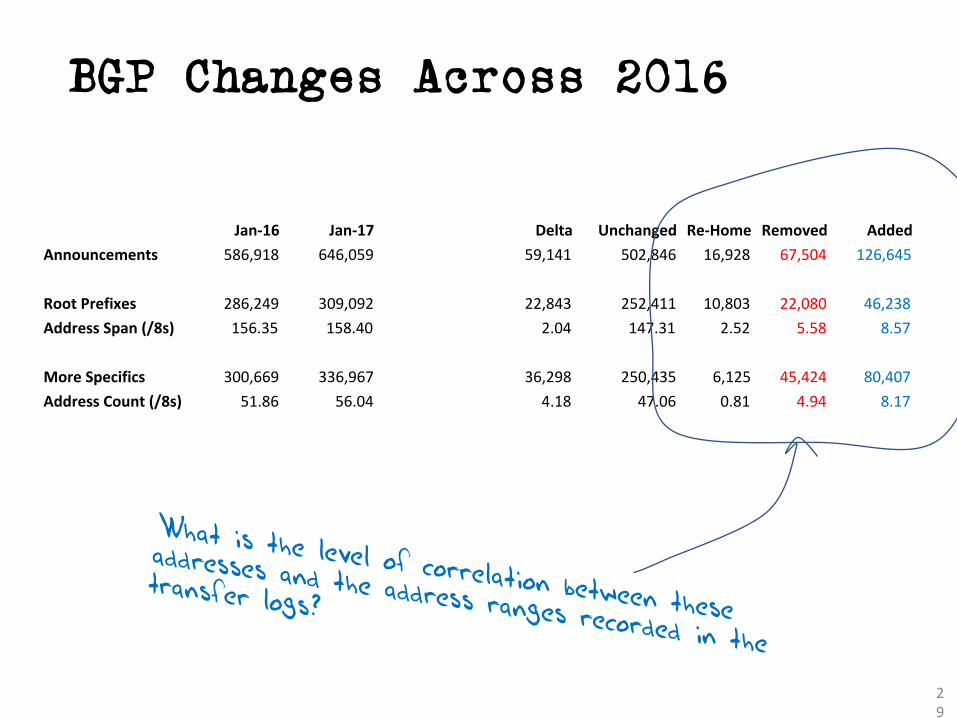
BGP Changes Across 2016
29
Jan-16 Jan-17 Delta Unchanged Re-Home Removed AddedAnnouncements 586,918 646,059 59,141 502,846 16,928 67,504 126,645
RootPrefixes 286,249 309,092 22,843 252,411 10,803 22,080 46,238AddressSpan(/8s) 156.35 158.40 2.04 147.31 2.52 5.58 8.57
MoreSpecifics 300,669 336,967 36,298 250,435 6,125 45,424 80,407AddressCount(/8s) 51.86 56.04 4.18 47.06 0.81 4.94 8.17
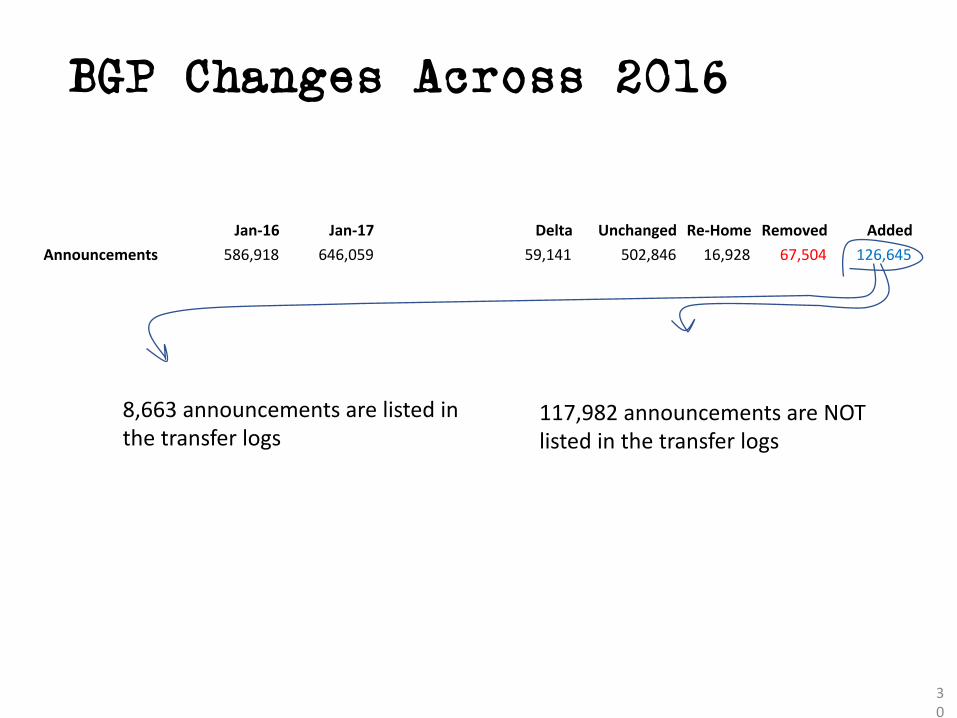
BGP Changes Across 2016
30
Jan-16 Jan-17 Delta Unchanged Re-Home Removed AddedAnnouncements 586,918 646,059 59,141 502,846 16,928 67,504 126,645
RootPrefixes 286,249 309,092 22,843 252,411 10,803 22,080 46,238AddressSpan(/8s) 156.35 158.40 2.04 147.31 2.52 5.58 8.57
MoreSpecifics 300,669 336,967 36,298 250,435 6,125 45,424 80,407AddressCount(/8s) 51.86 56.04 4.18 47.06 0.81 4.94 8.178,663announcementsarelistedin
thetransferlogs117,982announcementsareNOTlistedinthetransferlogs
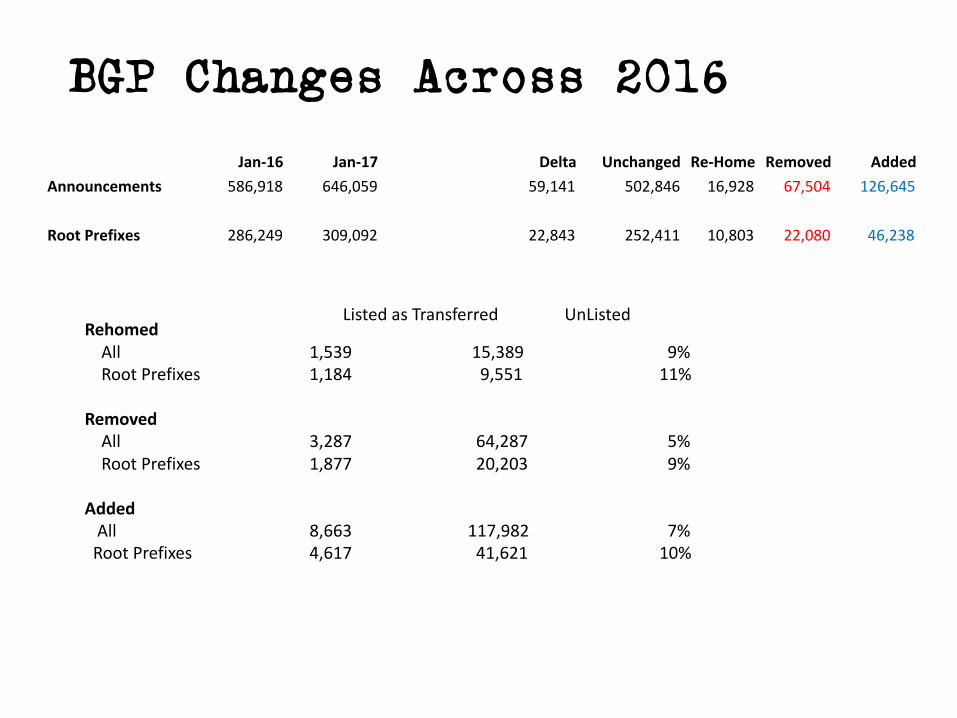
BGP Changes Across 2016
Jan-16 Jan-17 Delta Unchanged Re-Home Removed AddedAnnouncements 586,918 646,059 59,141 502,846 16,928 67,504 126,645
RootPrefixes 286,249 309,092 22,843 252,411 10,803 22,080 46,238AddressSpan(/8s) 156.35 158.40 2.04 147.31 2.52 5.58 8.57
MoreSpecifics 300,669 336,967 36,298 250,435 6,125 45,424 80,407AddressCount(/8s) 51.86 56.04 4.18 47.06 0.81 4.94 8.17
ListedasTransferred UnListedRehomedAll 1,539 15,389 9%RootPrefixes 1,184 9,551 11%
RemovedAll 3,287 64,287 5%RootPrefixes 1,877 20,203 9%
AddedAll 8,663 117,982 7%RootPrefixes 4,617 41,621 10%
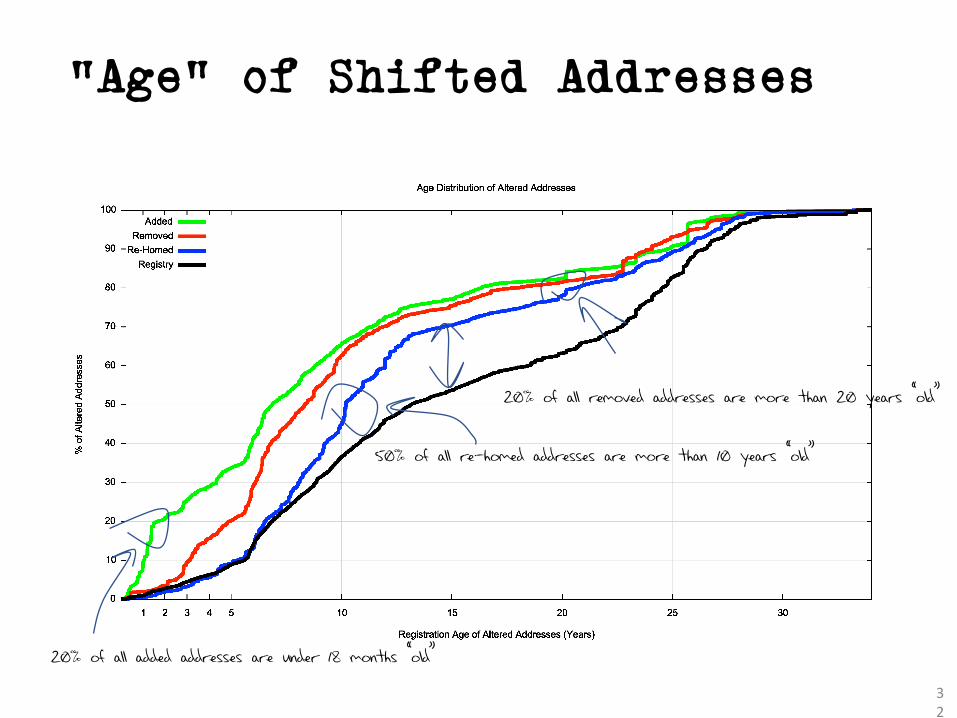
“Age” of Shifted Addresses
32
20% of all added addresses are under 18 months “old”
50% of all re-homed addresses are more than 10 years “old”
20% of all removed addresses are more than 20 years “old”
“Age” of Shifted Addresses
33
• Some20%ofaddressesthatchangedtheirroutingstatein2016are“legacy”allocatedaddressesthataremorethan20years“old”• Addressesolderthan20yearslooktobemorestablethantheregistry“norm”• Addressesallocatedinthepast18monthsaremorelikelytohavebeenannounced(naturally!)• Addressesthatare5– 10yearsoldaremorelikelytohavebeenremovedfromtheroutingsystemin2016
BGP Data and Transfer Logs
• Some5-10%ofaddresschangesseenacross2016(announced,withdrawnandre-homed)arelistedintheRIRtransferlogs• ThatdoesNOT implythattheremaining90-95%ofaddresstransfersareallunrecordedtransfers• Butitdoespointtoalargerbodyofaddressesthathavechangedtheiradvertisementstatusinonewayoranother,someofwhichmayhaveinvolvedleasingorotherformsofaddressmovement,thatarenotrecordedinthetransferlogs
34
Address Movement and the Registries
• Itisnotclearfromthisanalysiswhathashappenedinthecaseoftheotheraddresses.Thiscouldinclude:• ”normal”movementofedgenetworksbetweenupstreamproviders(customer‘churn’)• Occludedmulti-homing• Addressmovementwithinadistributededgenetwork• Addressleasing• Addresstransfersnotrecordedinthetransferregistries
• Moreanalysisisrequiredtounderstandwhatishappeninghere
35

Thank You!