Embed Size (px)
Citation preview
Evalua&ng the search experience: from Retrieval Effec&veness to User Engagement
Mounia Lalmas Yahoo Labs London [email protected]
CLEF 2015 – Toulouse

This talk
§ Evaluation in search (offline evaluation) (online evaluation)
§ Interpreting the signals § Introduction to user engagement § From retrieval effectiveness to user engagement (from intra-session to inter-session evaluation)

The Message of this talk
What you want to optimize for
each task, session, query
M1 M2 M3 . . .
Mn
LTV1 LTV2 LTV3
.
.
. LTVm
Mi LTVj
What you want to optimize long-
term System
Models
Features

Evaluation in search

How to evaluate a search system
§ Coverage § Speed § Query language § User interface
§ User happiness Users find what they want and return to the search system
§ But let us remember: In carrying out a search task, search is a means, not an end
Sec. 8.6
(Manning, Raghavan & Schütze, 2008; Baeza-Yates & Ribeiro-Neto, 2011)

Within an online session › July 2012 › 2.5M users › 785M page views
› Categorization of the most frequent accessed sites
• 11 categories (e.g. news), 33 subcategories (e.g. news finance, news society)
• 760 sites from 70 countries/regions
short sessions: average 3.01 distinct sites visited with revisitation rate 10% long sessions: average 9.62 distinct sites visited with revisitation rate 22%
(Lehmann etal, 2013)

Measuring user happiness Most common proxy: relevance of retrieved results
Sec. 8.1
Relevant
Retrieved
all items
§ User informa(on need translated into a query
§ Relevance assessed rela&ve to informa(on need not the query
§ Example: › Informa&on need: I am looking for tennis
holiday in a country with no rain › Query: tennis academy good weather
Evaluation measures: • precision, recall, R-precision; precision@n; average precision; F-measure; … • bpref; cumulative gains, rank-biased precision, expected reciprocal rank, Q-measure, …
precision
recall
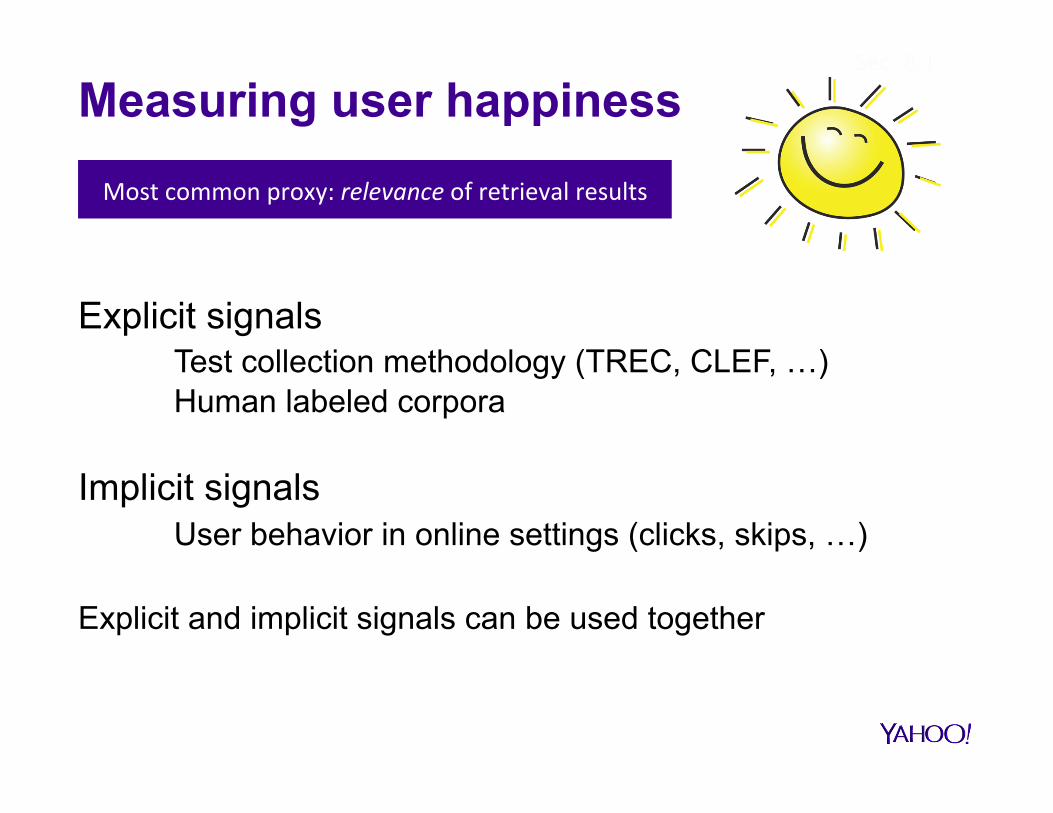
Measuring user happiness Most common proxy: relevance of retrieval results
Sec. 8.1
Explicit signals Test collection methodology (TREC, CLEF, …) Human labeled corpora
Implicit signals User behavior in online settings (clicks, skips, …)
Explicit and implicit signals can be used together

Examples of implicit signals § Number of clicks
§ SAT click § Quick-back click
§ Click at given position § Time to first click
§ Skipping
§ Abandonment rate § Number of query reformulations
§ Dwell time § Hover

What is a happy user in search
1. The user information need is satisfied 2. The user has learned about a topic and even
about other topics 3. The system was inviting and even fun to use
In-the-moment engagement Users on a site Long-term engagement Users come back frequently
USER ENGAGEMENT
Interpreting the signals

User variability
(Anderson & Krathwohl, 2001; Bailey etal, 2015)
T: number of documents users (judges) expected to read Q: number of queries users (judges) expected to issue
Task complexity Task complexity

Explicit signal: MAP
(Turpin & Scholer, 2006)
Similar results obtained with P@2, P@3, P@4 and P@10
PRECISION-BASED SEARCH

Explicit signal: MAP (2)
(Turpin & Scholer, 2006)
RECALL-BASED SEARCH

top most popular tweets top most popular tweets + geographical diverse
Being from a central or peripheral location makes a difference. Peripheral users did not perceive the timeline as being diverse
Explicit signal: “Diversity”
It should never be just about the algorithm, but also how users respond to what the algorithm returns to them
(Graells-Garrido, Lalmas & Baeza-Yates, Under Review)

Implicit signal: Click-through rate
CTR
new ranking algorithm new design of search result page …

Multimedia search activities often driven by entertainment needs, not by information needs
Relevance in multimedia search
(Slaney, 2011)
Signal signal: Clicks (I)
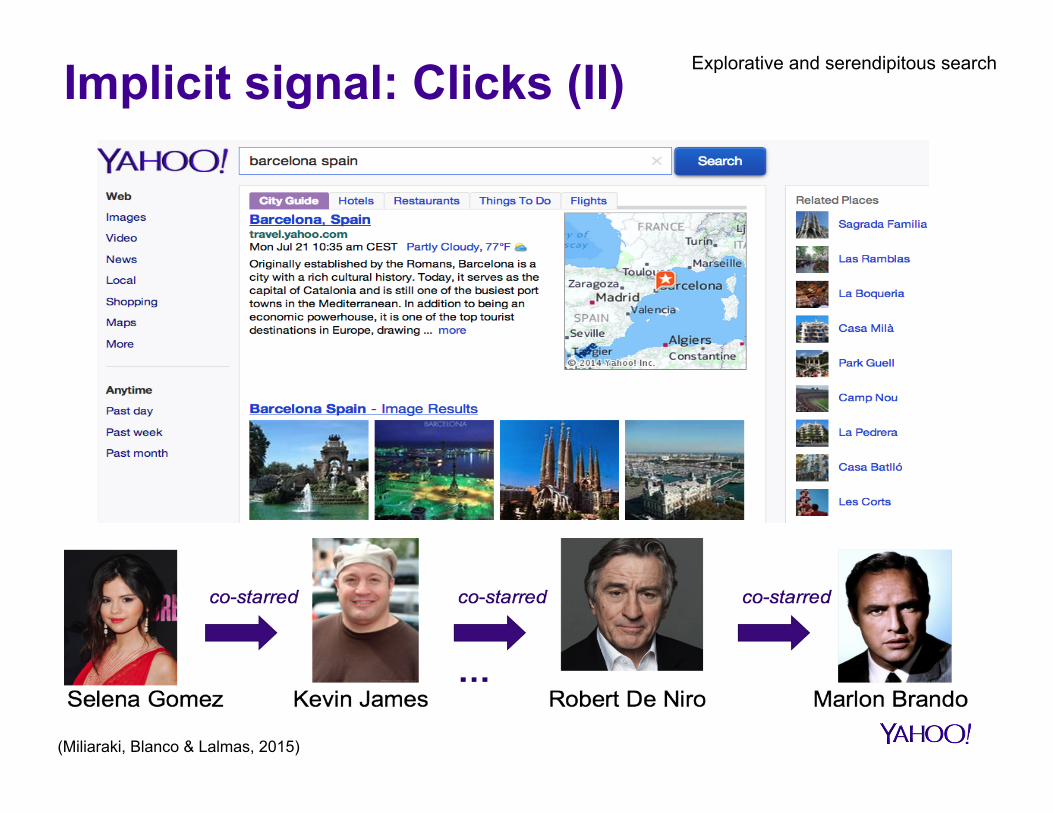
(Miliaraki, Blanco & Lalmas, 2015)
Implicit signal: Clicks (II) Explorative and serendipitous search

I just wanted the phone number … I am totally happy J
Implicit signal: No click Information-rich snippet
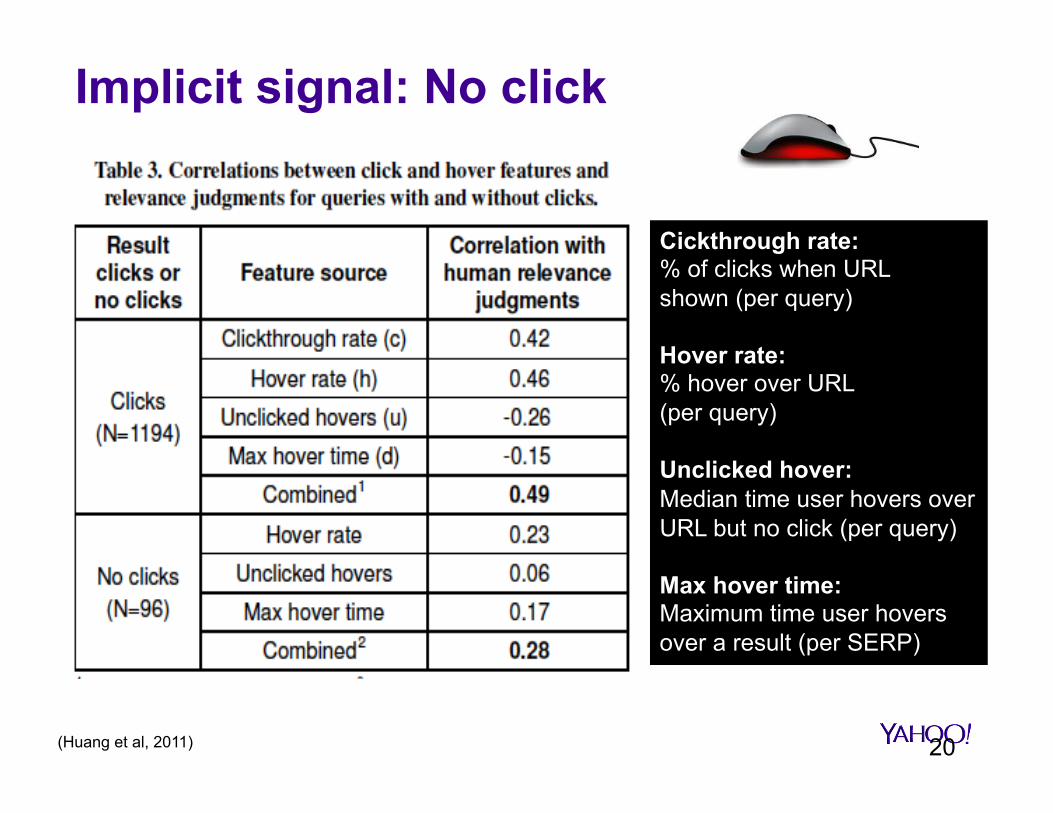
Implicit signal: No click
Cickthrough rate: % of clicks when URL shown (per query) Hover rate: % hover over URL (per query) Unclicked hover: Median time user hovers over URL but no click (per query) Max hover time: Maximum time user hovers over a result (per SERP)
(Huang et al, 2011) 20

§ Abandonment is when there is no click on the search result page › User is dissatisfied (bad abandonment) › User found result(s) on the search result page (good abandonment)
§ 858 queries (21% good vs. 79% abandonment manually examined) § Cursor trail length
› Total distance (pixel) traveled by cursor on SERP › Shorter for good abandonment
§ Movement time › Total time (second) cursor moved on SERP › Longer when answers in snippet (good abandonment)
§ Cursor speed › Average cursor speed (pixel/second) › Slower when answers in snippet (good abandonment)
(Huang et al, 2011)
Implicit signal: Abandonment rate
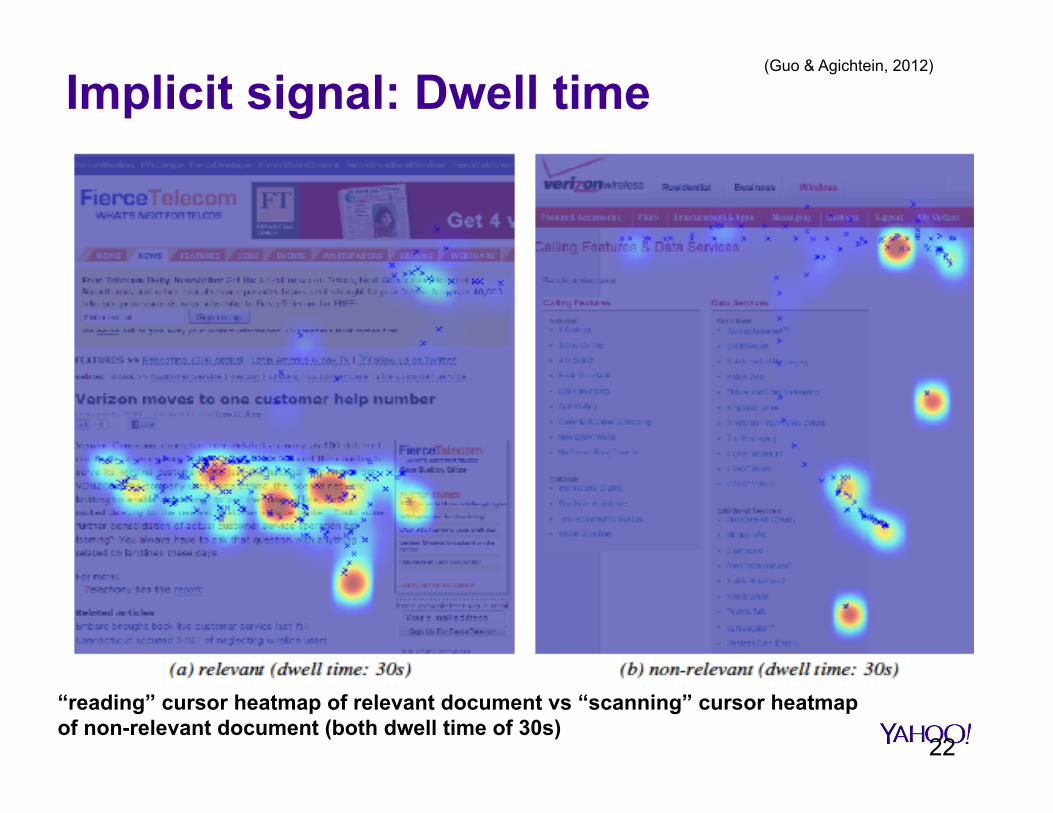
“reading” cursor heatmap of relevant document vs “scanning” cursor heatmap of non-relevant document (both dwell time of 30s)
(Guo & Agichtein, 2012)
22
Implicit signal: Dwell time

Implicit signal: Dwell time
“reading” a relevant long document vs “scanning” a long non-relevant document
(Guo & Agichtein, 2012)
23
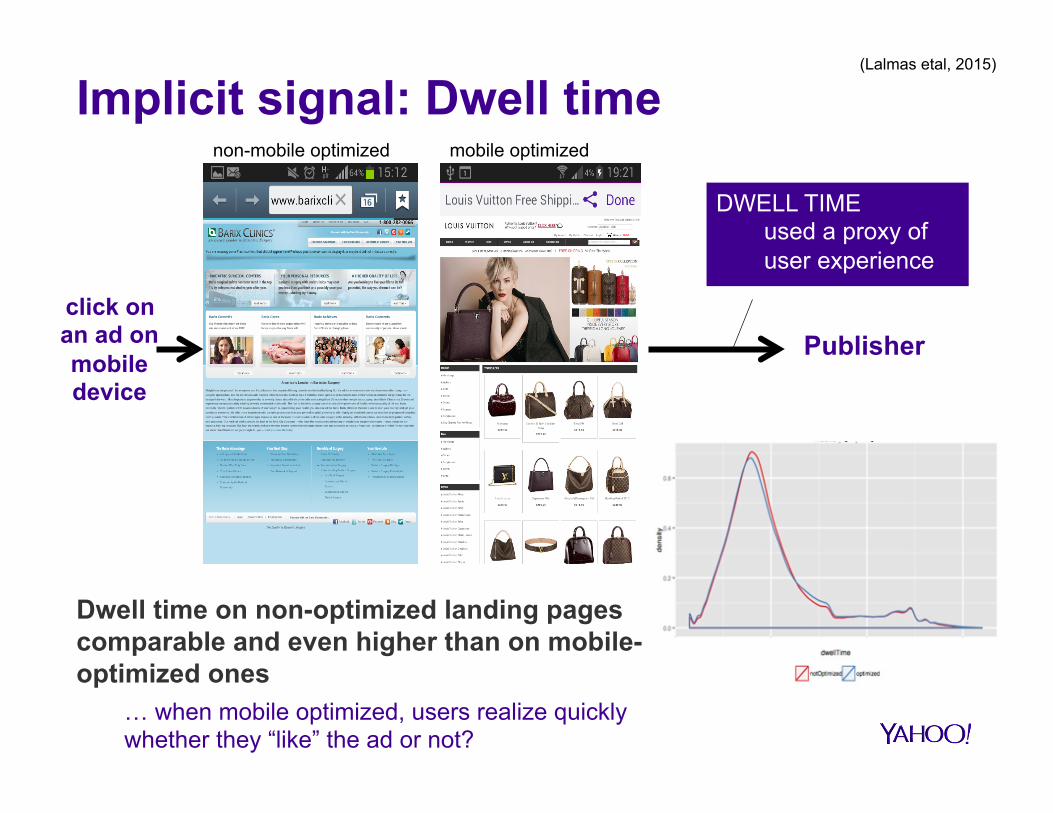
Implicit signal: Dwell time
DWELL TIME used a proxy of user experience
Publisher click on an ad on mobile device
Dwell time on non-optimized landing pages comparable and even higher than on mobile-optimized ones
… when mobile optimized, users realize quickly whether they “like” the ad or not?
(Lalmas etal, 2015)
non-mobile optimized mobile optimized

User engagement

What is user engagement?
“User engagement is a quality of the user experience that emphasizes the phenomena associated with wanting to use a technological resource longer and frequently” (Attfield et al, 2011)
26

Characteristics of user engagement
Novelty (Webster & Ho, 1997; O’Brien,
2008)
Richness and control (Jacques et al, 1995; Webster &
Ho, 1997)
Aesthetics (Jacques et al, 1995; O’Brien,
2008)
Endurability (Read, MacFarlane, & Casey,
2002; O’Brien, 2008)
Focused attention (Webster & Ho, 1997; O’Brien,
2008)
Reputation, trust and expectation
(Attfield et al, 2011)
Positive Affect (O’Brien & Toms, 2008)
Motivation, interests, incentives, and benefits
(Jacques et al., 1995; O’Brien & Toms, 2008)
(O’Brien, Lalmas & Yom-Tov, 2014)

Measuring user engagement Measures Attributes
Self-report Questionnaire, interview, think-aloud and think after protocols
Subjective Short- and long-term Lab and field Small scale
Physiology EEG, SCL, fMRI eye tracking mouse-tracking
Objective Short-term Lab and field Small and large scale
Analytics intra- and inter-session metrics data science
Objective Short- and long-term Field Large scale

Attributes of user engagement
§ Scale (small versus large) § Setting (laboratory versus field) § Objective versus subjective § Temporality (in-the-moment versus long-term)
What you want to optimize for
each task, session, query
What you want to optimize long-
term Mi LTVj

User engagement metrics

User engagement metrics
0-1 1-0.5 0.5Kendall’s tau with p-value < 0.05
('-' insignificant correlations)
High correlation between metrics in
same group
Low correlation between metrics in
different groups
[PO
P]
#U
se
rs
[PO
P]
#V
isits
[PO
P]
#C
licks
[AC
T]
Pa
ge
Vie
wsV
[AC
T]
Dw
ellT
ime
V
[LO
Y]
Active
Da
ys
[LO
Y]
Re
turn
Ra
te
#Users [POP] 0.82 0.75 - - 0.43 0.34
#Visits [POP] 0.82 0.85 - - 0.60 0.52
#Clicks [POP] 0.75 0.85 0.16 0.18 0.59 0.51
PageViewsV [ACT] - - 0.16 0.33 - -
DwellTimeV [ACT] - - 0.18 0.33 - -
ActiveDays [LOY] 0.43 0.60 0.59 - - 0.79
ReturnRate [LOY] 0.34 0.52 0.51 - - 0.79
0.69
(Lehmann etal, 2012)
in-the-moment
long-term

Online sites differ with respect to their engagement pattern
Games Users spend much time per visit
Search Users come frequently and do not stay long
Social media Users come frequently and stay long
Niche Users come on average once a week e.g. weekly post
News Users come periodically, e.g. morning and evening
Service Users visit site, when needed, e.g. to renew subscription
(Lehmann etal, 2012)
in-the-moment: at each visit long-term: visit frequency

From intra- to inter-session evaluation

1. Search 2. Mobile advertising
happy users come back
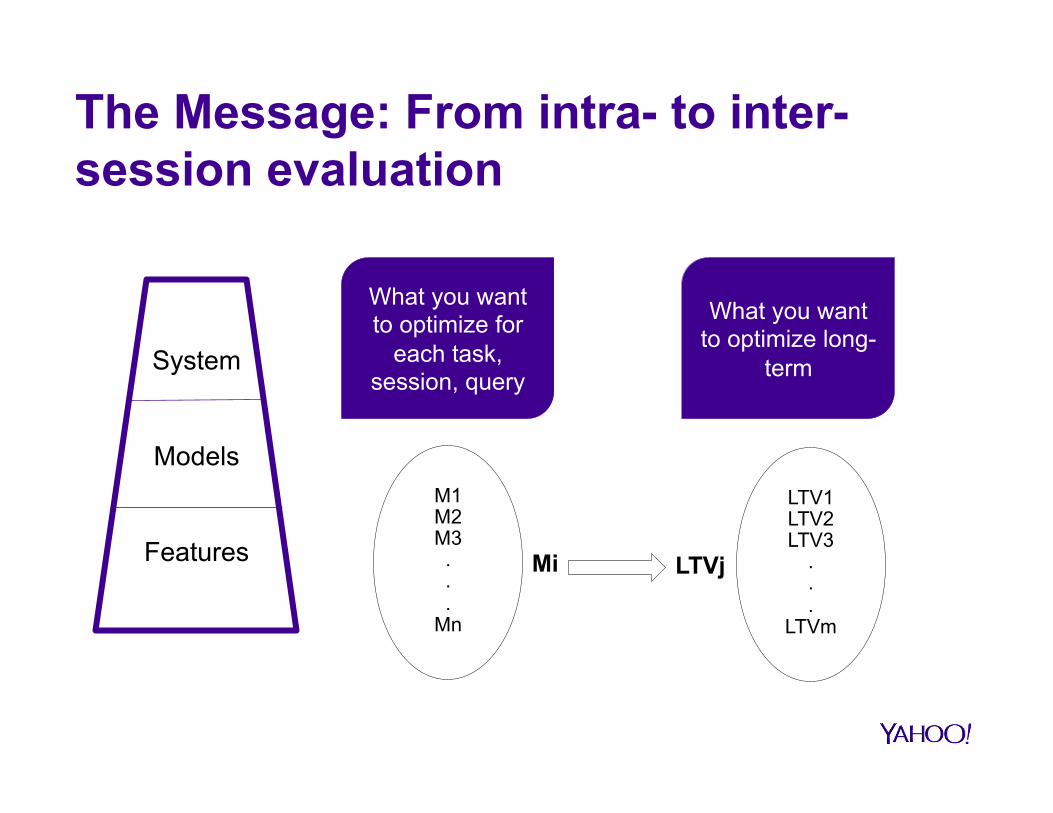
The Message: From intra- to inter-session evaluation
What you want to optimize for
each task, session, query
M1 M2 M3 . . .
Mn
LTV1 LTV2 LTV3
.
.
. LTVm
Mi LTVj
What you want to optimize long-
term System
Models
Features

Search
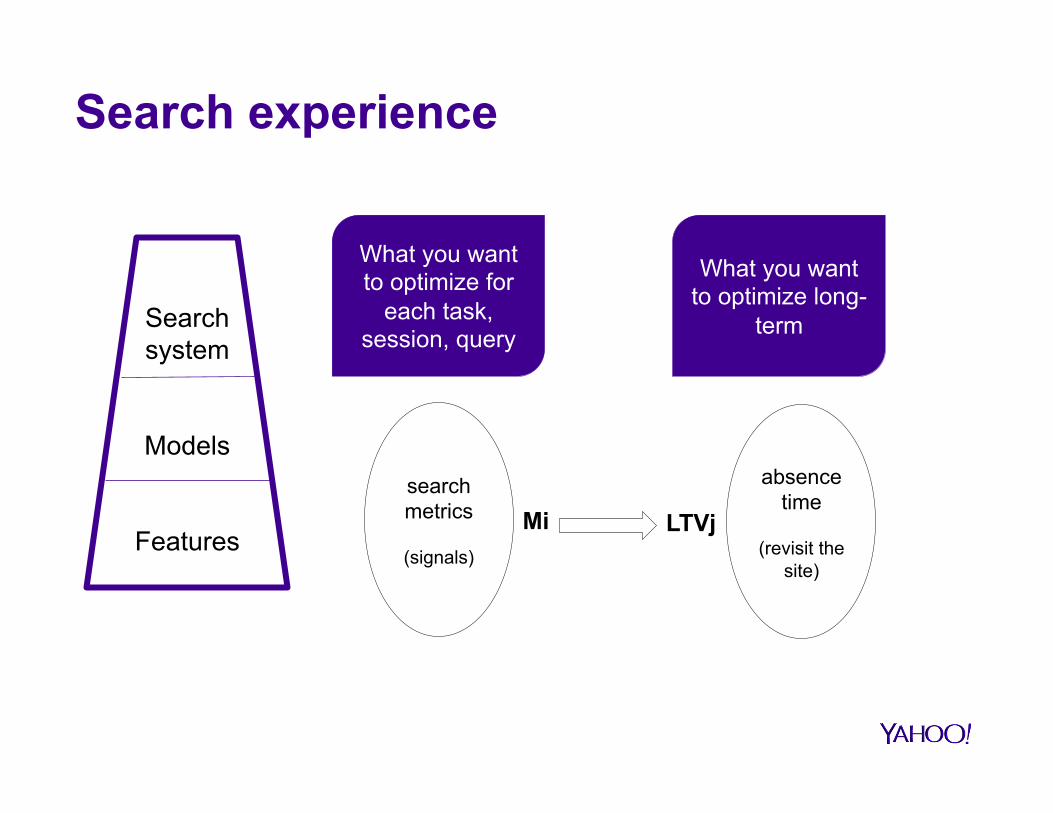
Search experience
What you want to optimize for
each task, session, query
search metrics
(signals)
absence time
(revisit the
site)
Mi LTVj
What you want to optimize long-
term Search system
Models
Features
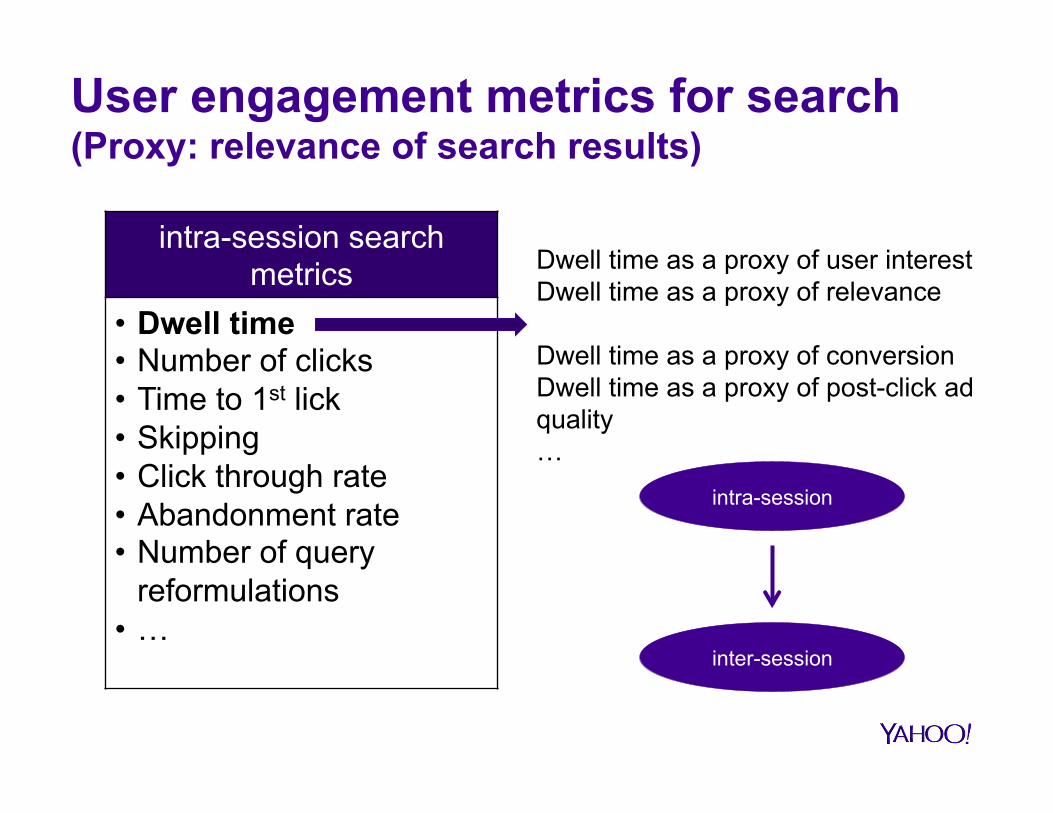
intra-session search metrics
• Dwell time • Number of clicks • Time to 1st lick • Skipping • Click through rate • Abandonment rate • Number of query
reformulations • …
Dwell time as a proxy of user interest Dwell time as a proxy of relevance Dwell time as a proxy of conversion Dwell time as a proxy of post-click ad quality …
User engagement metrics for search (Proxy: relevance of search results)
intra-session
inter-session
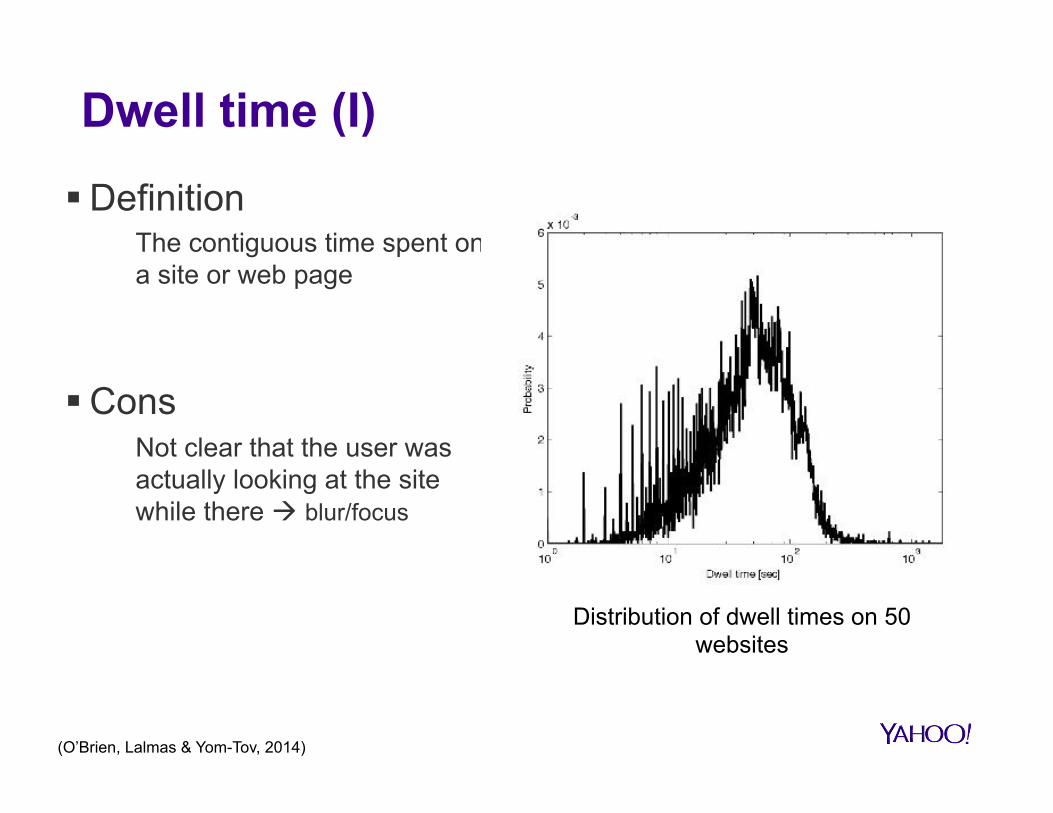
Dwell time (I)
§ Definition The contiguous time spent on a site or web page
§ Cons Not clear that the user was actually looking at the site while there à blur/focus
Distribution of dwell times on 50 websites
(O’Brien, Lalmas & Yom-Tov, 2014)
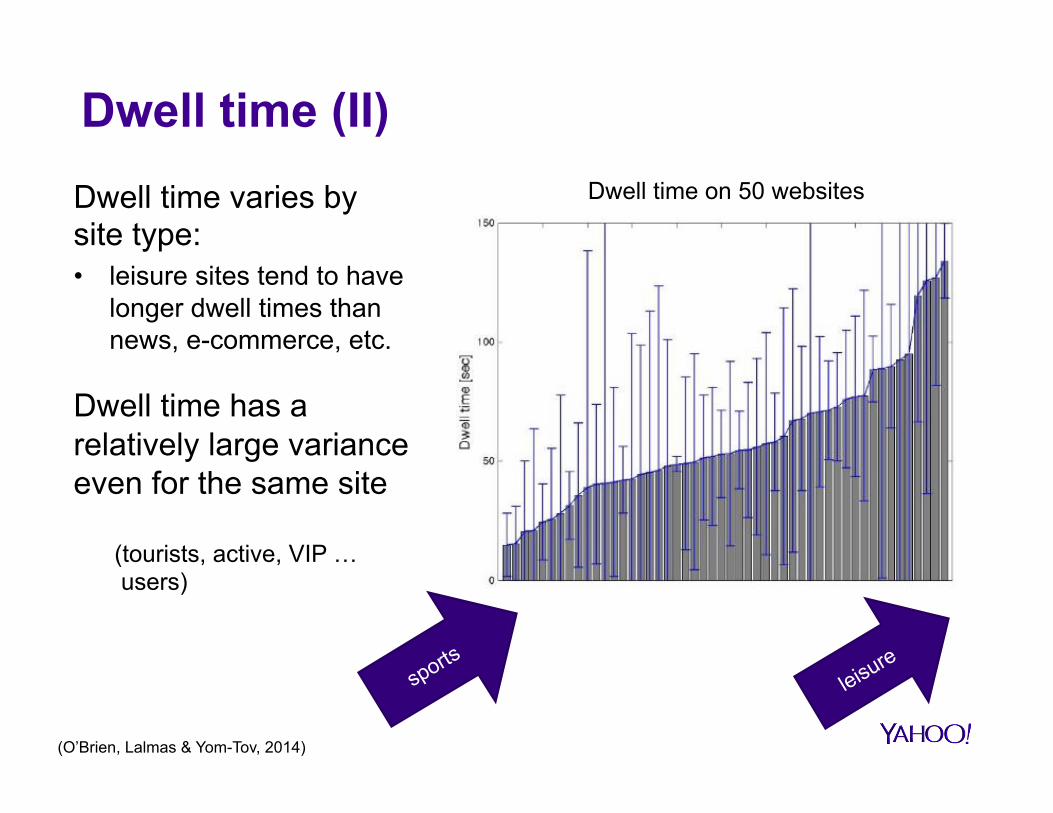
Dwell time (II) Dwell time varies by site type: • leisure sites tend to have
longer dwell times than news, e-commerce, etc.
Dwell time has a relatively large variance even for the same site
Dwell time on 50 websites
(tourists, active, VIP … users)
(O’Brien, Lalmas & Yom-Tov, 2014)

Search result page for “asparagus” (I)
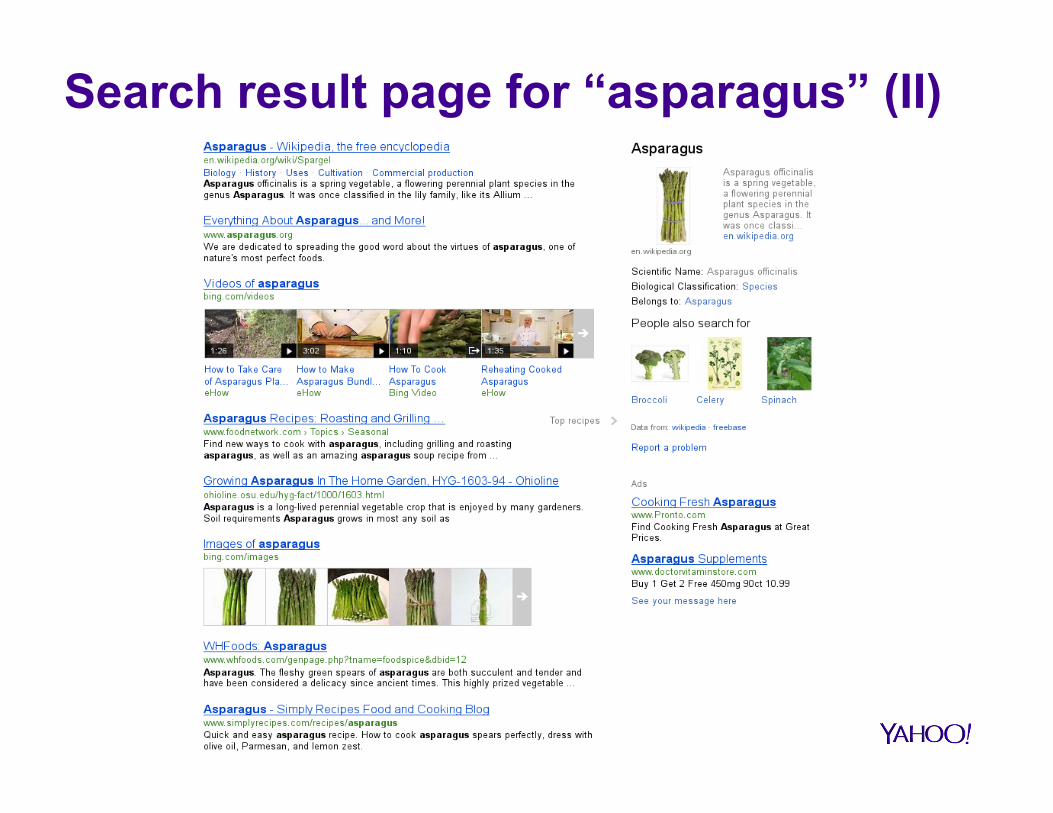
Search result page for “asparagus” (II)

Absence time and survival analysis
story 1story 2story 3story 4story 5story 6story 7story 8story 9
0 5 10 15 20
0.0
0.2
0.4
0.6
0.8
1.0
Users (%) who did come back
Users (%) who read story 2 but did not come back after 10 hours
SURVIVE
DIE
DIE = RETURN TO SITE èSHORT ABSENCE TIME
hours
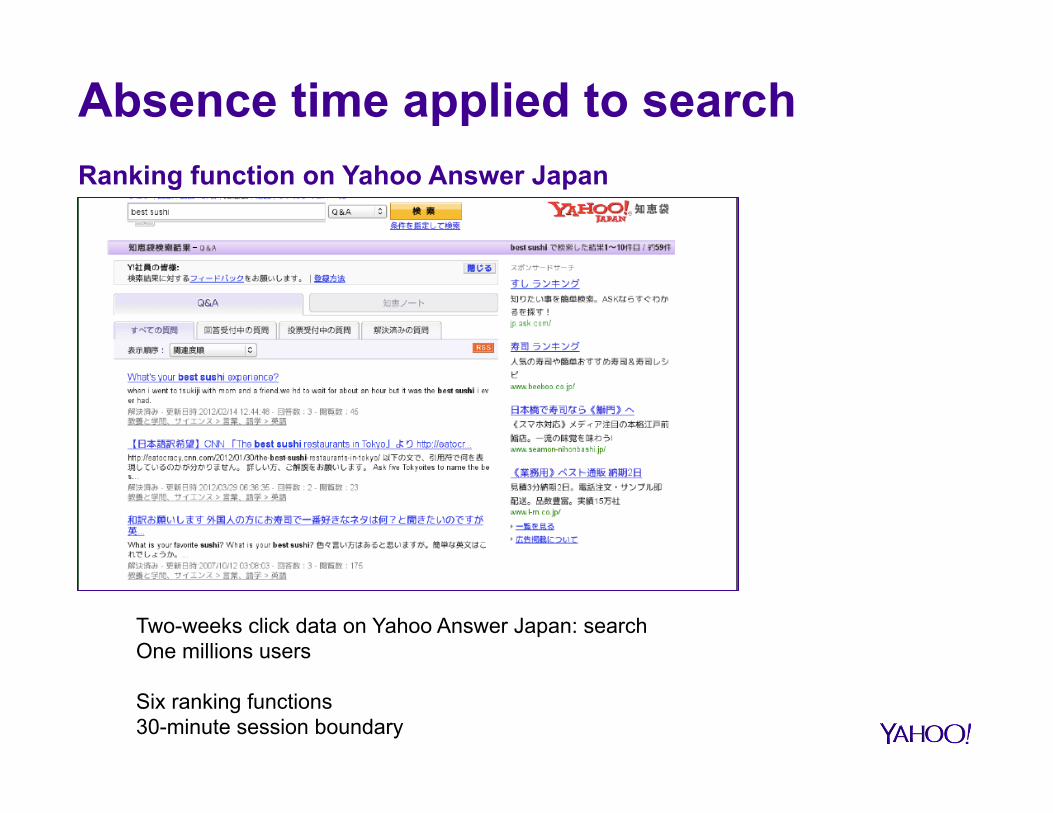
Absence time applied to search Ranking function on Yahoo Answer Japan
Two-weeks click data on Yahoo Answer Japan: search One millions users Six ranking functions 30-minute session boundary

survival analysis: high hazard rate (die quickly) = short absence
5 clicks
cont
rol =
no
clic
k
Absence time and number of clicks on search result page
3 clicks
§ No click means a bad user experience § Clicking between 3-5 results leads to same user experience § Clicking on more than 5 results reflects poorer user experience; users cannot
find what they are looking for (Dupret & Lalmas, 2013)

Using DCG versus absence to evaluate five ranking functions
DCG@1 Ranking Alg 1 Ranking Alg 2 Ranking Alg 3 Ranking Alg 4 Ranking Alg 5
DCG@5 Ranking Alg 1 Ranking Alg 3 Ranking Alg 2 Ranking Alg 4 Ranking Alg 5
Absence time Ranking Alg 1 Ranking Alg 2 Ranking Alg 5 Ranking Alg 3 Ranking Alg 4
(Dupret & Lalmas, 2013)
Absence time and search experience
§ Clicking lower in the ranking (2nd, 3rd) suggests more careful choice from the user (compared to 1st)
§ Clicking at bottom is a sign of low quality overall ranking § Users finding their answers quickly (time to 1st click) return sooner to
the search application § Returning to the same search result page is a worse user experience
than reformulating the query
search session metrics à absence time
(Dupret & Lalmas, 2013)

Absence time – search experience
From 21 experiments carried out through A/B testing, using absence time agrees with 14 of them (which one is better)
(Chakraborty etal, 2014)
Positive signals • One more query in session • One more click in session • SAT clicks • Query reformulation
Negative signals • Abandoned session • Quick-back clicks
search session metrics à absence time

Native advertising
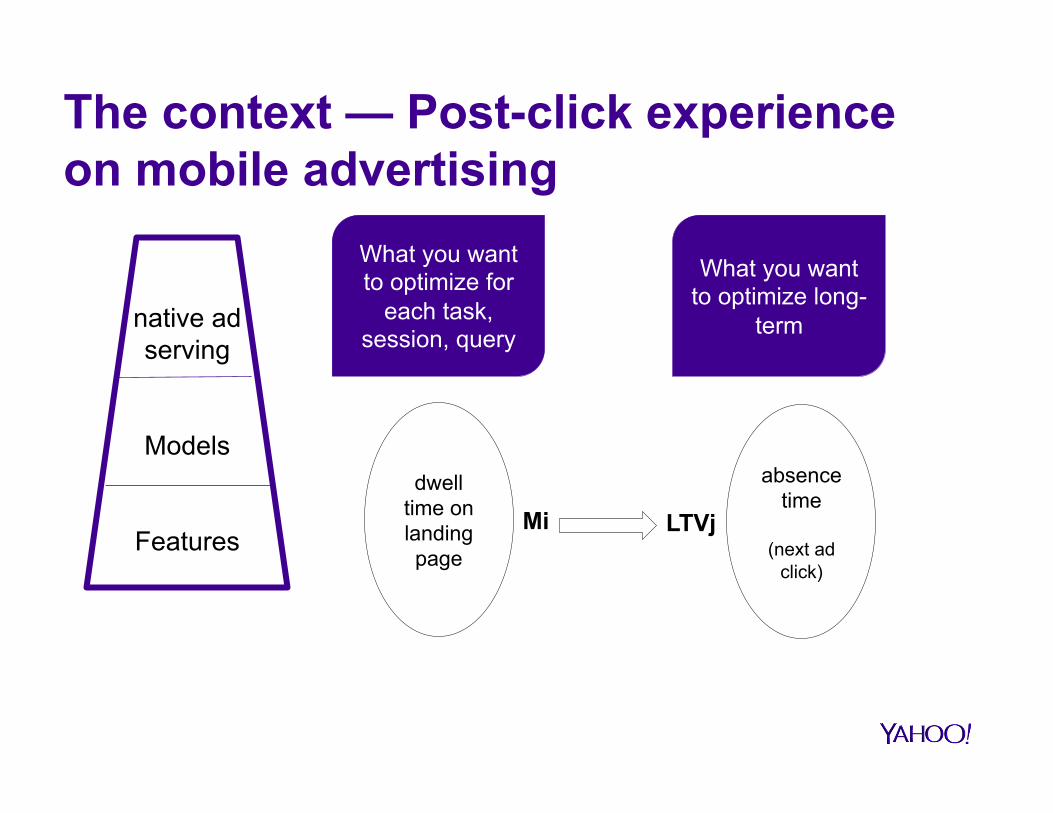
The context — Post-click experience on mobile advertising
What you want to optimize for
each task, session, query
dwell time on landing page
absence time
(next ad
click)
Mi LTVj
What you want to optimize long-
term native ad serving
Models
Features
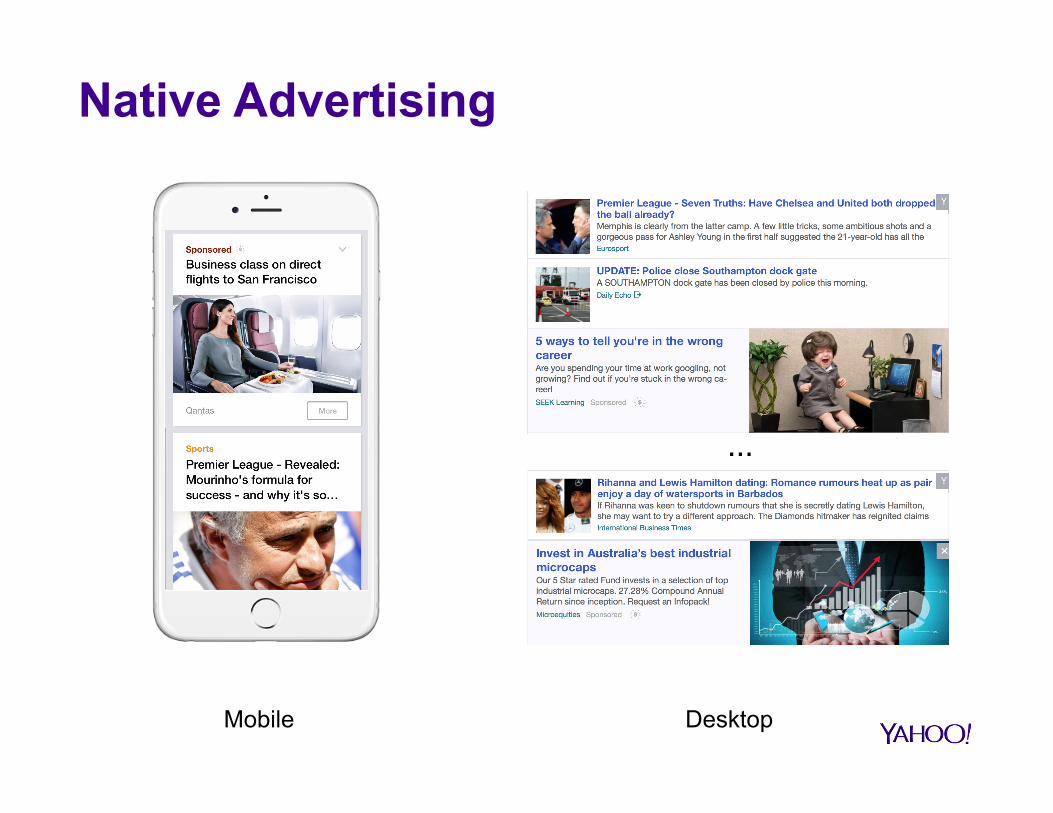
Native Advertising
…
Mobile Desktop
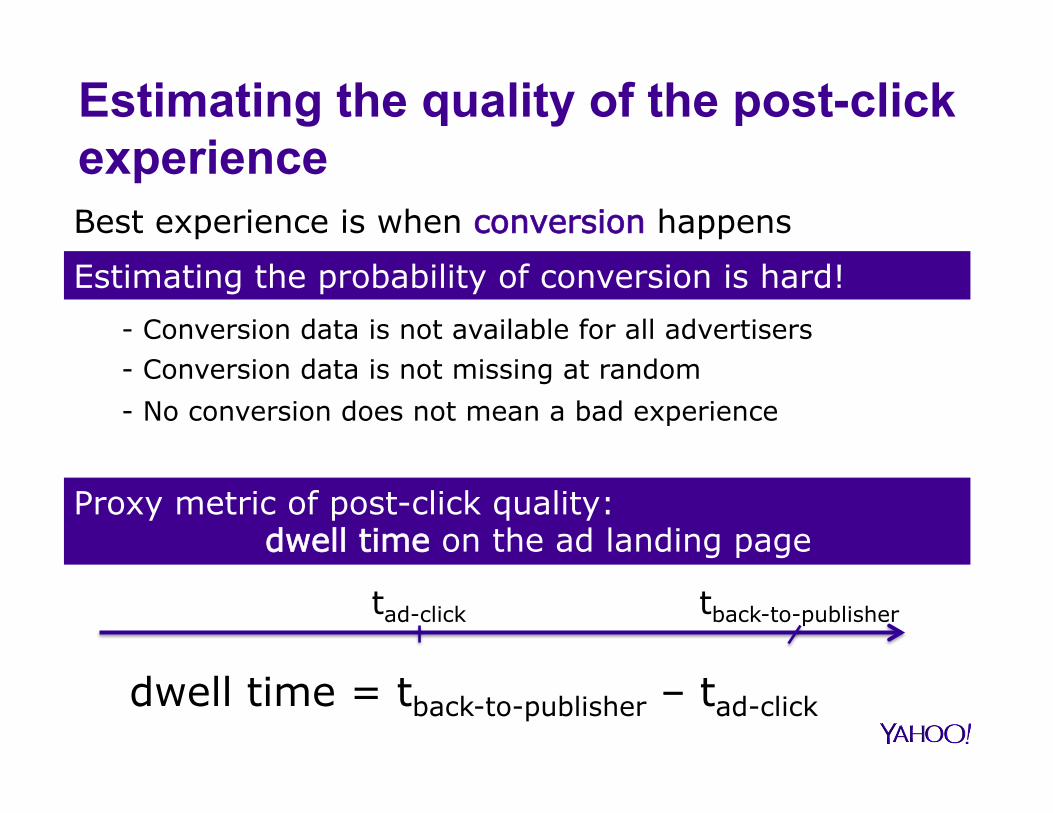
Estimating the quality of the post-click experience Best experience is when conversion happens
Estimating the probability of conversion is hard!
- Conversion data is not available for all advertisers - Conversion data is not missing at random
Proxy metric of post-click quality: dwell time on the ad landing page
- No conversion does not mean a bad experience
tad-click tback-to-publisher
dwell time = tback-to-publisher – tad-click
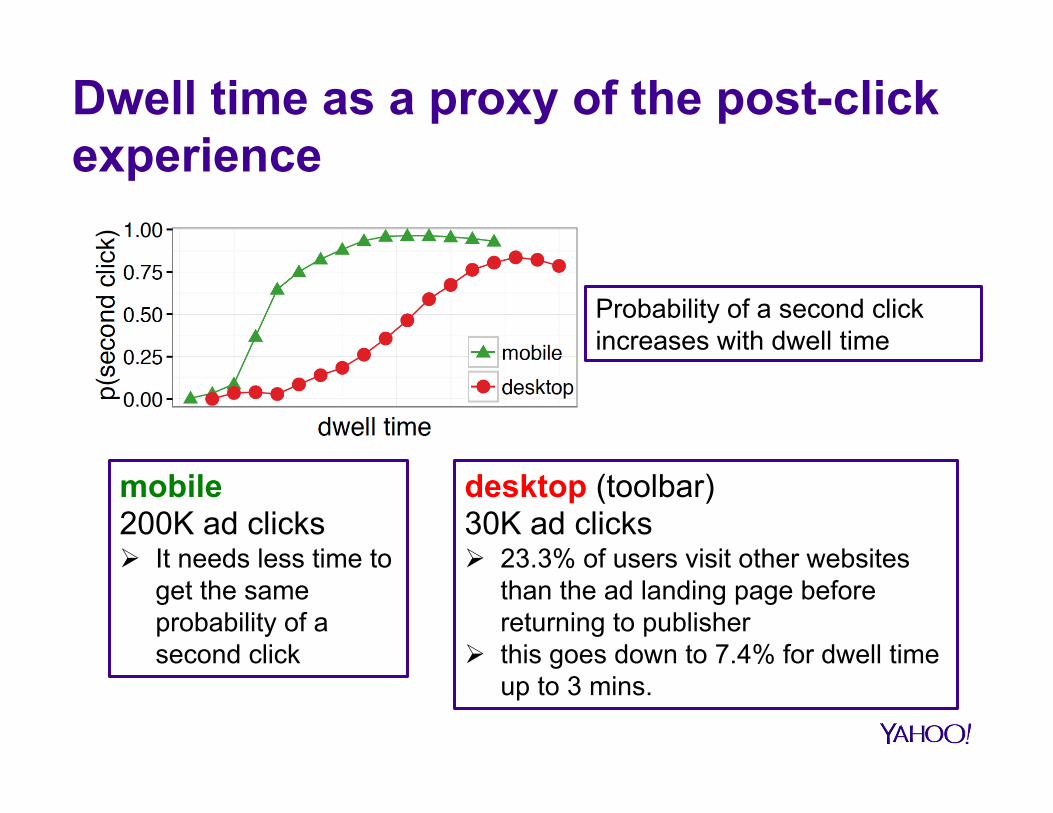
Dwell time as a proxy of the post-click experience
mobile 200K ad clicks Ø It needs less time to
get the same probability of a second click
desktop (toolbar) 30K ad clicks Ø 23.3% of users visit other websites
than the ad landing page before returning to publisher
Ø this goes down to 7.4% for dwell time up to 3 mins.
Probability of a second click increases with dwell time
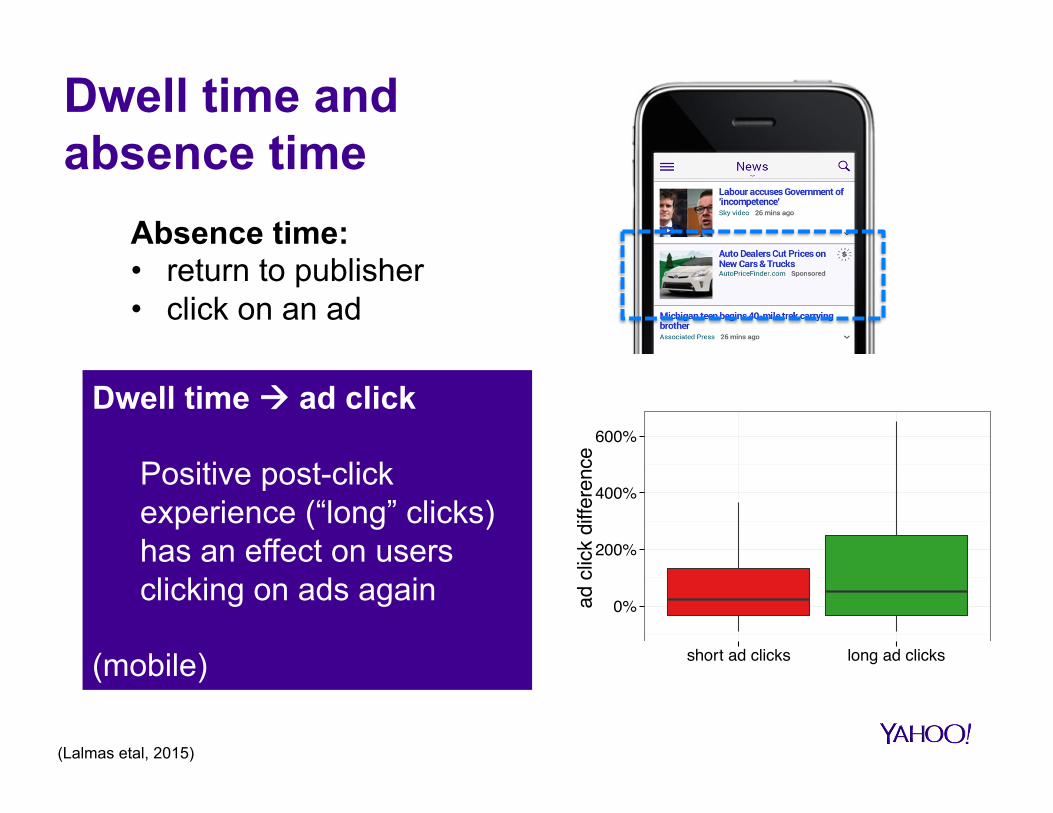
Dwell time and absence time
0%
200%
400%
600%
short ad clicks long ad clicks
ad c
lick
diffe
renc
e
Dwell time à ad click
Positive post-click experience (“long” clicks) has an effect on users clicking on ads again
(mobile)
(Lalmas etal, 2015)
Absence time: • return to publisher • click on an ad

From intra- to inter- session evaluation
Absence time 1. Search 2. Mobile advertising
happy users come back

What’s next?

Large-scale online measurement
Decide the in-the-moment
metric(s)
Decide the long-term-value metric(s)
System
Models
Features
Which in-the-moment metric(s)
are good predictor of long-
term value metric(s)
Optimize for the identified in-the-
moment metric(s)
Lots of data required to
remove noise
What is a signal?
What is a metric?

O’Brien & Toms User Engagement Scale 31-items and six sub-scales: aesthetic appeal, novelty, felt involvement, focused attention, perceived usability, endurability
(O’Brien & Toms, 2010; Arguello etal, 2012; Bordino etal, Under Review)
Small-scale measurement

Towards User Engagement
happy users come back
we need to properly identify
that a user is happy

Merci