Embed Size (px)
Citation preview

An introduction to system-oriented evaluation in Information Retrieval Mounia Lalmas

Outline o What to evaluate in IR o Test collection methodology
- Document, information need, query, relevance - TREC
o Precision and recall - Average precision, interpolated, mean average precision (MAP) - P@r, R-Precision, MRR - E and F measures
o Other measures (DCG, bpref) o Significance testing o Large-scale evaluation (web search & clicks) o Evaluating classifiers
2
Information Retrieval = IR IR vs. Search
Outline o What to evaluate in IR o Test collection methodology
- Document, information need, query, relevance - TREC
o Precision and recall - Average precision, interpolated, mean average precision (MAP) - P@r, R-Precision, MRR - E and F measures
o Other measures (DCG, bpref) o Significance testing o Large-scale evaluation (web search & clicks) o Evaluating classifiers
3
Information Retrieval = IR IR vs. Search

Evaluation in general versus evaluation in IR
o Evaluating a system in computer science is often concerned with time and space è system performance
o With large collections of documents, system performance is still very important
o However, in IR, we care a lot about retrieval performance: are the retrieved documents “relevant” to a “user information need”?
4
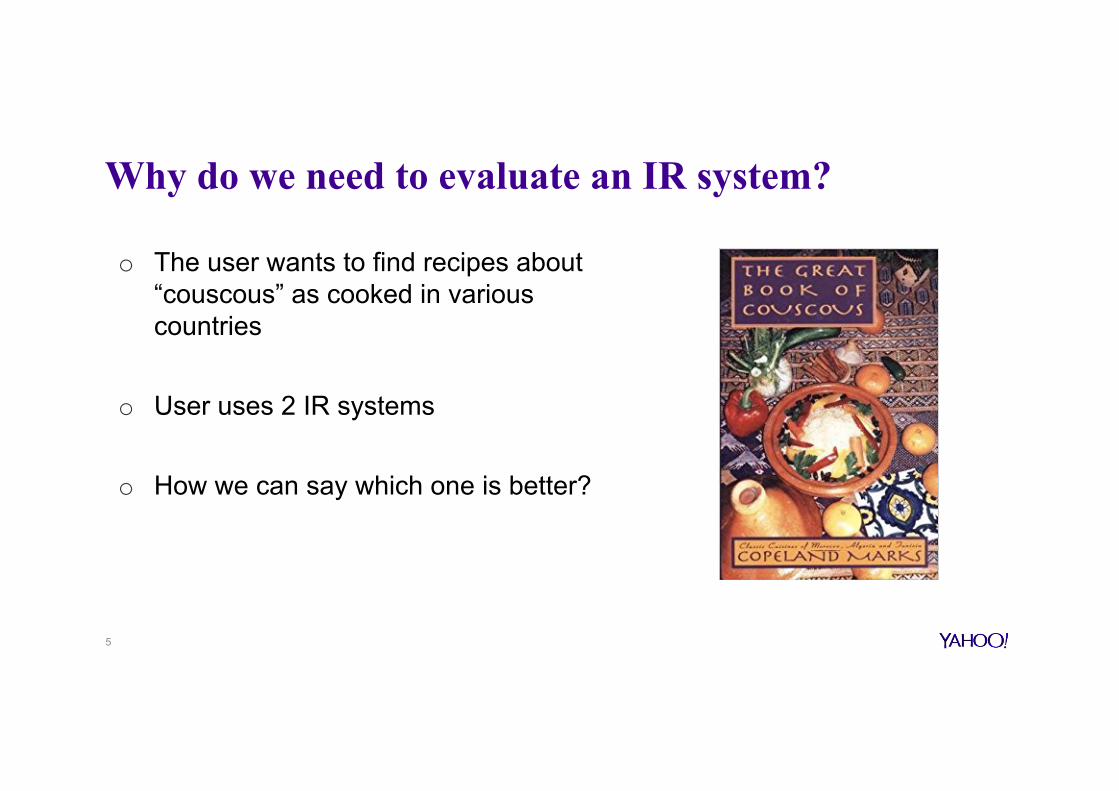
Why do we need to evaluate an IR system?
o The user wants to find recipes about “couscous” as cooked in various countries
o User uses 2 IR systems
o How we can say which one is better?
5
Acknowledgements
6
These slides were based on - Evaluation lecture @ QMUL; Thomas Roelleke & Mounia Lalmas - Lecture 8: Evaluation @ Stanford University; Pandu Nayak & Prabhakar Raghavan - Retrieval Evaluation @ University of Virginia; Hongnig Wang - Lectures 11 and 12 on Evaluation @ Berkeley; Ray Larson - Evaluation of Information Retrieval Systems @ Penn State University; Lee Giles
o Information Retrieval, 2nd edition, C.J. van Rijsbergen (1979) o Introduction to Information Retrieval, C.D. Manning, P. Raghavan & H. Schuetze (2008) o Modern Information Retrieval: The Concepts and Technology behind Search, 2nd edition; R.
Baeza-Yates & B. Ribeiro-Neto (2011)
What to evaluate in IR o coverage of the collection: extent to which the system includes
relevant material o time lag (efficiency): average interval between the time a query is
submitted and the answer is given o presentation of the output o effort involved by user in obtaining answers to a query o recall of the system: proportion of relevant documents retrieved o precision of the system: proportion of the retrieved documents that
are actually relevant
7

o coverage has to do with the quality of the collection o efficiency in terms of speed, memory usage, etc o presentation has to do with interface and visualisation
issues o effort has to do with user issues, e.g. user satisfaction.
o recall and precision have to do with retrieval effectiveness or effectiveness for short è system-oriented evaluation
8
What to evaluate in IR

System-oriented evaluation
o Measuring effectiveness has been the most predominant in IR evaluation
o Test collection methodology - Benchmark (dataset) upon which effectiveness is measured and compared - Dataset tells for a given query what are the relevant documents
o Metrics to measure effectiveness - Precision and recall, and variants - E and F measures - Others (DCG, bpref)
9
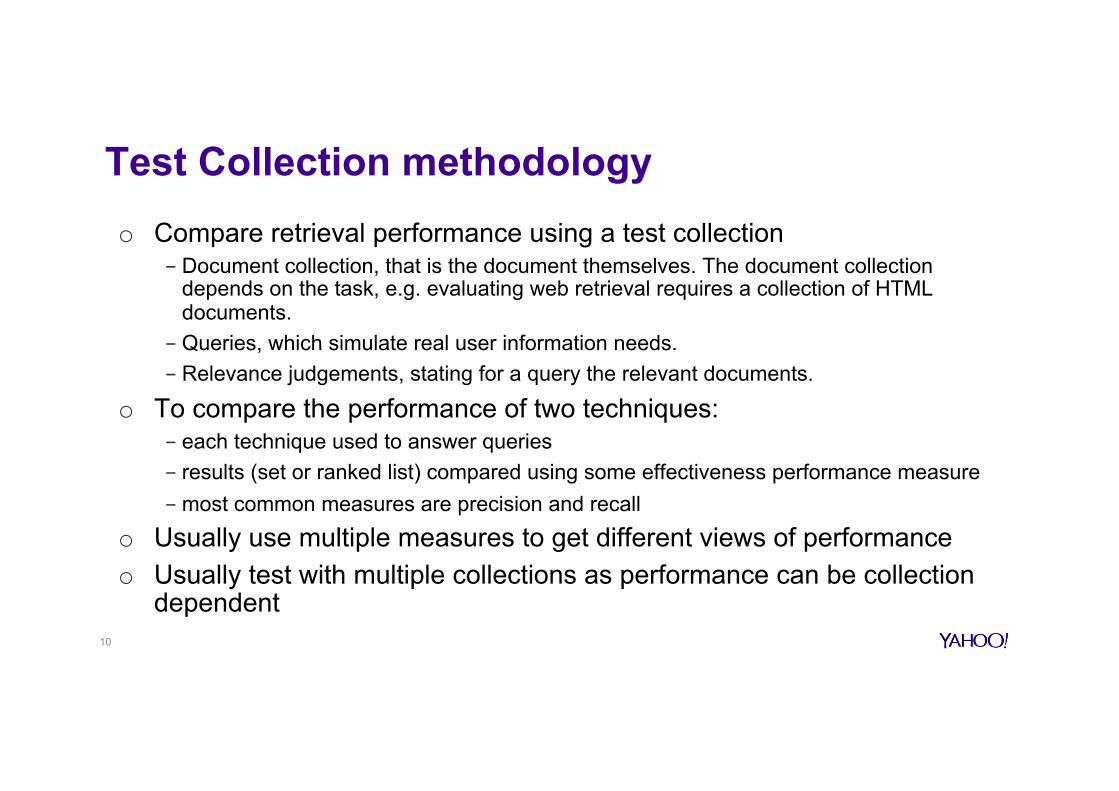
Test Collection methodology o Compare retrieval performance using a test collection
- Document collection, that is the document themselves. The document collection depends on the task, e.g. evaluating web retrieval requires a collection of HTML documents.
- Queries, which simulate real user information needs. - Relevance judgements, stating for a query the relevant documents.
o To compare the performance of two techniques: - each technique used to answer queries - results (set or ranked list) compared using some effectiveness performance measure - most common measures are precision and recall
o Usually use multiple measures to get different views of performance o Usually test with multiple collections as performance can be collection
dependent 10
Informa(onneed,queryandrelevance
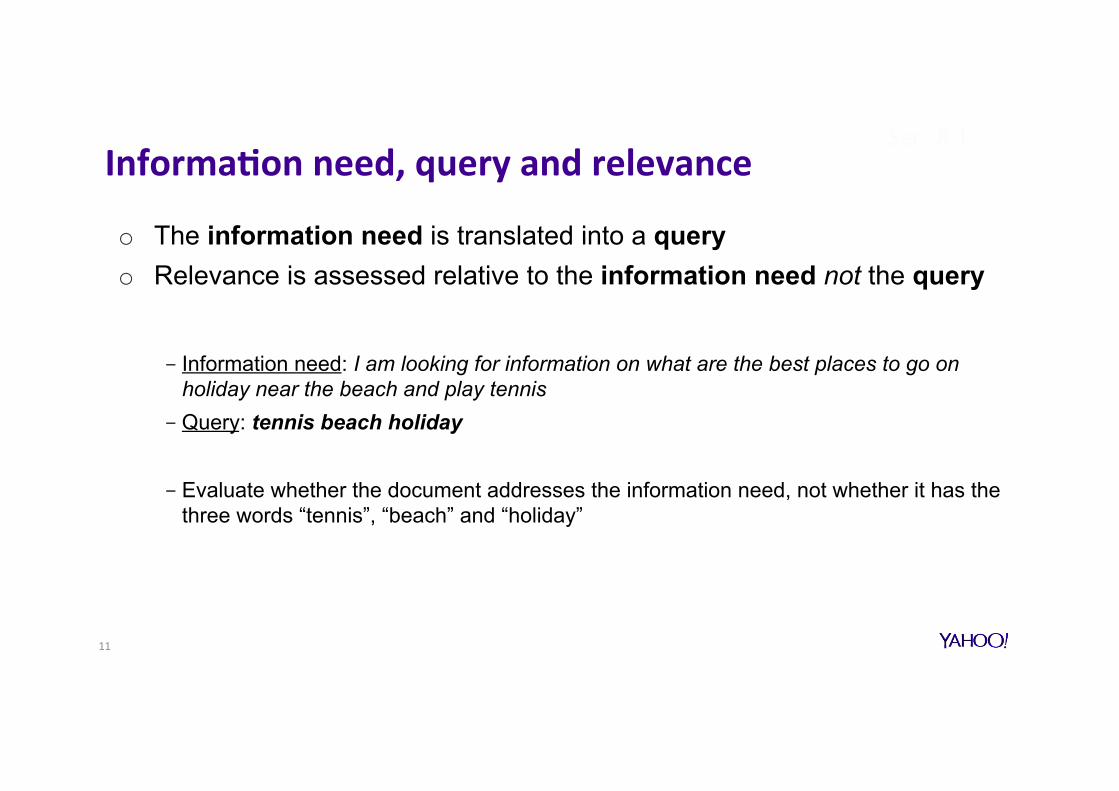
o The information need is translated into a query o Relevance is assessed relative to the information need not the query
- Information need: I am looking for information on what are the best places to go on holiday near the beach and play tennis
- Query: tennis beach holiday
- Evaluate whether the document addresses the information need, not whether it has the three words “tennis”, “beach” and “holiday”
Sec. 8.1
11

Relevance … as defined in system-oriented evaluation
o A document is relevant if it “has significant and demonstrable bearing on the matter at hand”.
o There are common assumptions about the nature of relevance in system-centred evaluation: - Objectivity: everybody agree on whether a document is relevant or not to a
query - Topicality: relevance is about whether the document is about the topic
expressed in the query - Binary nature: either a document is relevant or not - Independence: the fact that a document is relevant to a query has no effect
of the relevance of another document for that same query 12

Relevance is difficult to define satisfactorily o A document is relevant within the context of a query
- Who judges the relevance? è humans not very consistent (see next slide) - Is the document useful? è Utility - Judgment on whether a document is relevant or not depend on more than document
and query
o With real collections, we never know the full set of relevant documents
o Retrieval model incorporates notion of relevance - Satisfiability of a logical expression in Boolean model - P(relevance | query, document) in BIRM - Similarity to query in VSM - P(query generated | document model) in LM
13

Kappa measure for inter-judge relevance agreement o Kappa measure
- Agreement measure among judges (assessing document relevance) - Designed for categorical judgments (relevant or not)
o Kappa = [ P(A) – P(E) ] / [ 1 – P(E) ] o P(A) – proportion of time judges agree o P(E) – what agreement would be by chance o Kappa = 0 for chance agreement, 1 for total agreement
Sec. 8.5
14
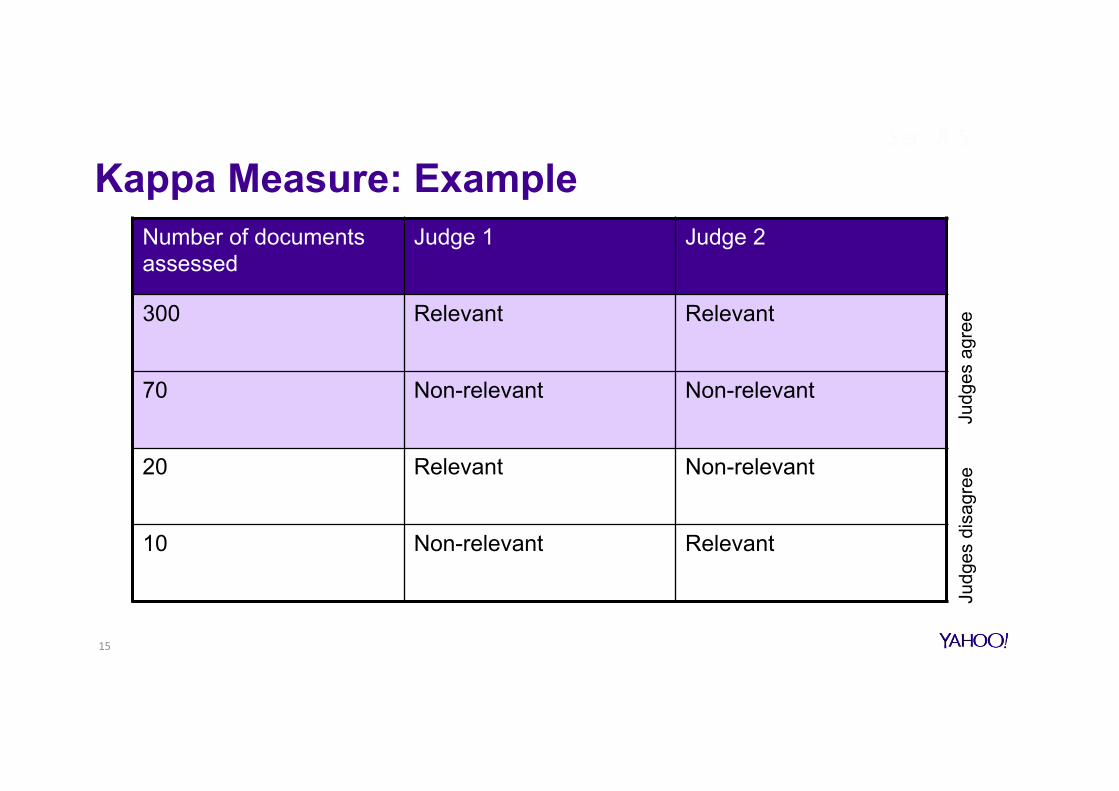
Kappa Measure: Example Number of documents assessed
Judge 1 Judge 2
300 Relevant Relevant
70 Non-relevant Non-relevant
20 Relevant Non-relevant
10 Non-relevant Relevant
Sec. 8.5
15
Judg
es a
gree
Ju
dges
dis
agre
e

Kappa measure: Example
P(A)=370/400=0.925P(non-relevant)=(10+20+70+70)/800=0.2125P(relevant)=(10+20+300+300)/800=0.7875P(E)=0.2125^2+0.7875^2=0.665Kappa=(0.925–0.665)/(1-0.665)=0.776
Kappa>0.8=goodagreement0.67<Kappa<0.8è“tentaGveconclusions” For>2judgesèaveragepairwisekappas
Sec. 8.5
16
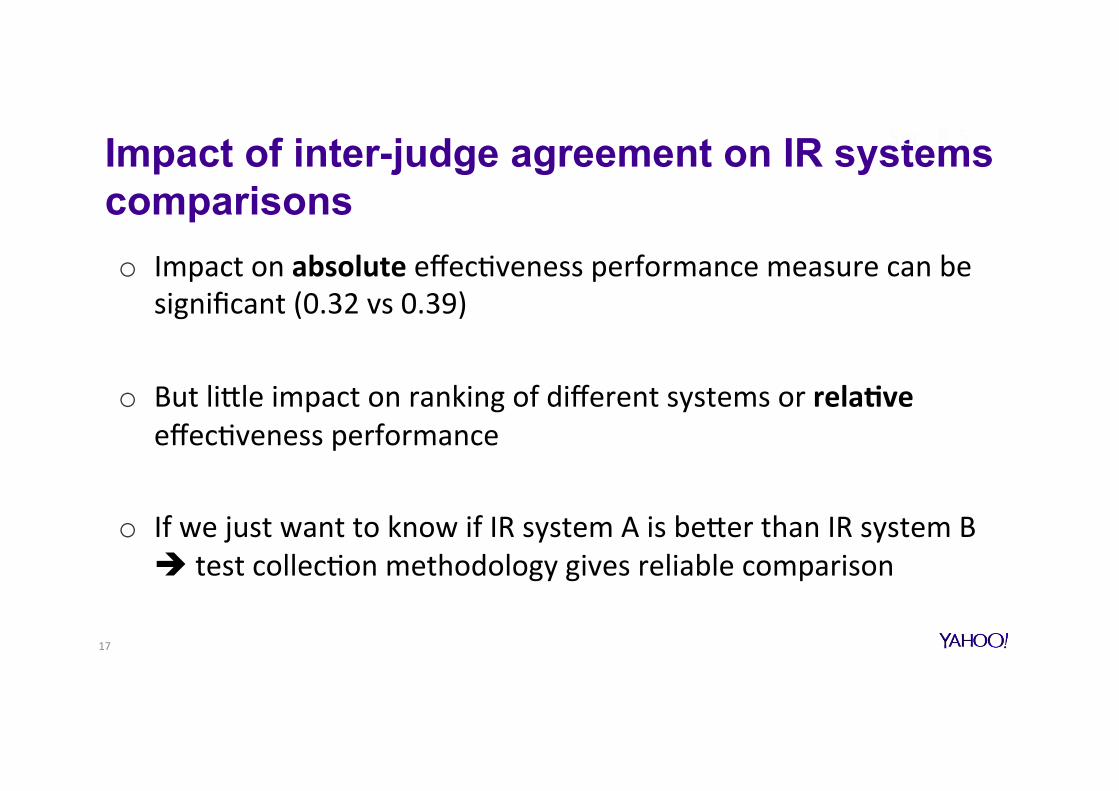
Impact of inter-judge agreement on IR systems comparisons o ImpactonabsoluteeffecGvenessperformancemeasurecanbe
significant(0.32vs0.39)
o ButliVleimpactonrankingofdifferentsystemsorrela(veeffecGvenessperformance
o IfwejustwanttoknowifIRsystemAisbeVerthanIRsystemBètestcollecGonmethodologygivesreliablecomparison
Sec. 8.5
17

Find the relevant documents in the collection o Did the IR system find all relevant document? o To answer accurately, we need complete judgments
- i.e., “yes,” “no,” or some score for every query-document pair
o For small test collections, we can review all documents for all queries
o Not practical for large or even medium-sized collection - TREC collections have millions of documents
o Pooling method o Click-based evaluation in web search (later in the lecture)
18
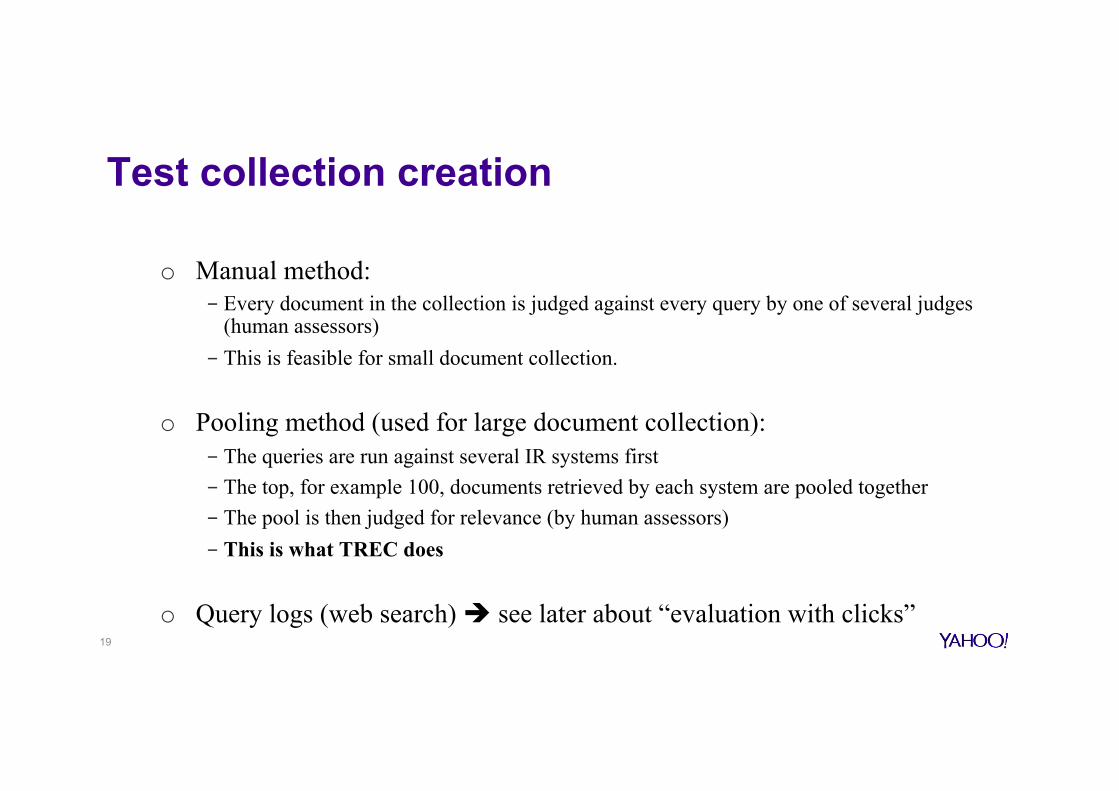
Test collection creation
o Manual method: - Every document in the collection is judged against every query by one of several judges
(human assessors) - This is feasible for small document collection.
o Pooling method (used for large document collection): - The queries are run against several IR systems first - The top, for example 100, documents retrieved by each system are pooled together - The pool is then judged for relevance (by human assessors) - This is what TREC does
o Query logs (web search) è see later about “evaluation with clicks” 19

Sample test collections (ad hoc retrieval)
Characteristics Cranfield CACM ISI West TREC2
Collection size (docs) 1400 3204 1460 11953 742611
Collection size (MB) 1.5 2.3 2.2 254 2162
Year created 1968 1983 1983 1990 1991
Unique stems 8226 5493 5448 196707 1040415
Stem occurrences 123200 117578 98304 21798833 243800000
Max within document frequency
27 27 1309
Mean document length (words)
88 36.5 67.3 1823 328
Number of queries 225 50 35 44 100
20
ad hoc retrieval: query, document, ranking
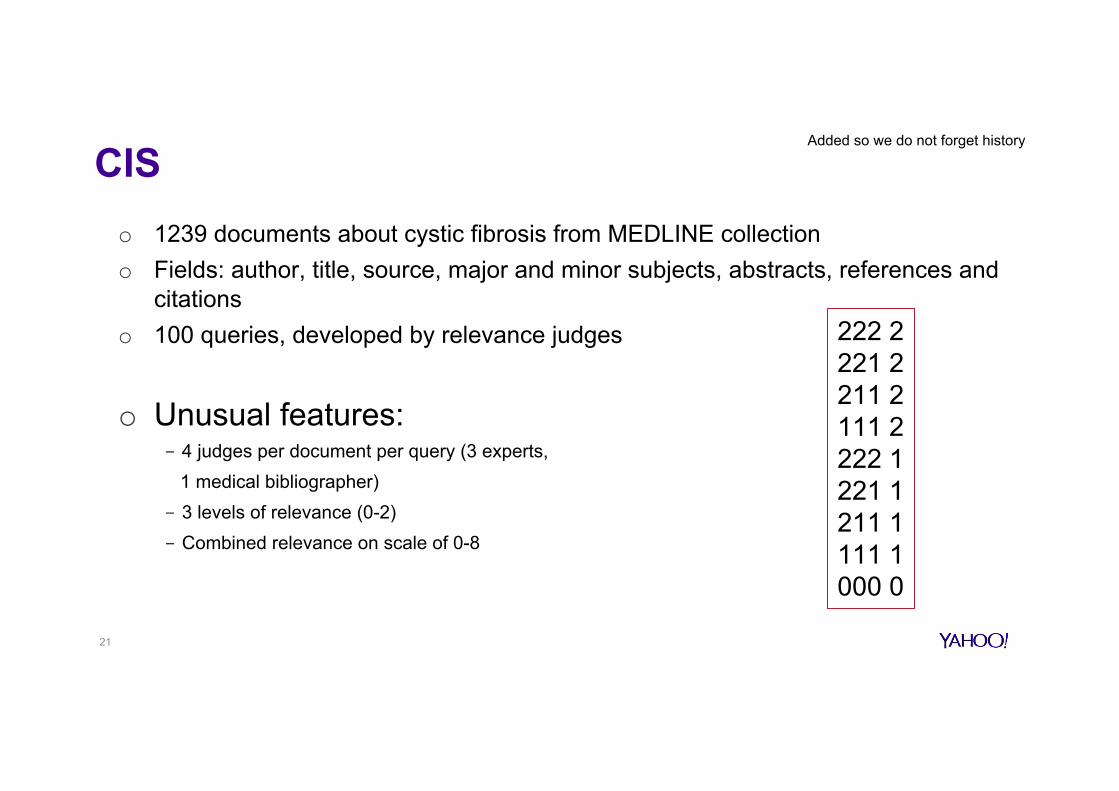
CIS o 1239 documents about cystic fibrosis from MEDLINE collection o Fields: author, title, source, major and minor subjects, abstracts, references and
citations o 100 queries, developed by relevance judges
o Unusual features: - 4 judges per document per query (3 experts, 1 medical bibliographer) - 3 levels of relevance (0-2) - Combined relevance on scale of 0-8
222 2 221 2 211 2 111 2 222 1 221 1 211 1 111 1 000 0
21
Added so we do not forget history
CACM o 3024 articles on computer science from CACM, 1958 - 1979 o Fields: author, date, word stems for titles and abstracts, categories, direct
referencing, bibliography coupling, number of co-citations for each pair of articles o 52 queries, each with 2 Boolean formulations
o Unusual features: - Citation links to other documents, so often used for hypertext-type
experiments
22
Added so we do not forget history
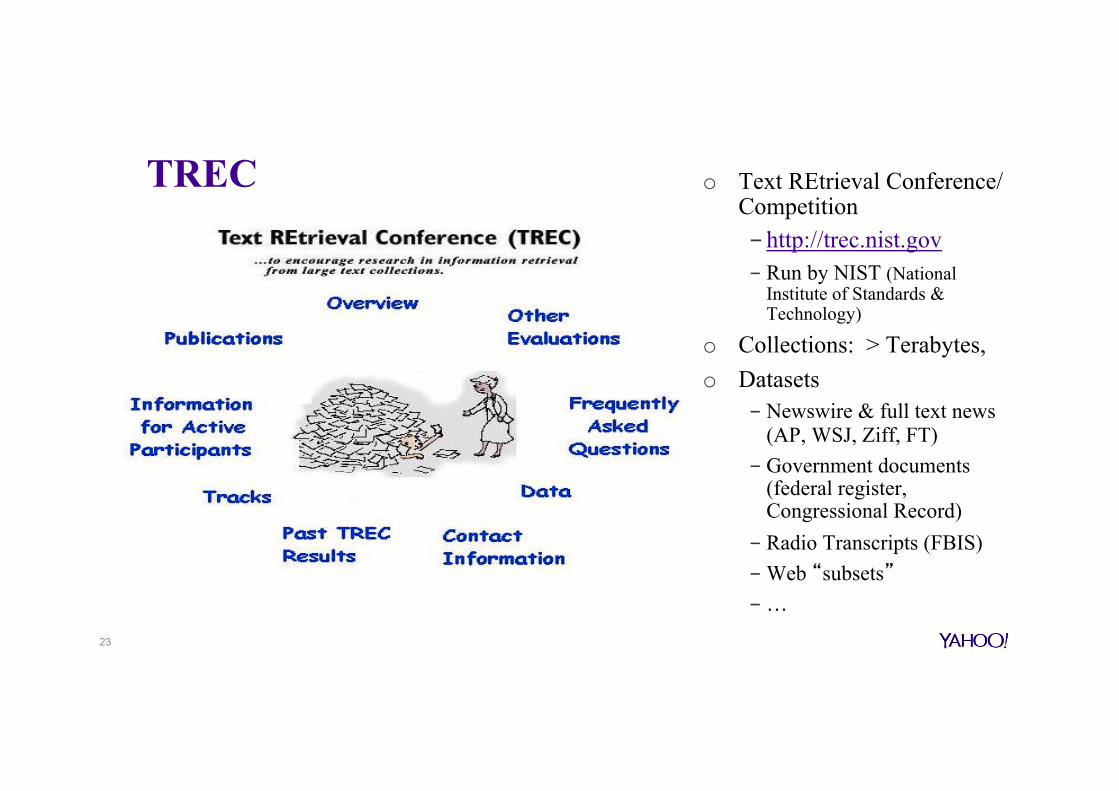
TREC o Text REtrieval Conference/Competition - http://trec.nist.gov - Run by NIST (National
Institute of Standards & Technology)
o Collections: > Terabytes, o Datasets
- Newswire & full text news (AP, WSJ, Ziff, FT)
- Government documents (federal register, Congressional Record)
- Radio Transcripts (FBIS) - Web “subsets” - …
23
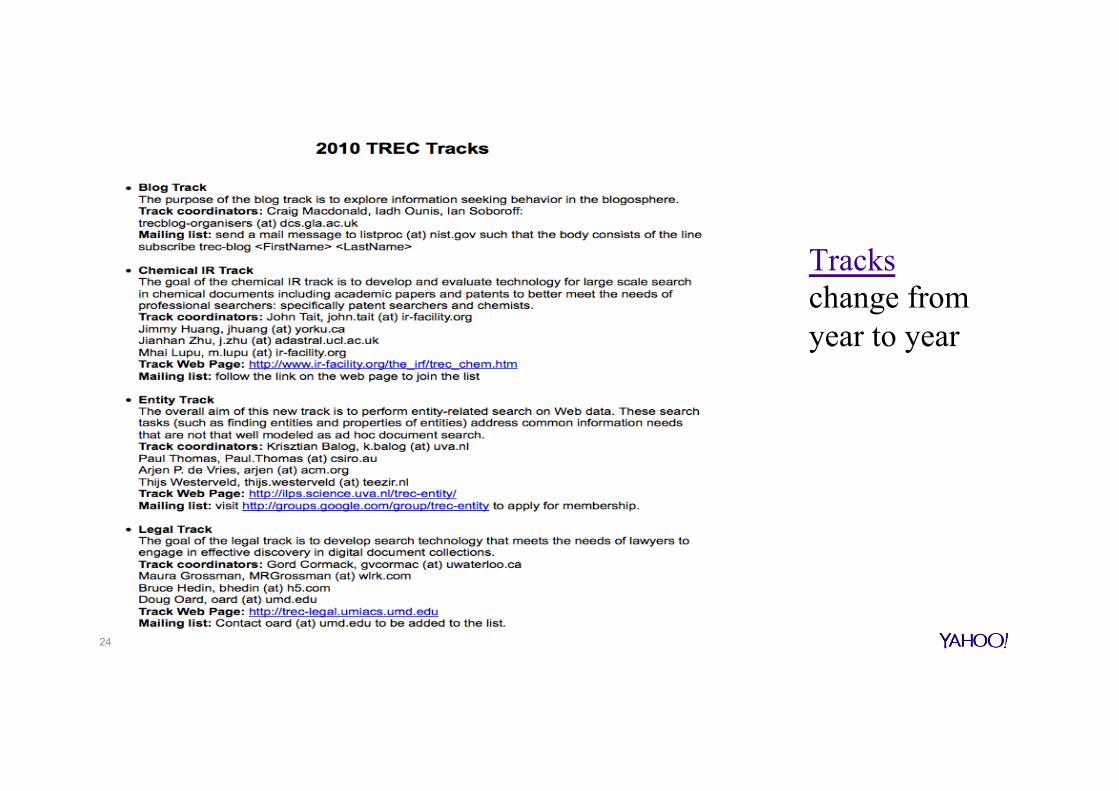
Tracks change from year to year
24
Queries & relevance judgments at TREC
o Queries devised and judged by “information specialists” èTREC Topics
o Relevance judgments done only for those documents retrieved and not entire collection! - E.g. merge top 100 retrieved documents from systems experimented
with (TREC participants) - Pooling method
25
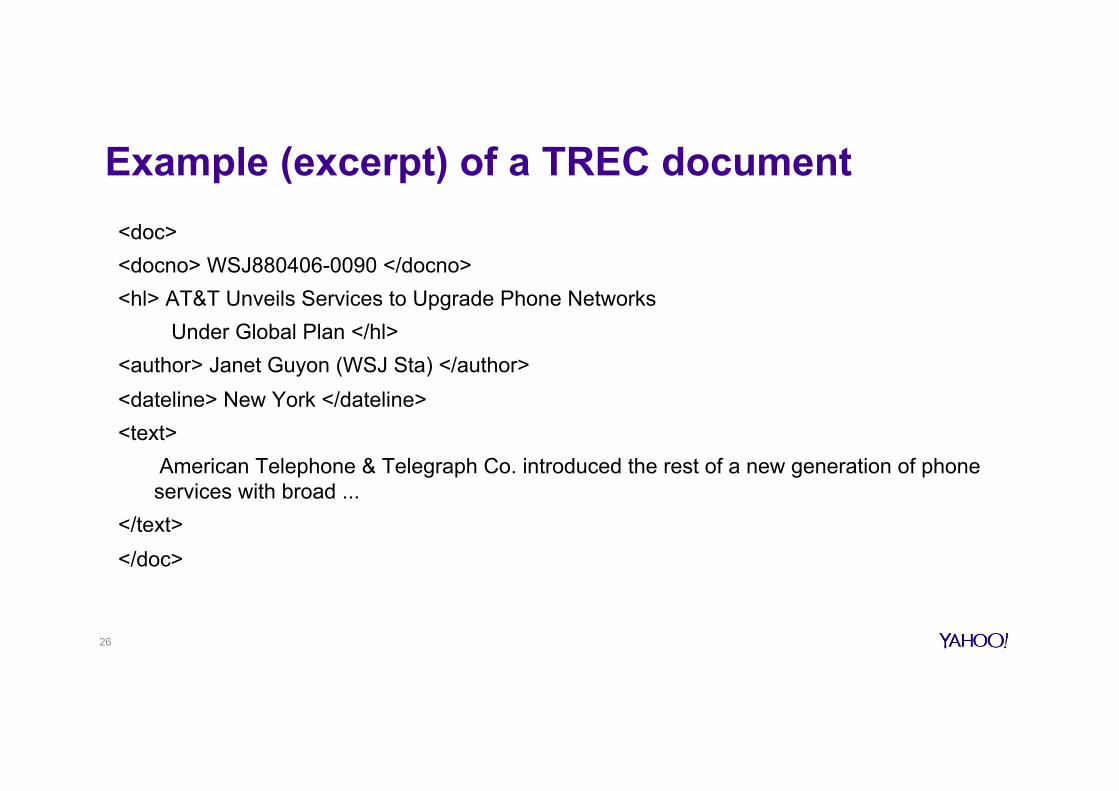
Example (excerpt) of a TREC document <doc> <docno> WSJ880406-0090 </docno> <hl> AT&T Unveils Services to Upgrade Phone Networks Under Global Plan </hl> <author> Janet Guyon (WSJ Sta) </author> <dateline> New York </dateline> <text> American Telephone & Telegraph Co. introduced the rest of a new generation of phone
services with broad ... </text> </doc>
26
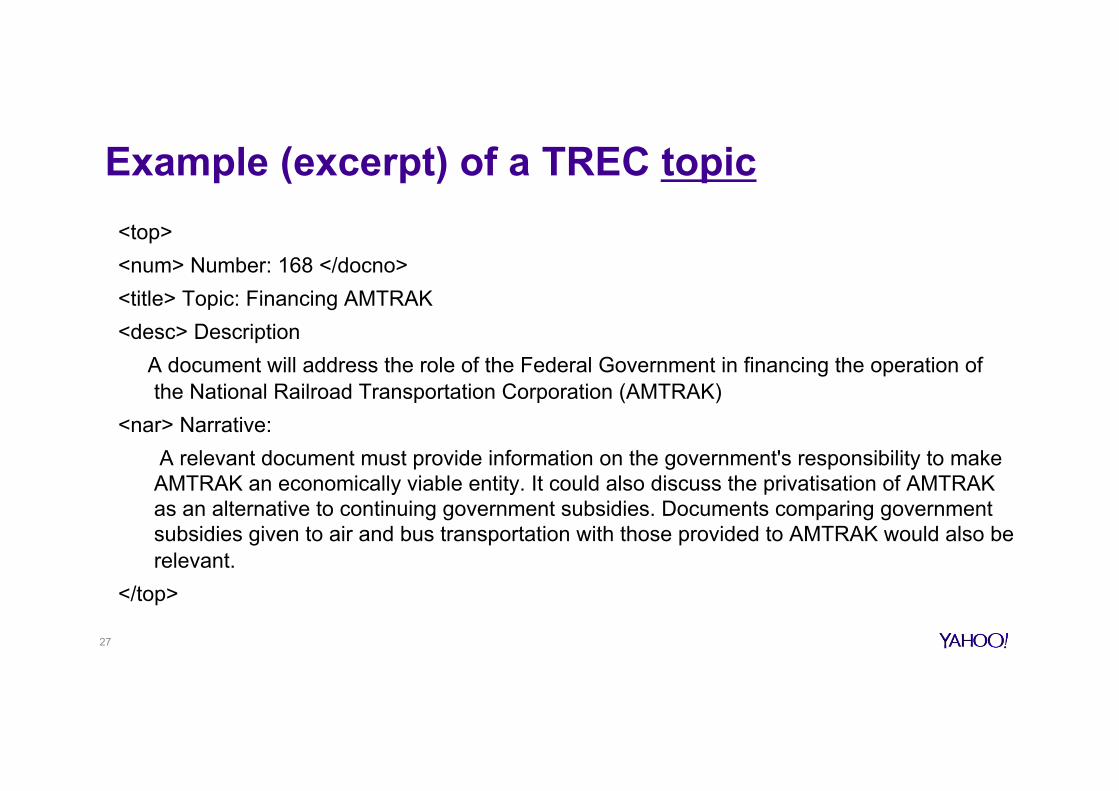
Example (excerpt) of a TREC topic <top> <num> Number: 168 </docno> <title> Topic: Financing AMTRAK <desc> Description A document will address the role of the Federal Government in financing the operation of
the National Railroad Transportation Corporation (AMTRAK) <nar> Narrative: A relevant document must provide information on the government's responsibility to make
AMTRAK an economically viable entity. It could also discuss the privatisation of AMTRAK as an alternative to continuing government subsidies. Documents comparing government subsidies given to air and bus transportation with those provided to AMTRAK would also be relevant.
</top>
27
TREC legacy o Pros:
- made research systems scale to large collections (pre-WWW) - allows for controlled comparisons
o Cons: - emphasis on high recall, often unrealistic for what most users want è but
recall-oriented search exist (patent retrieval, e-discovery)
- very long queries, unrealistic è systems optimized for long queries and hence perform worse for shorter, more realistic queries - focus on batch ranking (one-off result) rather than interaction (but session track
was introduced to evaluate a “user search session”)
28
Others evaluation forums
o CLEF (Cross-Language Evaluation Forum) o NCTIR (NII Testbeds and Community for Information access Research) o FIRE (Forum for Information Retrieval Evaluation) o INEX (The Initiative for the Evaluation of XML retrieval)
29
Effectiveness
o We recall that the goal of an IR system is to retrieve as many relevant documents as possible and as few non-relevant documents as possible.
o Evaluating the above consists of a comparative evaluation of technical performance of IR system(s): - In traditional IR, technical performance means the effectiveness of the IR
system: the ability of the IR system to retrieve relevant documents and suppress non-relevant documents - Effectiveness is measured by the combination of recall and precision
30
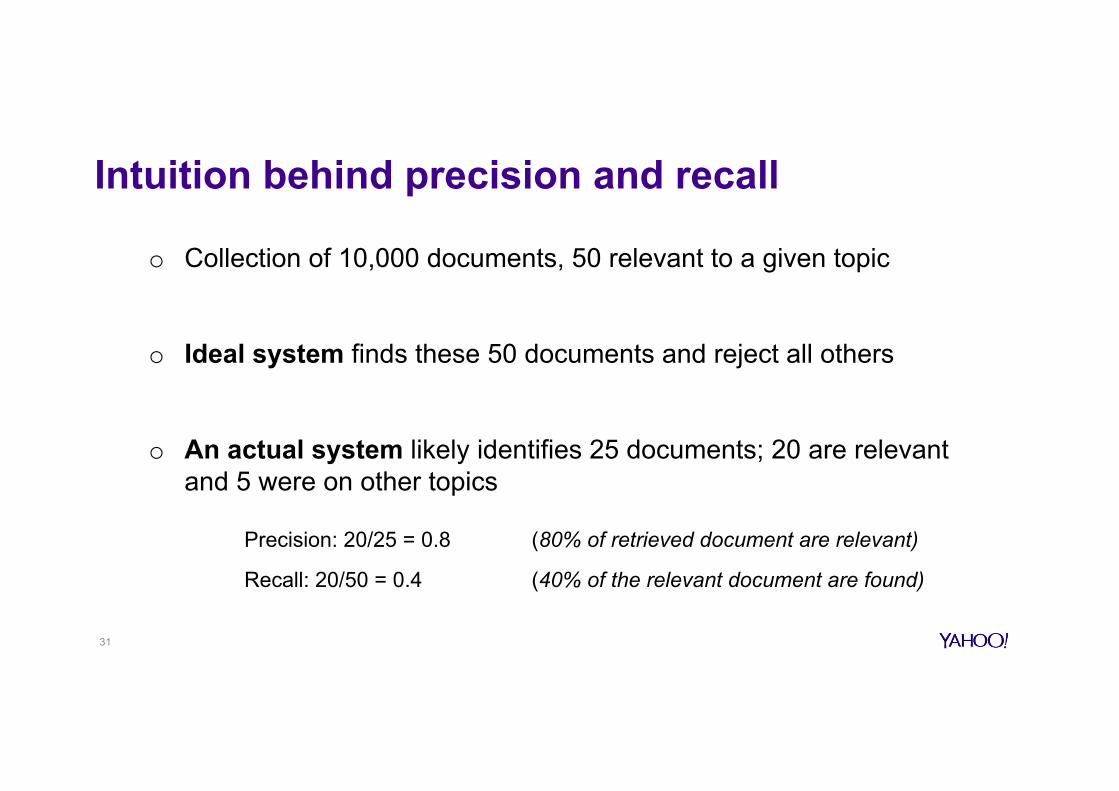
Intuition behind precision and recall
o Collection of 10,000 documents, 50 relevant to a given topic
o Ideal system finds these 50 documents and reject all others
o An actual system likely identifies 25 documents; 20 are relevant and 5 were on other topics
Precision: 20/25 = 0.8 (80% of retrieved document are relevant)
Recall: 20/50 = 0.4 (40% of the relevant document are found)
31
Measuring Precision and Recall Precision is easy to measure:
o Look at each document retrieved and decide whether it is relevant or not
o In previous example, only the 25 documents that are found need to be examined
Recall is difficult to measure:
o To know all relevant items, we must go through entire collection, looking at every document to decide if it is relevant or not
o In previous example, all 10,000 documents must be examined! è remember the pooling method at TREC
32
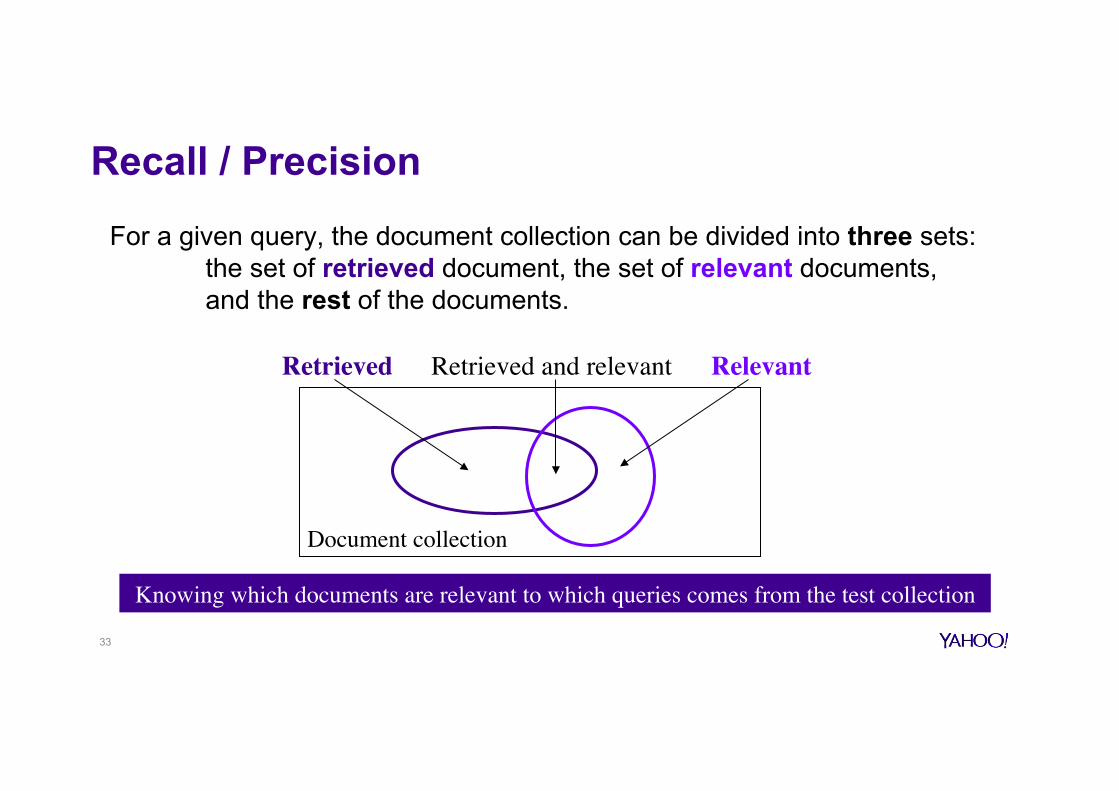
Recall / Precision
Document collection
Retrieved RelevantRetrieved and relevant
Knowing which documents are relevant to which queries comes from the test collection
For a given query, the document collection can be divided into three sets: the set of retrieved document, the set of relevant documents, and the rest of the documents.
33
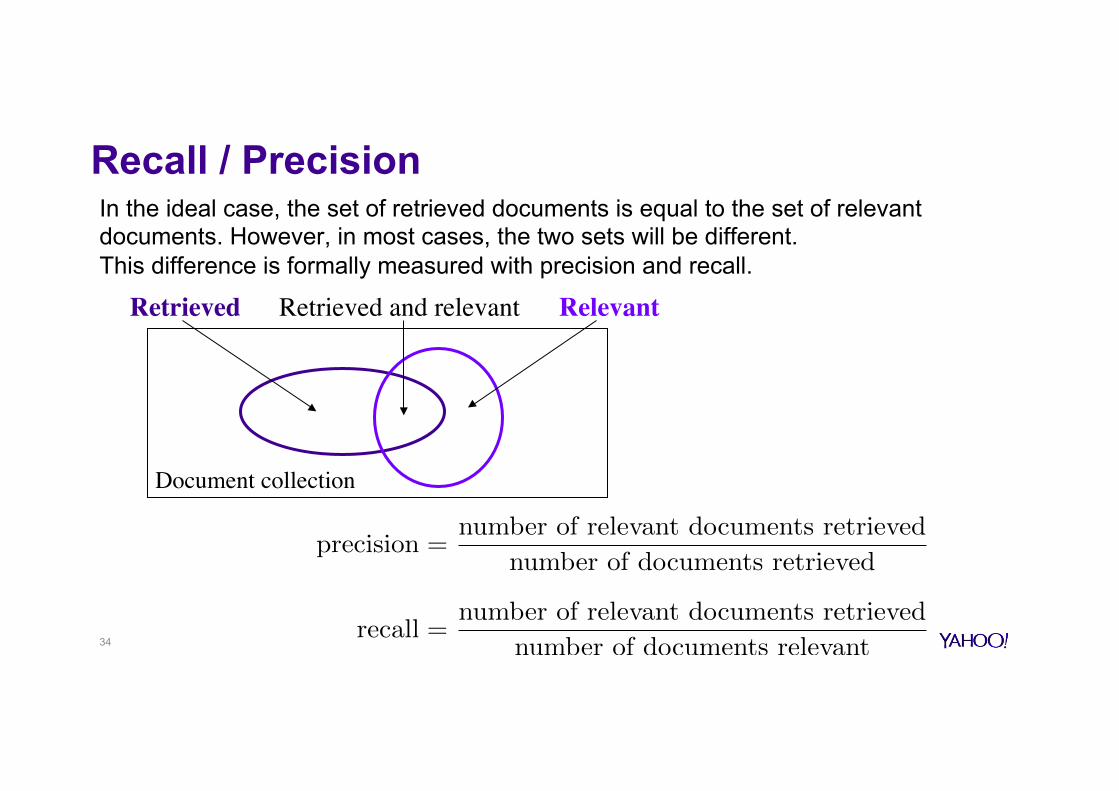
Recall / Precision In the ideal case, the set of retrieved documents is equal to the set of relevant documents. However, in most cases, the two sets will be different. This difference is formally measured with precision and recall.
34
Document collection
Retrieved RelevantRetrieved and relevant
precision =
number of relevant documents retrieved
number of documents retrieved
recall =
number of relevant documents retrieved
number of documents relevant
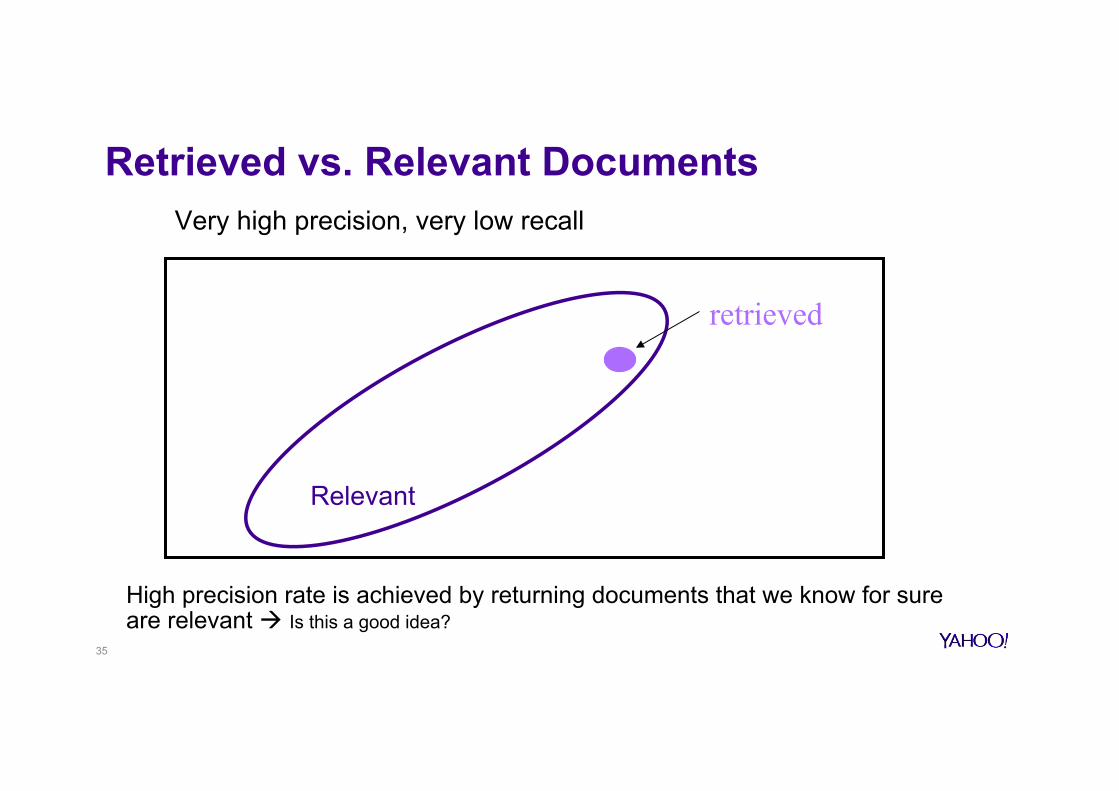
Retrieved vs. Relevant Documents
Relevant
Very high precision, very low recall
retrieved
35
High precision rate is achieved by returning documents that we know for sure are relevant à Is this a good idea?

Retrieved vs. Relevant Documents
Relevant
High recall, but low precision
retrieved
36
100% recall can be achieved by returning all documents in the collection à This is for sure a bad idea!
Retrieved vs. Relevant Documents
Relevant
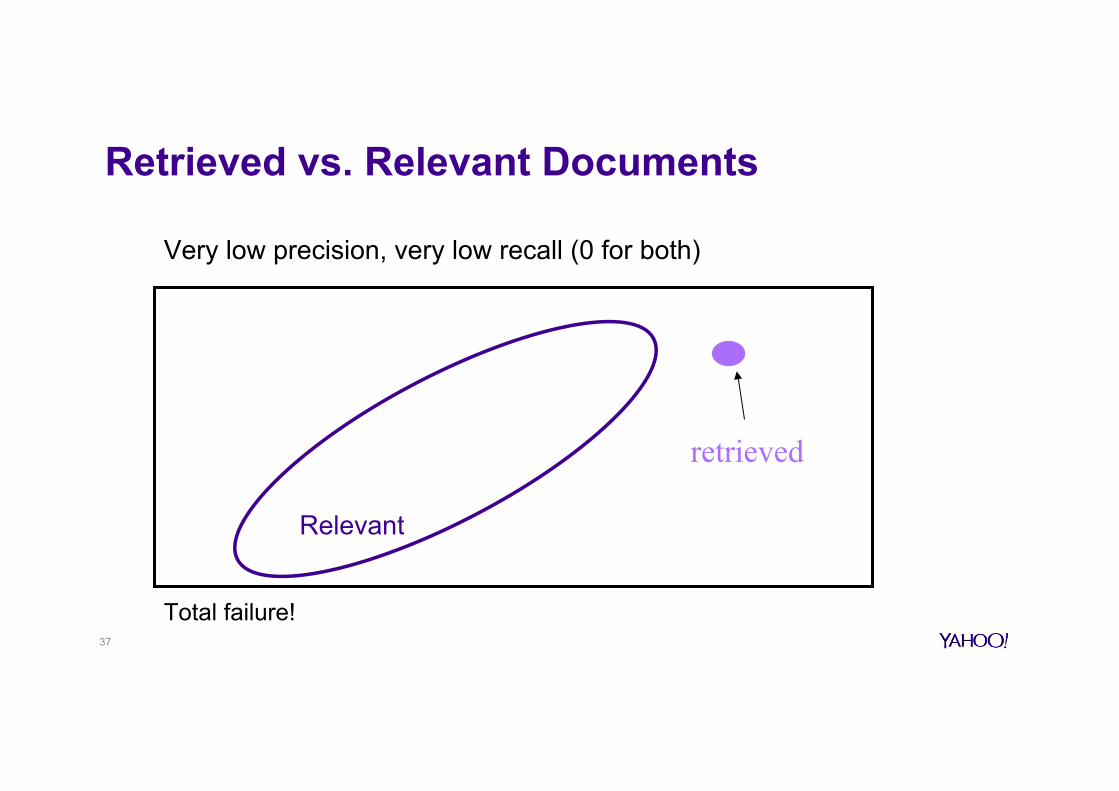
Very low precision, very low recall (0 for both)
retrieved
37
Total failure!
Retrieved vs. Relevant Documents
Relevant
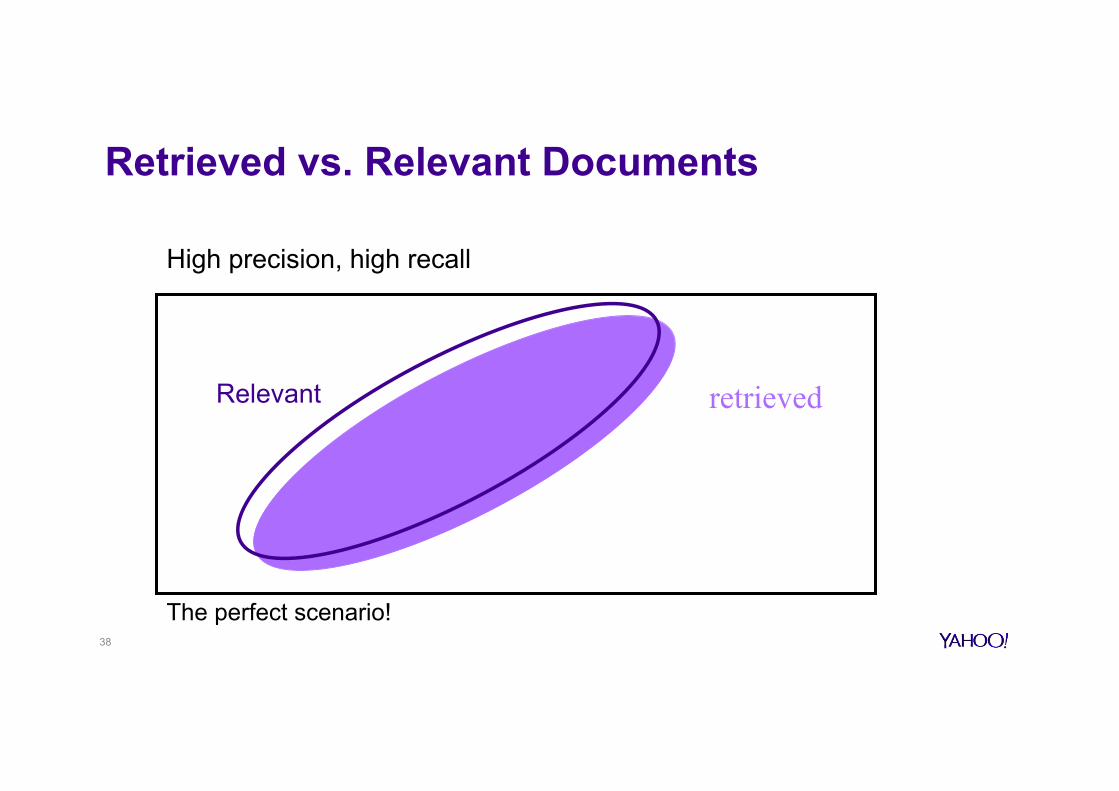
High precision, high recall
retrieved
38
The perfect scenario!
Recall and Precision
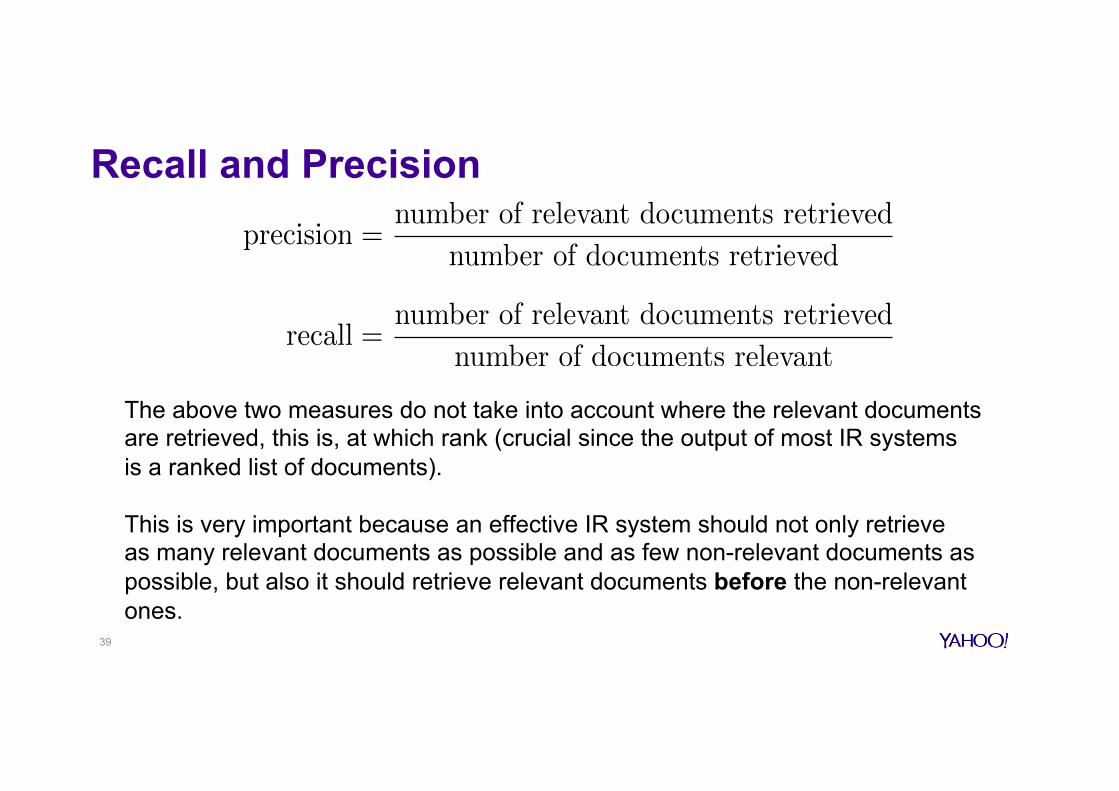
The above two measures do not take into account where the relevant documents are retrieved, this is, at which rank (crucial since the output of most IR systems is a ranked list of documents). This is very important because an effective IR system should not only retrieve as many relevant documents as possible and as few non-relevant documents as possible, but also it should retrieve relevant documents before the non-relevant ones. 39
precision =
number of relevant documents retrieved
number of documents retrieved
recall =
number of relevant documents retrieved
number of documents relevant
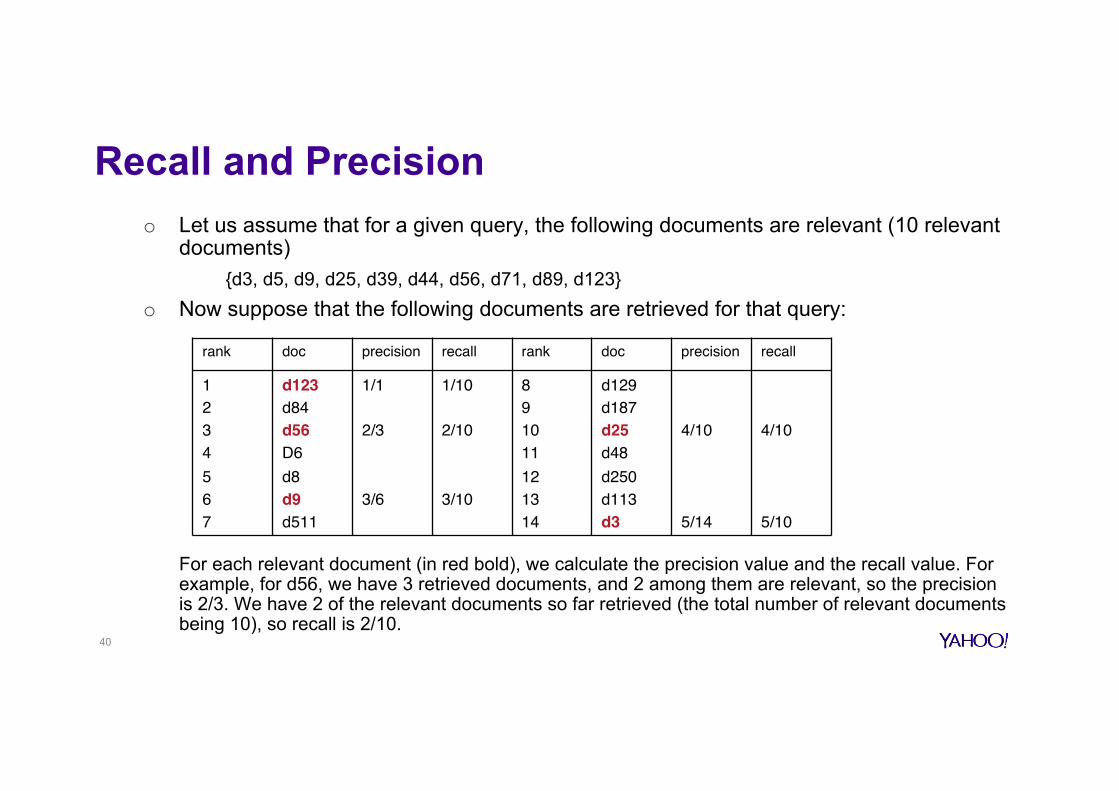
Recall and Precision o Let us assume that for a given query, the following documents are relevant (10 relevant
documents) {d3, d5, d9, d25, d39, d44, d56, d71, d89, d123}
o Now suppose that the following documents are retrieved for that query:
For each relevant document (in red bold), we calculate the precision value and the recall value. For example, for d56, we have 3 retrieved documents, and 2 among them are relevant, so the precision is 2/3. We have 2 of the relevant documents so far retrieved (the total number of relevant documents being 10), so recall is 2/10.
rank doc precision recall rank doc precision recall
1234567
d123d84d56D6d8d9d511
1/1
2/3
3/6
1/10
2/10
3/10
891011121314
d129d187d25d48d250d113d3
4/10
5/14
4/10
5/10
40

Recall and Precision o For each query, we obtain pairs of recall and precision values
- In our example, we would obtain (1/10, 1/1) (2/10, 2/3) (3/10, 3/6) (4/10, 4/10) (5/10, 5/14) …
which are usually expressed in % (10%, 100%) (20%, 66.66%) (30%, 50%) (40%, 40%), (50%, 35.71%) … - This can be read for instance: at 20% recall, we have 66.66% precision; at 50%
recall, we have 35.71% precision The pairs of values are plotted into a graph, which has the following curve
Recall (%)
Precision (%)
10 20 30 40 50 60 70 80 90 100
100908070605040302010
41
Recall and Precision o We have shown how to derive the recall and precision curve for a
given query
o Now we describe how using the above for all queries, the effectiveness of an IR system is evaluated and thus compared to other IR systems.
o Note that we can also compare the same system, but with different versions (e.g. different parameters are used). The idea here is to find out the best version of the IR system.
42
The complete methodology
For each IR system / IR system version
1. For each query in the test collection a. We first run the query against the system to obtain a ranked list of retrieved
documents b. We use the ranking and relevance judgements to calculate recall/precision pairs
2. Then we average recall / precision values across all queries, to obtain an overall measure of the effectiveness
43
Averaging across queries
o Hard to compare precision and recall graphs or tables for individual queries (too much data) - Need to average over many queries
o Two main types of averaging - Macro-average: each query is a point in the average - Micro-average: each relevant document is a point in the average
- Macro is mostly used (all queries count equally)
44

(Macro) Interpolated average precision o Average precision at standard recall points
o For a given query, compute precision and recall point for every relevant document
o Interpolate precision at standard recall levels - 11-pt is usually 100%, 90%, 80%, ..., 10%, 0%
o Average over all queries to get average precision at each recall level
45
Interpolation
0102030405060708090100
0 20 40 60 80 100recall
Interpolated valueObserved value
prec
ision
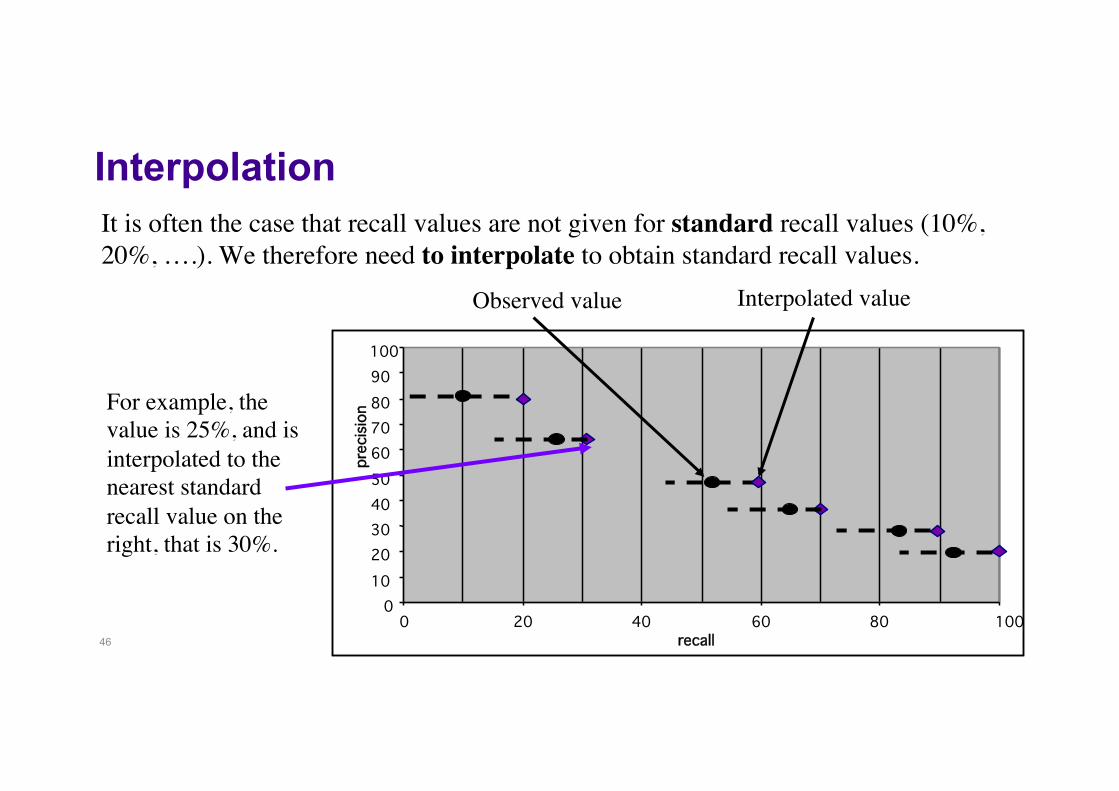
It is often the case that recall values are not given for standard recall values (10%, 20%, ….). We therefore need to interpolate to obtain standard recall values.
For example, the value is 25%, and is interpolated to the nearest standard recall value on the right, that is 30%.
46
Interpolated average precision
0102030405060708090100
0 10 20 30 40 50 60 70 80 90 100recall
query1query 2average
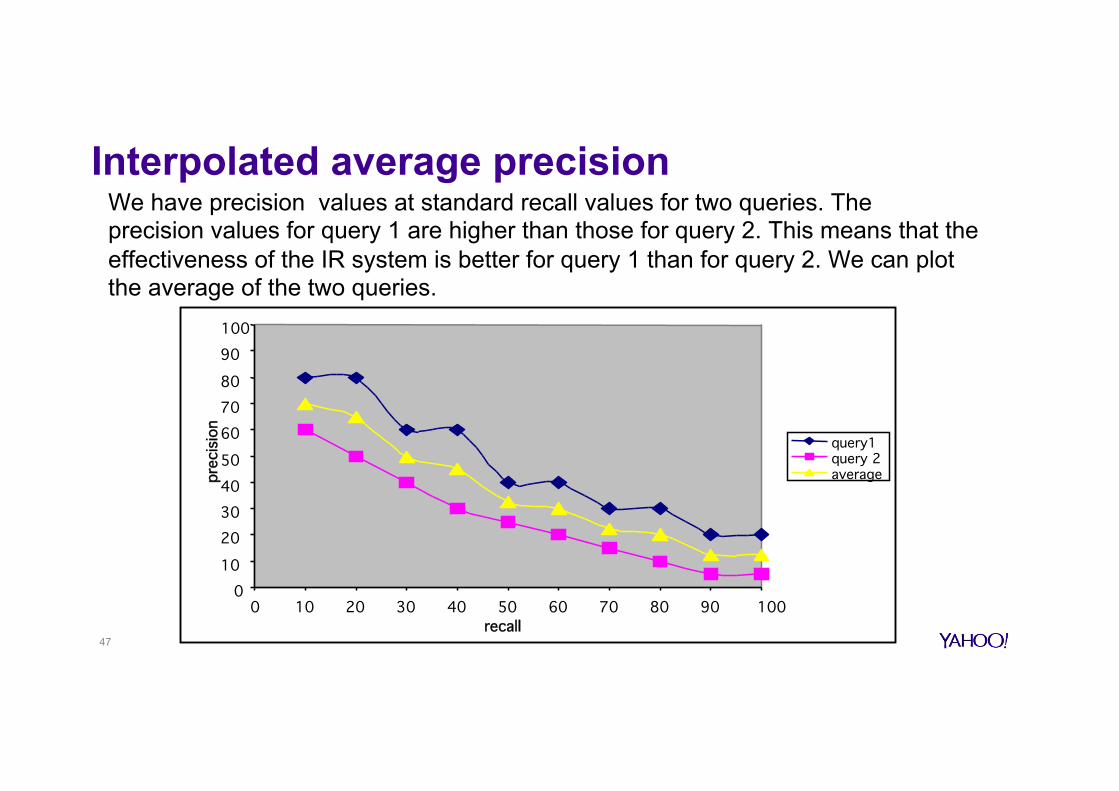
We have precision values at standard recall values for two queries. The precision values for query 1 are higher than those for query 2. This means that the effectiveness of the IR system is better for query 1 than for query 2. We can plot the average of the two queries.
47
prec
ision
Averaging
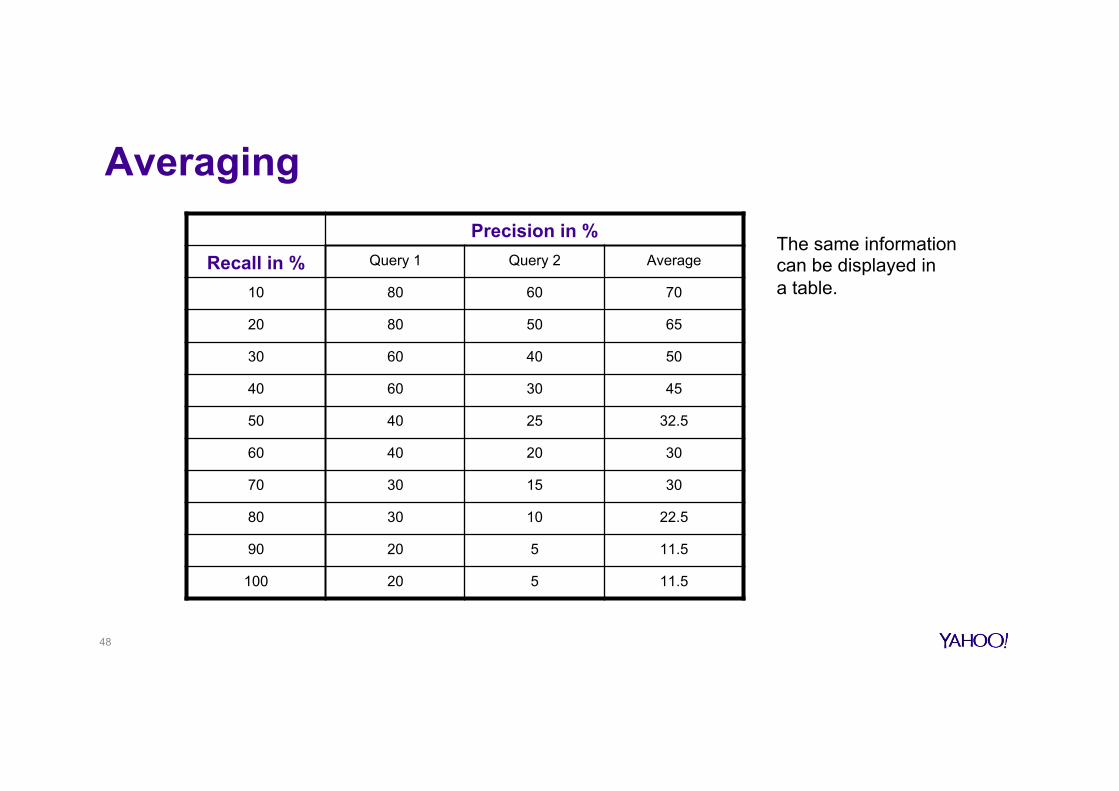
The same information can be displayed in a table.
48
Precision in % Recall in % Query 1 Query 2 Average
10 80 60 70
20 80 50 65
30 60 40 50
40 60 30 45
50 40 25 32.5
60 40 20 30
70 30 15 30
80 30 10 22.5
90 20 5 11.5
100 20 5 11.5
Comparison of systems
0102030405060708090100
0 10 20 30 40 50 60 70 80 90 100recall
prec
ision
system 1system 2
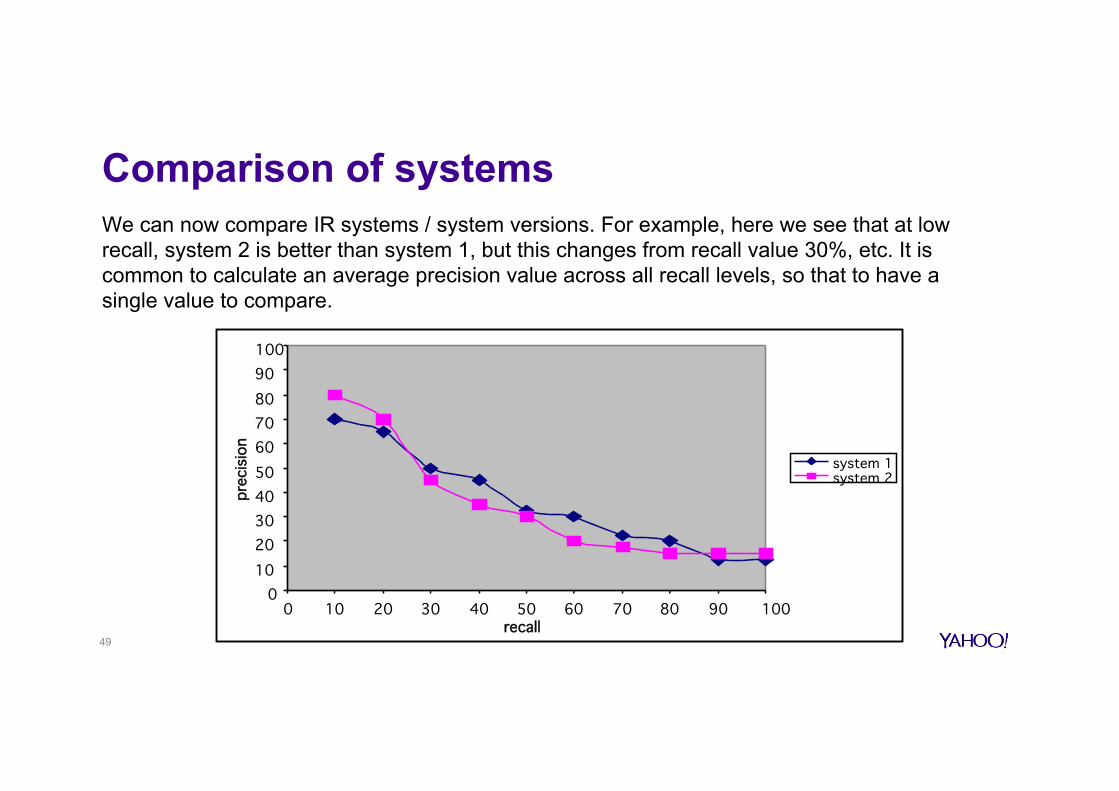
We can now compare IR systems / system versions. For example, here we see that at low recall, system 2 is better than system 1, but this changes from recall value 30%, etc. It is common to calculate an average precision value across all recall levels, so that to have a single value to compare.
49
Averaging across averages
o Average interpolated recall levels to get single result - Called “interpolated average precision” - Not used much anymore; “mean average precision” more common - Values at specific interpolated points still commonly used
o Mean average precision (MAP) - (“Average average precision” sounds weird) - Average precision over all relevant documents, non-interpolated- Reward systems that retrieve relevant documents quickly (highly ranked)
50
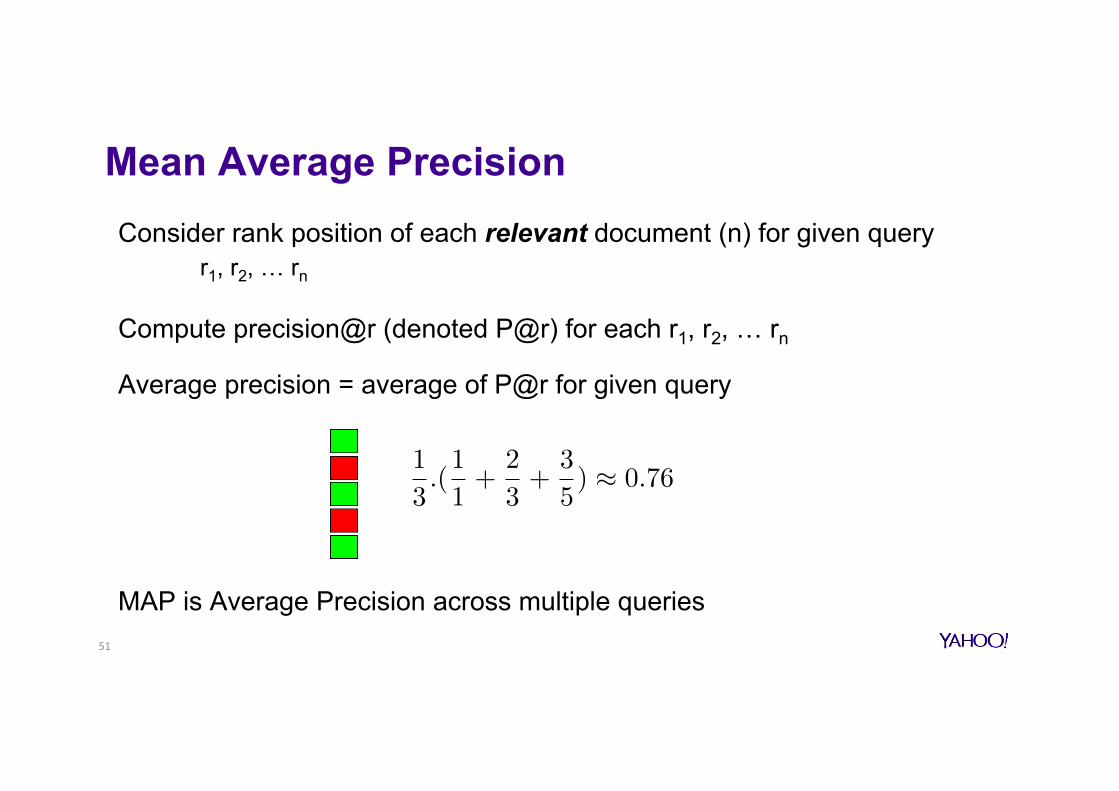
Mean Average Precision Consider rank position of each relevant document (n) for given query
r1, r2, … rn
Compute precision@r (denoted P@r) for each r1, r2, … rn
Average precision = average of P@r for given query
MAP is Average Precision across multiple queries
1
3.(1
1+
2
3+
3
5) ⇡ 0.76
51
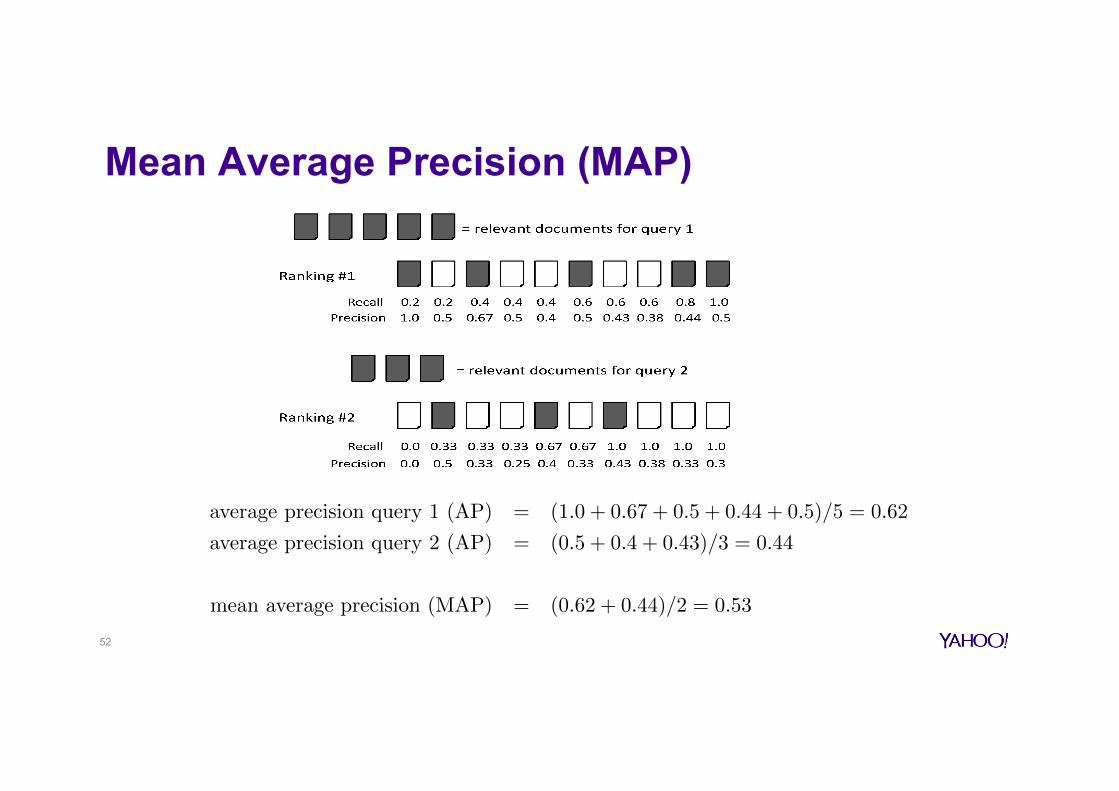
Mean Average Precision (MAP)
52
average precision query 1 (AP) = (1.0 + 0.67 + 0.5 + 0.44 + 0.5)/5 = 0.62
average precision query 2 (AP) = (0.5 + 0.4 + 0.43)/3 = 0.44
mean average precision (MAP) = (0.62 + 0.44)/2 = 0.53

Moreaboutmeanaverageprecision(MAP)
o If a relevant document is not retrieved, precision corresponding to that relevant document is zero
o Most commonly used measure in research papers … with issues
o Not so good for web search evaluation (precision oriented) - MAP assumes user is interested in finding many relevant documents
53
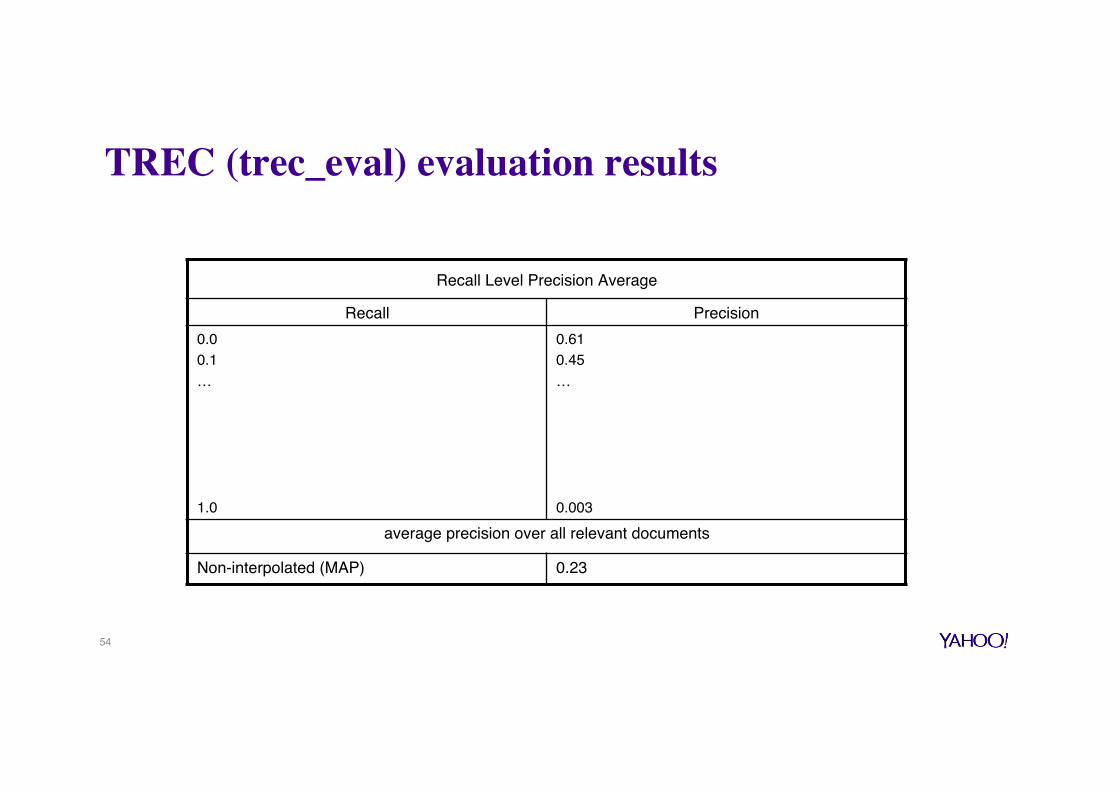
TREC (trec_eval) evaluation results
Recall Level Precision Average
Recall Precision0.00.1…
1.0
0.610.45…
0.003average precision over all relevant documents
Non-interpolated (MAP) 0.23
54
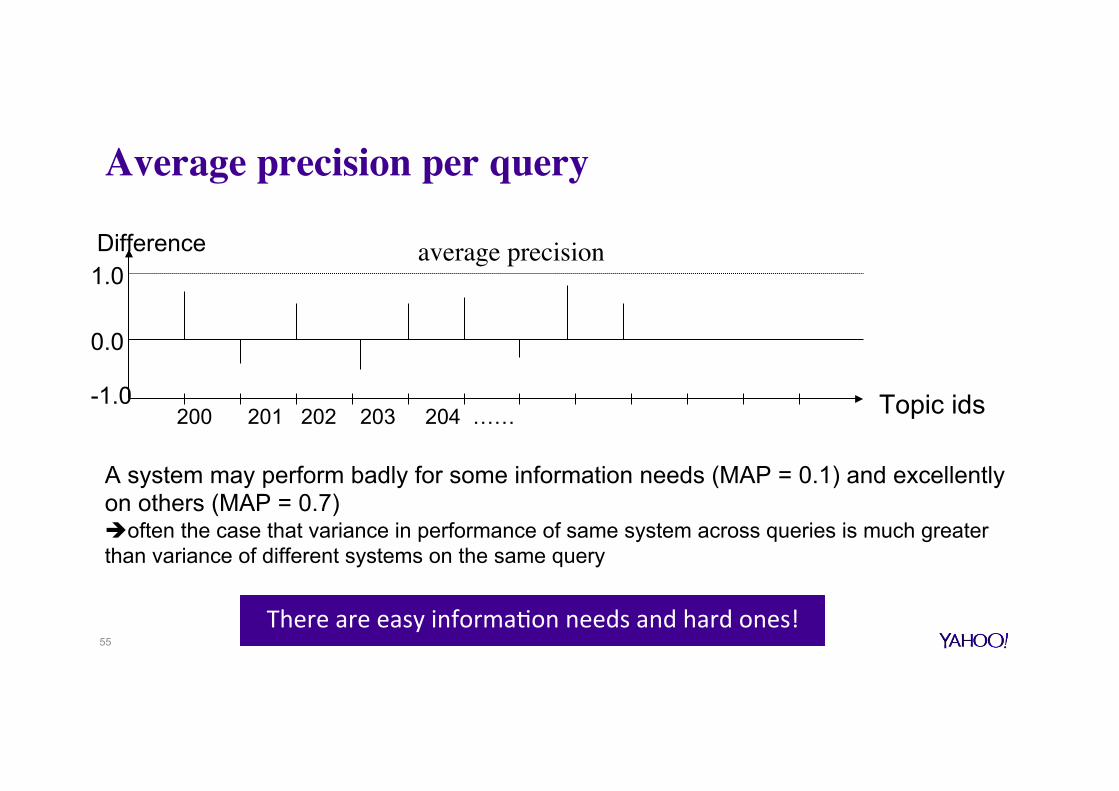
Average precision per query
1.0
-1.0
0.0
200 201 202 203 204 …… Topic ids
Difference average precision
55
A system may perform badly for some information needs (MAP = 0.1) and excellently on others (MAP = 0.7) èoften the case that variance in performance of same system across queries is much greater than variance of different systems on the same query
ThereareeasyinformaGonneedsandhardones!

Rank-based measures
o Binary relevance - Mean Average Precision (MAP)
- P@r - R-Precision - Mean Reciprocal Rank (MRR)
- bpref
o Multiple levels of relevance - Normalized Discounted Cumulative Gain (NDCG)
56
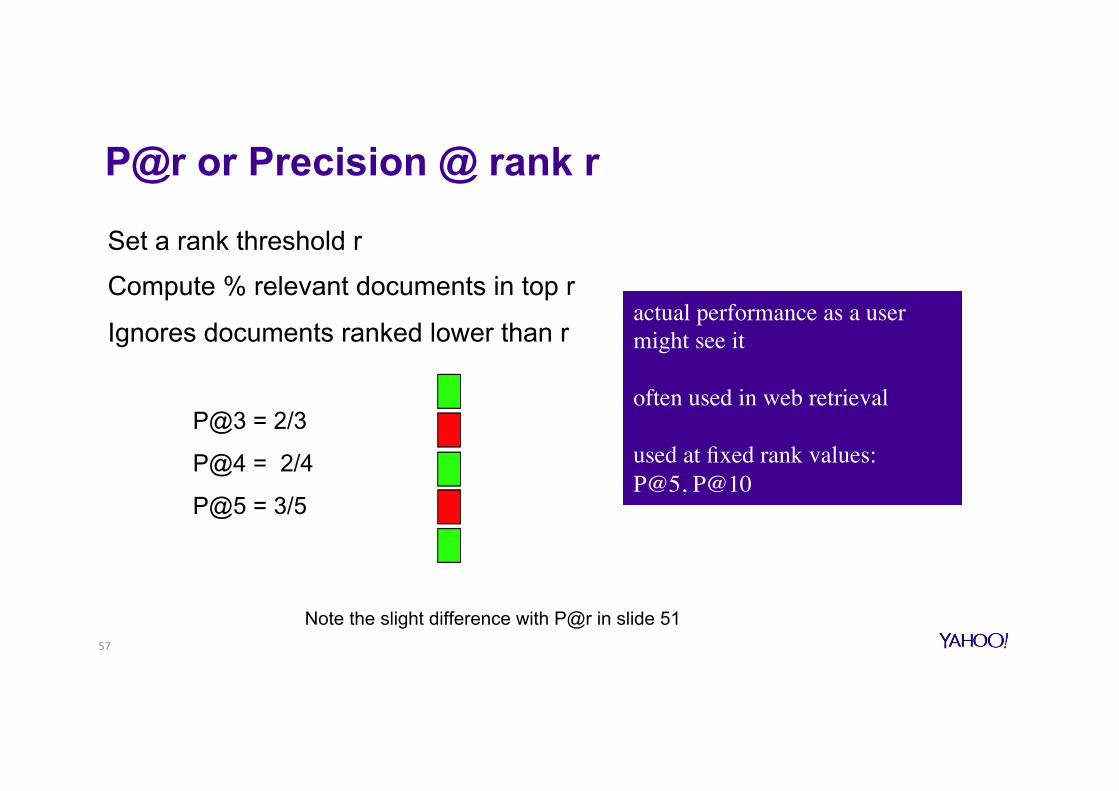
P@r or Precision @ rank r
Set a rank threshold r
Compute % relevant documents in top r
Ignores documents ranked lower than r
P@3 = 2/3
P@4 = 2/4
P@5 = 3/5
actual performance as a user might see it
often used in web retrieval
used at fixed rank values: P@5, P@10
57
Note the slight difference with P@r in slide 51
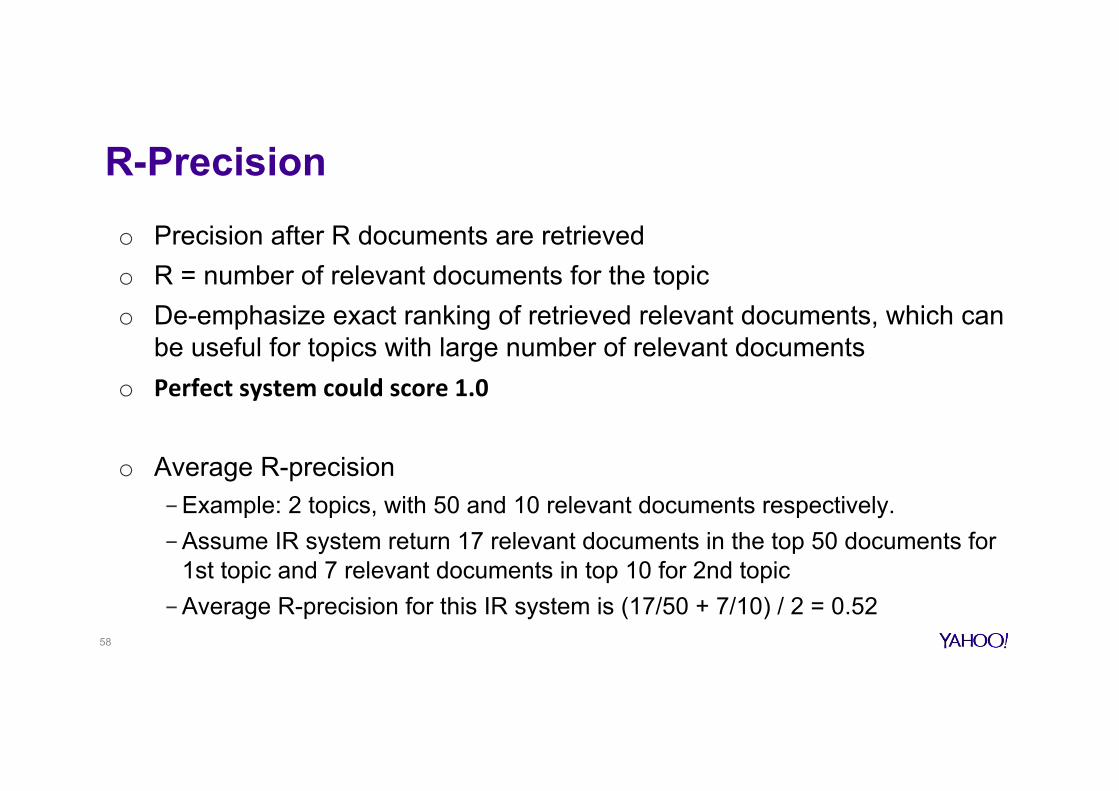
R-Precision
o Precision after R documents are retrieved o R = number of relevant documents for the topic o De-emphasize exact ranking of retrieved relevant documents, which can
be useful for topics with large number of relevant documents o Perfectsystemcouldscore1.0
o Average R-precision - Example: 2 topics, with 50 and 10 relevant documents respectively. - Assume IR system return 17 relevant documents in the top 50 documents for
1st topic and 7 relevant documents in top 10 for 2nd topic - Average R-precision for this IR system is (17/50 + 7/10) / 2 = 0.52
58
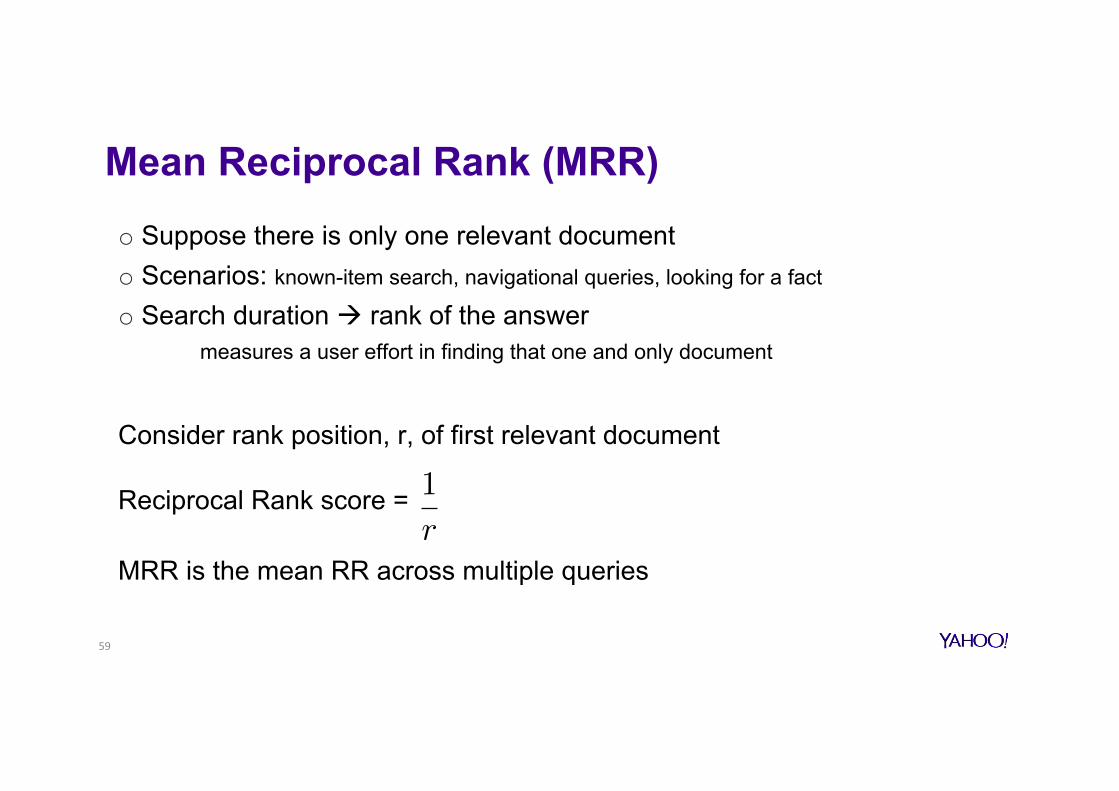
Mean Reciprocal Rank (MRR) o Suppose there is only one relevant document o Scenarios: known-item search, navigational queries, looking for a fact
o Search duration à rank of the answer measures a user effort in finding that one and only document
Consider rank position, r, of first relevant document
Reciprocal Rank score =
MRR is the mean RR across multiple queries
1
r
59
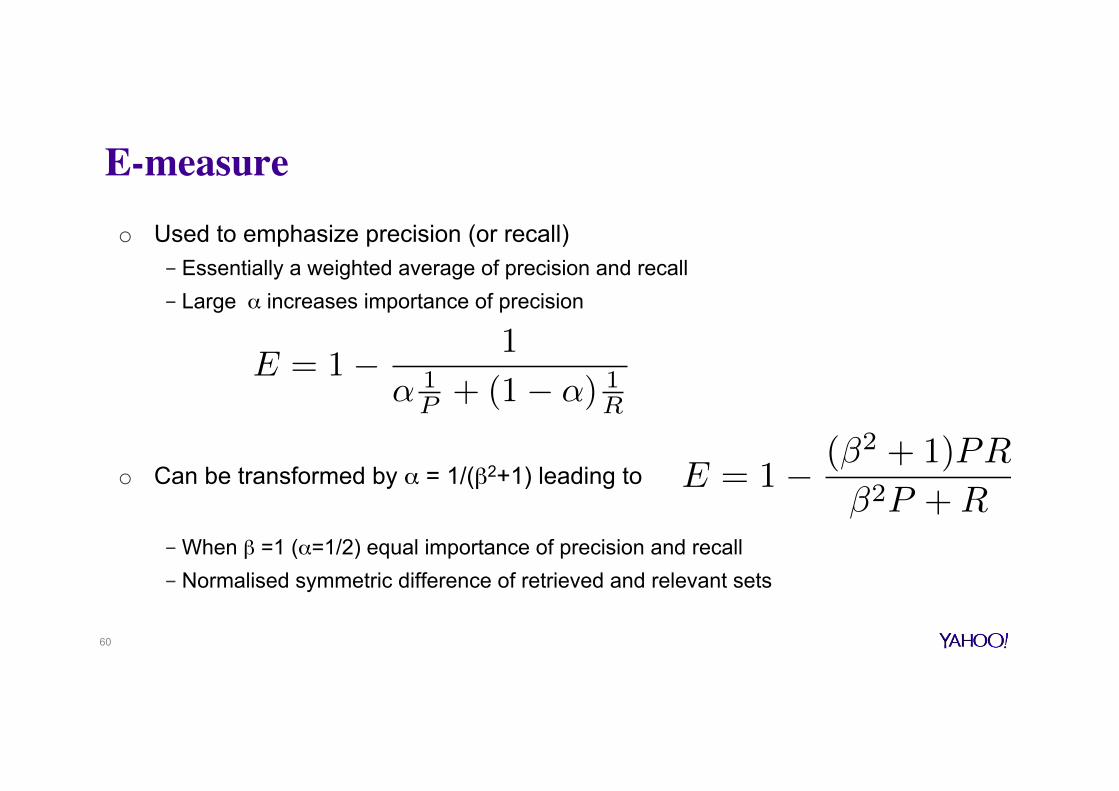
E-measureo Used to emphasize precision (or recall)
- Essentially a weighted average of precision and recall - Large α increases importance of precision
o Can be transformed by α = 1/(β2+1) leading to
- When β =1 (α=1/2) equal importance of precision and recall - Normalised symmetric difference of retrieved and relevant sets
60
E = 1� 1
↵ 1P + (1� ↵) 1
R
E = 1� (�2 + 1)PR
�2P +R

Symmetric Difference and E A is the retrieved set of documents B is the set of relevant documents P = |A∩B|/|A| R = |A∩B|/|B| A⊗B (the symmetric difference) is the shaded area
A⊗B = |A∪B|- |A∩B| = |A|+|B|-2|A∩B|
Eβ=1=1-(2PR / (P+R)) = (P+R-2PR)/(P+R) = … = A⊗B / (|A|+|B|)
symmetric difference
normalised
61
A
B A∩B

F measure o F = 1-E often used
- Good results mean larger values of F
- “F1” measure is popular: F with β=1 - particular popular with evaluating classification approaches
harmonic mean of P and R
62
F� = 1� E =(�2 + 1)PR
�2P +R
F1 =2PR
P +R=
112 (
1R + 1
P )
HarmonicmeanisaconservaGveaverage
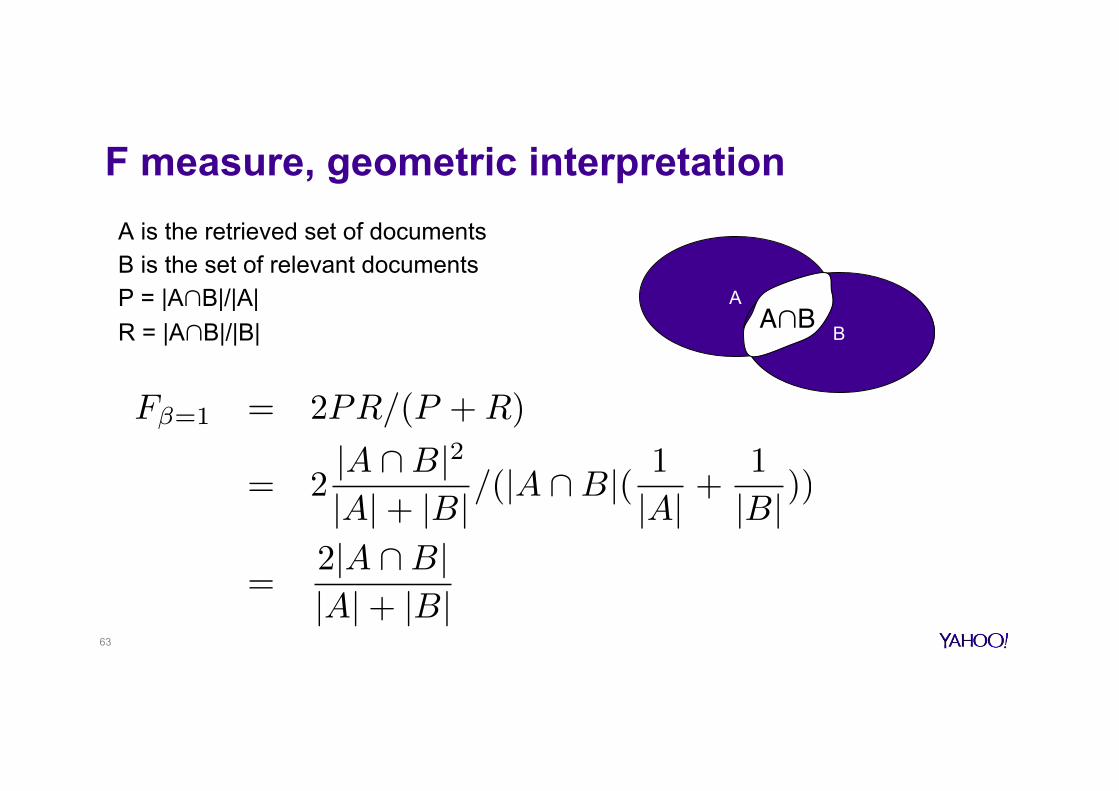
F measure, geometric interpretation A is the retrieved set of documents B is the set of relevant documents P = |A∩B|/|A| R = |A∩B|/|B|
A
B A∩B
63
F�=1 = 2PR/(P +R)
= 2|A \B|2
|A|+ |B|/(|A \B|( 1
|A| +1
|B| ))
=2|A \B||A|+ |B|

Relation to Contingency Table
Why is accuracy not much used in IR in large documents collections?
- Most document are NOT relevant - Most documents are NOT retrieved - Inflates the accuracy value
Document is Relevant
Document is NOT relevant
Document is retrieved a b Document is NOT retrieved c d
64
Accuracy : (a+ d)/(a+ b+ c+ d)
Precision : a/(a+ b)
Recall : a/(a+ c)
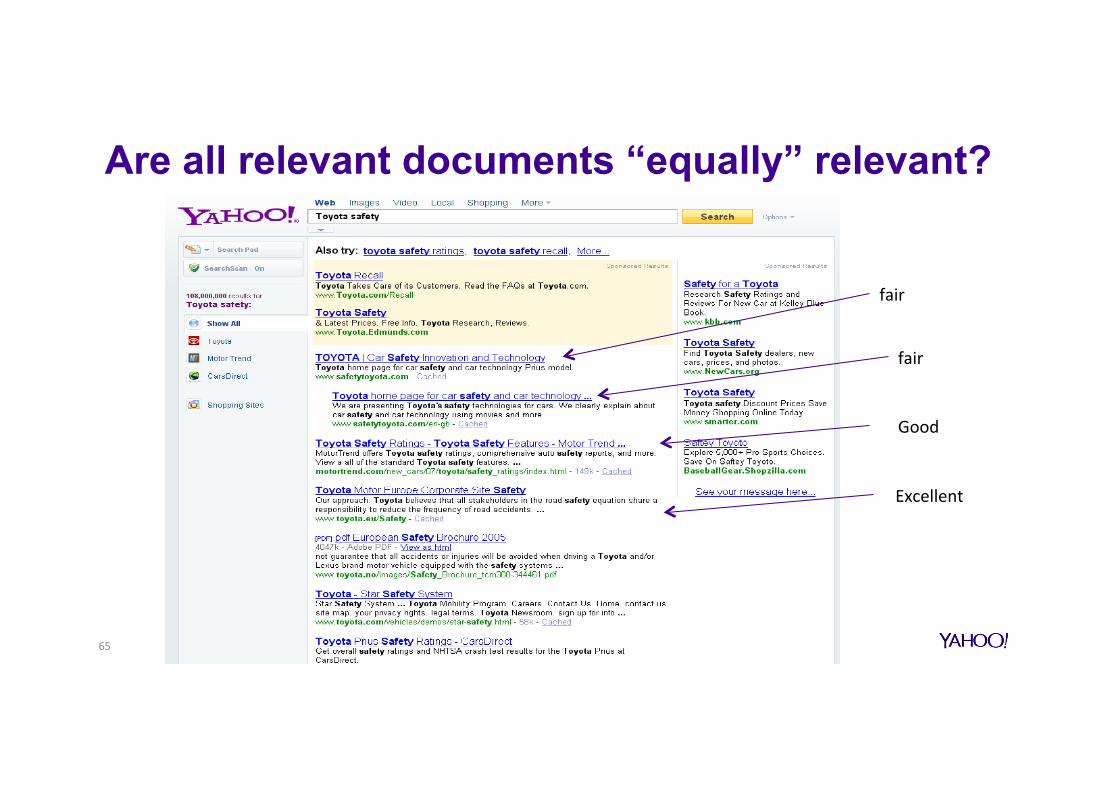
fair
fair
Good
Are all relevant documents “equally” relevant?
65
Excellent
Discounted Cumulative Gain (DCG)
o Popular measure for evaluating web search
o Two assumptions: - Highly relevant documents are more useful than marginally relevant
documents - The lower the ranked position of a relevant document, the less useful it is for
the user, since it is less likely to be examined
66
Discounted Cumulative Gain (DCG) o Uses graded relevance as a measure of usefulness, or gain, from
examining a document
o Gain is accumulated starting at the top of the ranking and can be reduced, or discounted, at lower ranks
o Typical discount is 1/log(rank) - With base 2, the discount at rank 4 is 1/2 , and at rank 8 it is 1/3
67
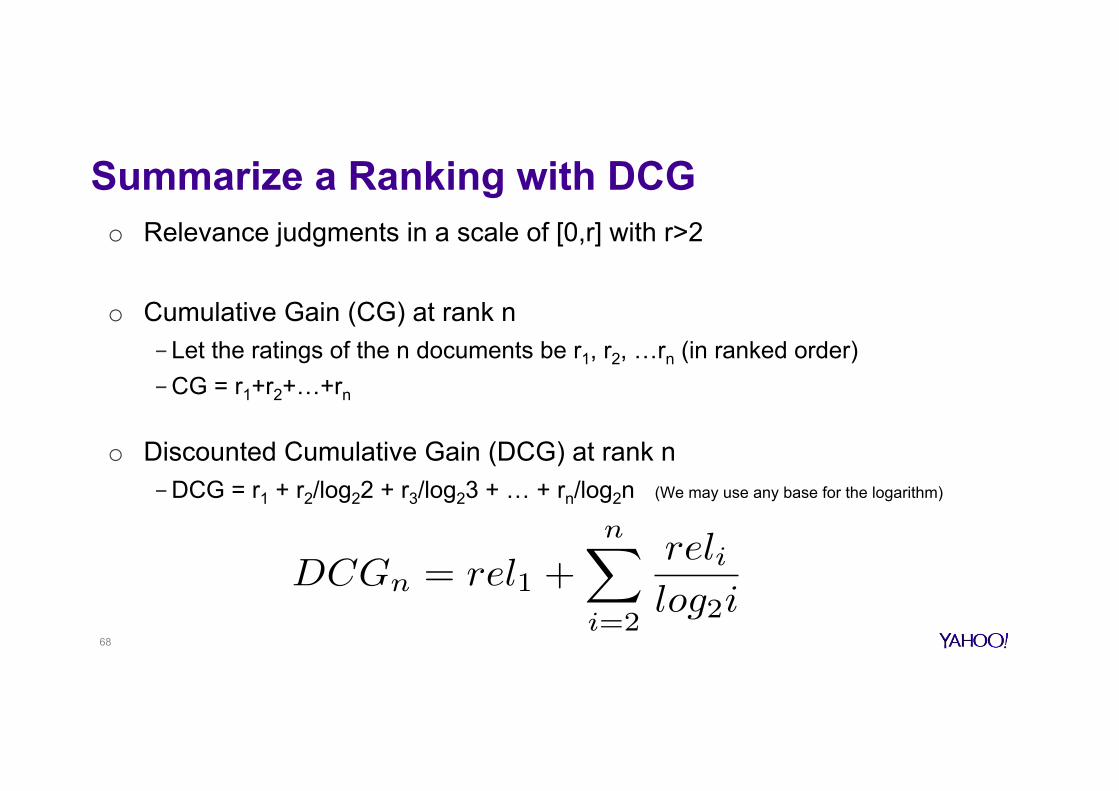
Summarize a Ranking with DCG o Relevance judgments in a scale of [0,r] with r>2
o Cumulative Gain (CG) at rank n - Let the ratings of the n documents be r1, r2, …rn (in ranked order) - CG = r1+r2+…+rn
o Discounted Cumulative Gain (DCG) at rank n - DCG = r1 + r2/log22 + r3/log23 + … + rn/log2n (We may use any base for the logarithm)
68
DCGn = rel1 +nX
i=2
reli
log2i
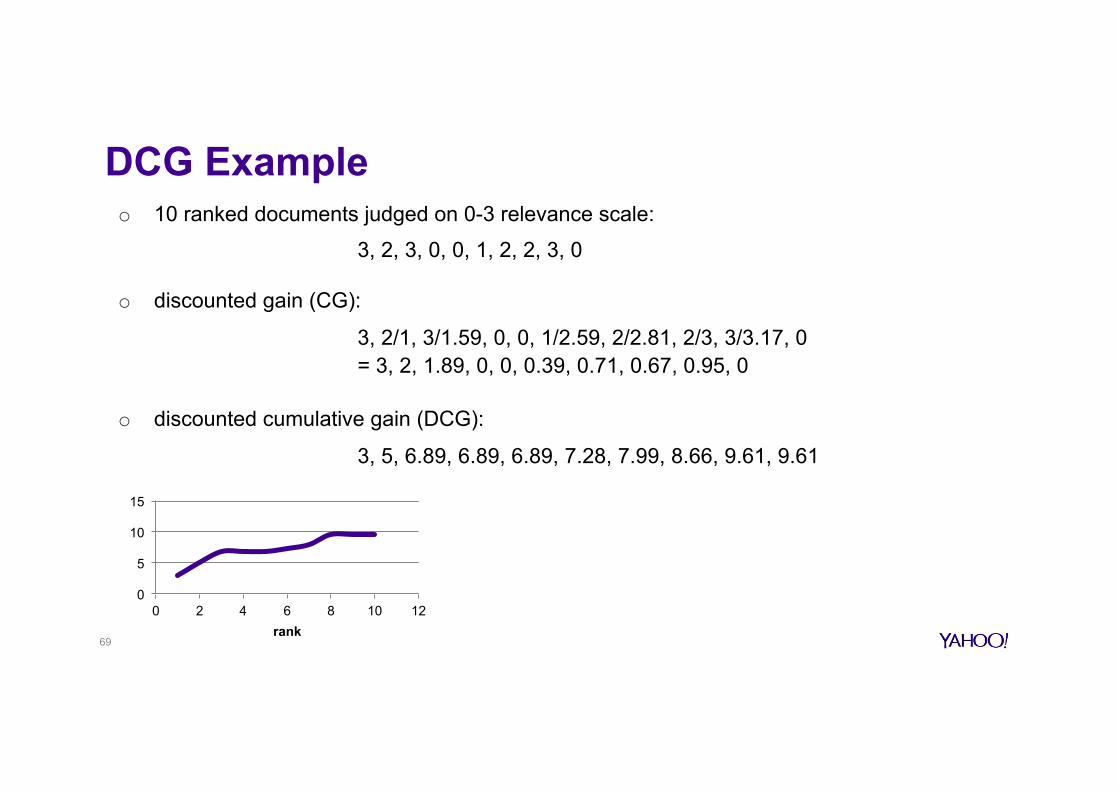
DCG Example o 10 ranked documents judged on 0-3 relevance scale:
3, 2, 3, 0, 0, 1, 2, 2, 3, 0
o discounted gain (CG):
3, 2/1, 3/1.59, 0, 0, 1/2.59, 2/2.81, 2/3, 3/3.17, 0 = 3, 2, 1.89, 0, 0, 0.39, 0.71, 0.67, 0.95, 0
o discounted cumulative gain (DCG):
3, 5, 6.89, 6.89, 6.89, 7.28, 7.99, 8.66, 9.61, 9.61
69
0
5
10
15
0 2 4 6 8 10 12 rank

Summarize a Ranking with NDCG
o Normalized Discounted Cumulative Gain (NDCG) at rank n - Normalize DCG at rank n by the DCG value at rank n of the ideal ranking
- Ideal ranking would first return the documents with the highest relevance level, then the next highest relevance level, and so on (we get Max DCG)
o Normalization useful for contrasting queries with varying numbers of relevant documents
o NDCG popular in evaluating web search 70
NDCG =DCG
MaxDCG
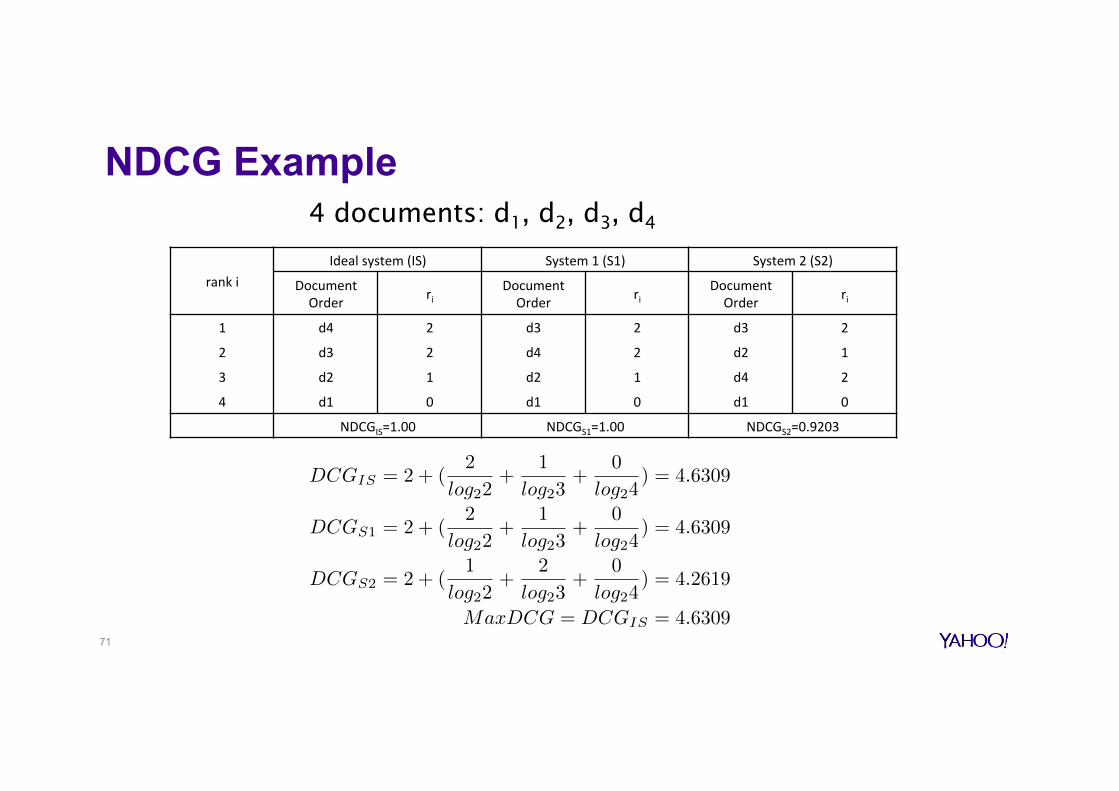
NDCG Example
rankiIdealsystem(IS) System1(S1) System2(S2)
DocumentOrder ri
DocumentOrder ri
DocumentOrder ri
1 d4 2 d3 2 d3 2
2 d3 2 d4 2 d2 1
3 d2 1 d2 1 d4 2
4 d1 0 d1 0 d1 0
NDCGIS=1.00 NDCGS1=1.00 NDCGS2=0.9203
4 documents: d1, d2, d3, d4
71
DCGIS = 2 + (2
log22+
1
log23+
0
log24) = 4.6309
DCGS1 = 2 + (2
log22+
1
log23+
0
log24) = 4.6309
DCGS2 = 2 + (1
log22+
2
log23+
0
log24) = 4.2619
MaxDCG = DCGIS = 4.6309
Problem with the test collection methodology o Building larger test collections along with complete relevance judgment is difficult
or impossible - require assessor time, which is very expensive - require many diverse retrieval “runs”
o Recall is difficult if not impossible to get correctly as there is no way we can find all the relevant documents for each query
o Precision at top n often not stable enough
o Issue: - Non-judged documents are assumed non-relevant - Can we reuse the test collection later on?
72
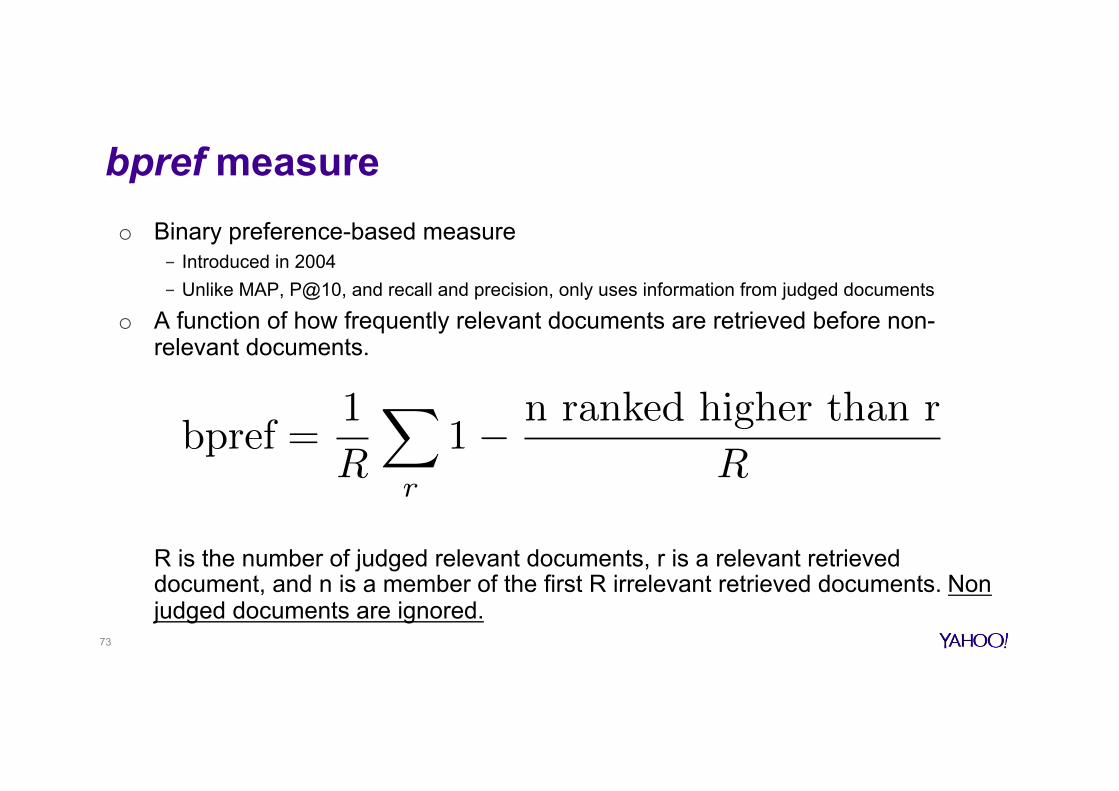
bpref measure o Binary preference-based measure
- Introduced in 2004 - Unlike MAP, P@10, and recall and precision, only uses information from judged documents
o A function of how frequently relevant documents are retrieved before non-relevant documents.
R is the number of judged relevant documents, r is a relevant retrieved
document, and n is a member of the first R irrelevant retrieved documents. Non judged documents are ignored.
73
bpref =1
R
X
r
1� n ranked higher than r
R
bpref measure o When comparing systems over test collections with complete judgments, MAP
and bpref are reported to be equivalent
o With incomplete judgments, bpref is shown to be more stable - We look at what happen when we use less queries, more queries - We look at what happen when we swap documents in the ranking
74
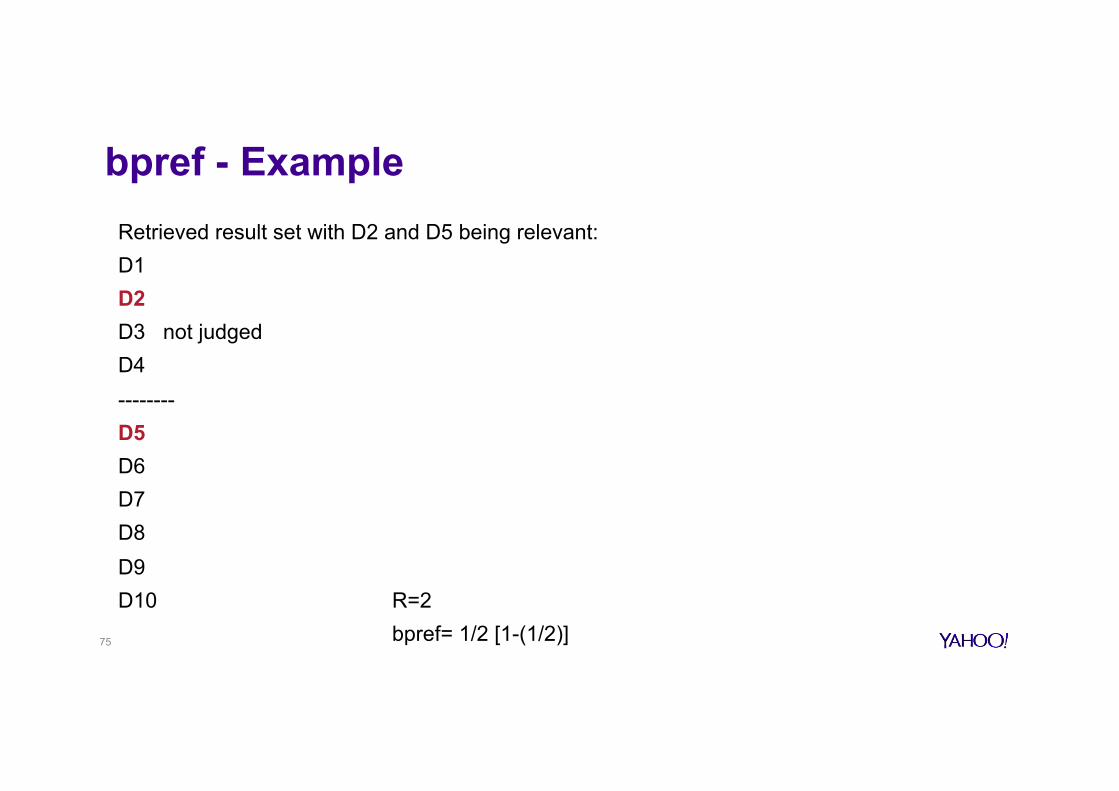
bpref - Example Retrieved result set with D2 and D5 being relevant: D1 D2 D3 not judged D4 -------- D5 D6 D7 D8 D9 D10 R=2
bpref= 1/2 [1-(1/2)] 75
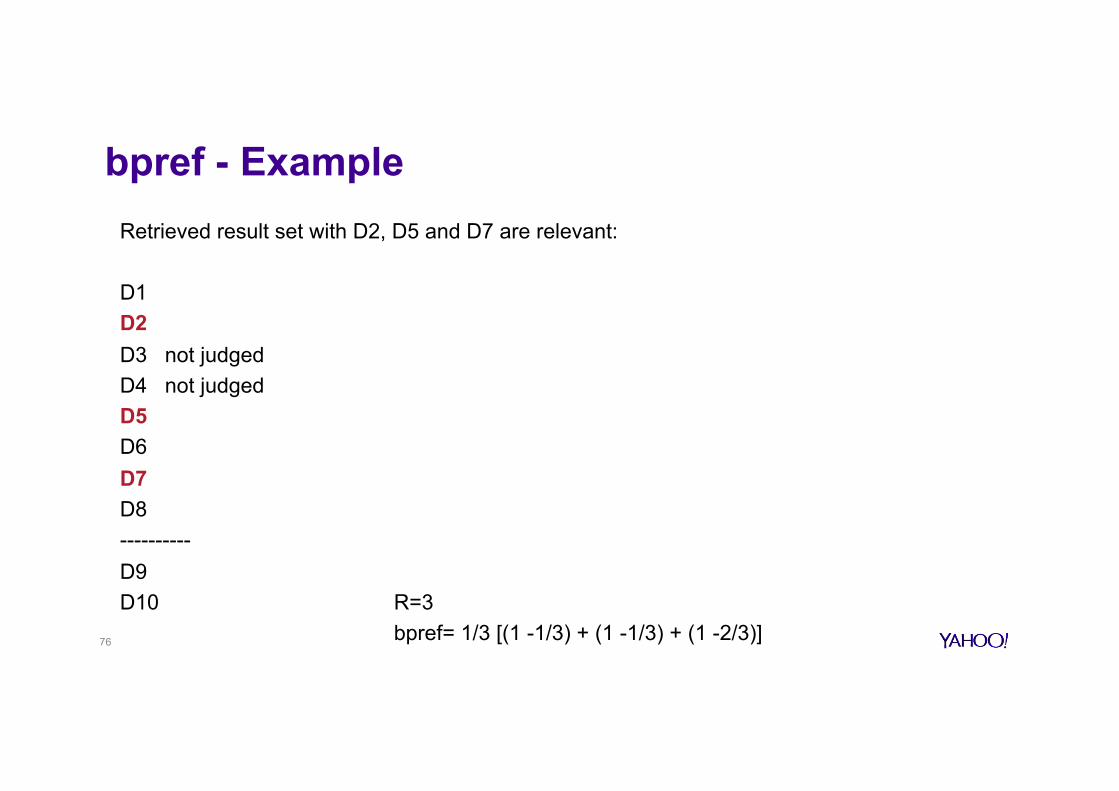
bpref - Example Retrieved result set with D2, D5 and D7 are relevant: D1 D2 D3 not judged D4 not judged D5 D6 D7 D8 ---------- D9 D10 R=3
bpref= 1/3 [(1 -1/3) + (1 -1/3) + (1 -2/3)] 76
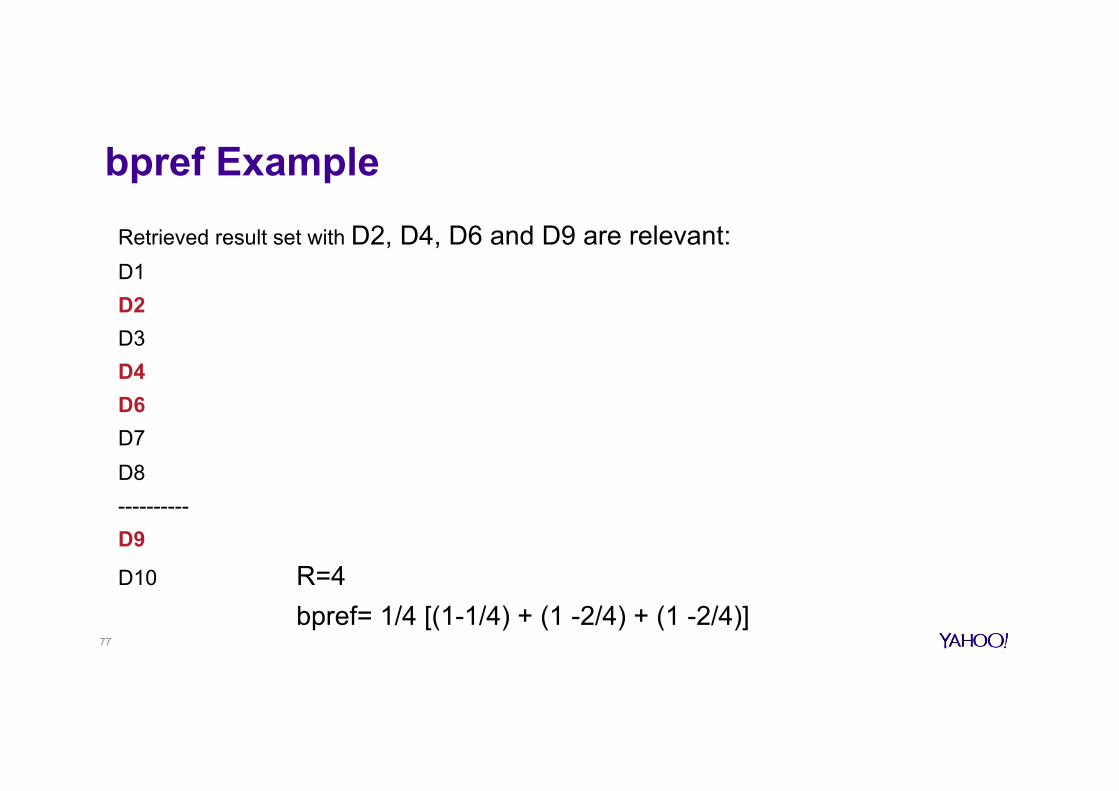
bpref Example Retrieved result set with D2, D4, D6 and D9 are relevant: D1 D2 D3 D4 D6 D7 D8 ---------- D9
D10 R=4 bpref= 1/4 [(1-1/4) + (1 -2/4) + (1 -2/4)]
77
Evaluating interaction with the IR systems
o Empirical data involving human users is time consuming to gather and difficult to draw universal conclusions from
o Evaluation metrics for user interaction (interface) - Time required to learn the system - Time to achieve goals on benchmark tasks - Error rates - Retention of the use of the interface over time - User satisfaction
78
Why significance testing o System A beats System B on one query
- Is it just a lucky query for System A? - Maybe System B does better on some other query? - Needs as many queries as possible
Empirical research suggests 25 is minimum needed
TREC tracks generally aim for at least 50 queries
o Systems A and B identical on all but one query - If System A beats System B by enough on that one query, average will make A look better than B
As above could just be a lucky break for System A
- Need A to beat B frequently to believe A is really better
o System A is only 0.00001% better than system B - Even if true in all queries, does it mean much
o Significance testing consider those issues
79
Significance tests o Are observed differences statistically different?
- Make use of statistics
o Generally we cannot make assumptions about underlying distribution - Most significance tests do make such assumptions
o Significance tests are easier to do on single-valued effectiveness measures (MAP, bpref)
o Example: Sign test - Do not require that data be normally distributed - For techniques A and B, compare average precision for each pair of results generated by queries in
the test collection - If difference is large enough, count as + or -, otherwise ignore - Use number of +’s and the number of significant differences to determine significance level
80
Measures for large-scale systems … web search o Typical user behavior in web search shown preference for high precision o Graded scales of relevance seem more useful than binary è NDCG
o Recall difficult to measure on the web - Often use precision at top k, such as k=5, k =10, …
o . . . or measures that reward you more for getting rank 1 right than for getting rank 10 right è NDCG
o Use non-relevance-based datasets such as click-through data (query logs)
o A/B testing
81
A/Btes(ng
o Testaasinglenew“innovaGon”
o Havemostusersuseoldsystemo DivertasmallproporGonoftraffic(e.g.,1%)tothenewsystemthatincludes
theinnovaGon
o Evaluatewithan“automaGc”measurelikeclick-throughrates
o NowwecandirectlyseeiftheinnovaGondoesimproveretrievalperformance(e.g.click-throughrate)
o ProbablytheevaluaGonmethodologythatlargesearchenginestrustmost
Sec. 8.6.3
82
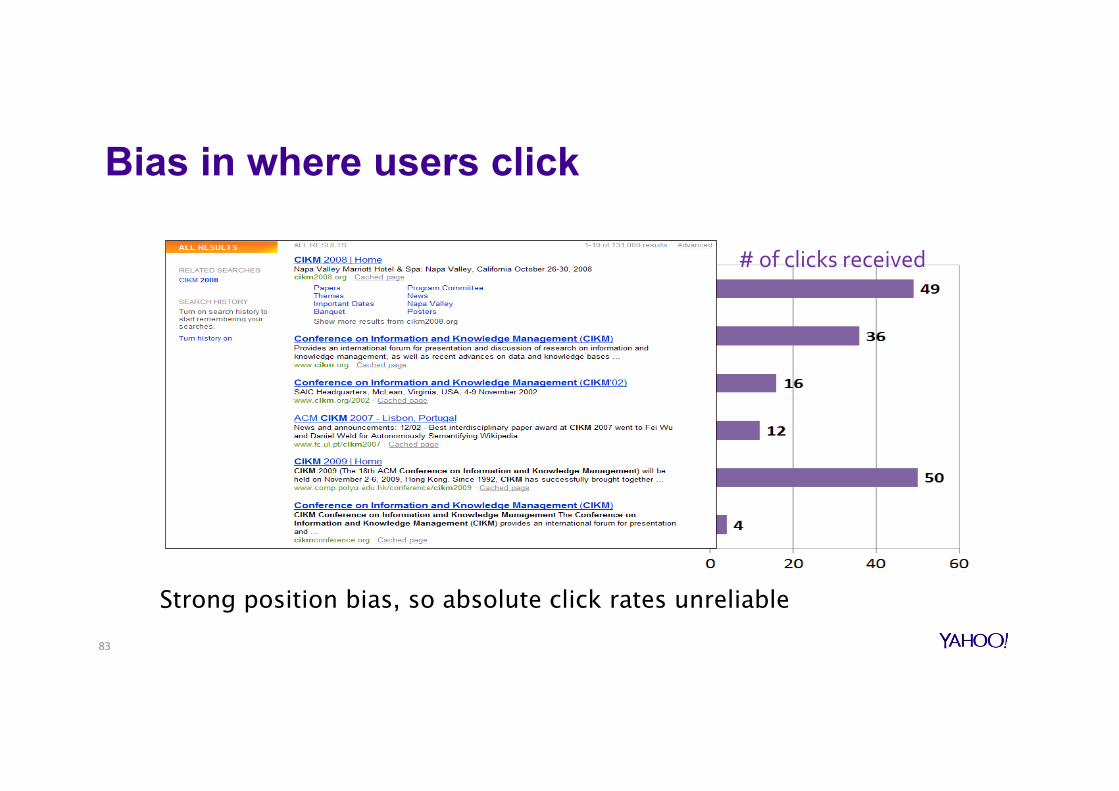
Bias in where users click
#ofclicksreceived
Strong position bias, so absolute click rates unreliable
83
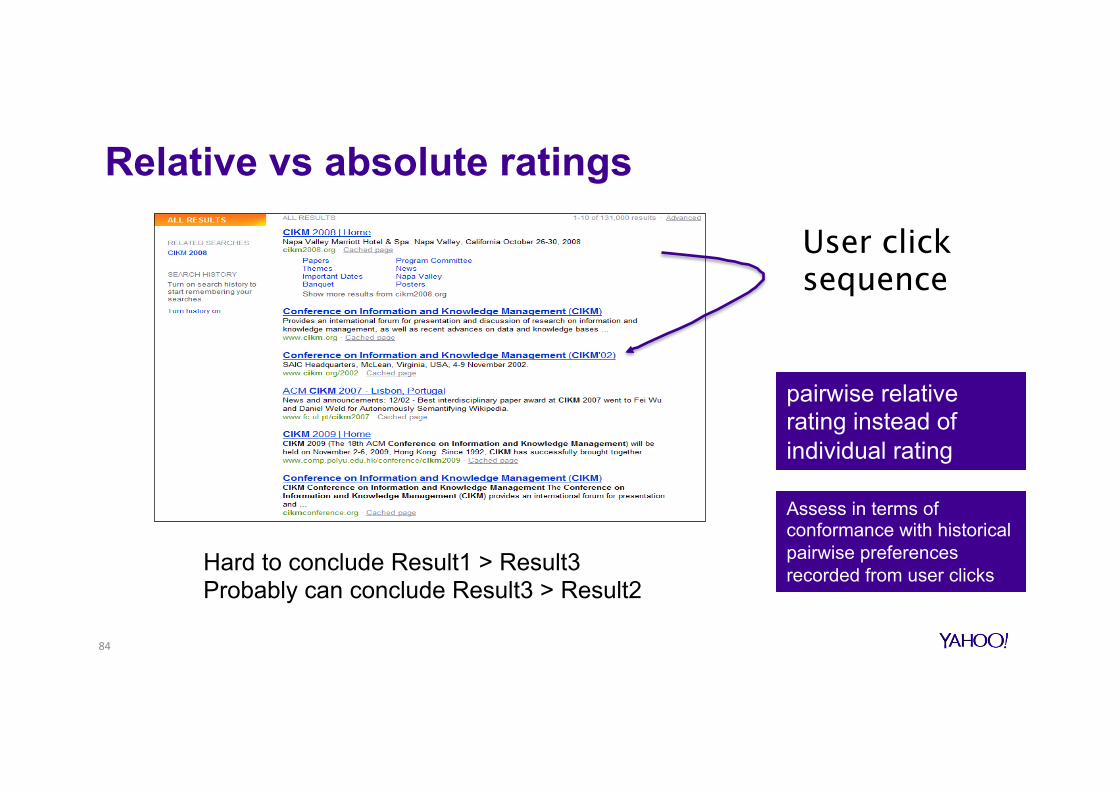
Relative vs absolute ratings
Hard to conclude Result1 > Result3 Probably can conclude Result3 > Result2
User click sequence
pairwise relative rating instead of individual rating
Assess in terms of conformance with historical pairwise preferences recorded from user clicks
84
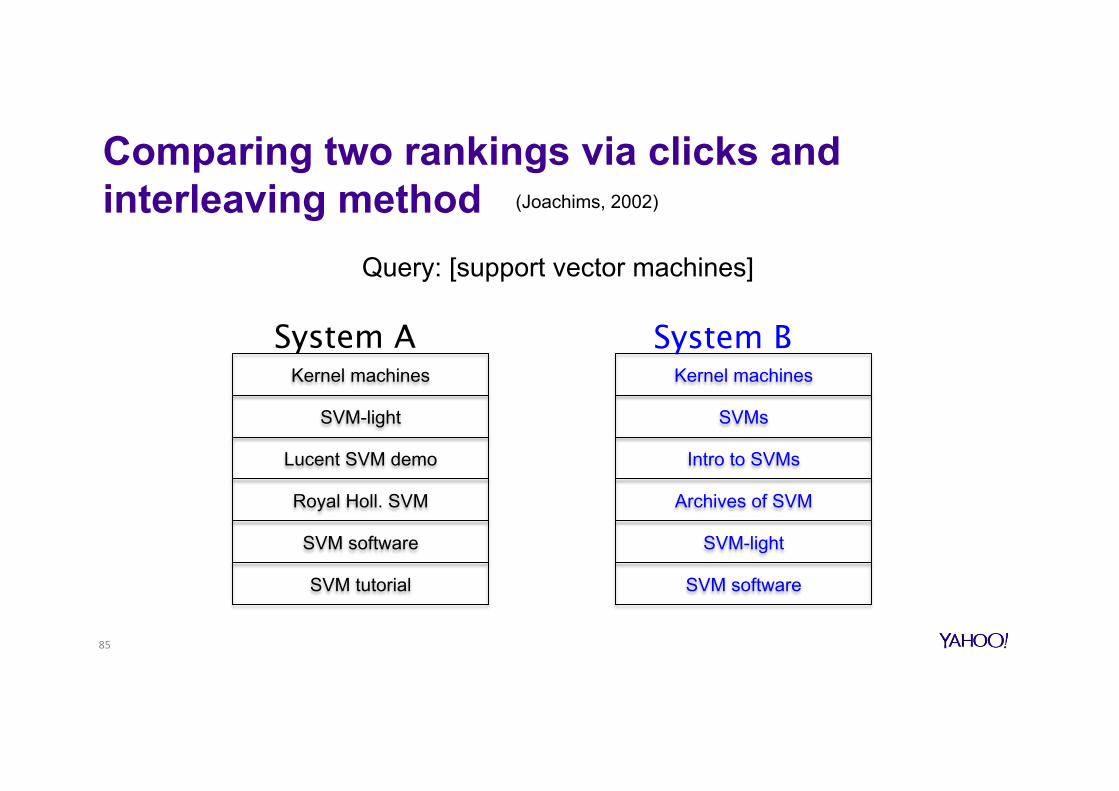
Comparing two rankings via clicks and interleaving method
Kernel machines
SVM-light
Lucent SVM demo
Royal Holl. SVM
SVM software
SVM tutorial
Kernel machines
SVMs
Intro to SVMs
Archives of SVM
SVM-light
SVM software
Query: [support vector machines]
System A System B
85
(Joachims, 2002)
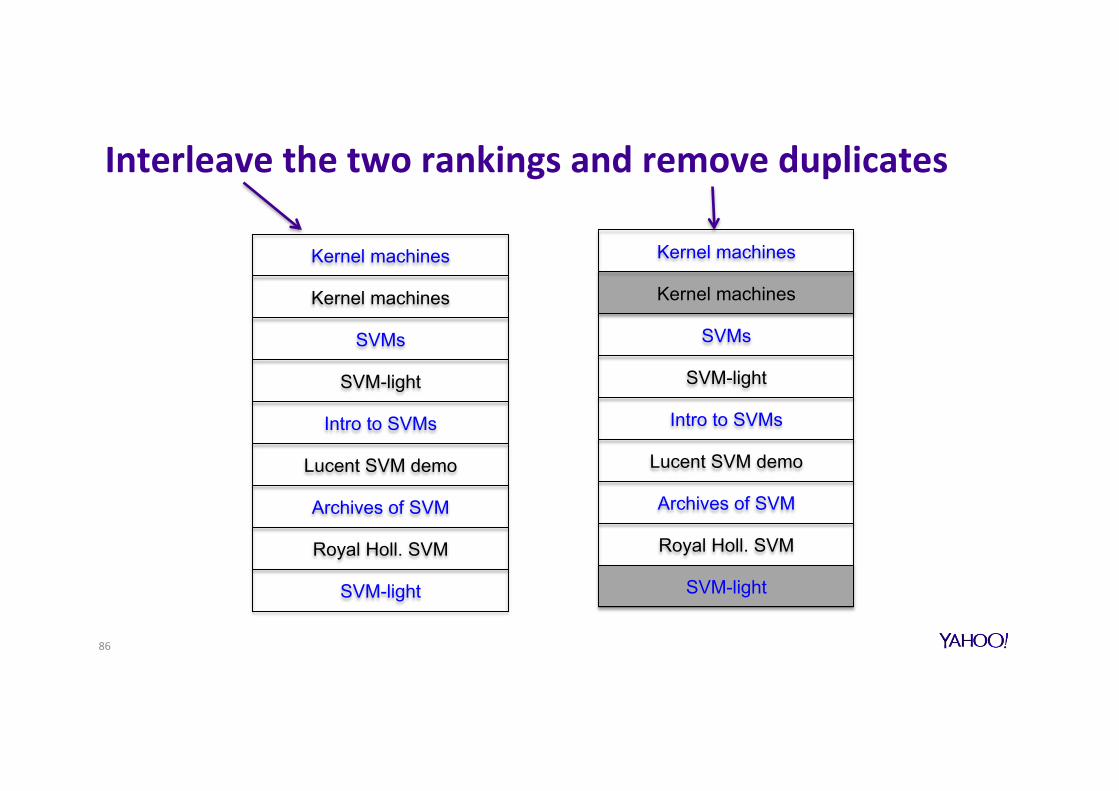
Interleavethetworankingsandremoveduplicates
Kernel machines
SVM-light
Lucent SVM demo
Royal Holl. SVM
Kernel machines
SVMs
Intro to SVMs
Archives of SVM
SVM-light
Kernel machines
SVM-light
Lucent SVM demo
Royal Holl. SVM
Kernel machines
SVMs
Intro to SVMs
Archives of SVM
SVM-light
86
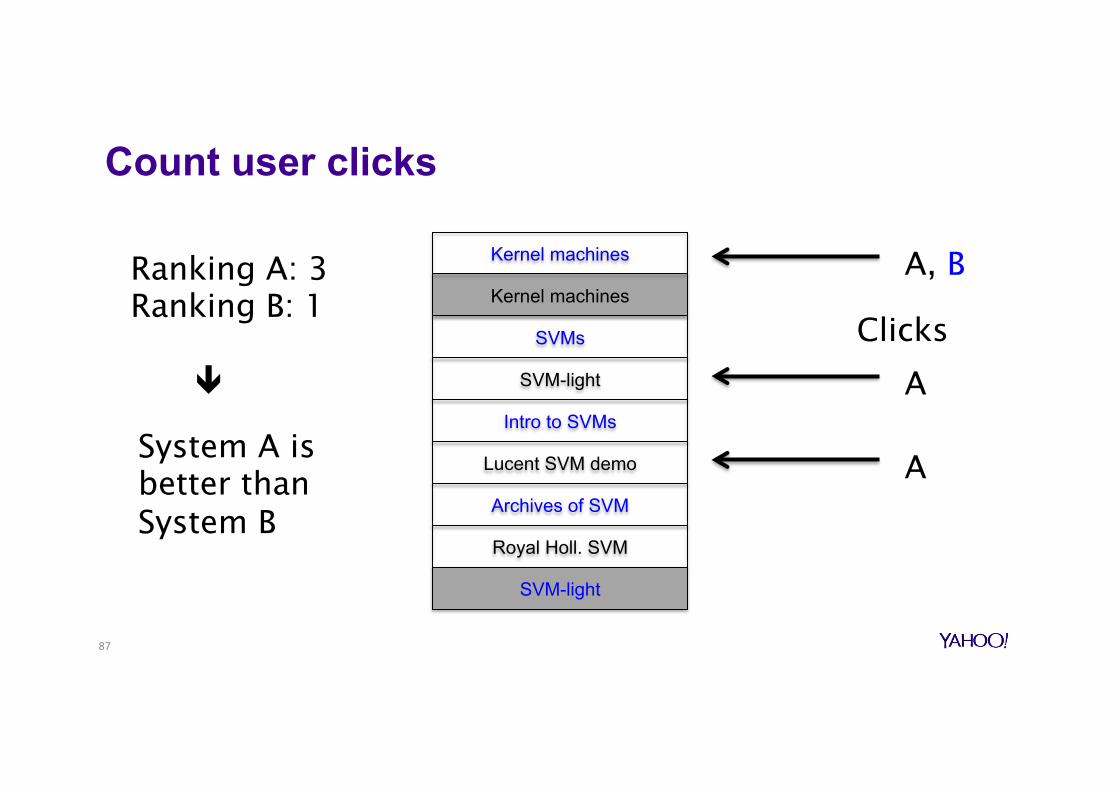
Count user clicks
87
Kernel machines
SVM-light
Lucent SVM demo
Royal Holl. SVM
Kernel machines
SVMs
Intro to SVMs
Archives of SVM
SVM-light
Clicks
Ranking A: 3 Ranking B: 1 ê
A, B
A
A System A is better than System B
88
o Focus on measuring its effectiveness rather than efficiency
o We recall that: - Effectiveness is the ability to make the right classification decision - Efficiency is concerned with time and space requirement
Evaluation of classifiers
89
Evaluation of classifiers
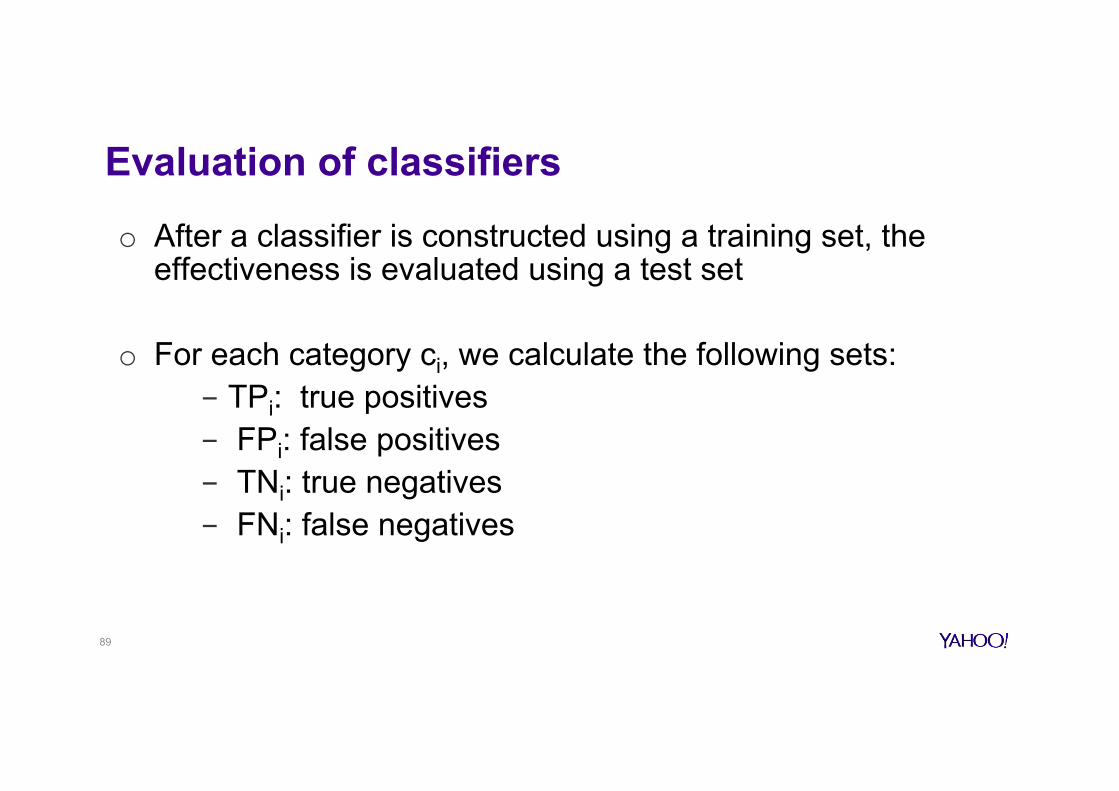
o After a classifier is constructed using a training set, the effectiveness is evaluated using a test set
o For each category ci, we calculate the following sets: - TPi: true positives - FPi: false positives - TNi: true negatives - FNi: false negatives
90
True and false positives with respect to a cageory
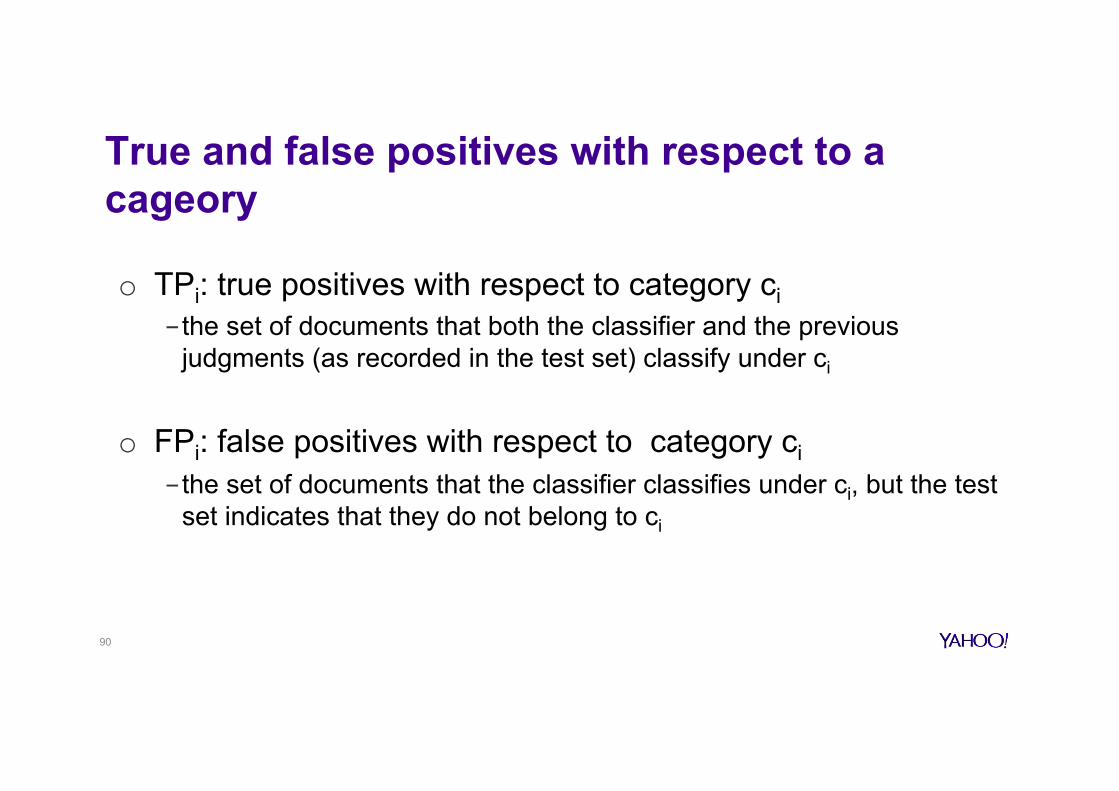
o TPi: true positives with respect to category ci - the set of documents that both the classifier and the previous
judgments (as recorded in the test set) classify under ci
o FPi: false positives with respect to category ci - the set of documents that the classifier classifies under ci, but the test
set indicates that they do not belong to ci

91
o TNi: true negatives with respect to category ci - both the classifier and the test set agree that the documents in
TNi do not belong to ci
o FNi: false negatives with respect to category ci - the classifier do not classify the documents in FNi under ci, but
the test set indicates that they should be classified under ci
True and false negatives with respect to a cageory
92
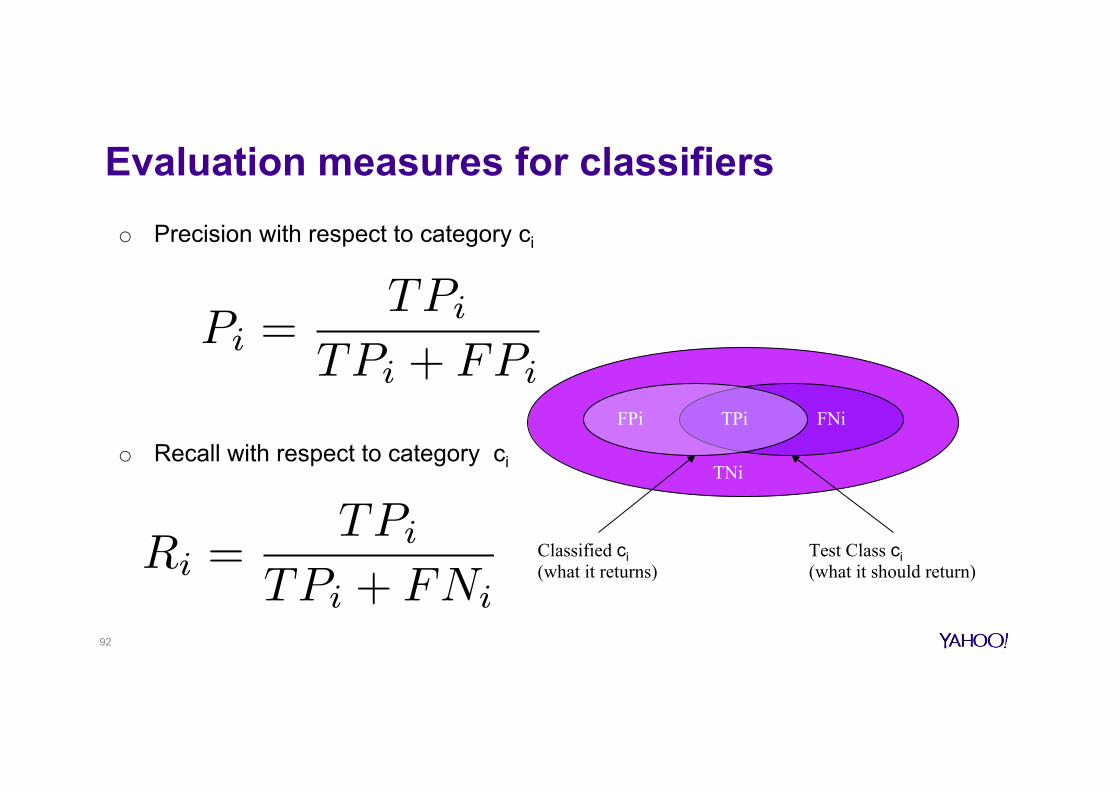
Evaluation measures for classifiers o Precision with respect to category ci
o Recall with respect to category ci TPi FPi FNi
TNi
Classified ci (what it returns)
Test Class ci (what it should return)
Pi =TPi
TPi + FPi
Ri =TPi
TPi + FNi

93
Evaluation measures for classifiers
o for obtaining estimates for precision and recall in the collection as a whole, two different methods may be adopted:
- Micro-averaging counts for true positives, false positives and false negatives for all categories are first summed up precision and recall are calculated using the global values
- Macro-averaging average of precision (recall) for individual categories

94
Micro- vs macro-averaging
o microaveraging and macroaveraging may give quite different results, if the different categories have very different generality
o e.g. the ability of a classifier to behave well also on categories with low generality (i.e. categories with few positive training instances) will be emphasized by macroaveraging
o choice depends on the application
Conclusions … some few words o Here we solely focused on system-oriented evaluation. We should not
forget about user-oriented evaluation o Here we focus on batch-style evaluation. We should not forget that
search is part of a bigger task. o At the end, it is all about making the users “happy”. We should not forget
about long-term engagement. o Lots of work and research looked beyond precision and recall, in terms of
validations, extensions or alternatives o Lots of work such as “significance testing” so that we can be sure that IR
system A is indeed better than IR system B. o Here we focused on “document” and text. We should not forget
multimedia, mobile, social media, etc, where evaluating effectiveness may mean something a bit different.
95