Embed Size (px)
Citation preview

Physical Rehabilitation Specialists ◦ Physical Therapist
◦ Occupational Therapist
◦ Speech Therapist
Required annual continuing education
Over 520,000 Rehab Specialists in US
520,000 Therapist spend over $200 million to $400 million annually
Our sister company spends up to $900 annually per clinician
Have Physical and Occupational Therapist ownership
Have a database of over 25,000 clinicians
Use database for job placement
Large hospital system requested we market continuing education courses with our database
Successfully marketed the courses
Hospital has subsequently used us for other courses
Used database to email market continuing education
Learned this is a needed profitable service
Email marketing saves 85% versus mail marketing ◦ Continuing Education business is still very heavily
mail promoted
◦ Cost saved in promotion drives business to us
We have low fixed and variable cost ◦ Incubated this business in existing business
◦ Generating gross $30,000 annually
◦ 70% profit margin
Mail and email marketing is generally the same ◦ Generic brochures are mailed and emailed
I have received over $80 in brochures the first 6 months of this year ◦ I have not registered for course using brochures in
years
Will change standard marketing ◦ 60 second video feed of instructor
◦ Relevant and interesting clinical information
◦ Advise instructor on how to present video for better results
◦ Will have sample video
Video feed advertising course increases registration ◦ Free advice and sample video how to increase
registration
Save money on mailout ◦ Mailouts cost over $1 each
Very little to no upfront cost
Contract rate based per registrant
Instructor can still use Email method ◦ Up to 85% savings versus standard direct mail
Cost saving for storing and maintaining diplomas Each diploma can cost $5 each not including mailing
Universities can use for surveys ◦ Many schools still direct mail surveys
◦ Will advise and promote survey presentation to increase completion.
Will give the clinician free information ◦ Latest research
◦ Evidence base clinical techniques
◦ Impart knowledge for free
Some classes may be able to tie directly to research articles
Website will maintain diploma record of courses
Will have continuing education courses ◦ Displayed with video feed
Research article displayed ◦ Encouraged site clicks
Bring social media traffic to website
Will have E commerce ◦ Able to purchase course online
◦ Instructor has15-30% fee per registrant
Continuing education instructor pay posting fee ◦ May be able to give instructor online access to
diplomas for small charge even when registrant does not use TherapyLinked
Can continue using established email marketing
Expand to >250,000 to 500,000 database ◦ Online scraping
◦ Registration online website
◦ Social media to promote registration
Capture clinician data by instructor using diploma templates for non registrants through website
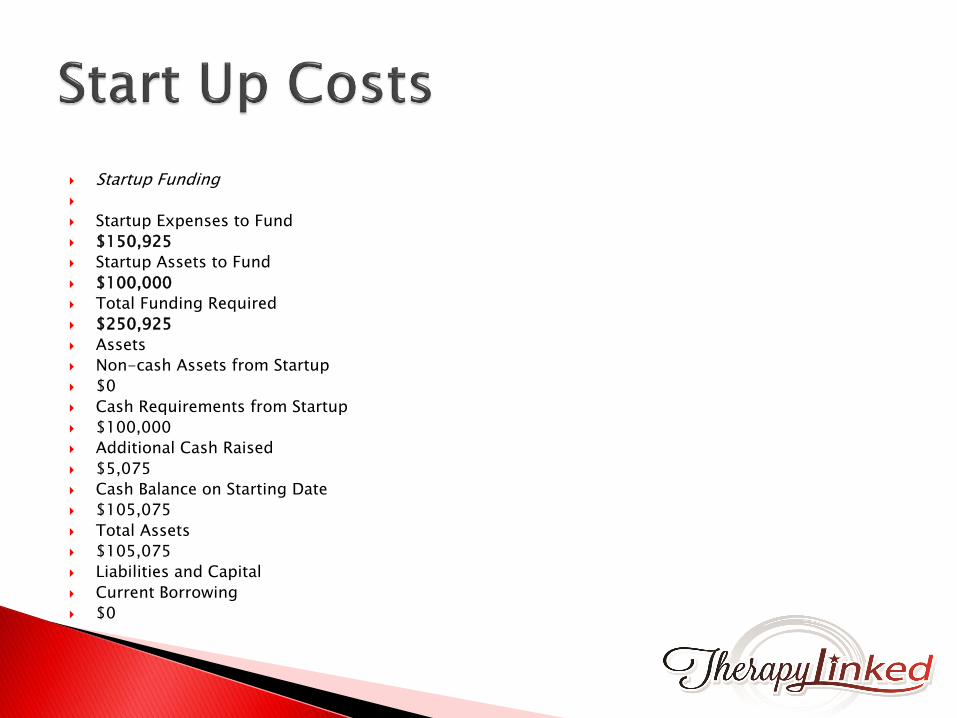
Startup Funding
Startup Expenses to Fund
$150,925
Startup Assets to Fund
$100,000
Total Funding Required
$250,925
Assets
Non-cash Assets from Startup
$0
Cash Requirements from Startup
$100,000
Additional Cash Raised
$5,075
Cash Balance on Starting Date
$105,075
Total Assets
$105,075
Liabilities and Capital
Current Borrowing
$0
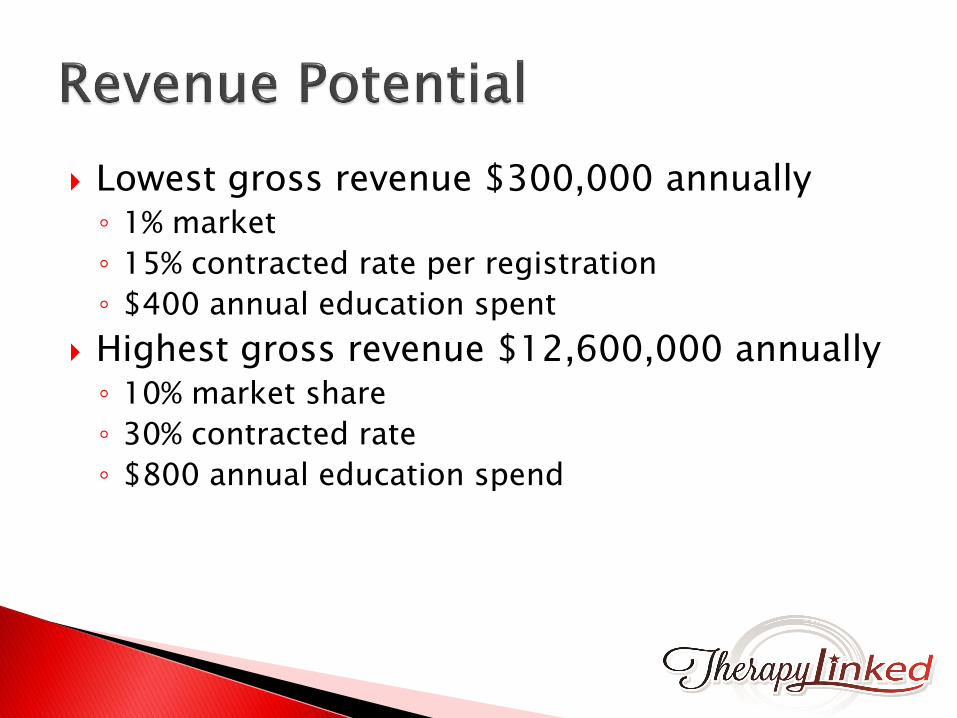
Lowest gross revenue $300,000 annually ◦ 1% market
◦ 15% contracted rate per registration
◦ $400 annual education spent
Highest gross revenue $12,600,000 annually ◦ 10% market share
◦ 30% contracted rate
◦ $800 annual education spend
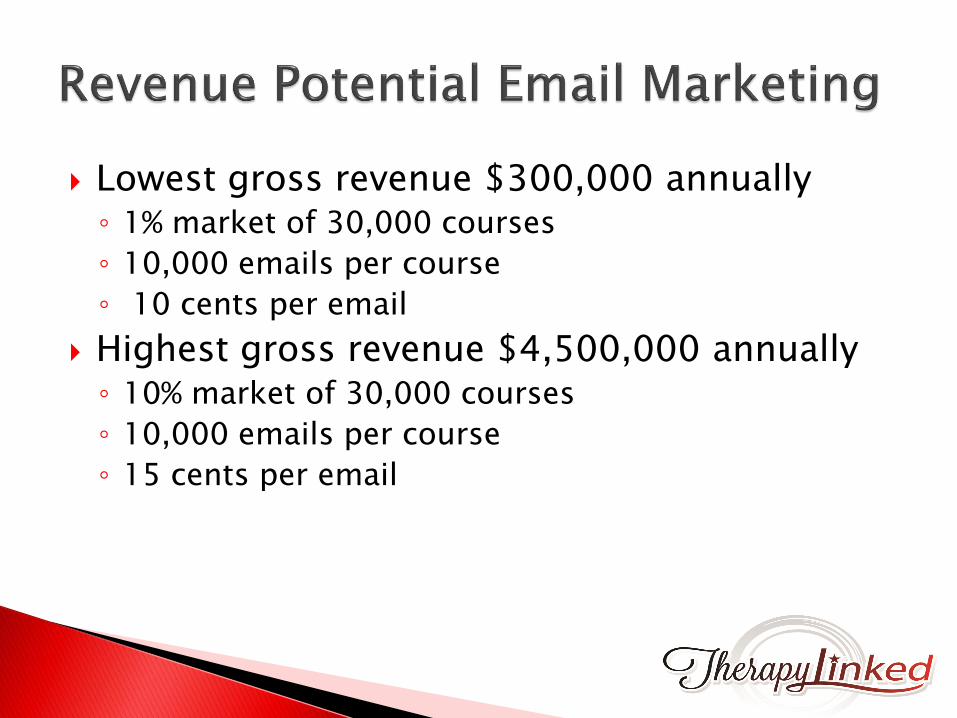
Lowest gross revenue $300,000 annually ◦ 1% market of 30,000 courses
◦ 10,000 emails per course
◦ 10 cents per email
Highest gross revenue $4,500,000 annually ◦ 10% market of 30,000 courses
◦ 10,000 emails per course
◦ 15 cents per email
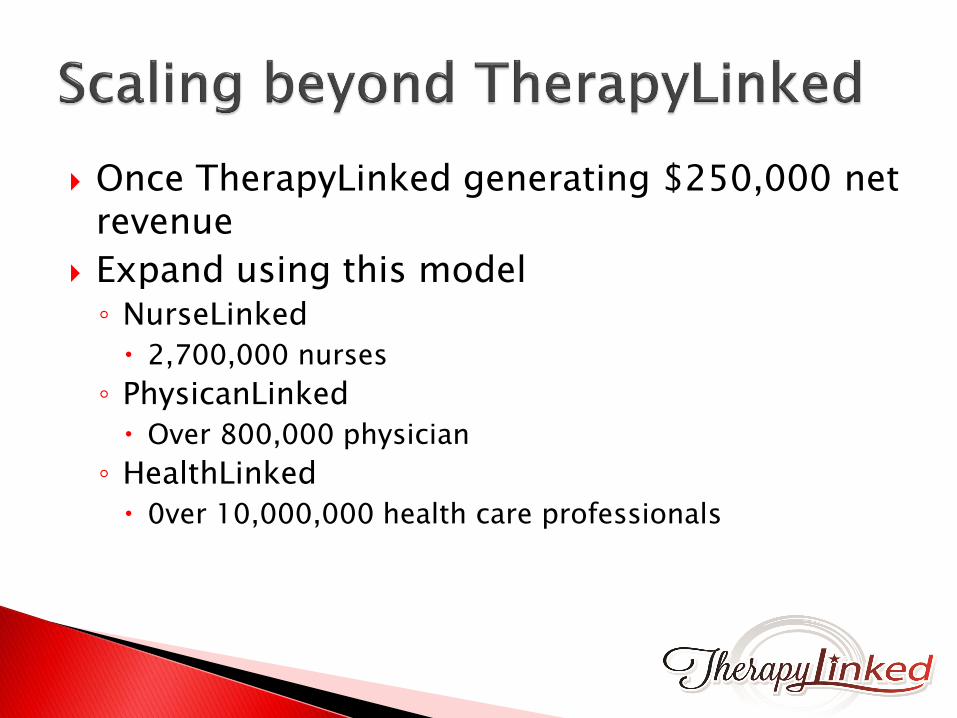
Once TherapyLinked generating $250,000 net revenue
Expand using this model ◦ NurseLinked
2,700,000 nurses
◦ PhysicanLinked
Over 800,000 physician
◦ HealthLinked
0ver 10,000,000 health care professionals
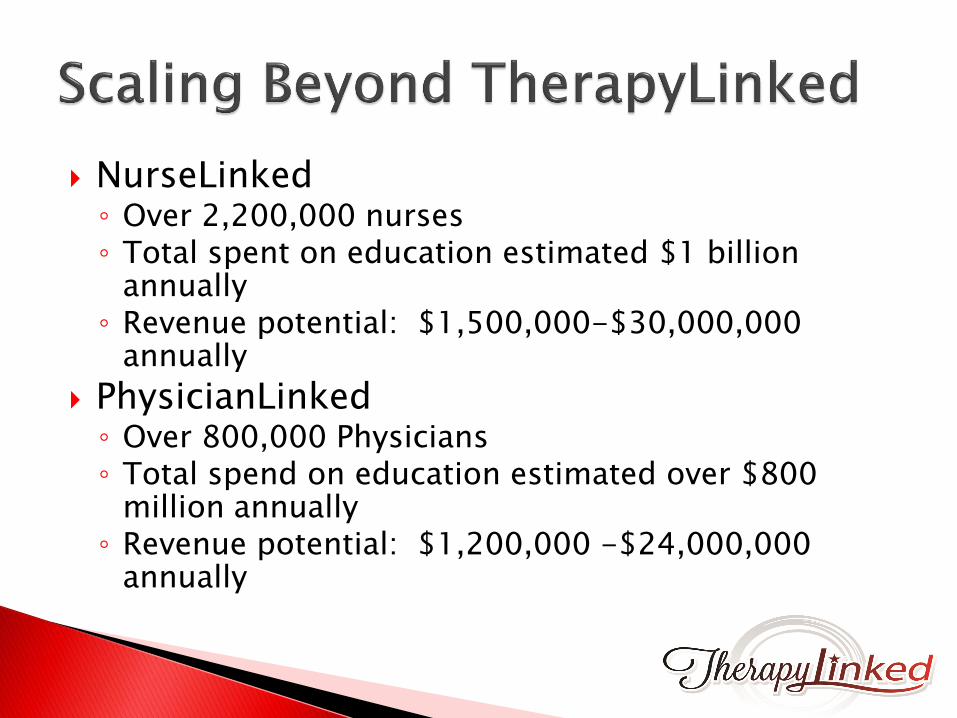
NurseLinked ◦ Over 2,200,000 nurses ◦ Total spent on education estimated $1 billion
annually ◦ Revenue potential: $1,500,000-$30,000,000
annually
PhysicianLinked ◦ Over 800,000 Physicians ◦ Total spend on education estimated over $800
million annually ◦ Revenue potential: $1,200,000 -$24,000,000
annually
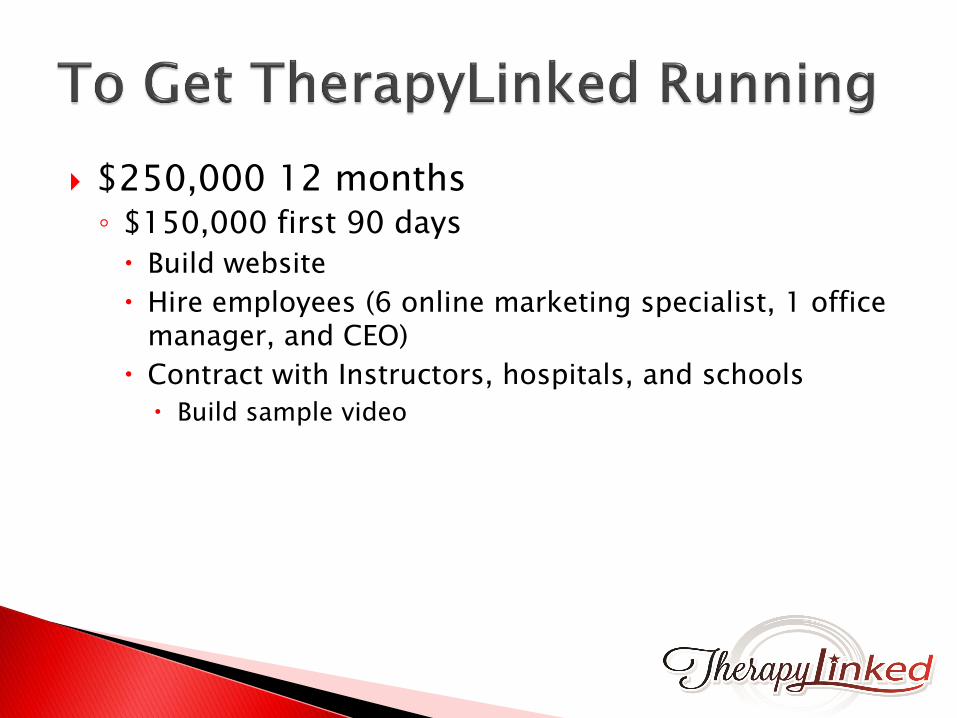
$250,000 12 months ◦ $150,000 first 90 days
Build website
Hire employees (6 online marketing specialist, 1 office manager, and CEO)
Contract with Instructors, hospitals, and schools
Build sample video
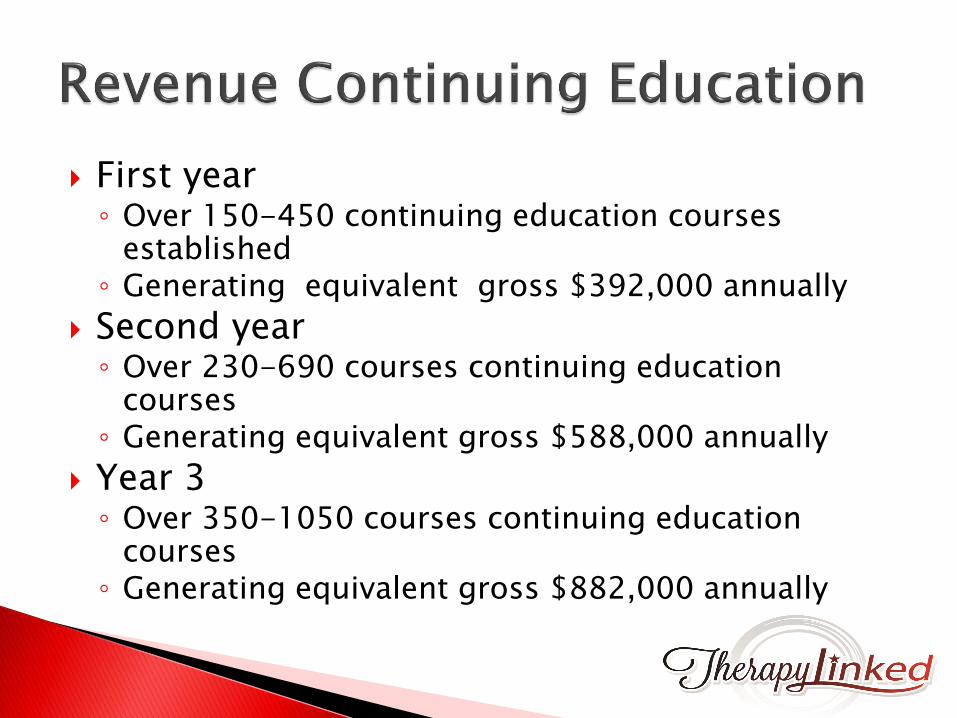
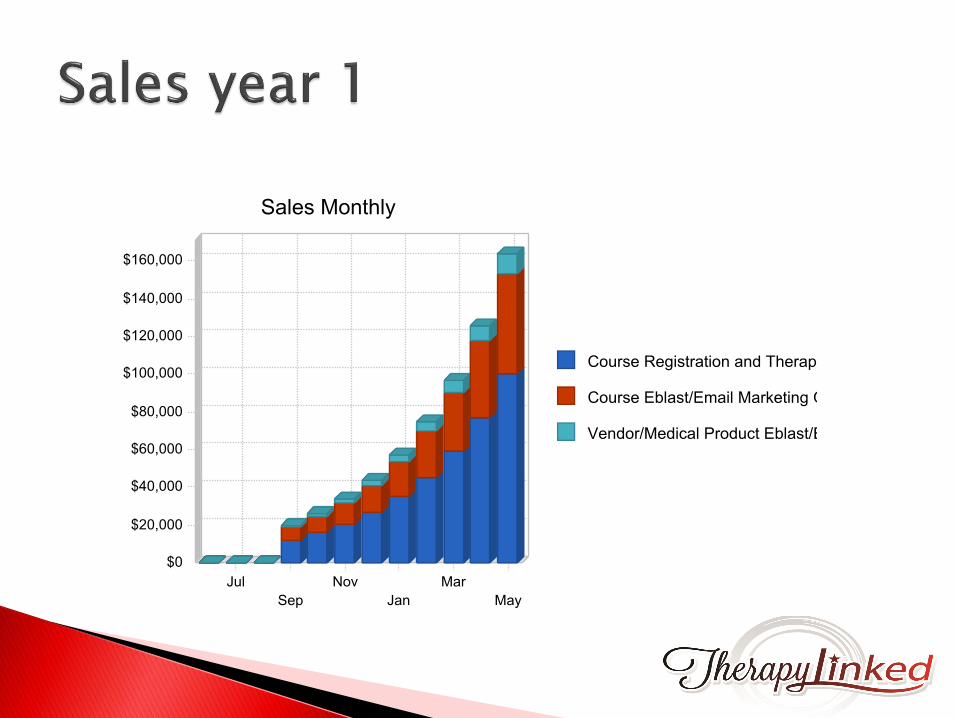
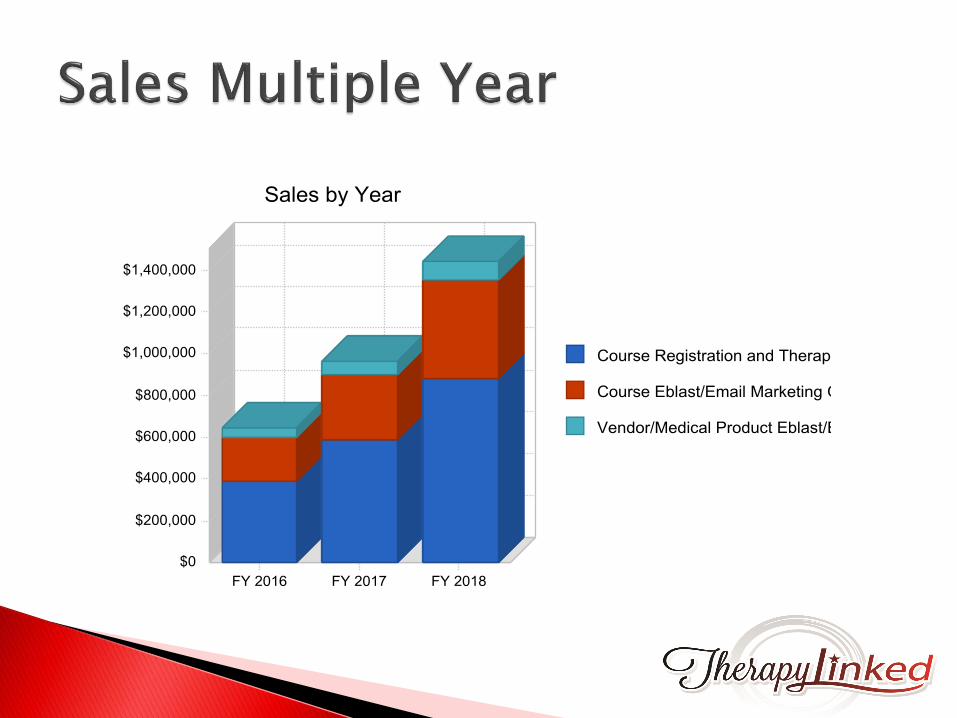
First year ◦ Over 150-450 continuing education courses
established ◦ Generating equivalent gross $392,000 annually
Second year ◦ Over 230-690 courses continuing education
courses ◦ Generating equivalent gross $588,000 annually
Year 3 ◦ Over 350-1050 courses continuing education
courses ◦ Generating equivalent gross $882,000 annually
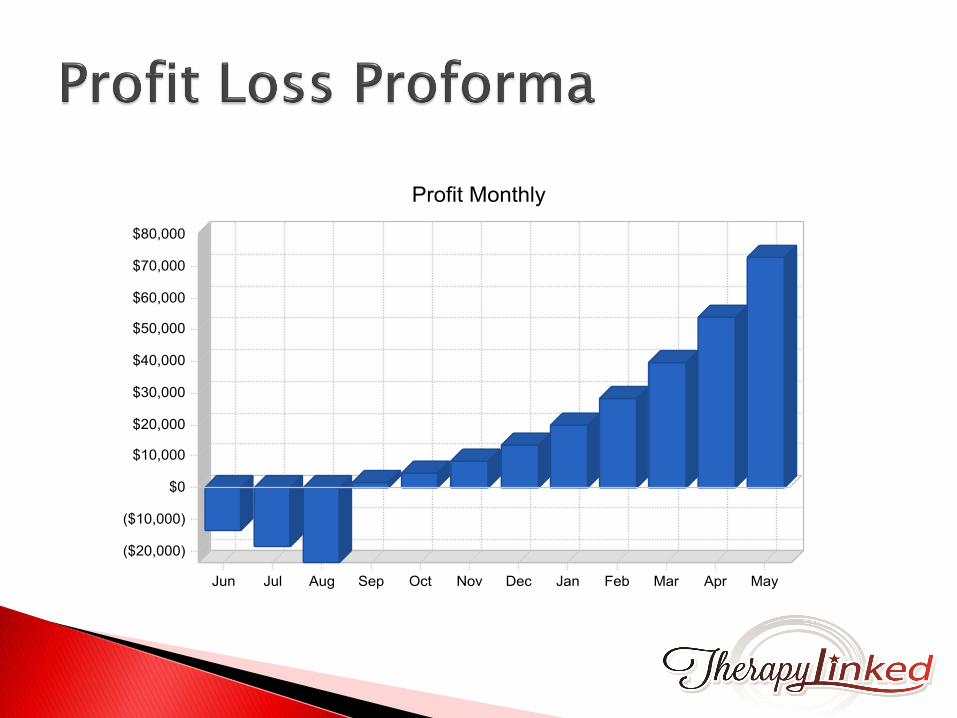
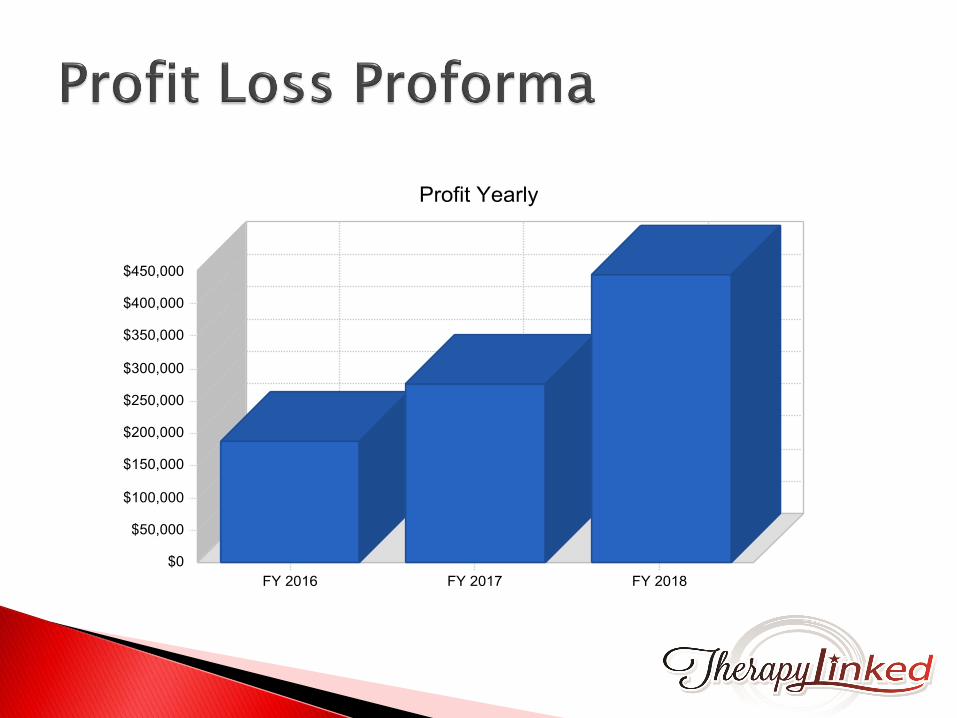
Year 1 ◦ $208,000 gross revenue
Year 2 ◦ $312,000 gross revenue
Year 3 ◦ $468,000 gross revenue
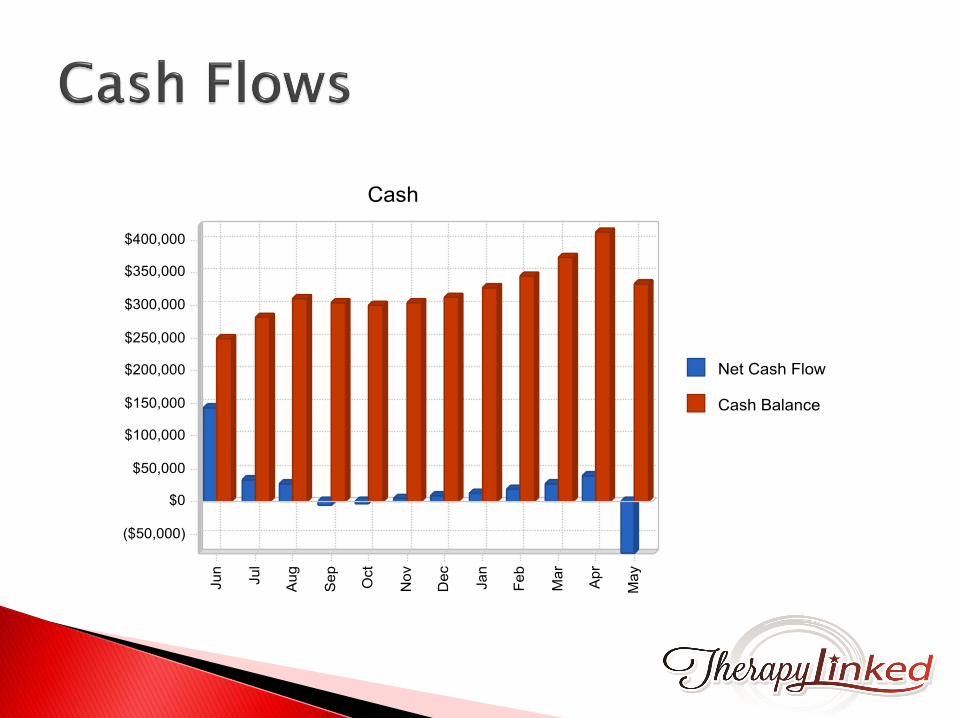
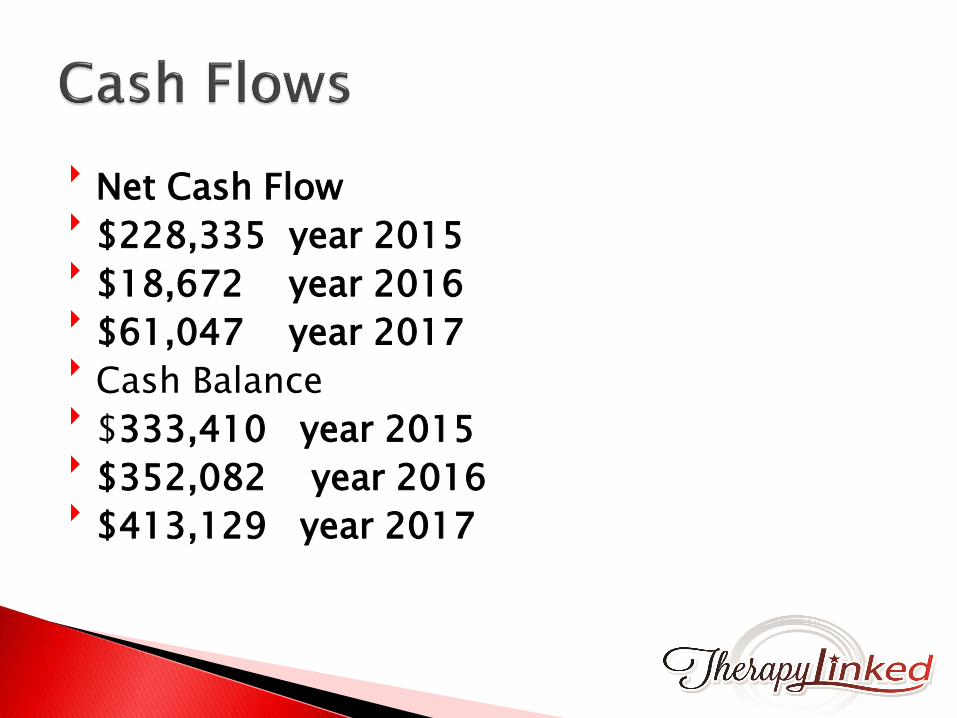
Net Cash Flow $228,335 year 2015 $18,672 year 2016 $61,047 year 2017 Cash Balance $333,410 year 2015 $352,082 year 2016 $413,129 year 2017
Software development into large hospitals established software ◦ Become the sole continuing education provider for
large institutes
◦ Software backdoor opens new opportunities for other business lines (purchasing, advertisement)
◦ Daily training for personnel
Relationship with computer animation startup
Will be the authority for physical rehabilitation continuing education marketing
High value site for course reviews
Advance clinical knowledge through research article postings
The springboard to full health care continuing education and training business