Embed Size (px)
Citation preview
Unravelling low-flow, low-gradient aortic stenosis
The Role of ImagingProf. Fausto J. Pinto, FESC, FACC
Head, Cardiology Dpt/University Hospital Sta Maria-HPV
University of Lisbon, Portugal

• No conflict of interest to declare regarding this talk.
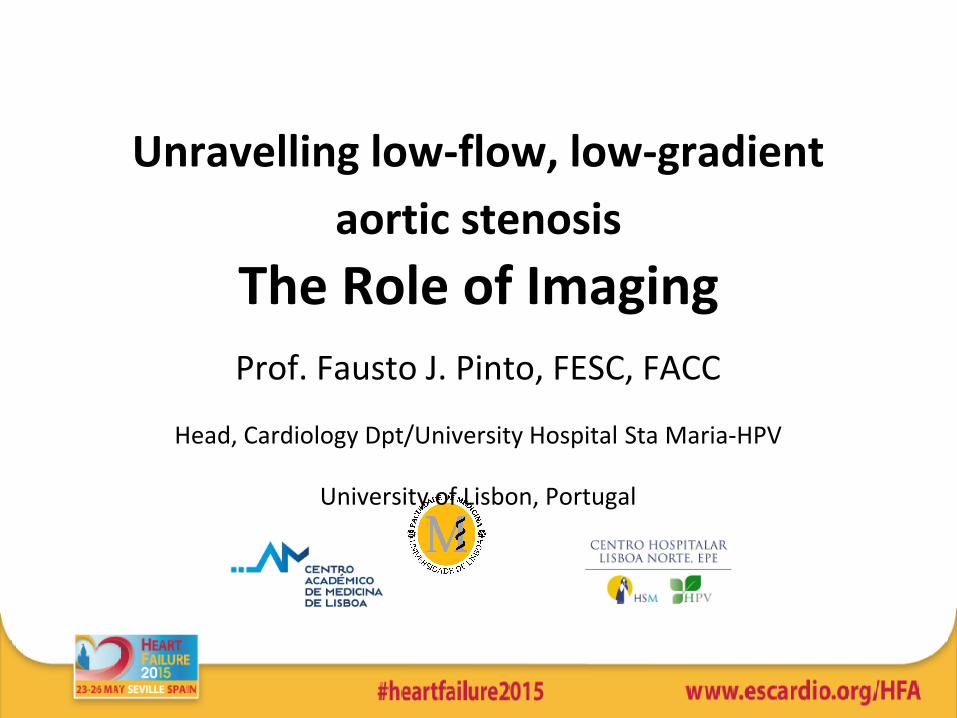
Philippe Pibarot , Jean G. Dumesnil
Different Patterns of Severe AS According to Flow, Gradient, and LV Geometry
Journal of the American College of Cardiology, Volume 60, Issue 19, 2012, 1845 - 1853

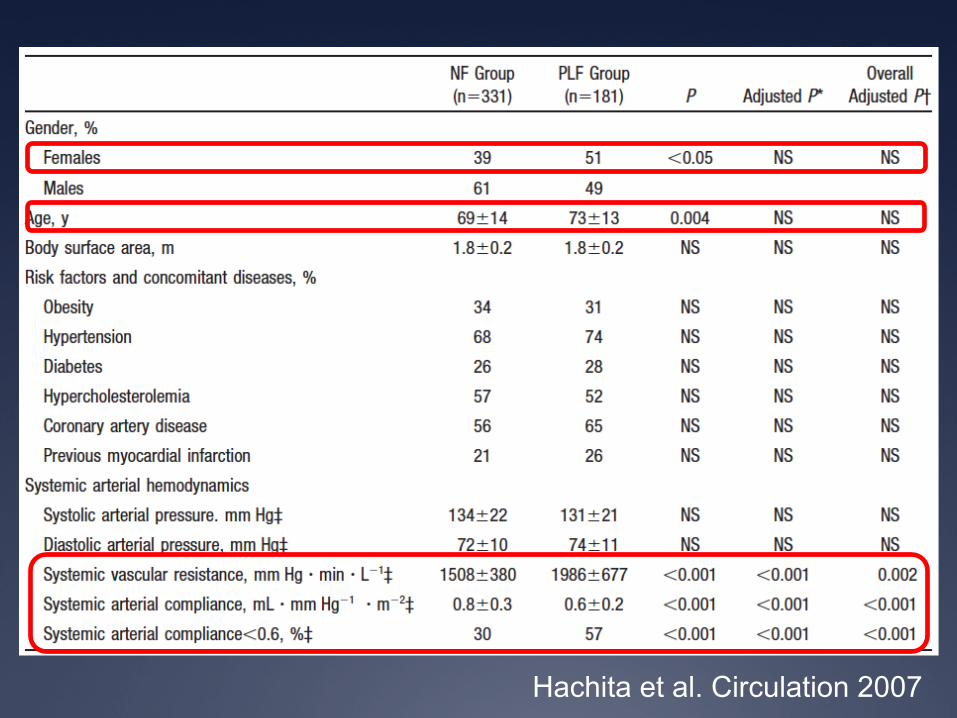
Hachita et al. Circulation 2007
512 pts with Severe AS AVA≤ 0,6 cm2/m2, EF >50%
331 ptsSystolic Vol > 35 ml/m2
181 ptsSystolic Vol ≤ 35 ml/m2
Follow-up 25±19 months
Hachita et al. Circulation 2007

Geometry and LV Function
Hachita et al, 2007

Survival
Hachita et al. Circulation 2007

Predictors of Survival
Hachita et al. Circulation 2007
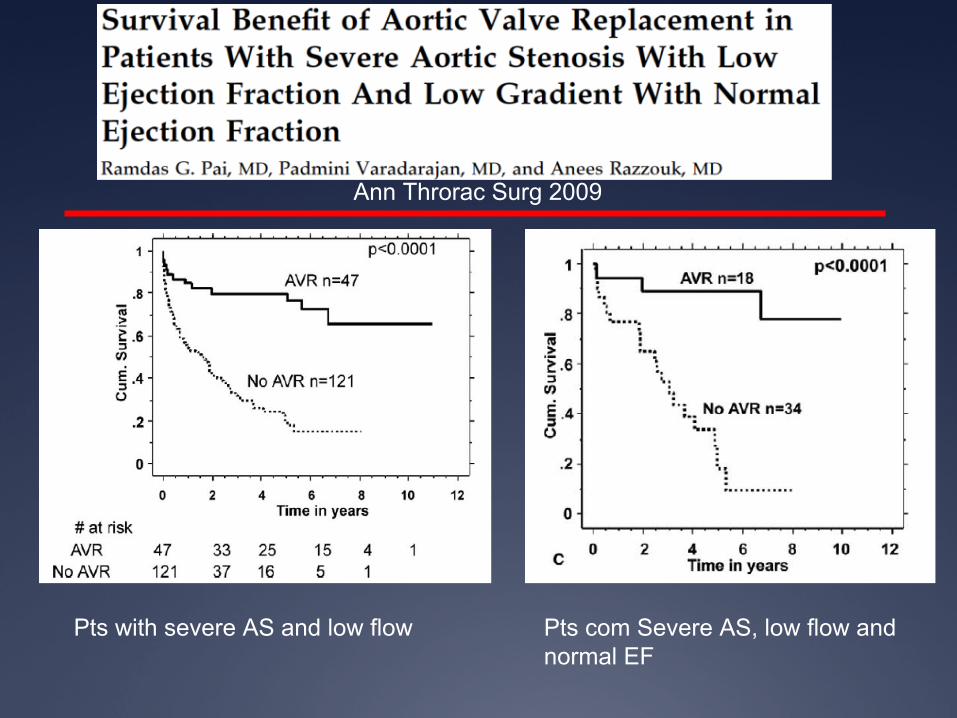
Pts with severe AS and low flow Pts com Severe AS, low flow and normal EF
Ann Throrac Surg 2009

These studies suggest…
• A significant proportion of pts with reduced AVA may have low flow and low gradient despite preserved EF.
• A pattern of increased afterload, concentric LVH and impaired survival suggests a more advanced stage of AS.
• This situation may be under diagnosed and not be timely treated with surgery.
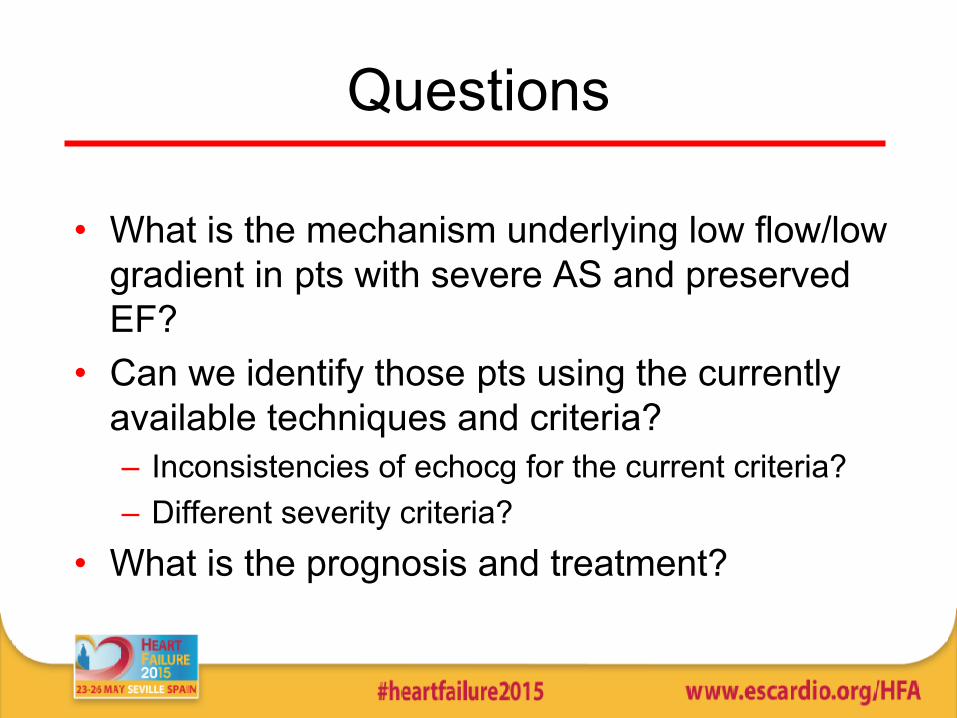
Questions
• What is the mechanism underlying low flow/low gradient in pts with severe AS and preserved EF?
• Can we identify those pts using the currently available techniques and criteria? – Inconsistencies of echocg for the current criteria? – Different severity criteria?
• What is the prognosis and treatment?
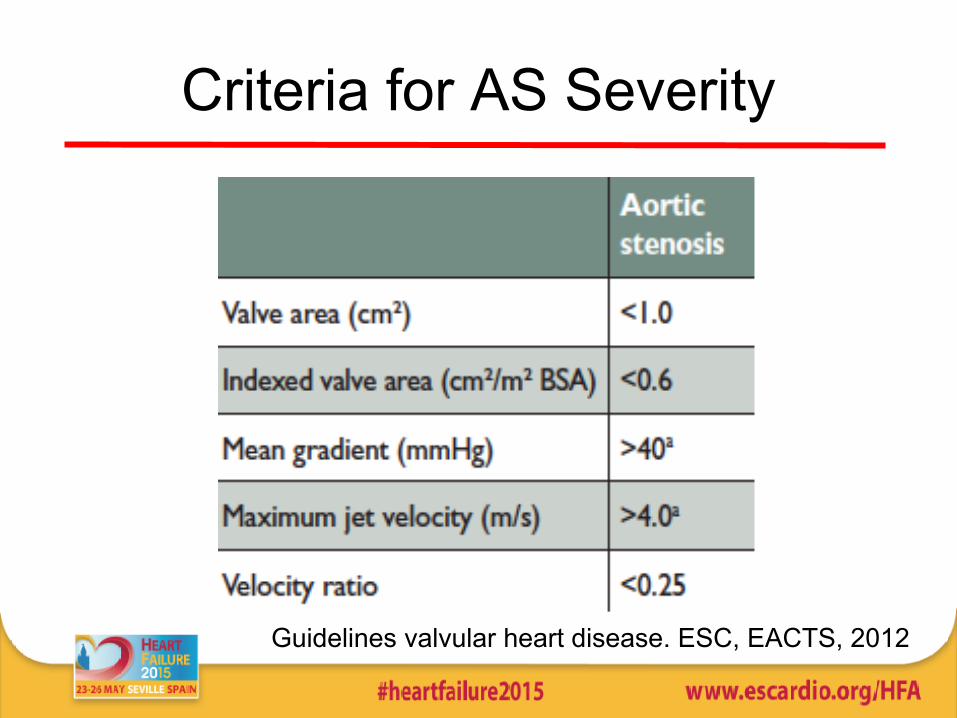
Criteria for AS Severity
Guidelines valvular heart disease. ESC, EACTS, 2012
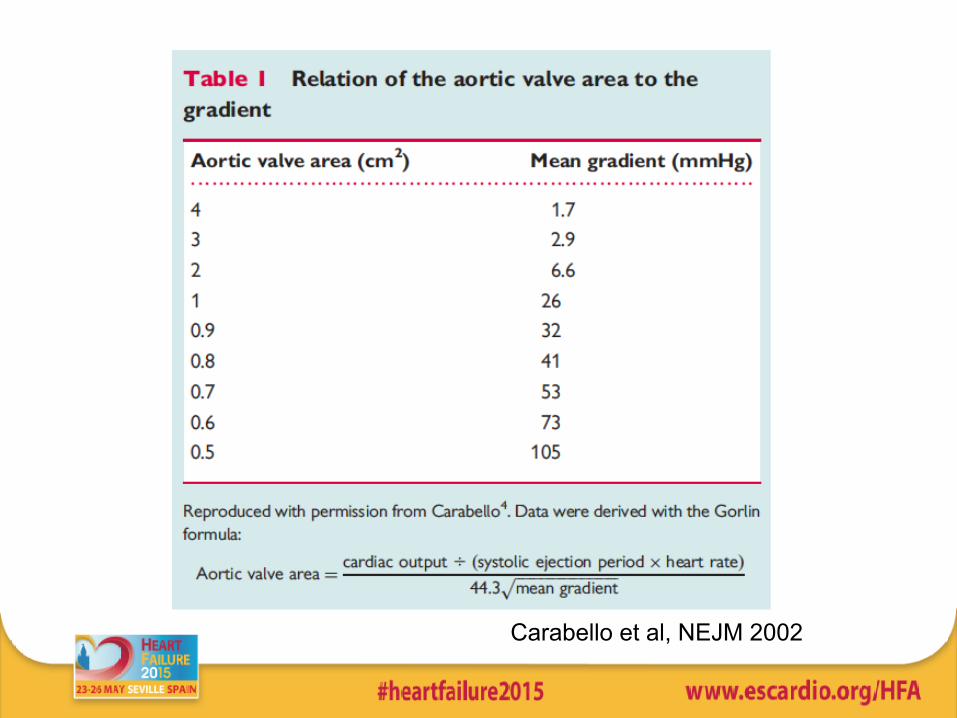
Carabello et al, NEJM 2002
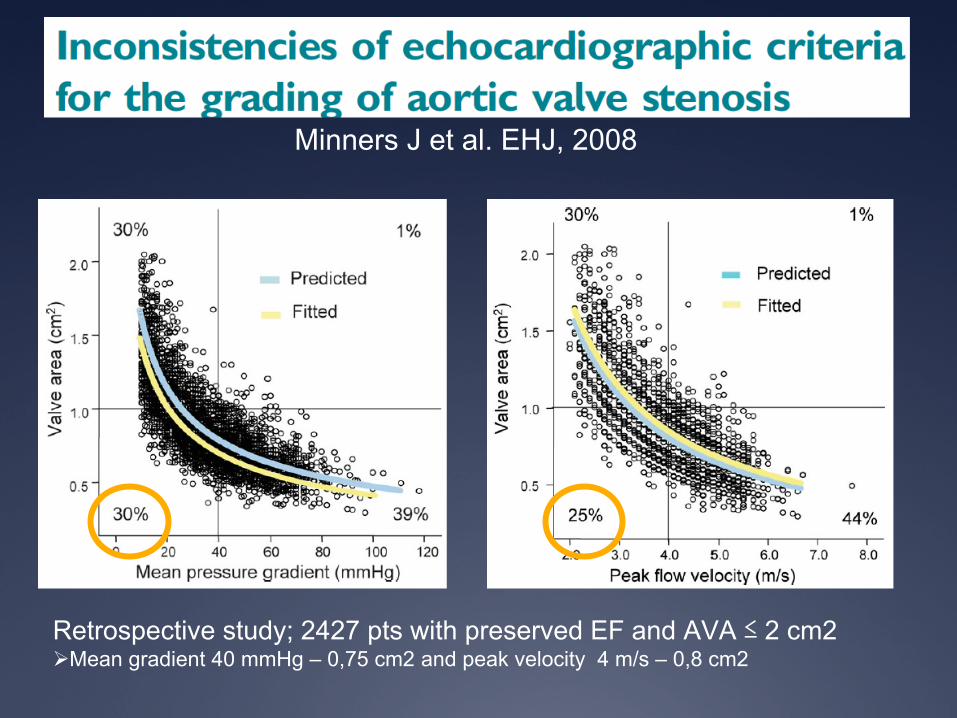
Minners J et al. EHJ, 2008
Retrospective study; 2427 pts with preserved EF and AVA ≤ 2 cm2Ø Mean gradient 40 mmHg – 0,75 cm2 and peak velocity 4 m/s – 0,8 cm2

AVA < 0,8 cm2
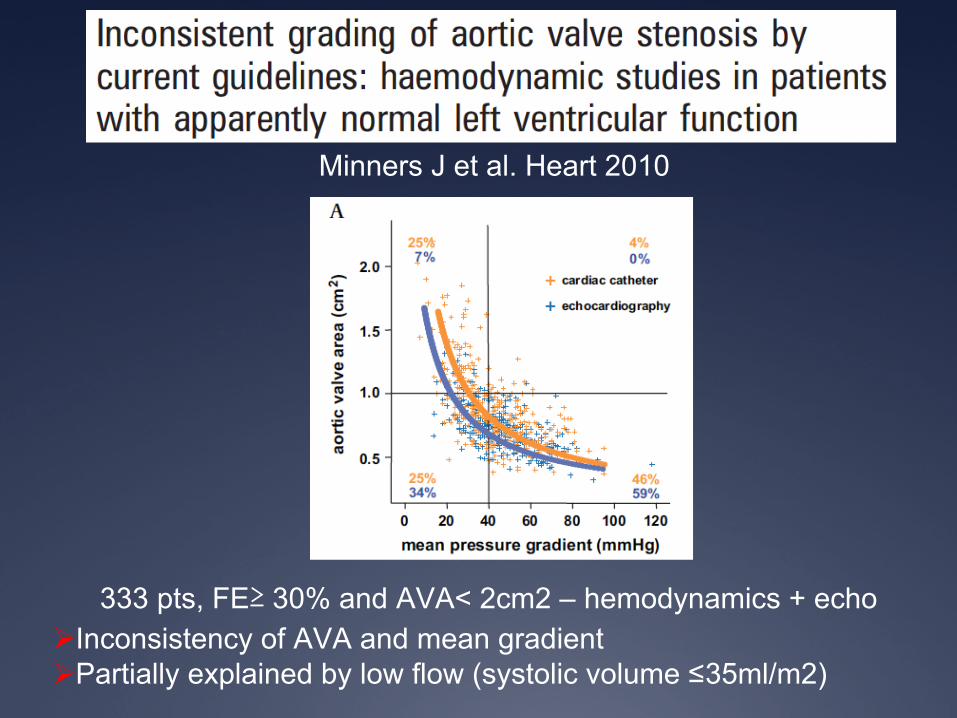
333 pts, FE≥ 30% and AVA< 2cm2 – hemodynamics + echoØ Inconsistency of AVA and mean gradientØ Partially explained by low flow (systolic volume ≤35ml/m2)
Minners J et al. Heart 2010
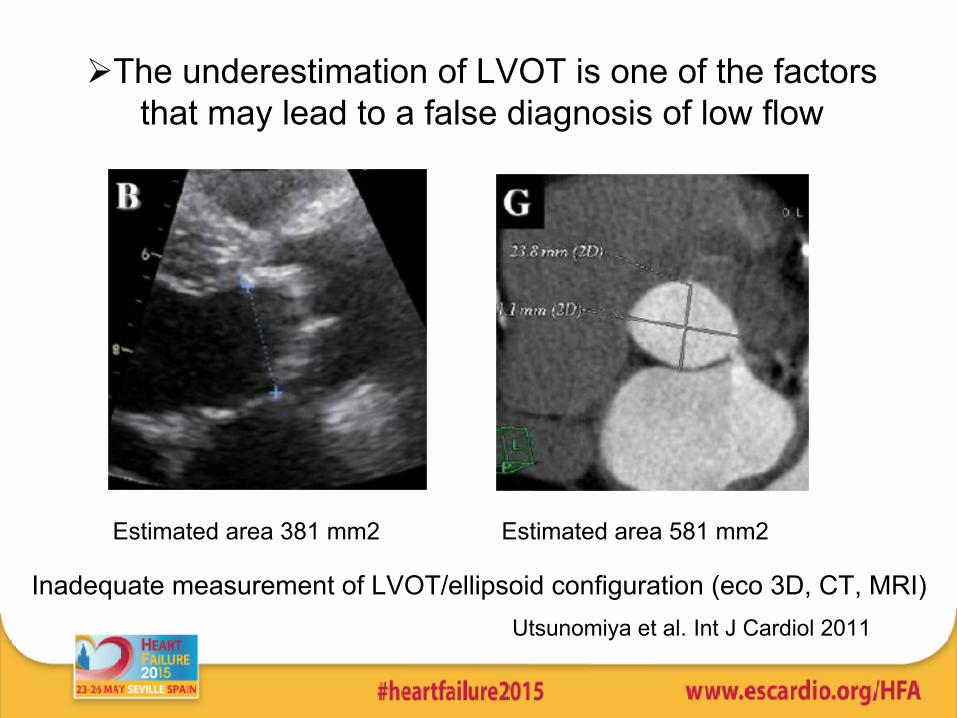
Ø The underestimation of LVOT is one of the factors that may lead to a false diagnosis of low flow
Estimated area 381 mm2 Estimated area 581 mm2
Inadequate measurement of LVOT/ellipsoid configuration (eco 3D, CT, MRI)Utsunomiya et al. Int J Cardiol 2011

- Handgrip and fenilefrine- Presence of HTN pseudodiagnosis of low flow impair the AoV resistance and AVA, regardless of aortic compliance; in addition the gradient has an inconsistent variability
Litle SH et al. Heart 2007

If we exclude the inconsistencies how to
explain?

1. Increased vascular afterload
• Increase of the vascular afterload (age, atherosclerosis) and valvular– Symptoms in pts with moderate AS– Increased valvulo-arterial impedance and
impaired vascular compliance associated with LV dysfunction in AS in the older pts (Briand etl, JACC 2005)
– Increased in pts with severe AS and low flow (Hachita et al 2009)

2. Diastolic Dysfunction
• Geometry: – Small size LV (<50 mm, < 60 ml/m2),– Hypertrophy
• Diastolic Compromise• Incremental effect if associated to
increased systemic afterload + valvular
Dumesnil et al. Eur Heart J 2010

3. FEJ preservada ≠ Função preservada
FEJ=55% SL global=-15%
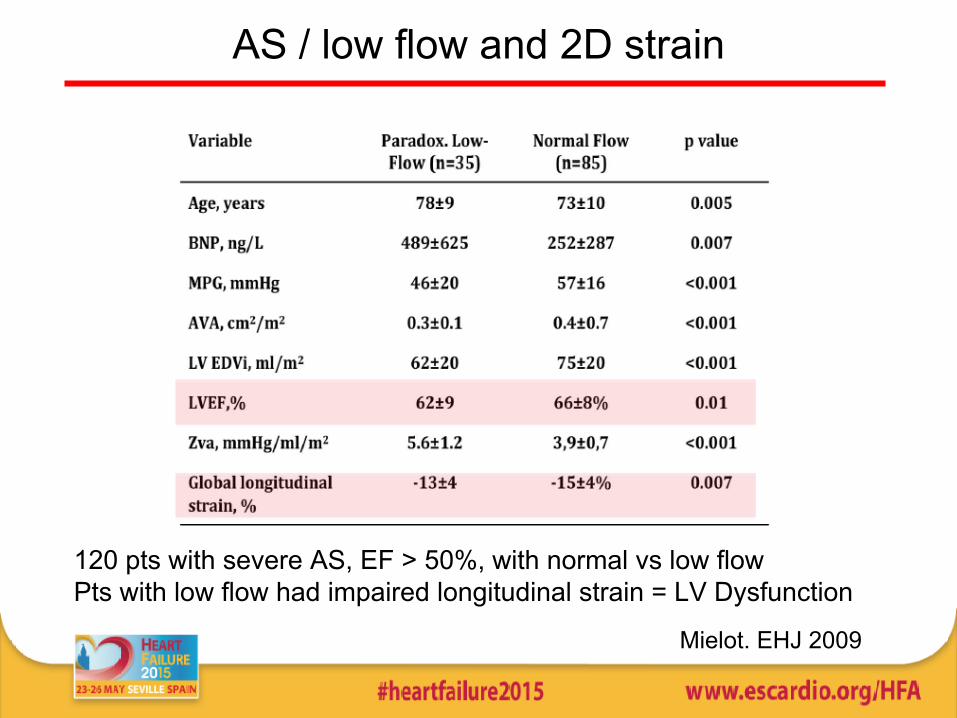
AS / low flow and 2D strain
120 pts with severe AS, EF > 50%, with normal vs low flow Pts with low flow had impaired longitudinal strain = LV Dysfunction
Mielot. EHJ 2009
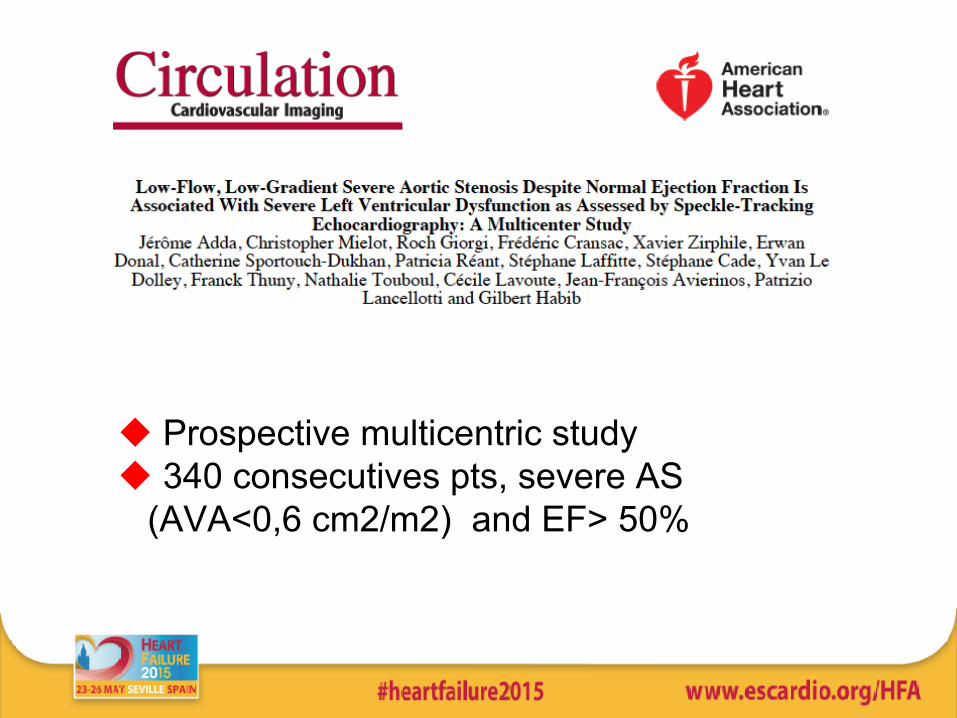
u Prospective multicentric studyu 340 consecutives pts, severe AS
(AVA<0,6 cm2/m2) and EF> 50%

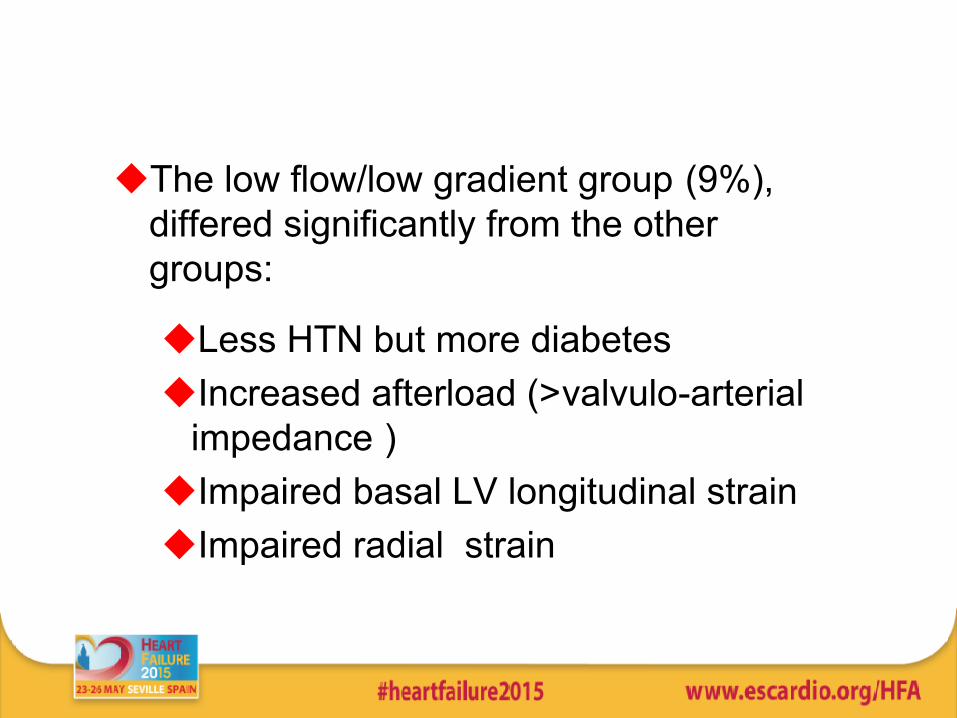
uThe low flow/low gradient group (9%), differed significantly from the other groups:
uLess HTN but more diabetesuIncreased afterload (>valvulo-arterial
impedance )uImpaired basal LV longitudinal strain uImpaired radial strain

Pibarot P, Dusmenil et al. Circulation 2013
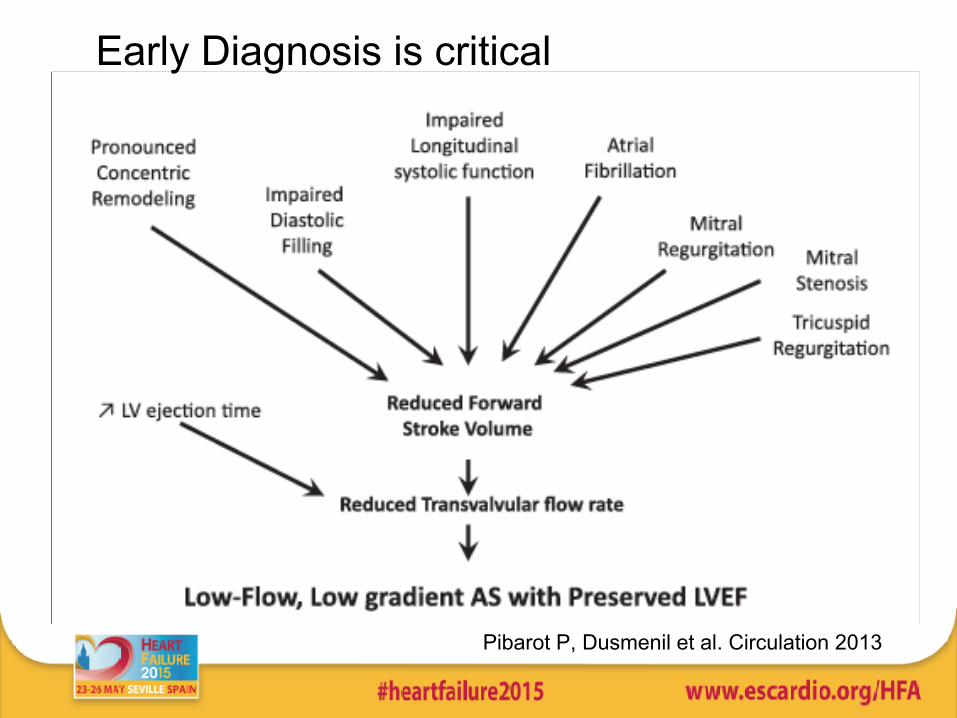
Early Diagnosis is critical

How to Assess - I• 1. Exclude pitfals
– LVOT measurement,– Assess EF by two different – Use CMR and CT (LVOT; LV function)
• 2. Assess the indices of myocardial deformation• 3. Confirm low flow low output; • 4. Assess biomarkers
Dumesnil et al. EHJ 2010

How to Assess - II• 4.Additional indices
of AS severity– Energy loss index;
Ao<30mm– Increased resistance– AoV Calcification +++
• 5. Conditioning Factors:– > valvulo-vascular
impedance – < aortic compliance – Small and hypertrophic LV– Females
Conclusions
• Severe AS with low flow and preserved EF may represent up to 25% of the AS Population
• Medical treatment is associated with an increased event rate and mortality but surgery can improve the diagnosis
• Its identification and diagnosis are crucial• Imaging plays a central role in the correct
diagnosis and patient management