Embed Size (px)
Citation preview

A European framework for designing and evaluating policiesand actions to level-up the gradient in health inequalitiesamong children, young people and their families
THE GRADIENT EVALUATION FRAMEWORK
T a c k l i n g t h e
i n h e a l t hi n h e a l t h
Professor John Kenneth DaviesDr Nigel Sherriff
GEF
T a c k l i n g t h e
i n h e a l t hi n h e a l t h
Copyright © remains with the author(s) on behalf of the Gradient Consortium and the publisher.
Published by the University of Brighton
© University of Brighton, 2012
All rights reserved. No part of this report may be reprinted or reproduced or utilised in any form or by any electronic, mechanical, or othermeans, now known or hereafter invented, including photocopying and recording, or in any information storage or retrieval system, withoutpermission in writing from the publishers.
www.health-gradient.eu
The Gradient Project is co-funded by the European Union’s Seventh Framework Programme (EC Grant Agreement No. 223252). Neither theEuropean Commission nor any person acting on its behalf is liable for any use of the information contained in this publication.
Davies, J.K. and Sherriff, N.S. (2012). The gradient evaluation framework (GEF): A European framework for designing and evaluating policies andactions to level-up the gradient in health inequalities among children, young people and their families. Brighton: University of Brighton.
THE GRADIENT EVALUATION FRAMEWORK
GEF
Project Coordinator
1
T a c k l i n g t h e
i n h e a l t hi n h e a l t h
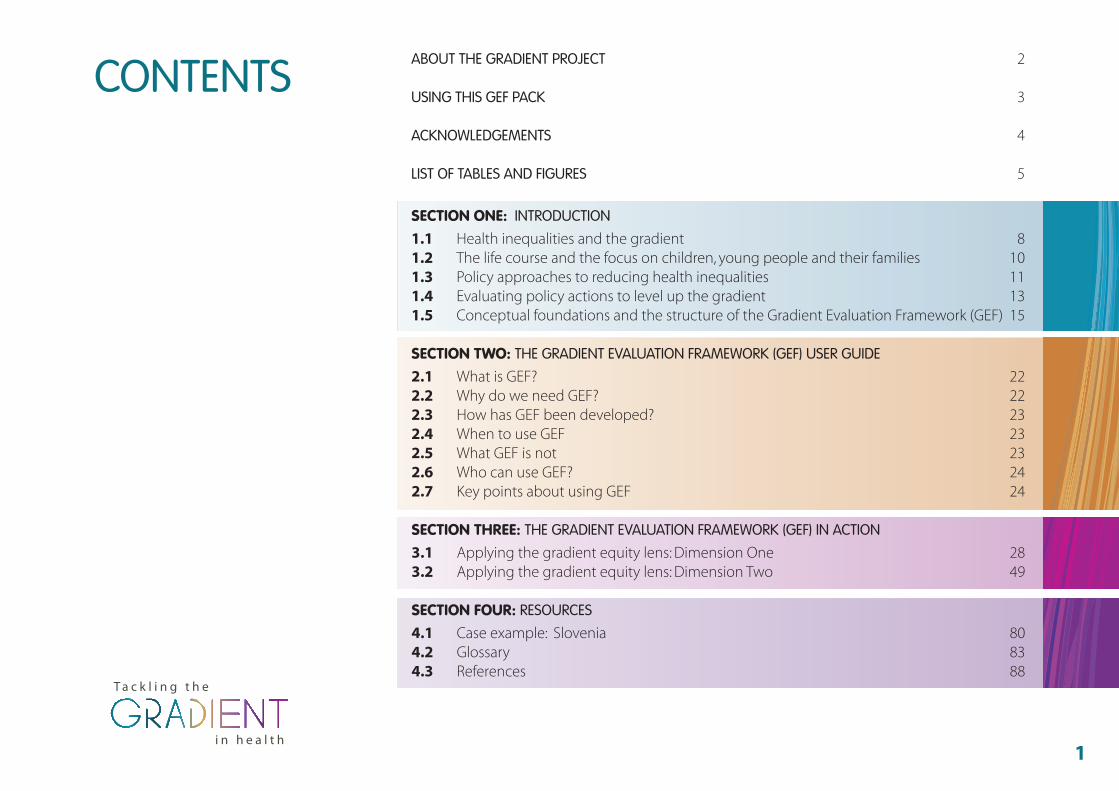
CONTENTSABOUT THE GRADIENT PROJECT 2
USING THIS GEF PACK 3
ACKNOWLEDGEMENTS 4
LIST OF TABLES AND FIGURES 5
SECTION ONE: INTRODUCTION
1.1 Health inequalities and the gradient 81.2 The life course and the focus on children, young people and their families 101.3 Policy approaches to reducing health inequalities 111.4 Evaluating policy actions to level up the gradient 131.5 Conceptual foundations and the structure of the Gradient Evaluation Framework (GEF) 15
SECTION TWO: THE GRADIENT EVALUATION FRAMEWORK (GEF) USER GUIDE
2.1 What is GEF? 222.2 Why do we need GEF? 222.3 How has GEF been developed? 232.4 When to use GEF 232.5 What GEF is not 232.6 Who can use GEF? 242.7 Key points about using GEF 24
SECTION THREE: THE GRADIENT EVALUATION FRAMEWORK (GEF) IN ACTION
3.1 Applying the gradient equity lens: Dimension One 283.2 Applying the gradient equity lens: Dimension Two 49
SECTION FOUR: RESOURCES
4.1 Case example: Slovenia 804.2 Glossary 834.3 References 88
(GEF) THE GRADIENT EVALUATION FRAMEWORK 2
INTRO
DU
CTION
T a c k l i n g t h e
i n h e a l t hi n h e a l t h
The Gradient Project is a collaborative research project involving 12institutions (universities, research institutes and public healthinstitutes) from all over Europe. The project is coordinated byEuroHealthNet and has received funding from the EuropeanCommunity’s Seventh Framework Programme (FP7 2007-2013) HealthResearch under grant agreement No. 223252.
As a core part of the project, the Gradient Evaluation Framework (GEF)has been developed as a European action-oriented policy tool toguide and inform technical experts in (modern) public health1
working at the Member State level. Linked directly to the policy cycle,GEF is designed to assist those involved in the development,implementation, and evaluation of policies that aim to reduce healthinequalities and level-up the gradient in health and its socialdeterminants among children, young people and their families.Specifically, it is intended to facilitate the evaluation of policy actions2
for their current or future use in terms of their ‘gradient friendliness’ i.e. their potential to level-up the gradient.
1. By technical experts we mean those individuals with a relatively high knowledge of the values, concepts, andprinciples of modern public health whom may (or may not) work in the health sector.
2. From here on in, we use the term ‘policy action(s)’ to recognise that policy has to be operationalised throughspecific interventions which may include activities.
ABOUT THE GRADIENT PROJECT
(GEF) THE GRADIENT EVALUATION FRAMEWORK 3
T a c k l i n g t h e
i n h e a l t hi n h e a l t h
INTRO
DU
CTIONSECTIO
N O
NE
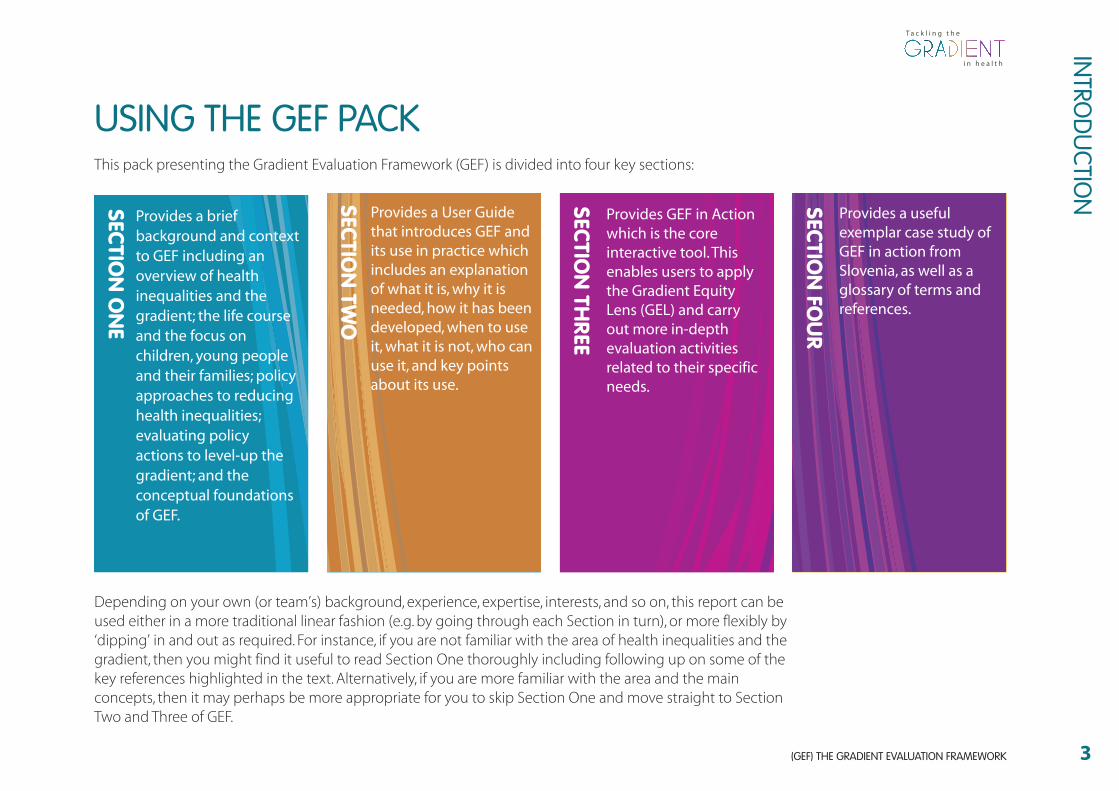
Provides a briefbackground and contextto GEF including anoverview of healthinequalities and thegradient; the life courseand the focus onchildren, young peopleand their families; policyapproaches to reducinghealth inequalities;evaluating policyactions to level-up thegradient; and theconceptual foundationsof GEF.
SECTION
THREE
Provides GEF in Actionwhich is the coreinteractive tool. Thisenables users to applythe Gradient EquityLens (GEL) and carryout more in-depthevaluation activitiesrelated to their specificneeds.
SECTION
TWO
Provides a User Guidethat introduces GEF andits use in practice whichincludes an explanationof what it is, why it isneeded, how it has beendeveloped, when to useit, what it is not, who canuse it, and key pointsabout its use.
SECTION
FOU
R
Provides a usefulexemplar case study ofGEF in action fromSlovenia, as well as aglossary of terms andreferences.
This pack presenting the Gradient Evaluation Framework (GEF) is divided into four key sections:
Depending on your own (or team’s) background, experience, expertise, interests, and so on, this report can beused either in a more traditional linear fashion (e.g. by going through each Section in turn), or more flexibly by‘dipping’ in and out as required. For instance, if you are not familiar with the area of health inequalities and thegradient, then you might find it useful to read Section One thoroughly including following up on some of thekey references highlighted in the text. Alternatively, if you are more familiar with the area and the mainconcepts, then it may perhaps be more appropriate for you to skip Section One and move straight to SectionTwo and Three of GEF.
USING THE GEF PACK

(GEF) THE GRADIENT EVALUATION FRAMEWORK 4
ACKNO
WLED
GEM
ENTS
T a c k l i n g t h e
i n h e a l t hi n h e a l t h
ACKNOWLEDGEMENTSThe research underpinning GEF was carried out within the frameworkof the GRADIENT project (www.health-gradient.eu) coordinated byEuroHealthNet. It has received funding from the EuropeanCommunity DG Research (FP7 2007-2013) under grant agreement No 223252. The authors would like to thank particularly Aagje Ieven,Caroline Costongs, Clive Needle, Cristina Chiotan, and GiorgioBarbareschi from EuroHealthNet. Thanks to members of Work Package2 including: Annemiek Dorgelo, Dorothee Heinen, Elisabeth Fosse,Hana Janatova, Jan Janssen, Tatjana Krajnc-Nikolic, Helene Reemann,Ursula von Rueden, Janine Vervoordeldonk, Vladimir Kebza, and CarenWiegand. Thanks also to Glynis Flood, Fiona Sutton, and Steve Parkerfor administrative support.
We are also grateful for the input of our visiting Canadian students aspart of the Trans-Atlantic Exchange Programme (TEP), funded by theEuropean Community (EACEA) and Canadian Government, includingAdrienne Attorp, Sabrena Jaswel, Heeji Park, and Camille Stengel, andto visiting German student Ines von Hoegen.
Our thanks to the external WP2 experts including workshopparticipants (Brighton, Dubrovnik, and Helsinki), external peerreviewers, and other expert contributors including: Lyndal Bond, RuthDavis, Mojca Gabrijelcic, Øyvind Giæver, Lorenzo Gios, Peter Goldblatt,
Gabriel Gulis, Sabine Haas, Anu Kasmel, Pania Karnaki, Anja Leppin,Michael de Looper, Bernt Lundgren, Péter Makara, Sir Michael Marmot,Jürgen Pelikan, Jantine Schuit, Stig Erik Sørheim, Mali Strand, Janne Strandrud, Nicoline Tamsma, Tone Torgerson, Antti Uutela,Stephan van den Broucke, Jaroslav Volf, and Malcolm Ward.
Our thanks for the comments and feedback from the Gradient ExpertScientific Committee including Candace Currie, Göran Dahlgren, Hilary Graham, and Richie Poulson. Also, to Cristina Chiotan andMichael de Looper for additional work and advice on indicators.
Countries involved in the development, consensus building, pre-testing, case study development and finalisation of the GradientEvaluation Framework include: Austria, Belgium, Czech Republic,Denmark, England, Estonia, Finland, France, Germany, Greece, Hungary,Italy, Netherlands, New Zealand, Norway, Scotland, Slovenia, Spain,Sweden and Wales.
(GEF) THE GRADIENT EVALUATION FRAMEWORK
LIST OT TA
BLES A
ND
FIGU
RES
5
T a c k l i n g t h e
i n h e a l t hi n h e a l t h
LIST OF TABLES AND FIGURES
Tables Page
Table 1 Towards a comprehensive national health equity surveillance framework 14
Figures
Figure 1 The gradient across the population 8Figure 2 The gradient between countries 9Figure 3 Rates of return to human capital investment 10Figure 4 The policy cycle 16Figure 5 The gradient equity lens: dimension one 17Figure 6 The gradient equity lens: dimension two 18Figure 7 The gradient equity lens in action 19Figure 8 The gradient evaluation framework (GEF) 20Figure 9 The life course approach 38Figure 10 The social model of health 40

(GEF) THE GRADIENT EVALUATION FRAMEWORK 6
T a c k l i n g t h e
i n h e a l t hi n h e a l t h

SECTION ONE INTRODUCTION
SECTION
ON
E INTRO
DU
CTION
7
...interventions and policies toreduce health inequalities must notlimit themselves to intermediarydeterminants, but must includepolicies specifically crafted to tackleunderlying structuraldeterminants: the socialmechanisms that systematicallyproduce an inequitabledistribution of the determinants ofhealth among population groups.(CSDH, 2007, p.65).
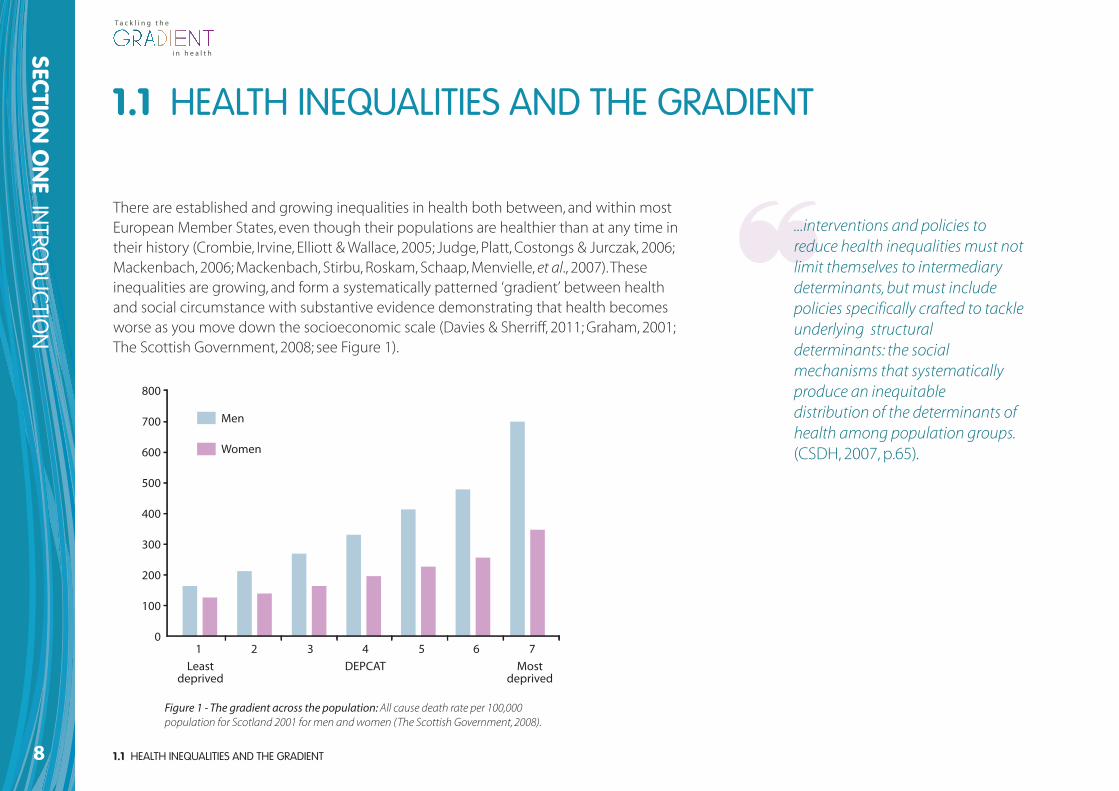
There are established and growing inequalities in health both between, and within mostEuropean Member States, even though their populations are healthier than at any time intheir history (Crombie, Irvine, Elliott & Wallace, 2005; Judge, Platt, Costongs & Jurczak, 2006;Mackenbach, 2006; Mackenbach, Stirbu, Roskam, Schaap, Menvielle, et al., 2007). Theseinequalities are growing, and form a systematically patterned ‘gradient’ between healthand social circumstance with substantive evidence demonstrating that health becomesworse as you move down the socioeconomic scale (Davies & Sherriff, 2011; Graham, 2001;The Scottish Government, 2008; see Figure 1).
1.1 HEALTH INEQUALITIES AND THE GRADIENT
Figure 1 - The gradient across the population: All cause death rate per 100,000population for Scotland 2001 for men and women (The Scottish Government, 2008).
8
SECTION
ON
E INTRO
DU
CTION
T a c k l i n g t h e
i n h e a l t hi n h e a l t h
1.1 HEALTH INEQUALITIES AND THE GRADIENT
Least deprived
800
700
600
500
400
300
200
100
01 2 3 4 5 6 7
DEPCAT Most deprived
Men
Women
1.1 HEALTH INEQUALITIES AND THE GRADIENT
SECTION
ON
E INTRO
DU
CTION
9
T a c k l i n g t h e
i n h e a l t hi n h e a l t h
Denmark
Finland
Norway
Belgium
Netherlands
Austria
Germany
IrelandGreece
USA
New Zealand
Australia
Italy
Switzerland
Odd couples
Odd couples
Combined social problem score
Sweden
Japan
UK
Portugal
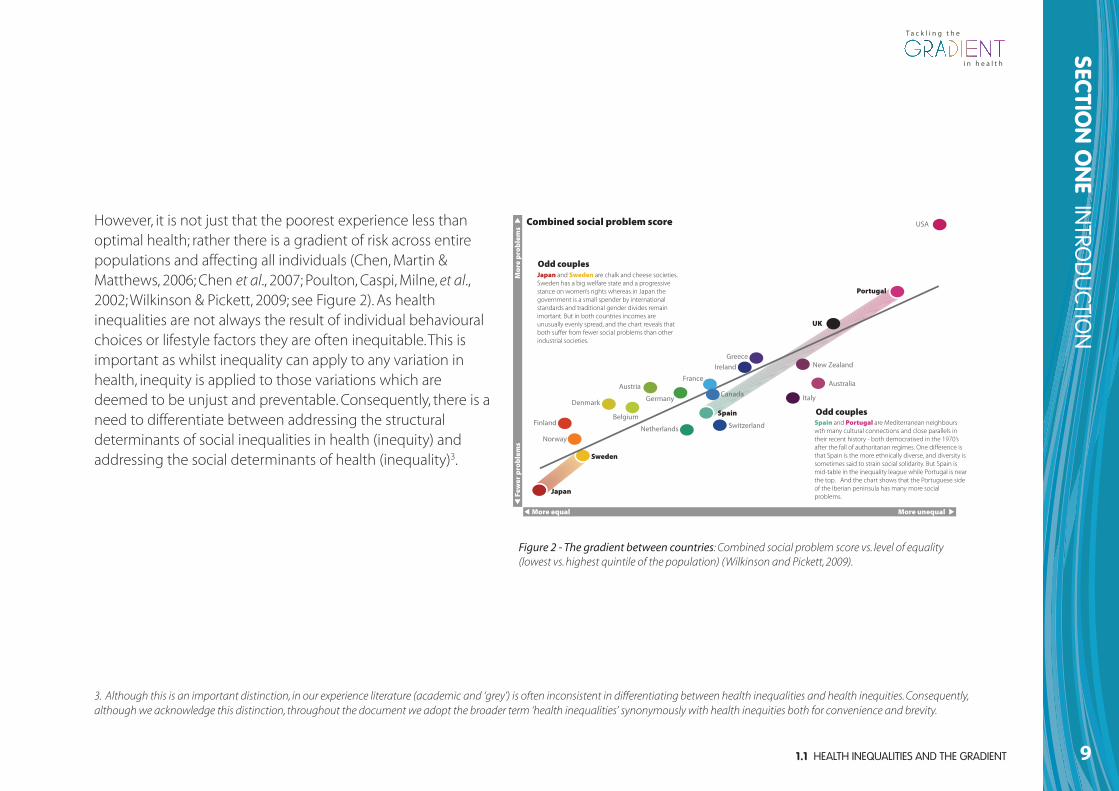
SpainSpain and Portugal are Mediterranean neighbours wth many cultural connections and close parallels in their recent history - both democratised in the 1970’s after the fall of authoritarian regimes. One difference is that Spain is the more ethnically diverse, and diversity is sometimes said to strain social solidarity. But Spain is mid-table in the inequality league while Portugal is near the top. And the chart shows that the Portuguese side of the Iberian peninsula has many more social problems.
Japan and Sweden are chalk and cheese societies. Sweden has a big welfare state and a progressive stance on women’s rights whereas in Japan the government is a small spender by international standards and traditional gender divides remain imortant. But in both countries incomes are unusually evenly spread, and the chart reveals that both suffer from fewer social problems than other industrial societies.
France
Canada
More equal More unequalFe
wer
pro
ble
ms
Mo
re p
rob
lem
s
Figure 2 - The gradient between countries: Combined social problem score vs. level of equality(lowest vs. highest quintile of the population) (Wilkinson and Pickett, 2009).
3. Although this is an important distinction, in our experience literature (academic and ‘grey’) is often inconsistent in differentiating between health inequalities and health inequities. Consequently,although we acknowledge this distinction, throughout the document we adopt the broader term ‘health inequalities’ synonymously with health inequities both for convenience and brevity.
However, it is not just that the poorest experience less thanoptimal health; rather there is a gradient of risk across entirepopulations and affecting all individuals (Chen, Martin &Matthews, 2006; Chen et al., 2007; Poulton, Caspi, Milne, et al.,2002; Wilkinson & Pickett, 2009; see Figure 2). As healthinequalities are not always the result of individual behaviouralchoices or lifestyle factors they are often inequitable. This isimportant as whilst inequality can apply to any variation inhealth, inequity is applied to those variations which aredeemed to be unjust and preventable. Consequently, there is aneed to differentiate between addressing the structuraldeterminants of social inequalities in health (inequity) andaddressing the social determinants of health (inequality)3.
The reasons for the existence of health inequalities are complex andinvolve a wide range of factors which relate to the wider socialdeterminants of health including the circumstances and contextwithin which children develop. However, the impact of these widersocial determinants on health varies at different points in the lifecourse, particularly when people are most dependent or vulnerable,for example in childhood, pregnancy or older age.
In terms of the former, Poulton and his colleagues’ life-course studydemonstrates that low childhood socioeconomic circumstances canhave long-lasting negative influences on adult health, irrespective ofwhere one ends up in the socioeconomic hierarchy as an adult(Poulton et al., 2002; see also Graham & Power, 2004 ). Specifically, theirfindings demonstrate that the social gradient in health actuallyemerges in childhood. Consequently, it is argued that interventionsdesigned to reduce health inequalities early in childhood, and thosethat seek to create equal opportunities in childhood and adolescence,may help move children onto healthier trajectories, with the hope ofmaximising health across the life course (Chen, 2004; Chen et al., 2007).In other words, such interventions may not only have a positiveimpact on health, but may also assist in addressing inter-generationalinequalities in health (Chen et al, 2007; Hertzman, Siddiqi, Hertzma,Irwin, Vaghri, et al., 2010). This notion is supported by the widerliterature which suggests that any effort to level-up the gradient inhealth should pay special attention to children and young people, asinterventions at these early stages in the life cycle offer the greatestpotential of levelling up the gradient and facilitating long-term
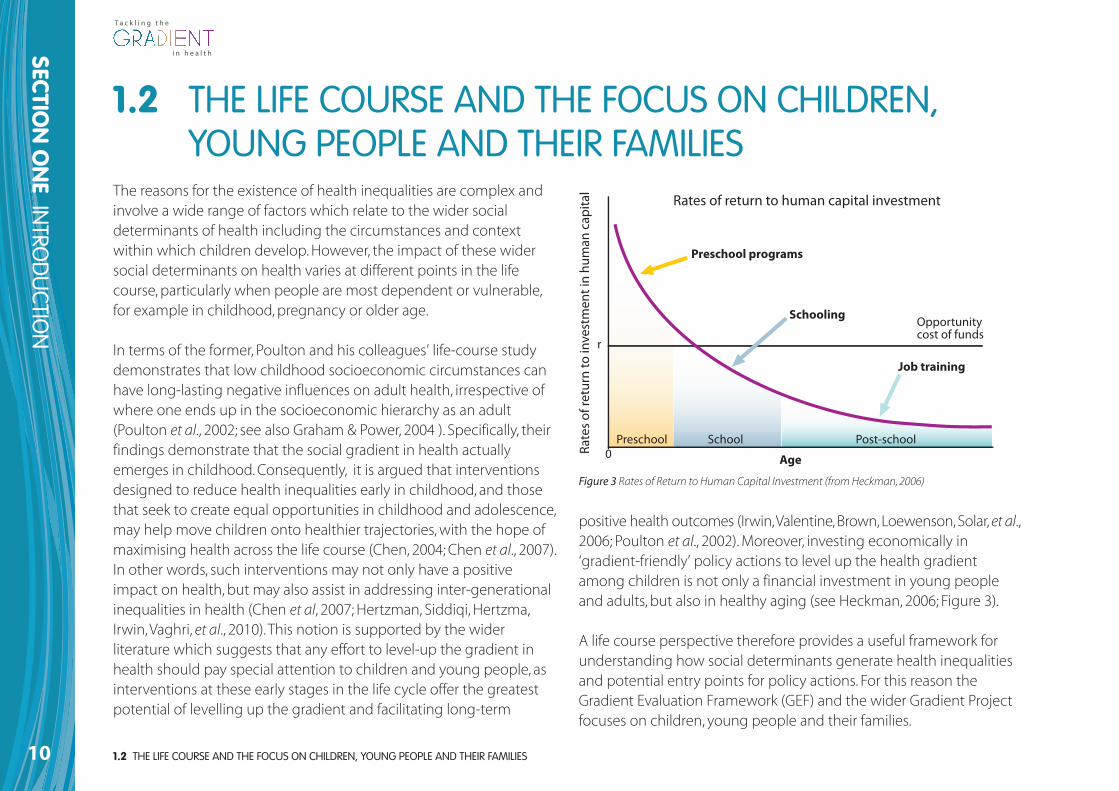
positive health outcomes (Irwin, Valentine, Brown, Loewenson, Solar, et al.,2006; Poulton et al., 2002). Moreover, investing economically in‘gradient-friendly’ policy actions to level up the health gradientamong children is not only a financial investment in young peopleand adults, but also in healthy aging (see Heckman, 2006; Figure 3).
A life course perspective therefore provides a useful framework forunderstanding how social determinants generate health inequalitiesand potential entry points for policy actions. For this reason theGradient Evaluation Framework (GEF) and the wider Gradient Projectfocuses on children, young people and their families.
1.2 THE LIFE COURSE AND THE FOCUS ON CHILDREN, YOUNG PEOPLE AND THEIR FAMILIES 10
SECTION
ON
E INTRO
DU
CTION
T a c k l i n g t h e
i n h e a l t hi n h e a l t h
1.2 THE LIFE COURSE AND THE FOCUS ON CHILDREN,YOUNG PEOPLE AND THEIR FAMILIES
0
r
Rates of return to human capital investment
Age
Opportunitycost of funds
Preschool School Post-school
Job training
Schooling
Preschool programs
Rate
s of
retu
rn to
inve
stm
ent i
n hu
man
cap
ital
Figure 3 Rates of Return to Human Capital Investment (from Heckman, 2006)
1.3 POLICY APPROACHES TO REDUCING HEALTH INEQUALITIES
SECTION
ON
E INTRO
DU
CTION
11
T a c k l i n g t h e
i n h e a l t hi n h e a l t h
In general, three policy approaches have been adopted to reducesocial inequalities in health, which seek to:
1. Reduce health inequalities by targeting interventions aimed at themost disadvantaged groups.
2. Reduce health inequalities by narrowing the health gap betweenthe better-off and worse-off groups.
3. Reduce health inequalities by levelling-up the social gradient inhealth inequalities across the whole population. For example,universal action, but with a scale and intensity that isproportionate to the level of disadvantage – this has been termed‘proportionate universalism’ (Marmot, 2010).
Ideally all three approaches would operate at the same time. Thismeans that a multi-level and integrated approach involving a varietyof policies and actions would be required to effectively address theproblem (Dahlgren & Whitehead, 2006; Pan American HealthOrganization [PAHO], 2004; Whitehead & Dahlgren, 2006). In reality themajority of policy actions tend to adopt approaches 1 and/or 2. This ispartly because the third approach which seeks to use policies andactions to level-up the gradient, presents major challenges as theseinvolve complex interventions with multiple levels, stages of operationand time lags that require structural instruments with a focus ondifferential distribution effects within the population (Graham, 2004;Graham & Kelly, 2004).
Reducing health inequalities (and inequities) is regarded as one of themost important public health challenges facing the European Union(EU) and it’s Member States (European Commission, 2009). It is also amajor policy focus at global level with the Global Commission on theSocial Determinants of Health (CSDH) recommending to the WorldHealth Organisation (WHO) and all governments:
...to lead global action on the social determinants ofhealth with the aim of achieving health equity. It isessential that governments, civil society, WHO, and otherglobal organizations [sic] now come together in takingaction to improve the lives of the world’s citizens.Achieving health equity within a generation is achievable,it is the right thing to do, and now is the right time to do it.(WHO, 2008, p.22)
1.3 POLICY APPROACHES TO REDUCINGHEALTH INEQUALITIES
An additional challenge for those seeking to reduce healthinequalities is that the literature base on these respective policyapproaches often conflates or ‘fudges’ the distinction betweenlevelling-up the gradient and reducing health inequalities morebroadly (i.e. reducing health gaps and reducing disadvantage). This isproblematic because, whilst there is stronger evidence available forapproaches 1 and 2, this is not the same as levelling-up the gradient.In other words, both approaches 1 and 2 contribute to approach 3, but they are different. Policy makers claim to be ‘reducing healthinequalities’ by which they often mean lifting some loosely-defineddisadvantaged group closer to the best off/average. We suspect that ifone was to analyse policy documents for different countries, where itis claimed that the aim is to reduce health inequalities, it is the ‘gap’rather than gradient that is being addressed. However an importantexception is the Norwegian national strategy to reduce socialinequalities in health which attempt to focus specifically on levelling-up the gradient (Norwegian Directorate for Health and Social Affairs,2005; Norwegian Ministry of Health & Care Services, 2007; NorwegianDirectorate of Health, 2009).
1.3 POLICY APPROACHES TO REDUCING HEALTH INEQUALITIES12
SECTION
ON
E INTRO
DU
CTION
T a c k l i n g t h e
i n h e a l t hi n h e a l t h
The Gradient Project (and GEF itself ) focuses its efforts on this thirdapproach to reducing health inequalities. Arguably, this is the ultimateobjective for all approaches that aim to reduce health inequalities, butideally all three approaches should complement each other. Worthy ofnote here is that although the term ‘tackling the gradient’ is oftenused in the literature we prefer to use ‘levelling-up the gradient’ to beclearer about the intention i.e. improving the health of all groupscloser to the best-off and not just focusing on the worst off.
1.4 EVALUATING POLICY ACTIONS TO LEVEL-UP THE GRADIENT
SECTION
ON
E INTRO
DU
CTION
13
T a c k l i n g t h e
i n h e a l t hi n h e a l t h
1.4 EVALUATING POLICY ACTIONS TO LEVEL UPTHE GRADIENT
Despite the existence of considerable rhetoric regarding the need toreduce health inequalities (e.g. in policy documents and the academicliterature), there is a surprising lack of attention and knowledgearound which policy actions are effective in reducing healthinequalities and, in particular, those actions required to level-up thegradient (Bambra, Joyce & Maryon-Davis, 2009; Davies & Sherriff, 2011;House of Commons Select Committee [HCSC], 2009). Moreover, therehas been scarce attention paid to both the policy process involved indeveloping such solutions and to the evaluation of relevantinterventions (Crombie et al., 2005; European Commission [EC], 2009;Judge et al., 2006; Stronks, 2002). Where evaluative evidence does exist,it tends to be based on downstream initiatives which focus on specificdeterminants (e.g. smoking cessation among low-income groups orincreasing breastfeeding continuance), rather than on more upstreaminitiatives (e.g. taxation policies) which influence the wider socialdeterminants of health (Davies & Sherriff, 2011, Davies & Sherriff, 2012;Marmot, 2010).
This lack of focus on evaluative evidence is exacerbated in part by thefact that the measurement and monitoring of inequalities in health isneither standardised nor common across all countries and over time.No consensus has been reached on the best and most meaningfulmeasure(s) since the choice of measure is mainly dependent on thecountry in question, the availability of data, on the specificdeterminant chosen to be assessed, and on the nature of policy actionthat needs to be evaluated and/or monitored. Moreover, although theWHO Commission on the Social Determinants of Health (CSDH, 2008)
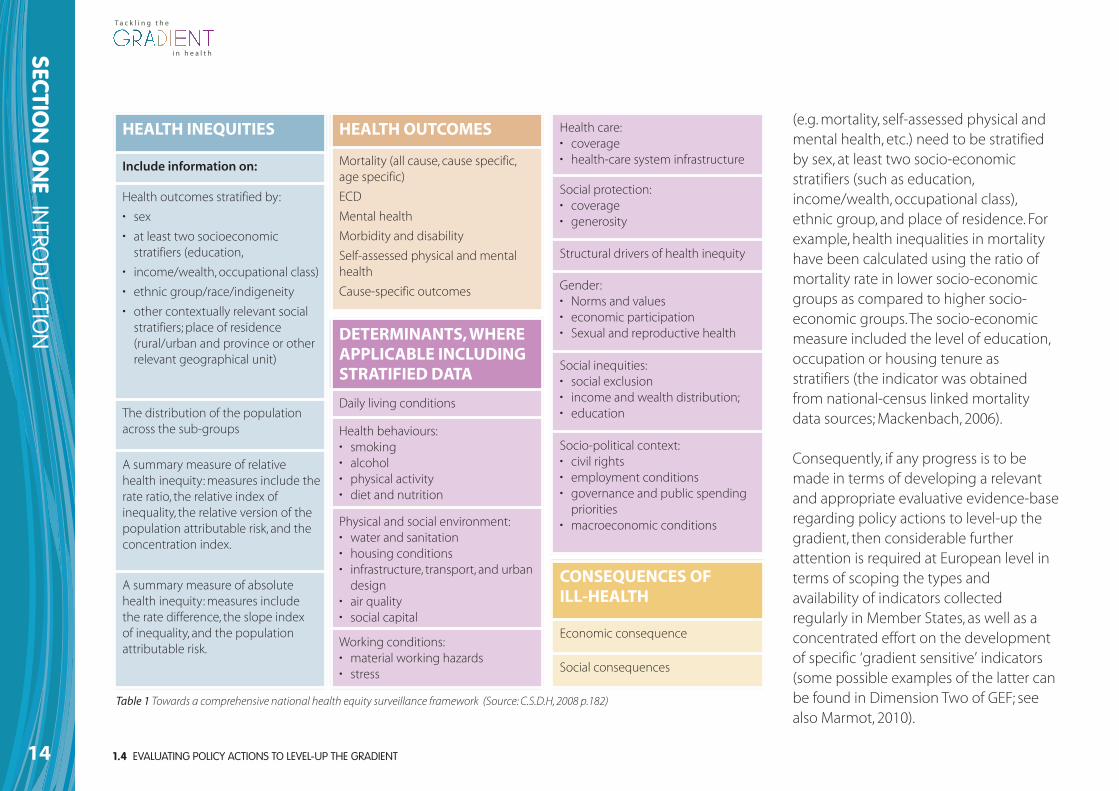
has proposed a comprehensive surveillance framework for monitoringhealth inequalities (see Table 1); in reality it is often difficult to put inplace such a comprehensive system. Only a few countries havedeveloped similarly comprehensive data systems to monitor healthinequalities (including the UK, Norway & Sweden). However, even inthese countries, only a few similarities in the indicators are apparent:
The lack of appropriate routinely available and comparable datawithin each country and across the EU was highlighted as a keybarrier to greater knowledge and effective analysis... needed toreduce inequalities in health... Current challenges include theinability to collect and analyse data from the health sector andother sectors and a lack of adequate measures of social positionor advantage (equity stratifiers).(WHO/UCL, 2010, p. 28).
An additional problem also exists in that most existing datasurveillance systems provide country and sometimes regional healthoutcome data stratified only by age and gender. In the context ofaddressing the gradient, this is problematic because, althoughanalysing health indicators and the determinants of health for thegeneral population by such stratifiers is important, it is not sufficientfor identifying and analysing health status across the gradient. Socialdeterminants of health and causal factors in particular, require carefuladditional analysis as the most important determinants of health maydiffer between different socio-economic groups. Thus, to identify,monitor and evaluate health inequalities health outcome indicators
1.4 EVALUATING POLICY ACTIONS TO LEVEL-UP THE GRADIENT14
SECTION
ON
E INTRO
DU
CTION
T a c k l i n g t h e
i n h e a l t hi n h e a l t h
HEALTH INEQUITIES
Include information on:
Health outcomes stratified by:
• sex
• at least two socioeconomicstratifiers (education,
• income/wealth, occupational class)
• ethnic group/race/indigeneity
• other contextually relevant socialstratifiers; place of residence(rural/urban and province or otherrelevant geographical unit)
The distribution of the populationacross the sub-groups
A summary measure of relativehealth inequity: measures include therate ratio, the relative index ofinequality, the relative version of thepopulation attributable risk, and theconcentration index.
A summary measure of absolutehealth inequity: measures include the rate difference, the slope index of inequality, and the populationattributable risk.
HEALTH OUTCOMES
Mortality (all cause, cause specific,age specific)
ECD
Mental health
Morbidity and disability
Self-assessed physical and mentalhealth
Cause-specific outcomes
DETERMINANTS, WHEREAPPLICABLE INCLUDINGSTRATIFIED DATA
Daily living conditions
Health behaviours:• smoking• alcohol• physical activity• diet and nutrition
Physical and social environment:• water and sanitation• housing conditions• infrastructure, transport, and urbandesign
• air quality• social capital
Working conditions:• material working hazards• stress
Health care:• coverage• health-care system infrastructure
Social protection:• coverage• generosity
Structural drivers of health inequity
Gender:• Norms and values• economic participation• Sexual and reproductive health
Social inequities:• social exclusion• income and wealth distribution;• education
Socio-political context:• civil rights• employment conditions• governance and public spendingpriorities
• macroeconomic conditions
CONSEQUENCES OF ILL-HEALTH
Economic consequence
Social consequences
Table 1 Towards a comprehensive national health equity surveillance framework (Source: C.S.D.H, 2008 p.182)
(e.g. mortality, self-assessed physical andmental health, etc.) need to be stratifiedby sex, at least two socio-economicstratifiers (such as education,income/wealth, occupational class),ethnic group, and place of residence. Forexample, health inequalities in mortalityhave been calculated using the ratio ofmortality rate in lower socio-economicgroups as compared to higher socio-economic groups. The socio-economicmeasure included the level of education,occupation or housing tenure asstratifiers (the indicator was obtainedfrom national-census linked mortalitydata sources; Mackenbach, 2006).
Consequently, if any progress is to bemade in terms of developing a relevantand appropriate evaluative evidence-baseregarding policy actions to level-up thegradient, then considerable furtherattention is required at European level interms of scoping the types andavailability of indicators collectedregularly in Member States, as well as aconcentrated effort on the developmentof specific ‘gradient sensitive’ indicators(some possible examples of the latter canbe found in Dimension Two of GEF; seealso Marmot, 2010).
1.5 CONCEPTUAL FOUNDATIONS AND THE STRUCTURE OF THE GRADIENT EVALUATION FRAMEWORK (GEF)
SECTION
ON
E INTRO
DU
CTION
15
T a c k l i n g t h e
i n h e a l t hi n h e a l t h
1.5 CONCEPTUAL FOUNDATIONS AND THE STRUCTUREOF THE GRADIENT EVALUATION FRAMEWORK (GEF)
Taking the above considerations into account, as a core part of theGradient Project, the Gradient Evaluation Framework (GEF) has beendeveloped as a European action-oriented policy tool to guide andinform technical experts in (modern) public health working at theMember State level. The starting point for the development of GEFwas the completion of a realist review to understand better thestrengths and weaknesses of using evaluation frameworks to explorepolicies and related actions that could be used to level-up thegradient (Davies & Sherriff, 2011). In total, 34 evaluation frameworkswere reviewed and analysed using a bespoke protocol or set ofdedicated analytical criteria drawn primarily from three sources: theEUHPID (European Health Promotion Indicator Development) healthdevelopment model (Bauer, Davies, Pelikan, Noack, Broesskamp & Hill,2003; Bauer, Davies & Pelikan, 2006) the Ottawa Charter for HealthPromotion (WHO, 1986) and the wider literature on health inequalities(e.g. Marmot, 2010; Themessl-Huber, Lazenbatt & Taylor, 2008). As noone existing framework emerged that was deemed ‘fit for purpose’ interms of the Gradient Project, a new evaluation framework was
developed. This new Gradient Evaluation Framework (GEF) has beenprogressed through a formal consensus-building process involvingexternal experts from a wide range of European Member States.Although it is only a first developmental step, GEF aims to guide thoseinvolved in the policy process (e.g. technical experts working inmodern public health) by reducing their possibility of error havingdeveloped, or when developing, policies and related actions toincrease the potential of levelling-up the gradient in healthinequalities.
THE STRUCTURE OF GEF
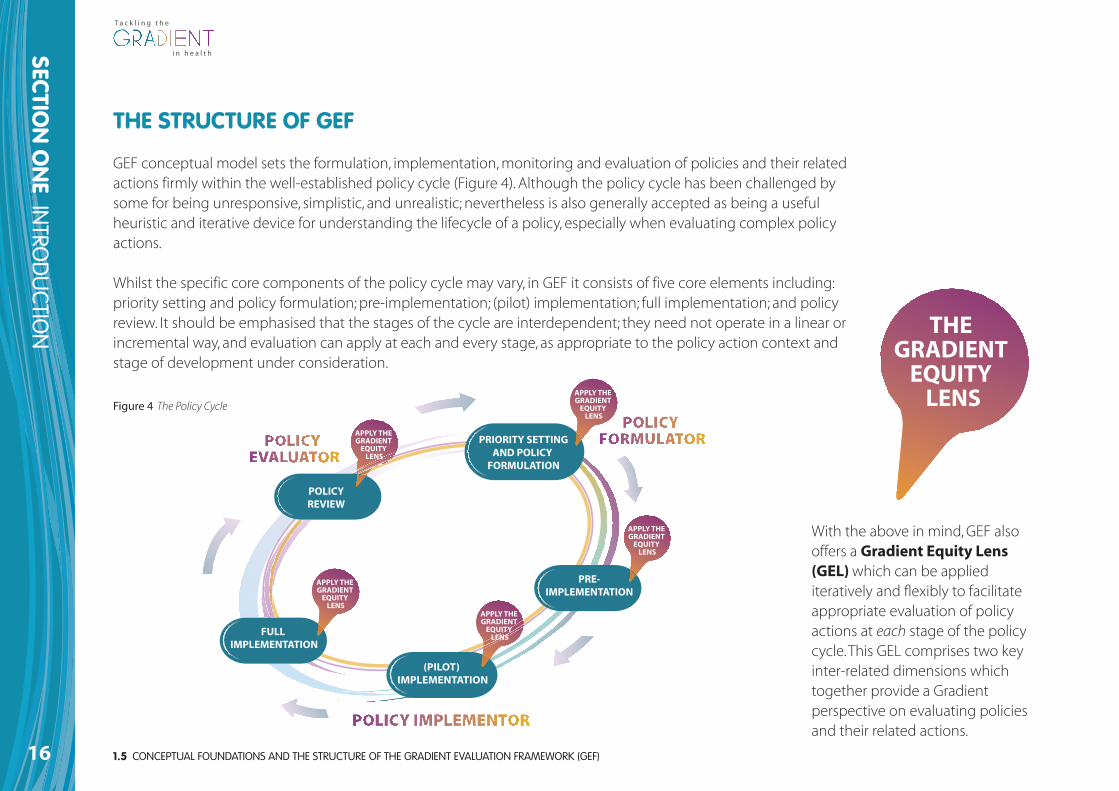
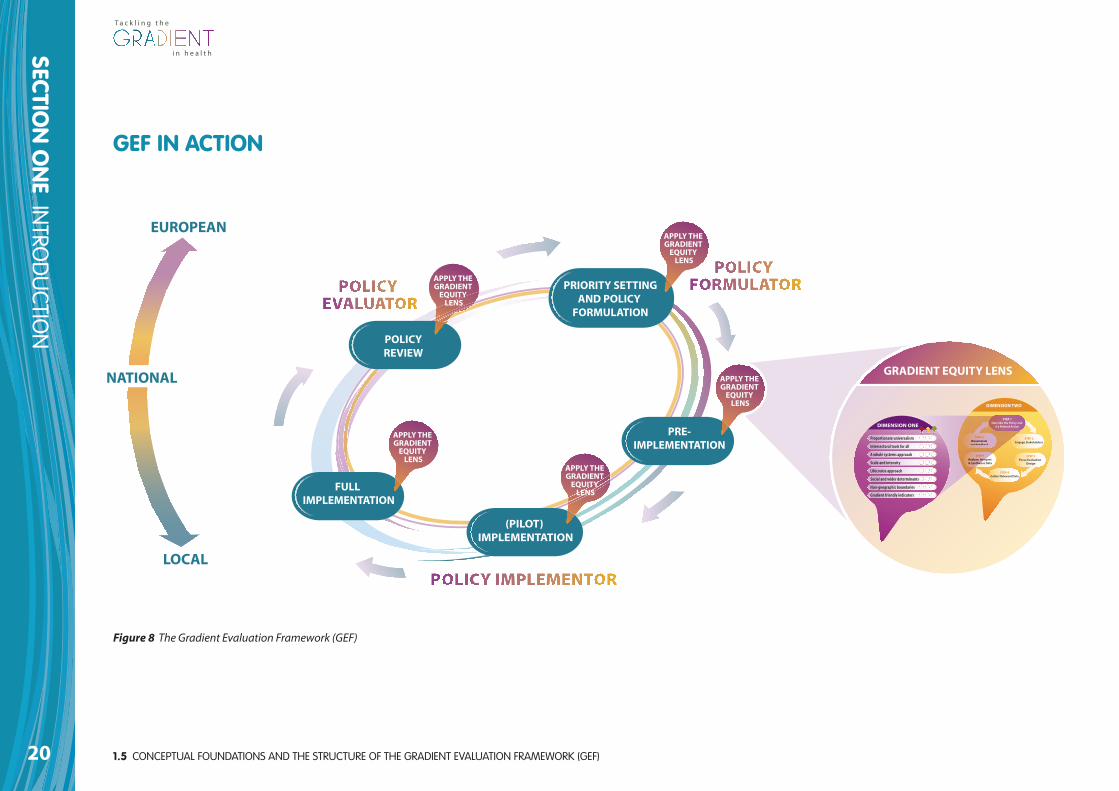
GEF conceptual model sets the formulation, implementation, monitoring and evaluation of policies and their relatedactions firmly within the well-established policy cycle (Figure 4). Although the policy cycle has been challenged bysome for being unresponsive, simplistic, and unrealistic; nevertheless is also generally accepted as being a usefulheuristic and iterative device for understanding the lifecycle of a policy, especially when evaluating complex policyactions.
Whilst the specific core components of the policy cycle may vary, in GEF it consists of five core elements including:priority setting and policy formulation; pre-implementation; (pilot) implementation; full implementation; and policyreview. It should be emphasised that the stages of the cycle are interdependent; they need not operate in a linear orincremental way, and evaluation can apply at each and every stage, as appropriate to the policy action context andstage of development under consideration.
1.5 CONCEPTUAL FOUNDATIONS AND THE STRUCTURE OF THE GRADIENT EVALUATION FRAMEWORK (GEF)16
SECTION
ON
E INTRO
DU
CTION
T a c k l i n g t h e
i n h e a l t hi n h e a l t h
With the above in mind, GEF alsooffers a Gradient Equity Lens(GEL)which can be appliediteratively and flexibly to facilitateappropriate evaluation of policyactions at each stage of the policycycle. This GEL comprises two keyinter-related dimensions whichtogether provide a Gradientperspective on evaluating policiesand their related actions.
THE GRADIENT
EQUITY LENS
PRE-IMPLEMENTATION
FULL IMPLEMENTATION
(PILOT) IMPLEMENTATION
PRIORITY SETTINGAND POLICY
FORMULATION
POLICYREVIEW
APPLY THE GRADIENT
EQUITY LENS
APPLY THE GRADIENT
EQUITY LENS
APPLY THE GRADIENT
EQUITY LENS
APPLY THE GRADIENT
EQUITY LENS
APPLY THE GRADIENT
EQUITY LENS
Figure 4 The Policy Cycle
1.5 CONCEPTUAL FOUNDATIONS AND THE STRUCTURE OF THE GRADIENT EVALUATION FRAMEWORK (GEF)
SECTION
ON
E INTRO
DU
CTION
17
T a c k l i n g t h e
i n h e a l t hi n h e a l t h
THE GRADIENT EQUITY LENS (GEL)
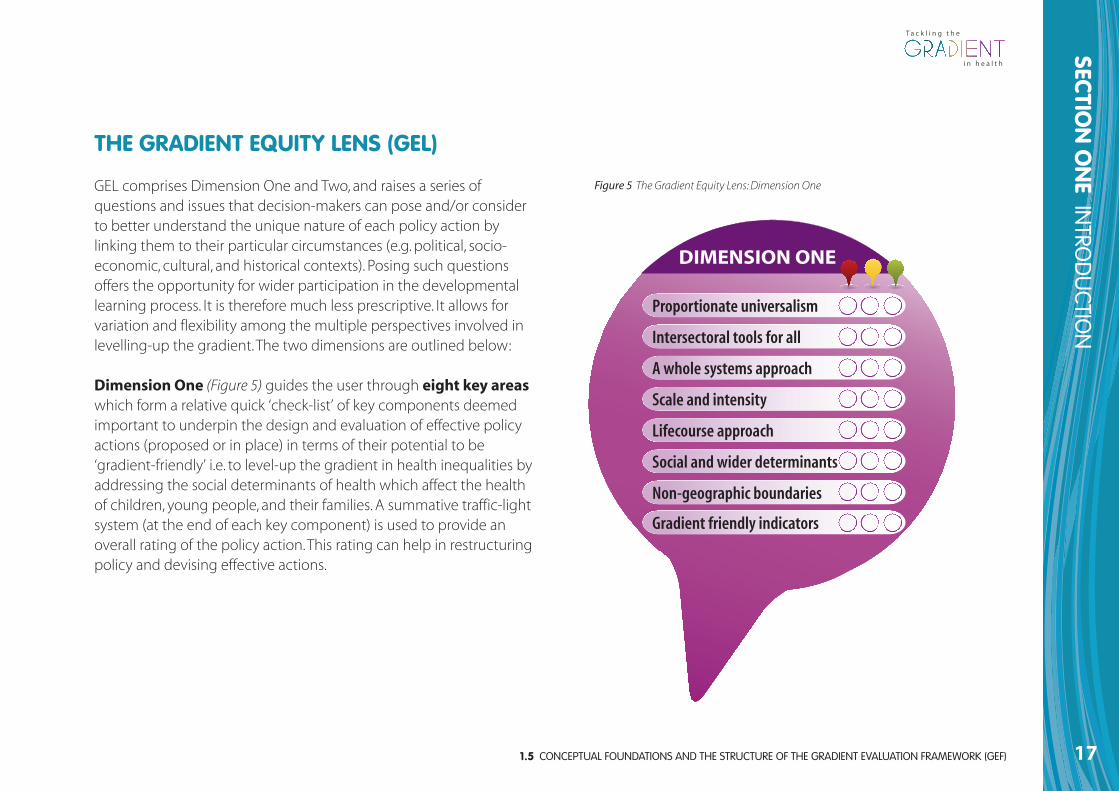
GEL comprises Dimension One and Two, and raises a series ofquestions and issues that decision-makers can pose and/or considerto better understand the unique nature of each policy action bylinking them to their particular circumstances (e.g. political, socio-economic, cultural, and historical contexts). Posing such questionsoffers the opportunity for wider participation in the developmentallearning process. It is therefore much less prescriptive. It allows forvariation and flexibility among the multiple perspectives involved inlevelling-up the gradient. The two dimensions are outlined below:
Dimension One (Figure 5) guides the user through eight key areaswhich form a relative quick ‘check-list’ of key components deemedimportant to underpin the design and evaluation of effective policyactions (proposed or in place) in terms of their potential to be‘gradient-friendly’ i.e. to level-up the gradient in health inequalities byaddressing the social determinants of health which affect the healthof children, young people, and their families. A summative traffic-lightsystem (at the end of each key component) is used to provide anoverall rating of the policy action. This rating can help in restructuringpolicy and devising effective actions.
Figure 5 The Gradient Equity Lens: Dimension One
Proportionate universalism
Intersectoral tools for all
A whole systems approach
Scale and intensity
Lifecourse approach
Social and wider determinants
Non-geographic boundaries
Gradient friendly indicators
DIMENSION ONE
1.5 CONCEPTUAL FOUNDATIONS AND THE STRUCTURE OF THE GRADIENT EVALUATION FRAMEWORK (GEF)18
SECTION
ON
E INTRO
DU
CTION
T a c k l i n g t h e
i n h e a l t hi n h e a l t h
DIMENSION TWO
STEP 5Analyse, Interpret
and Synthesise Data
STEP 2Engage Stakeholders
STEP 1Describe the Policy and
it’s Related Action
STEP 6Disseminate
and feedback
STEP 3Focus Evaluation
Design
STEP 4Collect Relevant Data
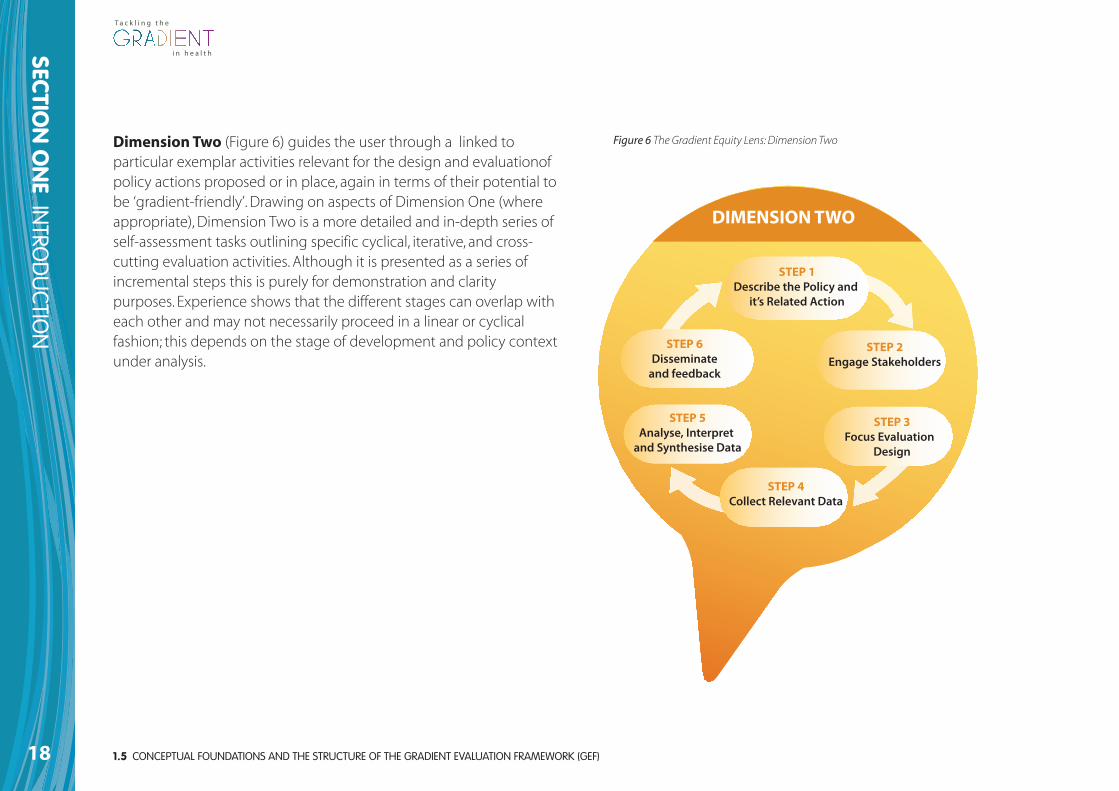
Dimension Two (Figure 6) guides the user through a linked toparticular exemplar activities relevant for the design and evaluationofpolicy actions proposed or in place, again in terms of their potential tobe ‘gradient-friendly’. Drawing on aspects of Dimension One (whereappropriate), Dimension Two is a more detailed and in-depth series ofself-assessment tasks outlining specific cyclical, iterative, and cross-cutting evaluation activities. Although it is presented as a series ofincremental steps this is purely for demonstration and claritypurposes. Experience shows that the different stages can overlap witheach other and may not necessarily proceed in a linear or cyclicalfashion; this depends on the stage of development and policy contextunder analysis.
Figure 6 The Gradient Equity Lens: Dimension Two
1.5 CONCEPTUAL FOUNDATIONS AND THE STRUCTURE OF THE GRADIENT EVALUATION FRAMEWORK (GEF)
SECTION
ON
E INTRO
DU
CTION
19
T a c k l i n g t h e
i n h e a l t hi n h e a l t h
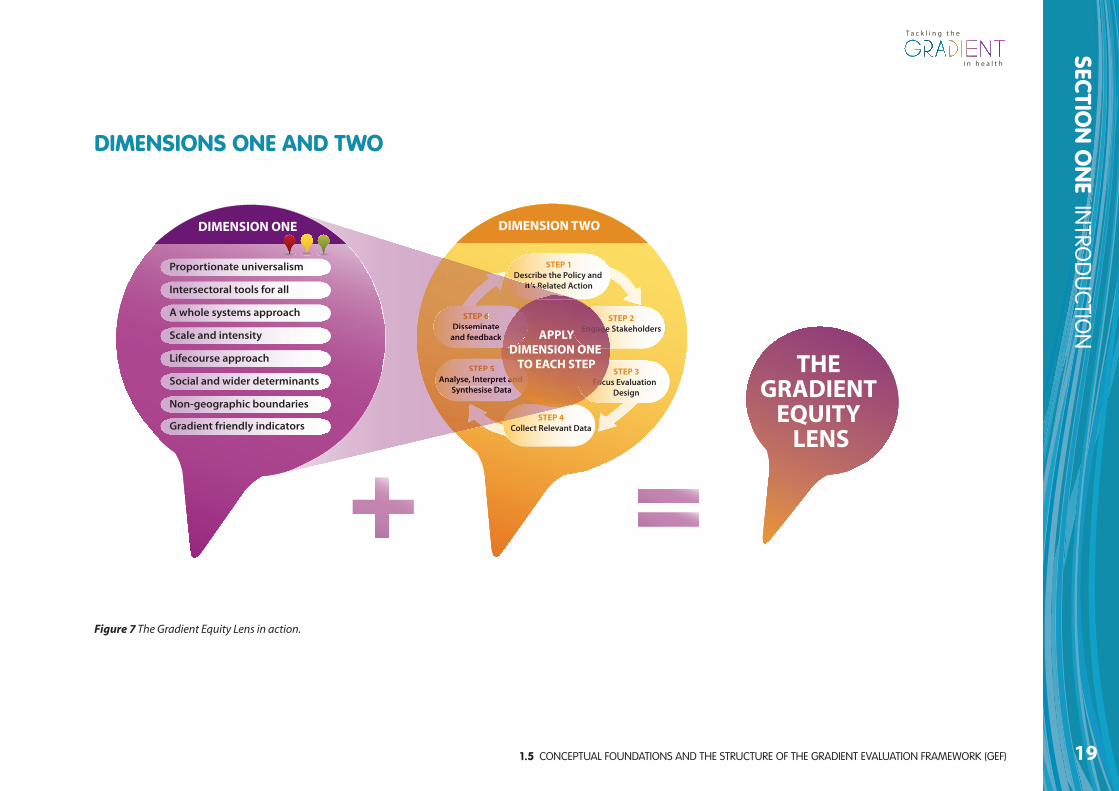
Figure 7 The Gradient Equity Lens in action.
DIMENSION TWO
STEP 5Analyse, Interpret and
Synthesise Data
STEP 2Engage Stakeholders
STEP 1Describe the Policy and
it’s Related Action
STEP 6Disseminate
and feedback
STEP 3Focus Evaluation
Design
STEP 4Collect Relevant Data
Proportionate universalism
Intersectoral tools for all
A whole systems approach
Scale and intensity
Lifecourse approach
Social and wider determinants
Non-geographic boundaries
Gradient friendly indicators
DIMENSION ONE
THE GRADIENT
EQUITY LENS
STEP 5Analyse, Interpret a
Synthesisee Data
e
it s R
STEP 6Disseminaate
and feedbaack
ooo a anddnd
EnEnEnEnE gagagag gegg
FoFo
APPLYDIMENSION ONE
TO EACH STEP
DIMENSIONS ONE AND TWO
1.5 CONCEPTUAL FOUNDATIONS AND THE STRUCTURE OF THE GRADIENT EVALUATION FRAMEWORK (GEF)20
SECTION
ON
E INTRO
DU
CTION
T a c k l i n g t h e
i n h e a l t hi n h e a l t h
GEF IN ACTION
PRE-IMPLEMENTATION
FULL IMPLEMENTATION
(PILOT) IMPLEMENTATION
PRIORITY SETTINGAND POLICY
FORMULATION
POLICYREVIEW
LOCAL
EUROPEANAPPLY THE GRADIENT
EQUITY LENS
APPLY THE GRADIENT
EQUITY LENS
APPLY THE GRADIENT
EQUITY LENS
APPLY THE GRADIENT
EQUITY LENS
APPLY THE GRADIENT
EQUITY LENS
NATIONAL
DIMENSION TWO
STEP 5Analyse, Interpret & Synthesise Data
STEP 2Engage Stakeholders
STEP 6Disseminate
and feedback
STEP 3Focus Evaluation
Design
STEP 4Collect Relevant Data
Proportionate universalism
Intersectoral tools for all
A whole systems approach
Scale and intensity
Lifecourse approach
Social and wider determinants
Non-geographic boundaries
Gradient friendly indicators
DIMENSION ONE
STEP 5Analyse, Inte& Synthes
STEP 6Disseminate
and feedback
STEP 1Describe the Policy and
it’s Related Action
GRADIENT EQUITY LENS
Figure 8 The Gradient Evaluation Framework (GEF)

SECTION
TWO
THE G
RAD
IENT EVA
LUATIO
N FRA
MEW
ORK (G
EF) USER G
UID
E
21
SECTION TWO GEF USER GUIDE
2.1 WHAT IS GEF22
SECTION
TWO
THE G
RAD
IENT EVA
LUATIO
N FRA
MEW
ORK (G
EF) USER G
UID
E
T a c k l i n g t h e
i n h e a l t hi n h e a l t h
GEF is a European action-oriented policy tool that provides aframework for the evaluation of policy actions at each of the keystages of the policy cycle. It includes a set of principles, proceduresand mechanisms that can be applied to:
• Public health policies that comprise of a complex mix of actions,including programmes;
• Specific health policy actions (e.g. nutrition programmes inschools);
• Non-health policies that have a potential to impact on the socialdeterminants of health inequalities (e.g. education, employment,and agriculture sectors).
A tool that can be applied to different policy contexts includingupstream (targets the circumstances that produce adverse healthbehaviours such as the determinants of health that are ingrained instructural inequalities of society); mid-stream (affects workingconditions or targeted lifestyle measures) and/or downstream(attempts to change adverse health behaviours and lifestyles directly).However, GEF places more of a focus on up-stream actions which canhave a greater impact on addressing the determinants of socialinequalities in health, and thus levelling-up the gradient in healthinequalities.
In addition to issues of evaluation, GEF also aims to support, advocate,and sensitise its users regarding the need for action to reduce healthand social inequalities and make progress towards levelling-up thegradient in health among children, young people, and their families.
2.1 WHAT IS GEF? 2.2 WHY DO WE NEED GEF?The evidence base defining which policies and interventions are mosteffective in reducing health inequalities is extremely weak. This appliesin particular to those policies and interventions that aim to level upthe gradient (Bambra et al., 2009; HCSC, 2009). It is important thereforethat policies and interventions that seek to influence the gradientneed to be more adequately evaluated (Davies & Sherriff, 2011; Davies & Sherriff, 2012).
Yet this is by no means an easy and straightforward task. No singlestudy can demonstrate which policies are the most effective and thereis a need therefore to invest in evaluation to build up an aggregatedbody of evidence over time. However, our review of existing evaluationframeworks found no suitable framework that could be used toevaluate whether policies and/or interventions targeting children andfamilies have the potential to reduce health inequalities and thegradient (Davies & Sherriff, 2011). Thus, a bespoke Gradient EvaluationFramework (GEF) has been developed as the first developmental stepin addressing this gap
2.3 HOW HAS GEF BEEN DEVELOPED
SECTION
TWO
THE G
RAD
IENT EVA
LUATIO
N FRA
MEW
ORK (G
EF) USER G
UID
E
23
T a c k l i n g t h e
i n h e a l t hi n h e a l t h
2.3 HOW HAS GEF BEENDEVELOPED?
GEF is a key output from the GRADIENT Project which has beenfunded between 2009-2012 by the EC’s Seventh FrameworkProgramme (FP7). The Project is a research collaboration involving 12institutions from all over Europe. The focus of the project is onchildren, young people and their families since the greatest impact onreducing the gradient in health inequalities can be achieved througheffective early life policy interventions and by creating equalopportunities during childhood and adolescence.
GEF has been developed through a series of consensus-buildingworkshops, involving experts from a wide range of European MemberStates, as well as consultations with experts in policy, evaluation, andhealth inequalities through individual meetings and a formal peerreview process. GEF has also been informed by the results of anextensive literature review and a realist review of existing evaluationframeworks (see Davies & Sherriff, 2011). Finally, GEF has beendeveloped in collaboration with members of Work Package Two of theGRADIENT Project, the wider GRADIENT Consortium, and members ofthe GRADIENT Scientific Committee.
2.4 WHEN TO USE GEFGEF can be used on any policy, action, programme, intervention orproject that either affects, or is intended to affect (if not yetimplemented), the health and equity of a given population. It isintended to guide those involved in the policy process (e.g. technicalexperts working in modern public health) by reducing their possibilityof error having developed, or when developing, policies and relatedactions to increase the potential of levelling-up the gradient in healthinequalities. GEF can be used retrospectively in terms of reviewingexisting initiatives, and also prospectively when designing new ones.
2.5 WHAT GEF IS NOTAlthough GEF can optimise the chances of addressing the gradient inhealth inequalities, it is not a universal bullet that guarantees to informthe user whether or not a specific policy action has had an impact onthe gradient. This is due (inter alia) to the complexity of attempting todemonstrate direct causal links, the effects of time lags, and currentlack of appropriate measurements/indicators and measurement tools(such as when attempting to demonstrate inter-generationalimpacts). Moreover, GEF is not intended to be a comprehensivetechnical manual on how to conduct evaluation as there are alreadymany technical resources readily available for this.
2.6 WHO CAN USE GEF?GEF is intended to be used by technical experts working at MemberState (i.e. national) level. As stated earlier, specifically those individualswith a relatively high knowledge and understanding of the values,concepts, and principles of modern public health whom may (or maynot) work in the health sector. However, GEF may also be of interest toother groups of stakeholders particularly policy-makers and/ordecision-makers, researchers, evaluators, and practitioners workinglocally, nationally, or at European level.
2.7 KEY POINTS ABOUTUSING GEF
GEF is designed to be flexible and adaptable to the needs of its(different) users. The ‘questions to consider’ and ‘example activities’provided in GEF therefore, are meant to be indicative rather thanexhaustive. They merely provide examples of the kinds of questionsand activities users might want to consider. Consequently, some GEFquestions and/or activities will be more relevant than others fordifferent users, at different times, and for different policy actions. Thiswill also be the case depending on what stage of the policy cycle GEFis being applied to. Users of GEF should thus feel free to address anyadditional relevant questions and/or areas to consider depending ontheir own particular context, policy action area and stage of policydevelopment.
Given the above, users may want to consider exactly how they want touse GEF. For example, GEF can be used either for rapid assessment (e.g.using Dimension One only) or in a more in-depth way (DimensionsOne and Two). Moreover, at times it may be more appropriate to worksequentially through GEF questions and examples when, for example,a policy action or programme is being developed from the beginning.Whereas, at other times, some questions or parts may be morerelevant than others and users of GEF may therefore wish to ‘dip-in-and-out’ of Dimensions One and Two as and when required. Thedecision of how to use GEF is up to the user and their particularrequirements and policy action in question.
The process of using GEF to evaluate and/or design a policy action is asimportant as the outcome itself. So regardless of the actual questionsaddressed, or how GEF us used (e.g. rapid assessment vs. in-depth useof the full tool), the particular component, step, and/or dimension ofGEF should be discussed and explored as widely as possible by theindividual user or evaluation team. In doing so, users should beprepared to have their assumptions and their thinking challenged,either by others in the evaluation group or by the evidence that ispresented, or of course both. This is because the process of completingGEF can help to sensitise users regarding the need for action toreduce social inequalities in the determinants of health in order tomake progress towards levelling-up the gradient in health inequalities.
2.6 WHO CAN USE GEF?24
SECTION
TWO
THE G
RAD
IENT EVA
LUATIO
N FRA
MEW
ORK (G
EF) USER G
UID
E
T a c k l i n g t h e
i n h e a l t hi n h e a l t h
2.7 KEY POINTS ABOUT USING GEF
SECTION
TWO
THE G
RAD
IENT EVA
LUATIO
N FRA
MEW
ORK (G
EF) USER G
UID
E
25
Given that the completion of GEF can be complex, it might bebeneficial to record any discussions, key answers and comments,findings, action points and so on for each question for later reference(space is provided at the back of this document for user notes as wellas at other points throughout GEF). This record will help make use ofGEF as transparent and accountable as possible to stakeholders. It willalso help to provide a rationale for decision-making. For this reason,such records can also be shared with others involved in applying GEFand with other key stakeholders.
GEF is designed to be used alongside other tools that seek to tackle asimilar equity agenda such as health impact assessments (HIA), healthequity assessments (HEA), as well as other evaluation tools thatprovide more detailed guidance on particular evaluation techniquesand methods (e.g. Public Health Agency of Canada [PHAC], 2004).
INFORMATION GATHERING AND RESEARCH
For a number of reasons, users of GEF should bear in mind that to usethe framework in its entirety requires information, data, and researchthat may not always be readily available. Evidence will be required tosupport any evaluative judgments of GEF’s questions and activities.Some of this information is likely to be readily available; however, ifsufficient data is not available at any stage during the use of GEF itmay be possible to pause and analyse existing data, seek communityinput or commission new research. Once this is done, working
through the tool can continue. In cases where gathering further datamay not be possible, for example due to lack of appropriate gradient-friendly indicators, steps should be taken to notify relevantdecision-makers about the need for such data.
T a c k l i n g t h e
i n h e a l t hi n h e a l t h

26
SECTION
TWO
THE G
RAD
IENT EVA
LUATIO
N FRA
MEW
ORK (G
EF) USER G
UID
E
T a c k l i n g t h e
i n h e a l t hi n h e a l t h

27
SECTION THREE GEF IN ACTION
SECTION TH
REETH
E GRA
DIEN
T EVALU
ATION
FRAM
EWO
RK (GEF) IN
ACTION
3.1 APPLYING THE GRADIENT EQUITY LENS: DIMENSION ONE28
SECTION TH
REETH
E GRA
DIEN
T EVALU
ATION
FRAM
EWO
RK (GEF) IN
ACTION
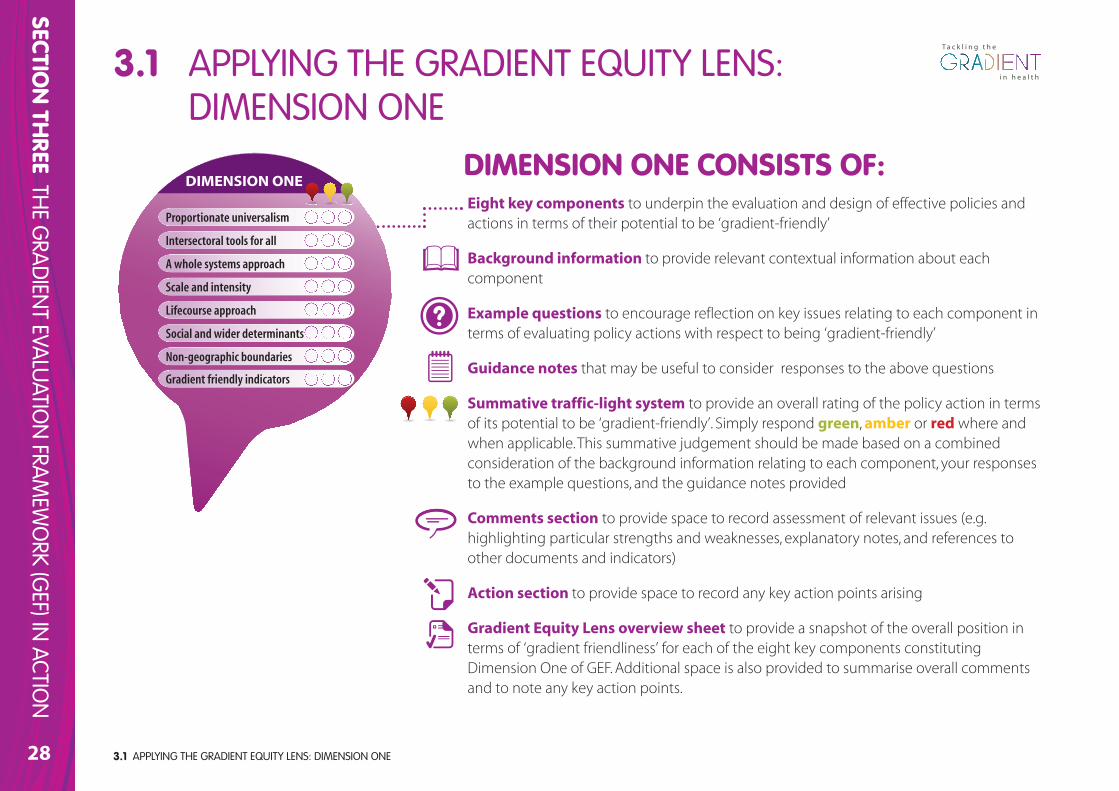
Eight key components to underpin the evaluation and design of effective policies andactions in terms of their potential to be ‘gradient-friendly’
Background information to provide relevant contextual information about eachcomponent
Example questions to encourage reflection on key issues relating to each component interms of evaluating policy actions with respect to being ‘gradient-friendly’
Guidance notes that may be useful to consider responses to the above questions
Summative traffic-light system to provide an overall rating of the policy action in termsof its potential to be ‘gradient-friendly’. Simply respond green, amber or red where andwhen applicable. This summative judgement should be made based on a combinedconsideration of the background information relating to each component, your responsesto the example questions, and the guidance notes provided
Comments section to provide space to record assessment of relevant issues (e.g.highlighting particular strengths and weaknesses, explanatory notes, and references toother documents and indicators)
Action section to provide space to record any key action points arising
Gradient Equity Lens overview sheet to provide a snapshot of the overall position interms of ‘gradient friendliness’ for each of the eight key components constitutingDimension One of GEF. Additional space is also provided to summarise overall commentsand to note any key action points.
Proportionate universalism
Intersectoral tools for all
A whole systems approach
Scale and intensity
Lifecourse approach
Social and wider determinants
Non-geographic boundaries
Gradient friendly indicators
DIMENSION ONE
3.1 APPLYING THE GRADIENT EQUITY LENS: DIMENSION ONE
DIMENSION ONE CONSISTS OF:
T a c k l i n g t h e
i n h e a l t hi n h e a l t h
3.1 APPLYING THE GRADIENT EQUITY LENS: DIMENSION ONE
SECTION TH
REETH
E GRA
DIEN
T EVALU
ATION
FRAM
EWO
RK (GEF) IN
ACTION
29
T a c k l i n g t h e
i n h e a l t hi n h e a l t h
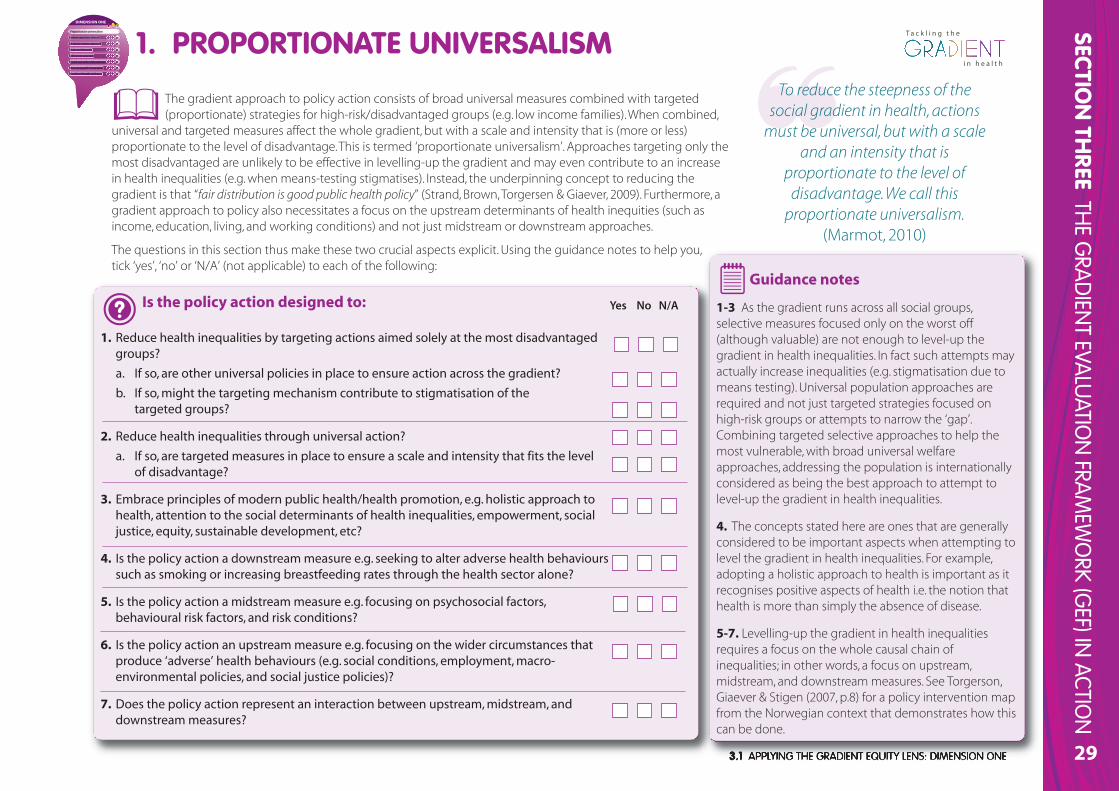
Is the policy action designed to:
1. Reduce health inequalities by targeting actions aimed solely at the most disadvantagedgroups?
a. If so, are other universal policies in place to ensure action across the gradient?
b. If so, might the targeting mechanism contribute to stigmatisation of the targeted groups?
2. Reduce health inequalities through universal action?
a. If so, are targeted measures in place to ensure a scale and intensity that fits the level of disadvantage?
3. Embrace principles of modern public health/health promotion, e.g. holistic approach tohealth, attention to the social determinants of health inequalities, empowerment, socialjustice, equity, sustainable development, etc?
4. Is the policy action a downstream measure e.g. seeking to alter adverse health behaviourssuch as smoking or increasing breastfeeding rates through the health sector alone?
5. Is the policy action a midstream measure e.g. focusing on psychosocial factors,behavioural risk factors, and risk conditions?
6. Is the policy action an upstream measure e.g. focusing on the wider circumstances thatproduce ‘adverse’ health behaviours (e.g. social conditions, employment, macro-environmental policies, and social justice policies)?
7. Does the policy action represent an interaction between upstream, midstream, anddownstream measures?
Guidance notes
1-3 As the gradient runs across all social groups,selective measures focused only on the worst off(although valuable) are not enough to level-up thegradient in health inequalities. In fact such attempts mayactually increase inequalities (e.g. stigmatisation due tomeans testing). Universal population approaches arerequired and not just targeted strategies focused onhigh-risk groups or attempts to narrow the ‘gap’.Combining targeted selective approaches to help themost vulnerable, with broad universal welfareapproaches, addressing the population is internationallyconsidered as being the best approach to attempt tolevel-up the gradient in health inequalities.
4. The concepts stated here are ones that are generallyconsidered to be important aspects when attempting tolevel the gradient in health inequalities. For example,adopting a holistic approach to health is important as itrecognises positive aspects of health i.e. the notion thathealth is more than simply the absence of disease.
5-7. Levelling-up the gradient in health inequalitiesrequires a focus on the whole causal chain ofinequalities; in other words, a focus on upstream,midstream, and downstream measures. See Torgerson,Giaever & Stigen (2007, p.8) for a policy intervention mapfrom the Norwegian context that demonstrates how thiscan be done.
Yes No N/A
1. PROPORTIONATE UNIVERSALISMTo reduce the steepness of the
social gradient in health, actionsmust be universal, but with a scale
and an intensity that isproportionate to the level ofdisadvantage. We call this
proportionate universalism.(Marmot, 2010)
Proportionate universalism
Intersectoral to lols s fofor r all
A whole systems approach
Scale and intensity
Lifecourse approach
Social and wider determinants
Non-geographic boundaries
Gradient friendly indicators
DIMENSION ONE
The gradient approach to policy action consists of broad universal measures combined with targeted(proportionate) strategies for high-risk/disadvantaged groups (e.g. low income families). When combined,
universal and targeted measures affect the whole gradient, but with a scale and intensity that is (more or less)proportionate to the level of disadvantage. This is termed ‘proportionate universalism’. Approaches targeting only themost disadvantaged are unlikely to be effective in levelling-up the gradient and may even contribute to an increasein health inequalities (e.g. when means-testing stigmatises). Instead, the underpinning concept to reducing thegradient is that “fair distribution is good public health policy” (Strand, Brown, Torgersen & Giaever, 2009). Furthermore, agradient approach to policy also necessitates a focus on the upstream determinants of health inequities (such asincome, education, living, and working conditions) and not just midstream or downstream approaches.
The questions in this section thus make these two crucial aspects explicit. Using the guidance notes to help you, tick ‘yes’, ‘no’ or ‘N/A’ (not applicable) to each of the following:
3.1 APPLYING THE GRADIENT EQUITY LENS: DIMENSION ONE30
SECTION TH
REETH
E GRA
DIEN
T EVALU
ATION
FRAM
EWO
RK (GEF) IN
ACTION
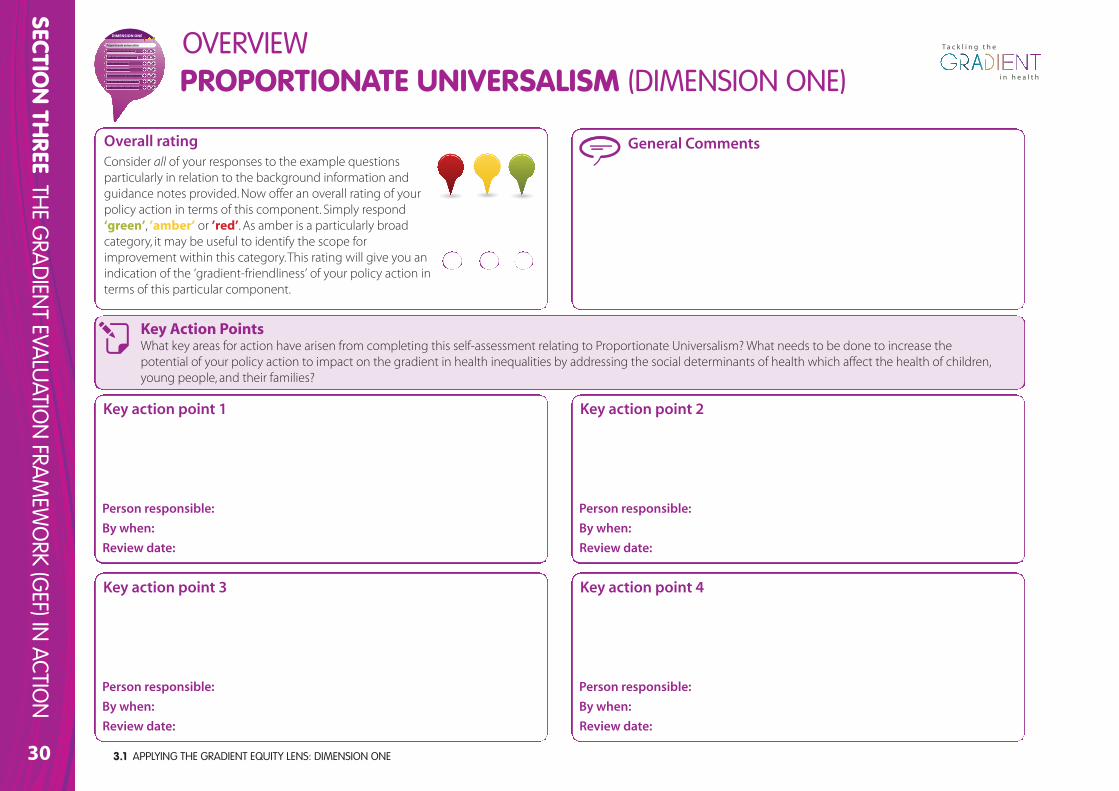
General CommentsOverall ratingConsider all of your responses to the example questionsparticularly in relation to the background information andguidance notes provided. Now offer an overall rating of yourpolicy action in terms of this component. Simply respond‘green’, ’amber’ or ’red’. As amber is a particularly broadcategory, it may be useful to identify the scope forimprovement within this category. This rating will give you anindication of the ‘gradient-friendliness’ of your policy action interms of this particular component.
Key Action PointsWhat key areas for action have arisen from completing this self-assessment relating to Proportionate Universalism? What needs to be done to increase thepotential of your policy action to impact on the gradient in health inequalities by addressing the social determinants of health which affect the health of children,young people, and their families?
Proportionate universalism
Intersectoral to lols s fofor r all
A whole systems approach
Scale and intensity
Lifecourse approach
Social and wider determinants
Non-geographic boundaries
Gradient friendly indicators
DIMENSION ONE
PROPORTIONATE UNIVERSALISM (DIMENSION ONE)
Key action point 1
Person responsible:
By when:
Review date:
Key action point 3
Person responsible:
By when:
Review date:
Key action point 2
Person responsible:
By when:
Review date:
Key action point 4
Person responsible:
By when:
Review date:
T a c k l i n g t h e
i n h e a l t hi n h e a l t h
OVERVIEW
3.1 APPLYING THE GRADIENT EQUITY LENS: DIMENSION ONE
SECTION TH
REETH
E GRA
DIEN
T EVALU
ATION
FRAM
EWO
RK (GEF) IN
ACTION
31
T a c k l i n g t h e
i n h e a l t hi n h e a l t h
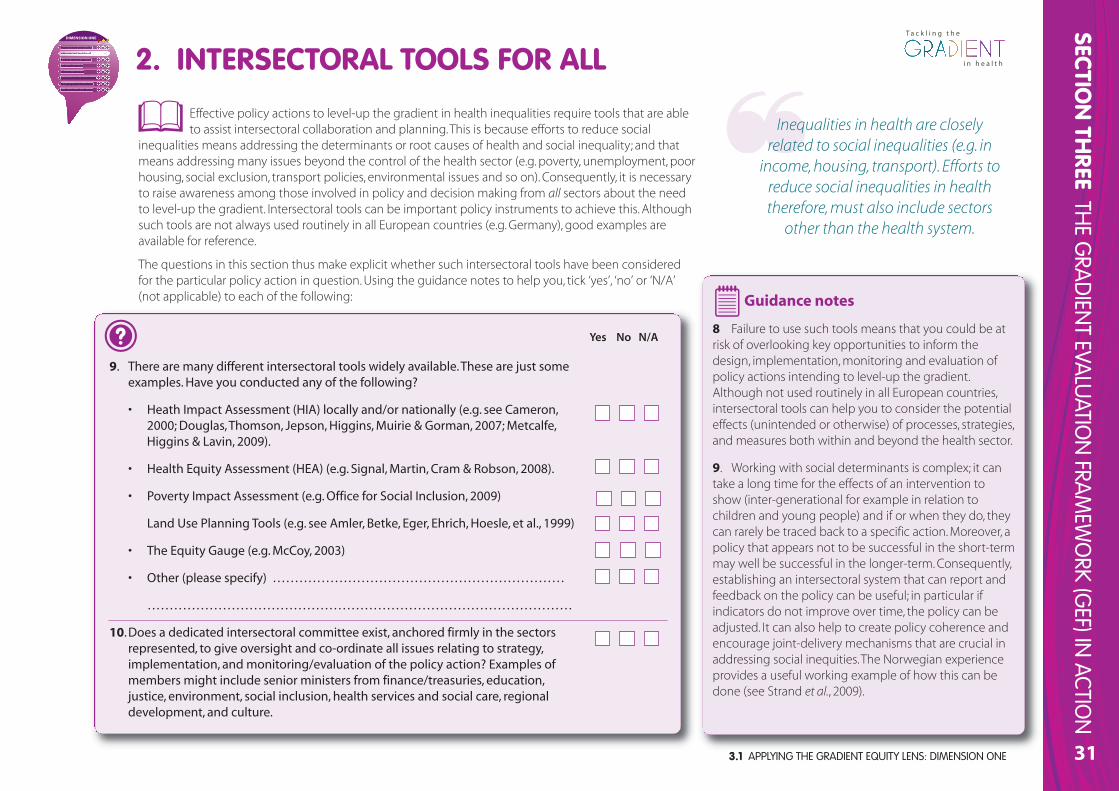
Effective policy actions to level-up the gradient in health inequalities require tools that are ableto assist intersectoral collaboration and planning. This is because efforts to reduce social
inequalities means addressing the determinants or root causes of health and social inequality; and thatmeans addressing many issues beyond the control of the health sector (e.g. poverty, unemployment, poorhousing, social exclusion, transport policies, environmental issues and so on). Consequently, it is necessaryto raise awareness among those involved in policy and decision making from all sectors about the needto level-up the gradient. Intersectoral tools can be important policy instruments to achieve this. Althoughsuch tools are not always used routinely in all European countries (e.g. Germany), good examples areavailable for reference.
The questions in this section thus make explicit whether such intersectoral tools have been consideredfor the particular policy action in question. Using the guidance notes to help you, tick ‘yes’, ‘no’ or ‘N/A’(not applicable) to each of the following:
9. There are many different intersectoral tools widely available. These are just someexamples. Have you conducted any of the following?
• Heath Impact Assessment (HIA) locally and/or nationally (e.g. see Cameron,2000; Douglas, Thomson, Jepson, Higgins, Muirie & Gorman, 2007; Metcalfe,Higgins & Lavin, 2009).
• Health Equity Assessment (HEA) (e.g. Signal, Martin, Cram & Robson, 2008).
• Poverty Impact Assessment (e.g. Office for Social Inclusion, 2009)
Land Use Planning Tools (e.g. see Amler, Betke, Eger, Ehrich, Hoesle, et al., 1999)
• The Equity Gauge (e.g. McCoy, 2003)
• Other (please specify) …………………………………………………………
……………………………………………………………………………………
10.Does a dedicated intersectoral committee exist, anchored firmly in the sectorsrepresented, to give oversight and co-ordinate all issues relating to strategy,implementation, and monitoring/evaluation of the policy action? Examples ofmembers might include senior ministers from finance/treasuries, education,justice, environment, social inclusion, health services and social care, regionaldevelopment, and culture.
Guidance notes
8 Failure to use such tools means that you could be atrisk of overlooking key opportunities to inform thedesign, implementation, monitoring and evaluation ofpolicy actions intending to level-up the gradient.Although not used routinely in all European countries,intersectoral tools can help you to consider the potentialeffects (unintended or otherwise) of processes, strategies,and measures both within and beyond the health sector.
9. Working with social determinants is complex; it cantake a long time for the effects of an intervention toshow (inter-generational for example in relation tochildren and young people) and if or when they do, theycan rarely be traced back to a specific action. Moreover, apolicy that appears not to be successful in the short-termmay well be successful in the longer-term. Consequently,establishing an intersectoral system that can report andfeedback on the policy can be useful; in particular ifindicators do not improve over time, the policy can beadjusted. It can also help to create policy coherence andencourage joint-delivery mechanisms that are crucial inaddressing social inequities. The Norwegian experienceprovides a useful working example of how this can bedone (see Strand et al., 2009).
Yes No N/A
2. INTERSECTORAL TOOLS FOR ALL
Inequalities in health are closelyrelated to social inequalities (e.g. in
income, housing, transport). Efforts toreduce social inequalities in healththerefore, must also include sectors
other than the health system.
PrPropoporo tionate unniviverersas lism
Intteterssecctotorhhal tooolss for alll
A whole systems approach
Scale and intensity
Lifecourse approach
Social and wider determinants
Non-geographic boundaries
Gradient friendly indicators
DIMENSION ONE
3.1 APPLYING THE GRADIENT EQUITY LENS: DIMENSION ONE32
SECTION TH
REETH
E GRA
DIEN
T EVALU
ATION
FRAM
EWO
RK (GEF) IN
ACTION
General CommentsOverall ratingConsider your responses to the example questionsparticularly in relation to the background information andguidance notes provided. Now offer an overall rating of yourpolicy action in terms of this component. Simply respond‘green’, ‘amber’ or ‘red’ As amber is a particularly broadcategory, it may be useful to identify the scope forimprovement within this category. This rating will give you anindication of the ‘gradient-friendliness’ of your policy actionin terms of this particular component.
Key Action PointsWhat key areas for action have arisen from completing this self-assessment relating to Intersectoral Tools for All? What needs to be done to increase the potential ofyour policy action to impact on the gradient in health inequalities by addressing the social determinants of health which affect the health of children, youngpeople, and their families?
PrPropoporo tionate unniviverersas lism
Inttterssecttoorrhal tooolss for all
A whole systems approach
Scale and intensity
Lifecourse approach
Social and wider determinants
Non-geographic boundaries
Gradient friendly indicators
DIMENSION ONE
INTERSECTORAL TOOLS FOR ALL (DIMENSION ONE)
Key action point 1
Person responsible:
By when:
Review date:
Key action point 3
Person responsible:
By when:
Review date:
Key action point 2
Person responsible:
By when:
Review date:
Key action point 4
Person responsible:
By when:
Review date:
T a c k l i n g t h e
i n h e a l t hi n h e a l t h
OVERVIEW
3.1 APPLYING THE GRADIENT EQUITY LENS: DIMENSION ONE
SECTION TH
REETH
E GRA
DIEN
T EVALU
ATION
FRAM
EWO
RK (GEF) IN
ACTION
33
T a c k l i n g t h e
i n h e a l t hi n h e a l t h
Adoption of ‘whole-system’approaches have been usedeffectively in a range of
disciplines across the public and privatesectors particularly in relation to addressingcomplex strategic and social issues such ashealth inequalities. A whole social systemsapproach is required to tackle the gradientin health inequalities (Davies & Sherriff,2011; Marmot, 2010).
Social systems theory perceives a system asbeing made up of interdependent andrelated parts which must be considered asa whole. Adopting a whole systemsapproach is thus concerned with looking atthe 'big picture' of issues across a range ofdifferent interests within complexorganisational environments (Departmentof Health [UK], 2000). Thus, a system cannotbe viewed in isolation from its environmentand context as it is built around the threeconcepts of its structure, the process itsupports, and the outcome of its use. Thesethree categories are not independent butare linked in an underlying frameworkwhich in turn distinguishes between qualityof outcome, which is produced by quality ofprocess, which is determined by quality ofstructure (Donabedian, 1966, 1988, 2003).
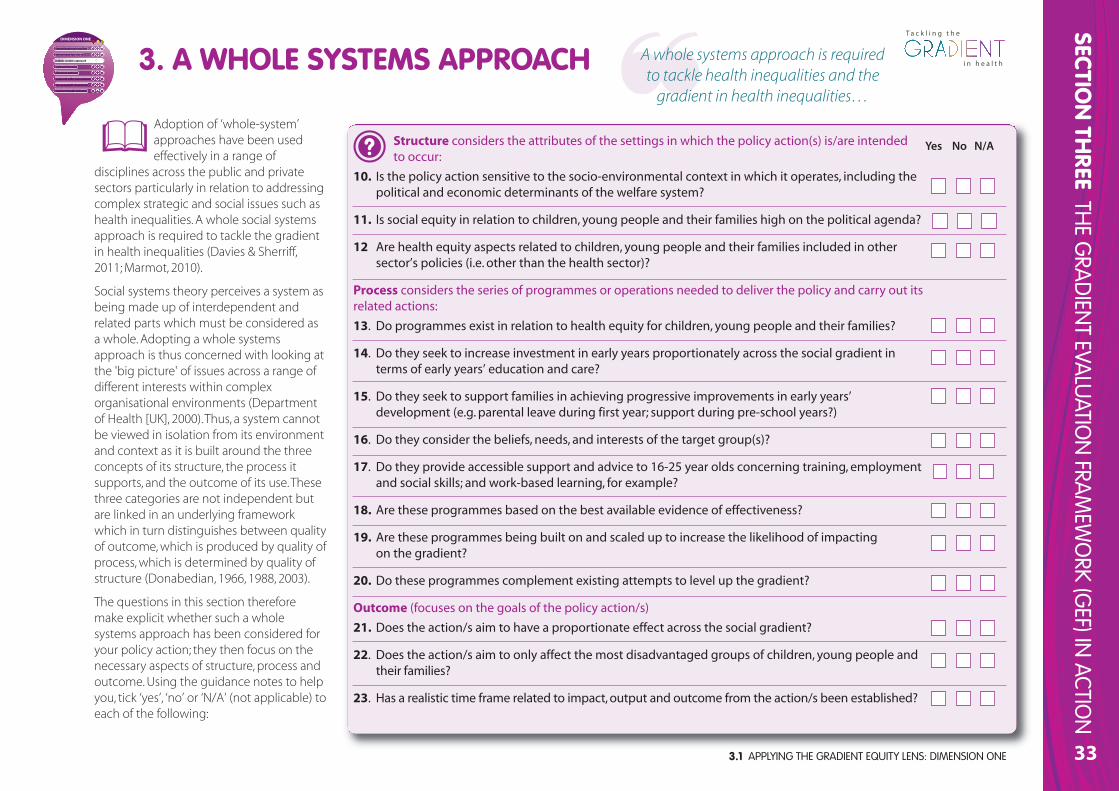
The questions in this section thereforemake explicit whether such a wholesystems approach has been considered foryour policy action; they then focus on thenecessary aspects of structure, process andoutcome. Using the guidance notes to helpyou, tick ‘yes’, ‘no’ or ‘N/A’ (not applicable) toeach of the following:
Structure considers the attributes of the settings in which the policy action(s) is/are intended to occur:
10. Is the policy action sensitive to the socio-environmental context in which it operates, including thepolitical and economic determinants of the welfare system?
11. Is social equity in relation to children, young people and their families high on the political agenda?
12 Are health equity aspects related to children, young people and their families included in othersector’s policies (i.e. other than the health sector)?
Process considers the series of programmes or operations needed to deliver the policy and carry out itsrelated actions:
13. Do programmes exist in relation to health equity for children, young people and their families?
14. Do they seek to increase investment in early years proportionately across the social gradient interms of early years’ education and care?
15. Do they seek to support families in achieving progressive improvements in early years’development (e.g. parental leave during first year; support during pre-school years?)
16. Do they consider the beliefs, needs, and interests of the target group(s)?
17. Do they provide accessible support and advice to 16-25 year olds concerning training, employmentand social skills; and work-based learning, for example?
18. Are these programmes based on the best available evidence of effectiveness?
19. Are these programmes being built on and scaled up to increase the likelihood of impacting on the gradient?
20. Do these programmes complement existing attempts to level up the gradient?
Outcome (focuses on the goals of the policy action/s)
21. Does the action/s aim to have a proportionate effect across the social gradient?
22. Does the action/s aim to only affect the most disadvantaged groups of children, young people andtheir families?
23. Has a realistic time frame related to impact, output and outcome from the action/s been established?
3. A WHOLE SYSTEMS APPROACH A whole systems approach is requiredto tackle health inequalities and the
gradient in health inequalities…
PrPropoporo tionate univiverersas lism
Intersectoral to lols s fofor r all
A wwwhoole ssysstemms aappproacch
Scale and intensity
Lifecourse approach
Social and wider determinants
Non-geographic boundaries
Gradient friendly indicators
DIMENSION ONE
Yes No N/A
3.1 APPLYING THE GRADIENT EQUITY LENS: DIMENSION ONE34
SECTION TH
REETH
E GRA
DIEN
T EVALU
ATION
FRAM
EWO
RK (GEF) IN
ACTION
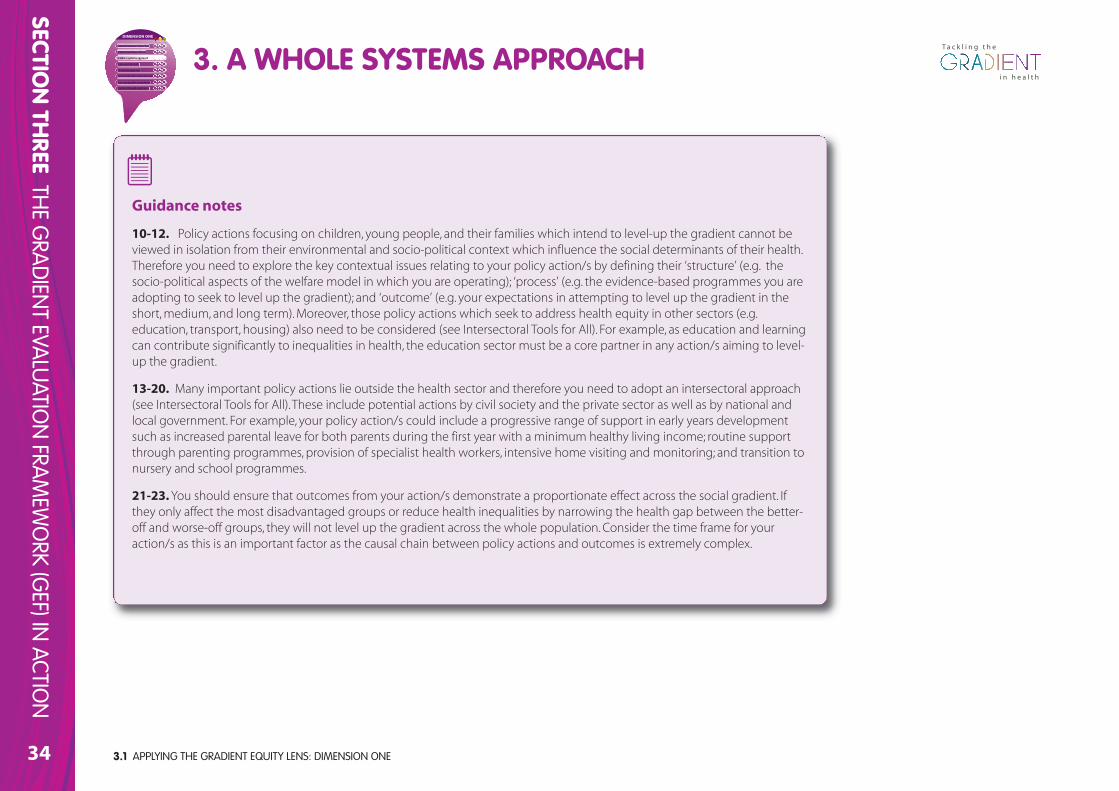
Guidance notes
10-12. Policy actions focusing on children, young people, and their families which intend to level-up the gradient cannot beviewed in isolation from their environmental and socio-political context which influence the social determinants of their health.Therefore you need to explore the key contextual issues relating to your policy action/s by defining their ‘structure’ (e.g. thesocio-political aspects of the welfare model in which you are operating); ‘process’ (e.g. the evidence-based programmes you areadopting to seek to level up the gradient); and ‘outcome’ (e.g. your expectations in attempting to level up the gradient in theshort, medium, and long term). Moreover, those policy actions which seek to address health equity in other sectors (e.g.education, transport, housing) also need to be considered (see Intersectoral Tools for All). For example, as education and learningcan contribute significantly to inequalities in health, the education sector must be a core partner in any action/s aiming to level-up the gradient.
13-20. Many important policy actions lie outside the health sector and therefore you need to adopt an intersectoral approach(see Intersectoral Tools for All). These include potential actions by civil society and the private sector as well as by national andlocal government. For example, your policy action/s could include a progressive range of support in early years developmentsuch as increased parental leave for both parents during the first year with a minimum healthy living income; routine supportthrough parenting programmes, provision of specialist health workers, intensive home visiting and monitoring; and transition tonursery and school programmes.
21-23. You should ensure that outcomes from your action/s demonstrate a proportionate effect across the social gradient. Ifthey only affect the most disadvantaged groups or reduce health inequalities by narrowing the health gap between the better-off and worse-off groups, they will not level up the gradient across the whole population. Consider the time frame for youraction/s as this is an important factor as the causal chain between policy actions and outcomes is extremely complex.
3. A WHOLE SYSTEMS APPROACH
PrPropoporo tionate univiverersas lism
Intersectoral to lols s fofor r all
A wwwhole ssysstemms aappproacch
Scale and intensity
Lifecourse approach
Social and wider determinants
Non-geographic boundaries
Gradient friendly indicators
DIMENSION ONE
T a c k l i n g t h e
i n h e a l t hi n h e a l t h
3.1 APPLYING THE GRADIENT EQUITY LENS: DIMENSION ONE 35
T a c k l i n g t h e
i n h e a l t hi n h e a l t h
SECTION TH
REETH
E GRA
DIEN
T EVALU
ATION
FRAM
EWO
RK (GEF) IN
ACTION
General CommentsOverall ratingConsider all of your responses to the example questionsparticularly in relation to the background information andguidance notes provided. Now offer an overall rating of yourpolicy action in terms of this component. Simply respond‘green’, ‘amber’ or ‘red’ As amber is a particularly broadcategory, it may be useful to identify the scope forimprovement within this category. This rating will give youan indication of the ‘gradient-friendliness’ of your policyaction in terms of this particular component.
Key Action PointsWhat key areas for action have arisen from completing this self-assessment relating to a Whole Systems Approach? What needs to be done to increase thepotential of your policy action to impact on the gradient in health inequalities by addressing the social determinants of health which affect the health of children,young people, and their families?
PrPropoporo tionate unniviverersas lism
Intersectoral to lols s fofor all
A wwwhoole e ssysstemms aappproacch
Scale and intensity
Lifecourse approach
Social and wider determinants
Non-geographic boundaries
Gradient friendly indicators
DIMENSION ONE
A WHOLE SYSTEMS APPROACH (DIMENSION ONE)
Key action point 1
Person responsible:
By when:
Review date:
Key action point 3
Person responsible:
By when:
Review date:
Key action point 2
Person responsible:
By when:
Review date:
Key action point 4
Person responsible:
By when:
Review date:
OVERVIEW
3.1 APPLYING THE GRADIENT EQUITY LENS: DIMENSION ONE36
SECTION TH
REETH
E GRA
DIEN
T EVALU
ATION
FRAM
EWO
RK (GEF) IN
ACTION
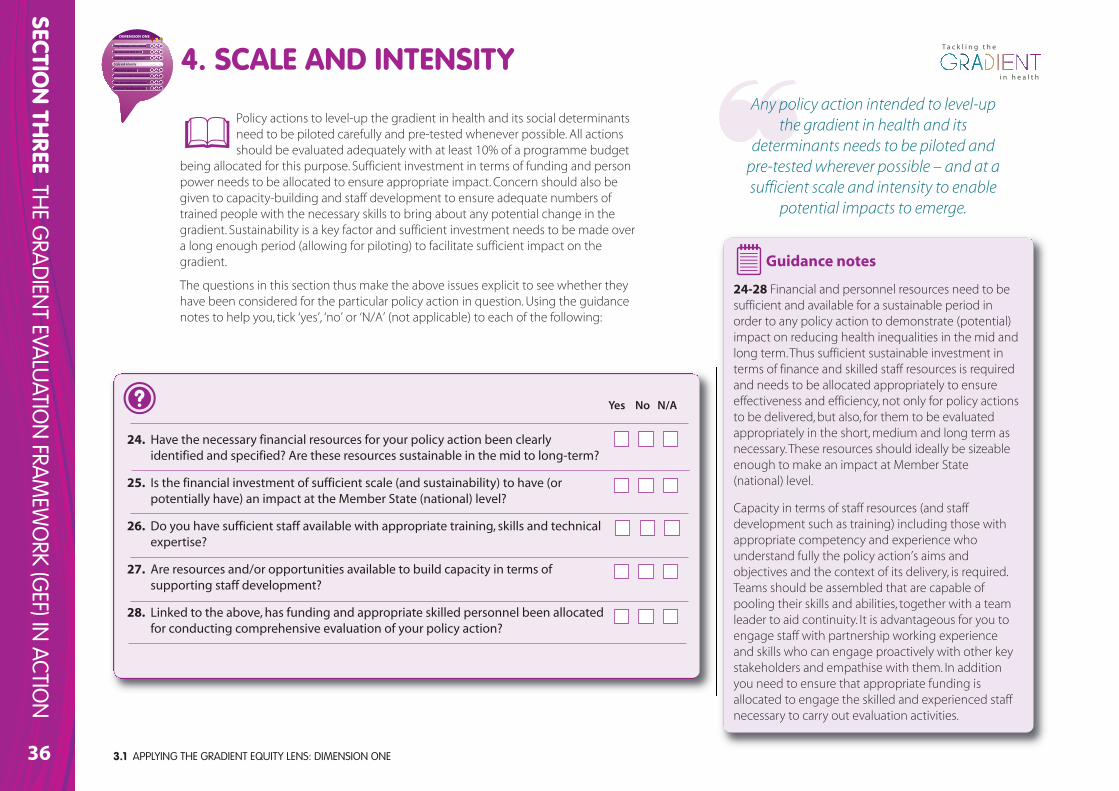
Policy actions to level-up the gradient in health and its social determinantsneed to be piloted carefully and pre-tested whenever possible. All actionsshould be evaluated adequately with at least 10% of a programme budget
being allocated for this purpose. Sufficient investment in terms of funding and personpower needs to be allocated to ensure appropriate impact. Concern should also begiven to capacity-building and staff development to ensure adequate numbers oftrained people with the necessary skills to bring about any potential change in thegradient. Sustainability is a key factor and sufficient investment needs to be made overa long enough period (allowing for piloting) to facilitate sufficient impact on thegradient.
The questions in this section thus make the above issues explicit to see whether theyhave been considered for the particular policy action in question. Using the guidancenotes to help you, tick ‘yes’, ‘no’ or ‘N/A’ (not applicable) to each of the following:
24. Have the necessary financial resources for your policy action been clearlyidentified and specified? Are these resources sustainable in the mid to long-term?
25. Is the financial investment of sufficient scale (and sustainability) to have (orpotentially have) an impact at the Member State (national) level?
26. Do you have sufficient staff available with appropriate training, skills and technicalexpertise?
27. Are resources and/or opportunities available to build capacity in terms ofsupporting staff development?
28. Linked to the above, has funding and appropriate skilled personnel been allocatedfor conducting comprehensive evaluation of your policy action?
Guidance notes
24-28 Financial and personnel resources need to besufficient and available for a sustainable period inorder to any policy action to demonstrate (potential)impact on reducing health inequalities in the mid andlong term. Thus sufficient sustainable investment interms of finance and skilled staff resources is requiredand needs to be allocated appropriately to ensureeffectiveness and efficiency, not only for policy actionsto be delivered, but also, for them to be evaluatedappropriately in the short, medium and long term asnecessary. These resources should ideally be sizeableenough to make an impact at Member State(national) level.
Capacity in terms of staff resources (and staffdevelopment such as training) including those withappropriate competency and experience whounderstand fully the policy action’s aims andobjectives and the context of its delivery, is required.Teams should be assembled that are capable ofpooling their skills and abilities, together with a teamleader to aid continuity. It is advantageous for you toengage staff with partnership working experienceand skills who can engage proactively with other keystakeholders and empathise with them. In additionyou need to ensure that appropriate funding isallocated to engage the skilled and experienced staffnecessary to carry out evaluation activities.
Yes No N/A
4. SCALE AND INTENSITY Any policy action intended to level-up
the gradient in health and itsdeterminants needs to be piloted and
pre-tested wherever possible – and at asufficient scale and intensity to enable
potential impacts to emerge.
PrPropoporo tionate univiverersas lism
Intersectoral to lols s fofor r all
Scale and intensity
Lifecourse approach
Social and wider determinants
Non-geographic boundaries
Gradient friendly indicators
DIMENSION ONE
A whole systems approach
T a c k l i n g t h e
i n h e a l t hi n h e a l t h

3.1 APPLYING THE GRADIENT EQUITY LENS: DIMENSION ONE
SECTION TH
REETH
E GRA
DIEN
T EVALU
ATION
FRAM
EWO
RK (GEF) IN
ACTION
37
T a c k l i n g t h e
i n h e a l t hi n h e a l t h
General CommentsOverall ratingConsider all of your responses to the example questionsparticularly in relation to the background information andguidance notes provided. Now offer an overall rating of yourpolicy action in terms of this component. Simply respond‘green’, ‘amber’ or ‘red’ As amber is a particularly broadcategory, it may be useful to identify the scope forimprovement within this category. This rating will give youan indication of the ‘gradient-friendliness’ of your policyaction in terms of this particular component.
Key Action PointsWhat key areas for action have arisen from completing this self-assessment relating to Scale and Intensity? What needs to be done to increase the potential of yourpolicy action to impact on the gradient in health inequalities by addressing the social determinants of health which affect the health of children, young people,and their families?
PrPropoporo tionate unniviverersas lism
Intersectoral to lols s fofor r all
Scale and intensity
Lifecourse approach
Social and wider determinants
Non-geographic boundaries
Gradient friendly indicators
DIMENSION ONE
A whole systems approach
SCALE AND INTENSITY (DIMENSION ONE)
Key action point 1
Person responsible:
By when:
Review date:
Key action point 3
Person responsible:
By when:
Review date:
Key action point 2
Person responsible:
By when:
Review date:
Key action point 4
Person responsible:
By when:
Review date:
OVERVIEW
3.1 APPLYING THE GRADIENT EQUITY LENS: DIMENSION ONE38
SECTION TH
REETH
E GRA
DIEN
T EVALU
ATION
FRAM
EWO
RK (GEF) IN
ACTION
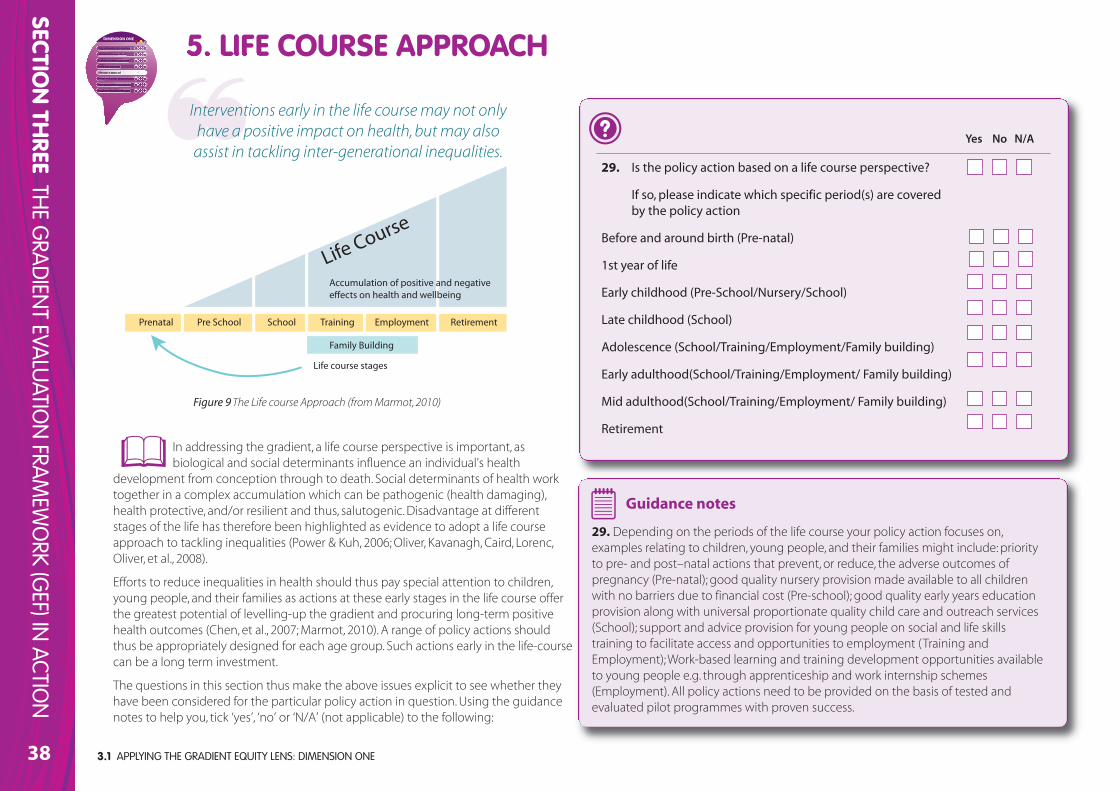
In addressing the gradient, a life course perspective is important, asbiological and social determinants influence an individual’s health
development from conception through to death. Social determinants of health worktogether in a complex accumulation which can be pathogenic (health damaging),health protective, and/or resilient and thus, salutogenic. Disadvantage at differentstages of the life has therefore been highlighted as evidence to adopt a life courseapproach to tackling inequalities (Power & Kuh, 2006; Oliver, Kavanagh, Caird, Lorenc,Oliver, et al., 2008).
Efforts to reduce inequalities in health should thus pay special attention to children,young people, and their families as actions at these early stages in the life course offerthe greatest potential of levelling-up the gradient and procuring long-term positivehealth outcomes (Chen, et al., 2007; Marmot, 2010). A range of policy actions shouldthus be appropriately designed for each age group. Such actions early in the life-coursecan be a long term investment.
The questions in this section thus make the above issues explicit to see whether theyhave been considered for the particular policy action in question. Using the guidancenotes to help you, tick ‘yes’, ‘no’ or ‘N/A’ (not applicable) to the following:
29. Is the policy action based on a life course perspective?
If so, please indicate which specific period(s) are coveredby the policy action
Before and around birth (Pre-natal)
1st year of life
Early childhood (Pre-School/Nursery/School)
Late childhood (School)
Adolescence (School/Training/Employment/Family building)
Early adulthood(School/Training/Employment/ Family building)
Mid adulthood(School/Training/Employment/ Family building)
Retirement
Guidance notes
29. Depending on the periods of the life course your policy action focuses on,examples relating to children, young people, and their families might include: priorityto pre- and post–natal actions that prevent, or reduce, the adverse outcomes ofpregnancy (Pre-natal); good quality nursery provision made available to all childrenwith no barriers due to financial cost (Pre-school); good quality early years educationprovision along with universal proportionate quality child care and outreach services(School); support and advice provision for young people on social and life skillstraining to facilitate access and opportunities to employment (Training andEmployment); Work-based learning and training development opportunities availableto young people e.g. through apprenticeship and work internship schemes(Employment). All policy actions need to be provided on the basis of tested andevaluated pilot programmes with proven success.
Yes No N/A
5. LIFE COURSE APPROACH
PrPropoporo tionate univiverersas lism
Intersectoral to lols s fofor r all
Scale and intensity
Liffeecourse appprooachh
Social and wider determinants
Non-geographic boundaries
Gradient friendly indicators
DIMENSION ONE
A whole systems approach
Prenatal Pre School School Training Employment
Family Building
Life course stages
Retirement
Life Course
Accumulation of positive and negative e!ects on health and wellbeing
Figure 9The Life course Approach (from Marmot, 2010)
Interventions early in the life course may not onlyhave a positive impact on health, but may alsoassist in tackling inter-generational inequalities.
3.1 APPLYING THE GRADIENT EQUITY LENS: DIMENSION ONE
SECTION TH
REETH
E GRA
DIEN
T EVALU
ATION
FRAM
EWO
RK (GEF) IN
ACTION
39
T a c k l i n g t h e
i n h e a l t hi n h e a l t h
General Comments
Key Action PointsWhat key areas for action have arisen from completing this self-assessment relating to a Life Course Approach? What needs to be done to increase the potential ofyour policy action to impact on the gradient in health inequalities by addressing the social determinants of health which affect the health of children, youngpeople, and their families?
PrPropoporo tionate unniviverersas lism
Intersectoral to lols s fofor r all
Scale and intensity
Liffeecourse appprooachh
Social and wider determinants
Non-geographic boundaries
Gradient friendly indicators
DIMENSION ONE
A whole systems approach
LIFE COURSE APPROACH (DIMENSION ONE)
Key action point 1
Person responsible:
By when:
Review date:
Key action point 3
Person responsible:
By when:
Review date:
Key action point 2
Person responsible:
By when:
Review date:
Key action point 4
Person responsible:
By when:
Review date:
OVERVIEW
Overall ratingConsider all of your responses to the example questionsparticularly in relation to the background information andguidance notes provided. Now offer an overall rating of yourpolicy action in terms of this component. Simply respond‘green’, ‘amber’ or ‘red’ As amber is a particularly broadcategory, it may be useful to identify the scope forimprovement within this category. This rating will give youan indication of the ‘gradient-friendliness’ of your policyaction in terms of this particular component.
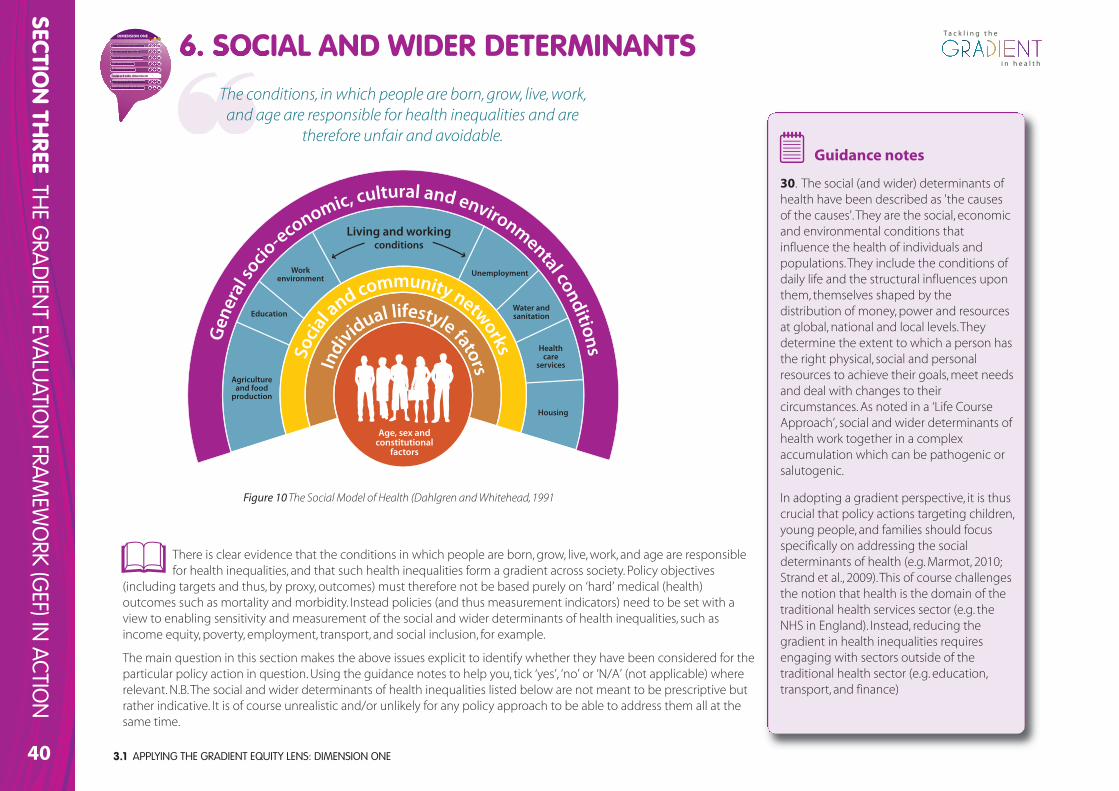
3.1 APPLYING THE GRADIENT EQUITY LENS: DIMENSION ONE40
SECTION TH
REETH
E GRA
DIEN
T EVALU
ATION
FRAM
EWO
RK (GEF) IN
ACTION
T a c k l i n g t h e
i n h e a l t hi n h e a l t h
There is clear evidence that the conditions in which people are born, grow, live, work, and age are responsiblefor health inequalities, and that such health inequalities form a gradient across society. Policy objectives
(including targets and thus, by proxy, outcomes) must therefore not be based purely on ‘hard’ medical (health)outcomes such as mortality and morbidity. Instead policies (and thus measurement indicators) need to be set with aview to enabling sensitivity and measurement of the social and wider determinants of health inequalities, such asincome equity, poverty, employment, transport, and social inclusion, for example.
The main question in this section makes the above issues explicit to identify whether they have been considered for theparticular policy action in question. Using the guidance notes to help you, tick ‘yes’, ‘no’ or ‘N/A’ (not applicable) whererelevant. N.B. The social and wider determinants of health inequalities listed below are not meant to be prescriptive butrather indicative. It is of course unrealistic and/or unlikely for any policy approach to be able to address them all at thesame time.
Guidance notes
30. The social (and wider) determinants ofhealth have been described as 'the causesof the causes'. They are the social, economicand environmental conditions thatinfluence the health of individuals andpopulations. They include the conditions ofdaily life and the structural influences uponthem, themselves shaped by thedistribution of money, power and resourcesat global, national and local levels. Theydetermine the extent to which a person hasthe right physical, social and personalresources to achieve their goals, meet needsand deal with changes to theircircumstances. As noted in a ‘Life CourseApproach’, social and wider determinants ofhealth work together in a complexaccumulation which can be pathogenic orsalutogenic.
In adopting a gradient perspective, it is thuscrucial that policy actions targeting children,young people, and families should focusspecifically on addressing the socialdeterminants of health (e.g. Marmot, 2010;Strand et al., 2009). This of course challengesthe notion that health is the domain of thetraditional health services sector (e.g. theNHS in England). Instead, reducing thegradient in health inequalities requiresengaging with sectors outside of thetraditional health sector (e.g. education,transport, and finance)
6. SOCIAL AND WIDER DETERMINANTS The conditions, in which people are born, grow, live, work,and age are responsible for health inequalities and are
therefore unfair and avoidable.
PrPropoporo tionate univiverersas lism
Intersectoral to lols s fofor r all
A whole systems approach
Scale and intensity
Lifecourse approach
Socccial and w wider detteerminaants
Non-geographic boundaries
Gradient friendly indicators
DIMENSION ONE
Figure 10The Social Model of Health (Dahlgren and Whitehead, 1991
Agricultureand food
production
Education
Work environment
Unemployment
Water andsanitation
Housing
Healthcare
services
Living and workingconditions
Age, sex andconstitutional
factors
Individual lifestyle fatorsSo
cial a
nd community networksGen
eral
socio
-economic, cultural and environmental conditions
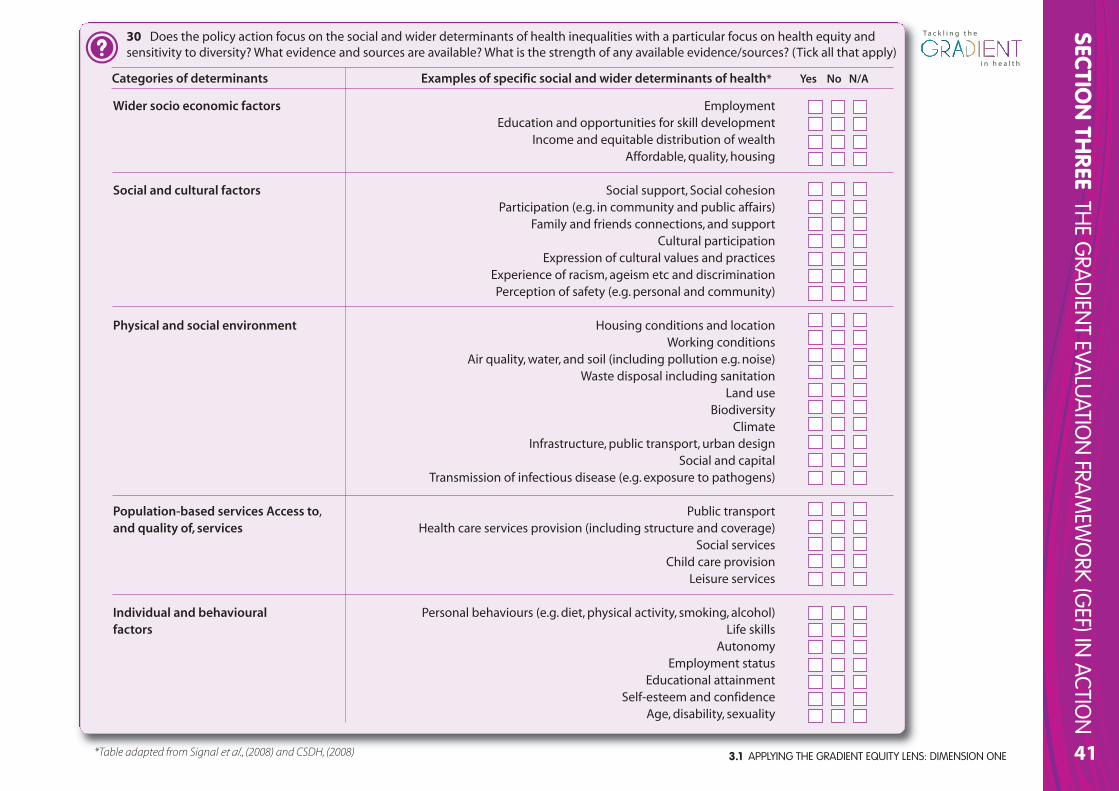
3.1 APPLYING THE GRADIENT EQUITY LENS: DIMENSION ONE
SECTION TH
REETH
E GRA
DIEN
T EVALU
ATION
FRAM
EWO
RK (GEF) IN
ACTION
41
T a c k l i n g t h e
i n h e a l t hi n h e a l t h
30 Does the policy action focus on the social and wider determinants of health inequalities with a particular focus on health equity andsensitivity to diversity? What evidence and sources are available? What is the strength of any available evidence/sources? (Tick all that apply)
Categories of determinants Examples of specific social and wider determinants of health* Yes No N/A
Wider socio economic factors EmploymentEducation and opportunities for skill development
Income and equitable distribution of wealthAffordable, quality, housing
Social and cultural factors Social support, Social cohesionParticipation (e.g. in community and public affairs)
Family and friends connections, and supportCultural participation
Expression of cultural values and practicesExperience of racism, ageism etc and discriminationPerception of safety (e.g. personal and community)
Physical and social environment Housing conditions and locationWorking conditions
Air quality, water, and soil (including pollution e.g. noise)Waste disposal including sanitation
Land useBiodiversity
ClimateInfrastructure, public transport, urban design
Social and capitalTransmission of infectious disease (e.g. exposure to pathogens)
Population-based services Access to, Public transportand quality of, services Health care services provision (including structure and coverage)
Social servicesChild care provision
Leisure services
Individual and behavioural Personal behaviours (e.g. diet, physical activity, smoking, alcohol)factors Life skills
AutonomyEmployment status
Educational attainmentSelf-esteem and confidence
Age, disability, sexuality
*Table adapted from Signal et al., (2008) and CSDH, (2008)
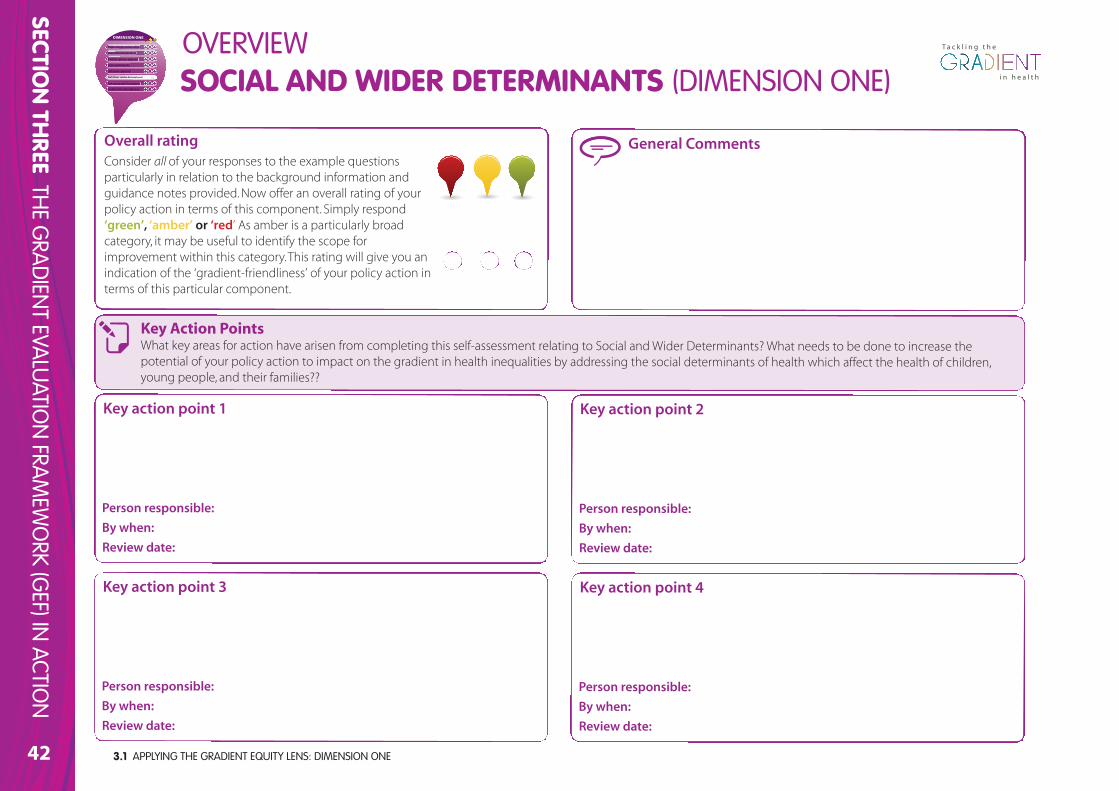
3.1 APPLYING THE GRADIENT EQUITY LENS: DIMENSION ONE42
SECTION TH
REETH
E GRA
DIEN
T EVALU
ATION
FRAM
EWO
RK (GEF) IN
ACTION
General CommentsOverall ratingConsider all of your responses to the example questionsparticularly in relation to the background information andguidance notes provided. Now offer an overall rating of yourpolicy action in terms of this component. Simply respond‘green’, ‘amber’ or ‘red’ As amber is a particularly broadcategory, it may be useful to identify the scope forimprovement within this category. This rating will give you anindication of the ‘gradient-friendliness’ of your policy action interms of this particular component.
Key Action PointsWhat key areas for action have arisen from completing this self-assessment relating to Social and Wider Determinants? What needs to be done to increase thepotential of your policy action to impact on the gradient in health inequalities by addressing the social determinants of health which affect the health of children,young people, and their families??
PrPropoporo tionate unniviverersas lism
Intersectoral to lols s fofor r all
A whole systems approach
Scale and intensity
Lifecourse approach
Socccial andd w iderr detteerminaants
Non-geographic boundaries
Gradient friendly indicators
DIMENSION ONE
SOCIAL AND WIDER DETERMINANTS (DIMENSION ONE)
Key action point 1
Person responsible:
By when:
Review date:
Key action point 3
Person responsible:
By when:
Review date:
Key action point 2
Person responsible:
By when:
Review date:
Key action point 4
Person responsible:
By when:
Review date:
T a c k l i n g t h e
i n h e a l t hi n h e a l t h
OVERVIEW
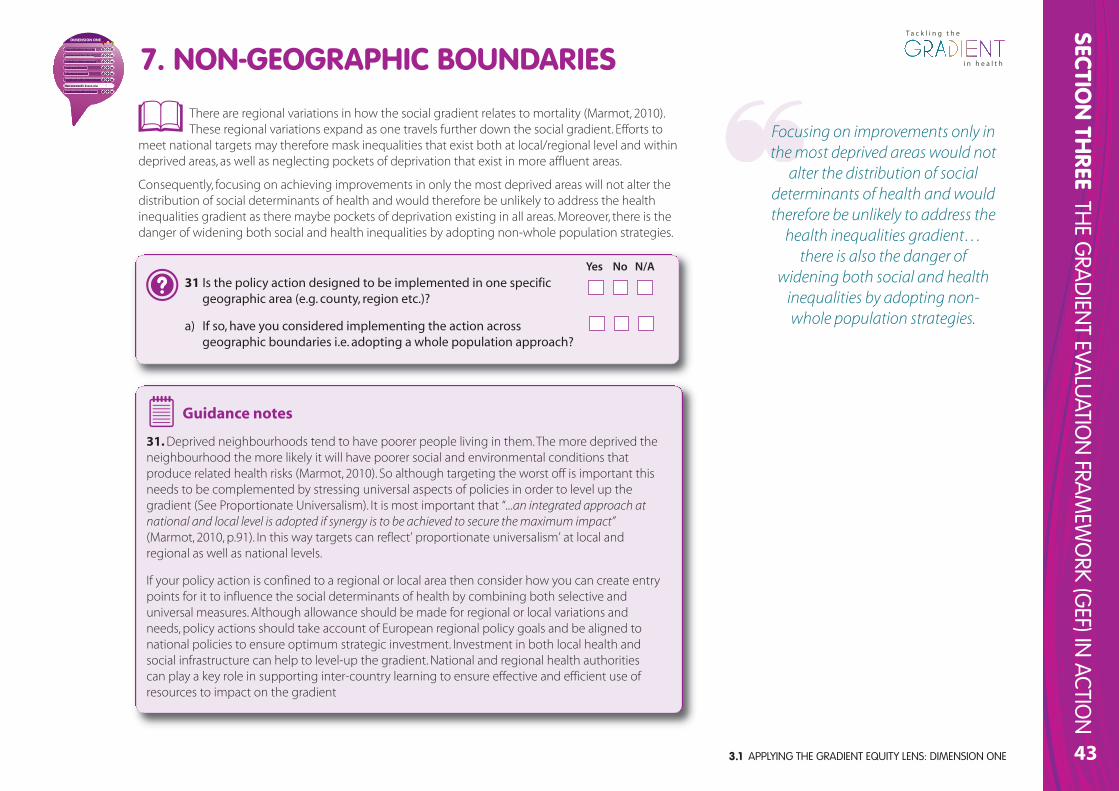
3.1 APPLYING THE GRADIENT EQUITY LENS: DIMENSION ONE
SECTION TH
REETH
E GRA
DIEN
T EVALU
ATION
FRAM
EWO
RK (GEF) IN
ACTION
43
T a c k l i n g t h e
i n h e a l t hi n h e a l t h
There are regional variations in how the social gradient relates to mortality (Marmot, 2010).These regional variations expand as one travels further down the social gradient. Efforts to
meet national targets may therefore mask inequalities that exist both at local/regional level and withindeprived areas, as well as neglecting pockets of deprivation that exist in more affluent areas.
Consequently, focusing on achieving improvements in only the most deprived areas will not alter thedistribution of social determinants of health and would therefore be unlikely to address the healthinequalities gradient as there maybe pockets of deprivation existing in all areas. Moreover, there is thedanger of widening both social and health inequalities by adopting non-whole population strategies.
31 Is the policy action designed to be implemented in one specificgeographic area (e.g. county, region etc.)?
a) If so, have you considered implementing the action acrossgeographic boundaries i.e. adopting a whole population approach?
Guidance notes
31. Deprived neighbourhoods tend to have poorer people living in them. The more deprived theneighbourhood the more likely it will have poorer social and environmental conditions thatproduce related health risks (Marmot, 2010). So although targeting the worst off is important thisneeds to be complemented by stressing universal aspects of policies in order to level up thegradient (See Proportionate Universalism). It is most important that “...an integrated approach atnational and local level is adopted if synergy is to be achieved to secure the maximum impact”(Marmot, 2010, p.91). In this way targets can reflect’ proportionate universalism’ at local andregional as well as national levels.
If your policy action is confined to a regional or local area then consider how you can create entrypoints for it to influence the social determinants of health by combining both selective anduniversal measures. Although allowance should be made for regional or local variations andneeds, policy actions should take account of European regional policy goals and be aligned tonational policies to ensure optimum strategic investment. Investment in both local health andsocial infrastructure can help to level-up the gradient. National and regional health authoritiescan play a key role in supporting inter-country learning to ensure effective and efficient use ofresources to impact on the gradient
Yes No N/A
7. NON-GEOGRAPHIC BOUNDARIES
Focusing on improvements only inthe most deprived areas would not
alter the distribution of socialdeterminants of health and wouldtherefore be unlikely to address the
health inequalities gradient…there is also the danger of
widening both social and healthinequalities by adopting non-whole population strategies.
PrPropoporo tionate iniveversrsala ism
Intersectoral to lols s fofor r all
A whole systems approach
Scale and intensity
Lifecourse approach
Social and wider determinants
Non-ggeoggrrapphic bouunndariess
Gradient friendly indicators
DIMENSION ONE

3.1 APPLYING THE GRADIENT EQUITY LENS: DIMENSION ONE44
SECTION TH
REETH
E GRA
DIEN
T EVALU
ATION
FRAM
EWO
RK (GEF) IN
ACTION
General CommentsOverall ratingConsider all of your responses to the example questionsparticularly in relation to the background information andguidance notes provided. Now offer an overall rating of yourpolicy action in terms of this component. Simply respond‘green’, ‘amber’ or ‘red’ As amber is a particularly broadcategory, it may be useful to identify the scope forimprovement within this category. This rating will give youan indication of the ‘gradient-friendliness’ of your policyaction in terms of this particular component.
Key Action PointsWhat key areas for action have arisen from completing this self-assessment relating to Non-Geographic Boundaries? What needs to be done to increase thepotential of your policy action to impact on the gradient in health inequalities by addressing the social determinants of health which affect the health of children,young people, and their families?
PrPropoporo tionate iniveversrsala ism
Intersectoral to lols s fofor r all
A whole systems approach
Scale and intensity
Lifecourse approach
Social and wider determinants
Nonn-ggeoggrrapphicc bouunndariess
Gradient friendly indicators
DIMENSION ONE
NON-GEOGRAPHIC BOUNDARIES (DIMENSION ONE)
Key action point 1
Person responsible:
By when:
Review date:
Key action point 3
Person responsible:
By when:
Review date:
Key action point 2
Person responsible:
By when:
Review date:
Key action point 4
Person responsible:
By when:
Review date:
T a c k l i n g t h e
i n h e a l t hi n h e a l t h
OVERVIEW
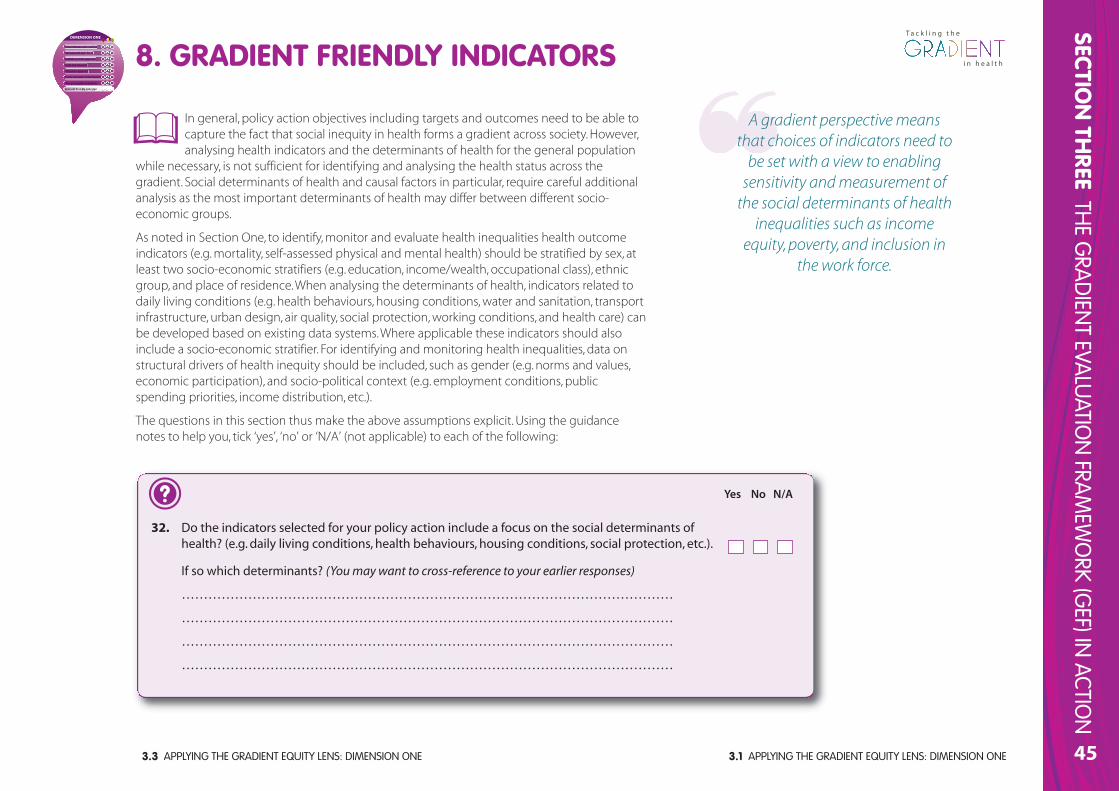
3.1 APPLYING THE GRADIENT EQUITY LENS: DIMENSION ONE
SECTION TH
REETH
E GRA
DIEN
T EVALU
ATION
FRAM
EWO
RK (GEF) IN
ACTION
45
T a c k l i n g t h e
i n h e a l t hi n h e a l t h
In general, policy action objectives including targets and outcomes need to be able tocapture the fact that social inequity in health forms a gradient across society. However,analysing health indicators and the determinants of health for the general population
while necessary, is not sufficient for identifying and analysing the health status across thegradient. Social determinants of health and causal factors in particular, require careful additionalanalysis as the most important determinants of health may differ between different socio-economic groups.
As noted in Section One, to identify, monitor and evaluate health inequalities health outcomeindicators (e.g. mortality, self-assessed physical and mental health) should be stratified by sex, atleast two socio-economic stratifiers (e.g. education, income/wealth, occupational class), ethnicgroup, and place of residence. When analysing the determinants of health, indicators related todaily living conditions (e.g. health behaviours, housing conditions, water and sanitation, transportinfrastructure, urban design, air quality, social protection, working conditions, and health care) canbe developed based on existing data systems. Where applicable these indicators should alsoinclude a socio-economic stratifier. For identifying and monitoring health inequalities, data onstructural drivers of health inequity should be included, such as gender (e.g. norms and values,economic participation), and socio-political context (e.g. employment conditions, publicspending priorities, income distribution, etc.).
The questions in this section thus make the above assumptions explicit. Using the guidancenotes to help you, tick ‘yes’, ‘no’ or ‘N/A’ (not applicable) to each of the following:
8. GRADIENT FRIENDLY INDICATORS
A gradient perspective meansthat choices of indicators need to
be set with a view to enablingsensitivity and measurement of
the social determinants of healthinequalities such as income
equity, poverty, and inclusion inthe work force.
PrPropoporo tionate unniviverersalism
Intersectoral to lols s fofor r all
A whole systems approach
Scale and intensity
Lifecourse approach
Social and wider determinants
Non-geographic boundaries
Graaadieentt frrieendly y inddiicatorss
DIMENSION ONE
3.3 APPLYING THE GRADIENT EQUITY LENS: DIMENSION ONE
32. Do the indicators selected for your policy action include a focus on the social determinants ofhealth? (e.g. daily living conditions, health behaviours, housing conditions, social protection, etc.).
If so which determinants? (You may want to cross-reference to your earlier responses)
…………………………………………………………………………………………………
……………………………………………………………………………………………… …
……………………………………………………………………………………………… …
……………………………………………………………………………………………… …
Yes No N/A
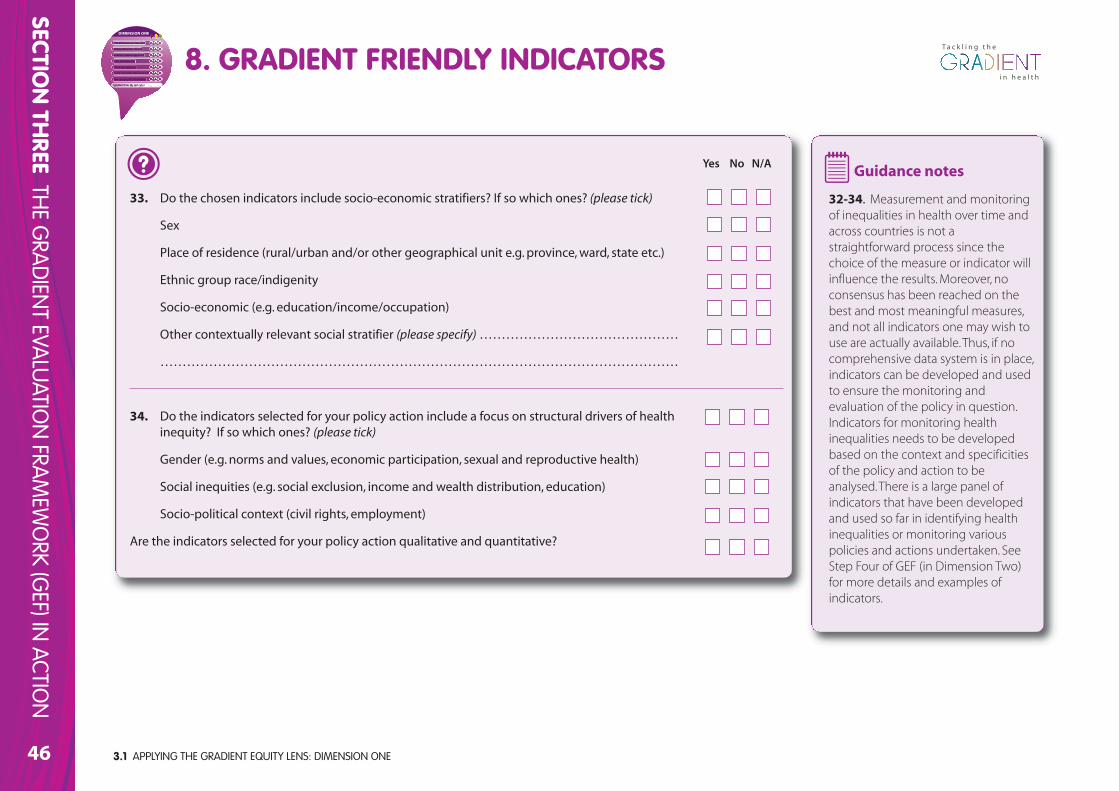
3.1 APPLYING THE GRADIENT EQUITY LENS: DIMENSION ONE46
SECTION TH
REETH
E GRA
DIEN
T EVALU
ATION
FRAM
EWO
RK (GEF) IN
ACTION
T a c k l i n g t h e
i n h e a l t hi n h e a l t h
Guidance notes
32-34. Measurement and monitoringof inequalities in health over time andacross countries is not astraightforward process since thechoice of the measure or indicator willinfluence the results. Moreover, noconsensus has been reached on thebest and most meaningful measures,and not all indicators one may wish touse are actually available. Thus, if nocomprehensive data system is in place,indicators can be developed and usedto ensure the monitoring andevaluation of the policy in question.Indicators for monitoring healthinequalities needs to be developedbased on the context and specificitiesof the policy and action to beanalysed. There is a large panel ofindicators that have been developedand used so far in identifying healthinequalities or monitoring variouspolicies and actions undertaken. SeeStep Four of GEF (in Dimension Two)for more details and examples ofindicators.
33. Do the chosen indicators include socio-economic stratifiers? If so which ones? (please tick)
Sex
Place of residence (rural/urban and/or other geographical unit e.g. province, ward, state etc.)
Ethnic group race/indigenity
Socio-economic (e.g. education/income/occupation)
Other contextually relevant social stratifier (please specify) ………………………………………
………………………………………………………………………………………………………
34. Do the indicators selected for your policy action include a focus on structural drivers of healthinequity? If so which ones? (please tick)
Gender (e.g. norms and values, economic participation, sexual and reproductive health)
Social inequities (e.g. social exclusion, income and wealth distribution, education)
Socio-political context (civil rights, employment)
Are the indicators selected for your policy action qualitative and quantitative?
Yes No N/A
8. GRADIENT FRIENDLY INDICATORS
PrPropoporo tionate unniviverersalism
Intersectoral to lols s fofor r all
A whole systems approach
Scale and intensity
Lifecourse approach
Social and wider determinants
Non-geographic boundaries
Graaadieentt frrieendly y inddiicatorss
DIMENSION ONE
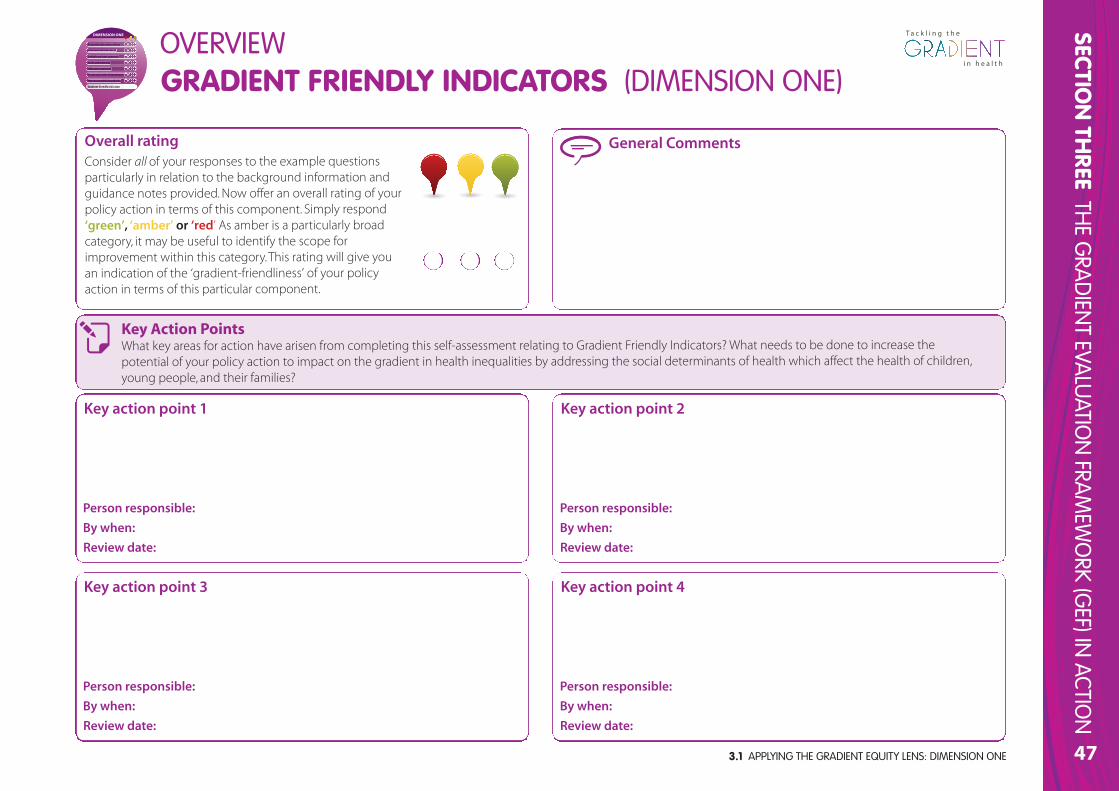
3.1 APPLYING THE GRADIENT EQUITY LENS: DIMENSION ONE
SECTION TH
REETH
E GRA
DIEN
T EVALU
ATION
FRAM
EWO
RK (GEF) IN
ACTION
47
T a c k l i n g t h e
i n h e a l t hi n h e a l t h
General CommentsOverall ratingConsider all of your responses to the example questionsparticularly in relation to the background information andguidance notes provided. Now offer an overall rating of yourpolicy action in terms of this component. Simply respond‘green’, ‘amber’ or ‘red’ As amber is a particularly broadcategory, it may be useful to identify the scope forimprovement within this category. This rating will give youan indication of the ‘gradient-friendliness’ of your policyaction in terms of this particular component.
Key Action PointsWhat key areas for action have arisen from completing this self-assessment relating to Gradient Friendly Indicators? What needs to be done to increase thepotential of your policy action to impact on the gradient in health inequalities by addressing the social determinants of health which affect the health of children,young people, and their families?
PrPropoporo tionate univiverersas lism
Intersectoral to lols s fofor r all
A whole systems approach
Scale and intensity
Lifecourse approach
Social and wider determinants
Non-geographic boundaries
Graaadieentt frrieendly y inddiicators
DIMENSION ONE
GRADIENT FRIENDLY INDICATORS (DIMENSION ONE)
Key action point 1
Person responsible:
By when:
Review date:
Key action point 3
Person responsible:
By when:
Review date:
Key action point 2
Person responsible:
By when:
Review date:
Key action point 4
Person responsible:
By when:
Review date:
OVERVIEW
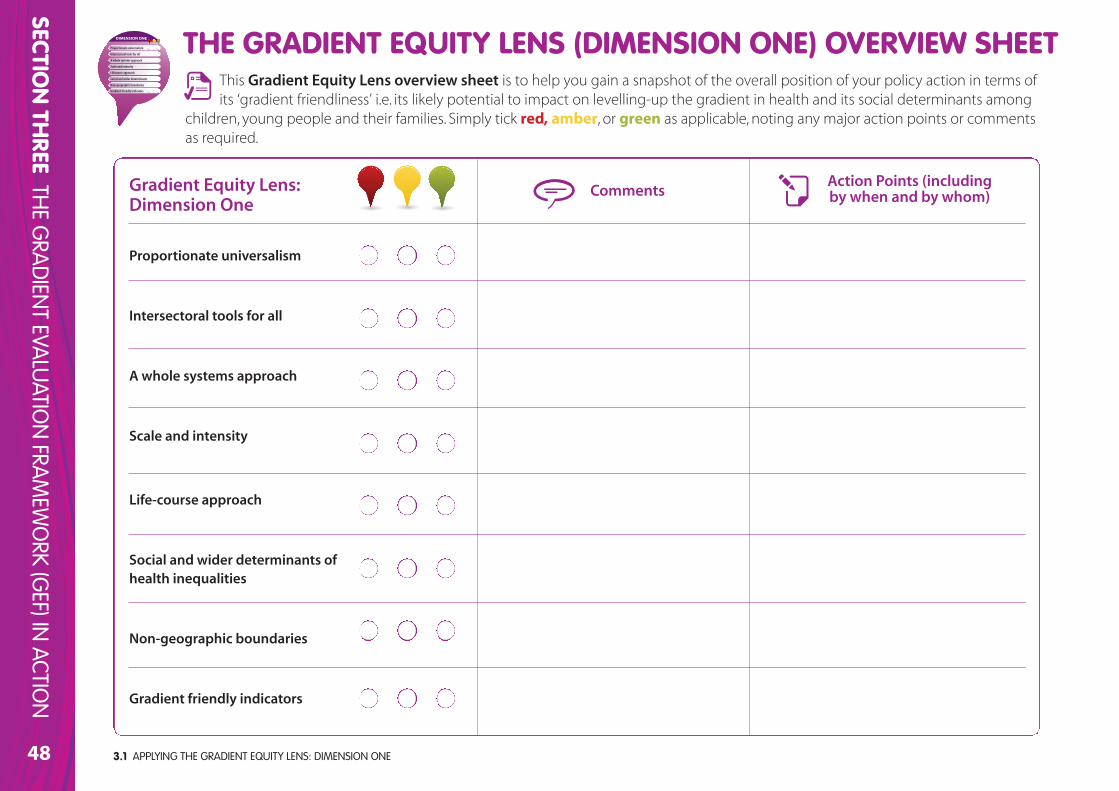
3.1 APPLYING THE GRADIENT EQUITY LENS: DIMENSION ONE48
SECTION TH
REETH
E GRA
DIEN
T EVALU
ATION
FRAM
EWO
RK (GEF) IN
ACTION
Gradient Equity Lens: Dimension One
Proportionate universalism
Intersectoral tools for all
A whole systems approach
Scale and intensity
Life-course approach
Social and wider determinants ofhealth inequalities
Non-geographic boundaries
Gradient friendly indicators
Comments
This Gradient Equity Lens overview sheet is to help you gain a snapshot of the overall position of your policy action in terms ofits ‘gradient friendliness’ i.e. its likely potential to impact on levelling-up the gradient in health and its social determinants among
children, young people and their families. Simply tick red, amber, or green as applicable, noting any major action points or commentsas required.
THE GRADIENT EQUITY LENS (DIMENSION ONE) OVERVIEW SHEETProportionate universalism
Intersectoral tools for all
A whole systems approach
Scale and intensity
Lifecourse approach
Social and wider determinants
Non-geographic boundaries
Gradient friendly indicators
DIMENSION ONE
Action Points (includingby when and by whom)
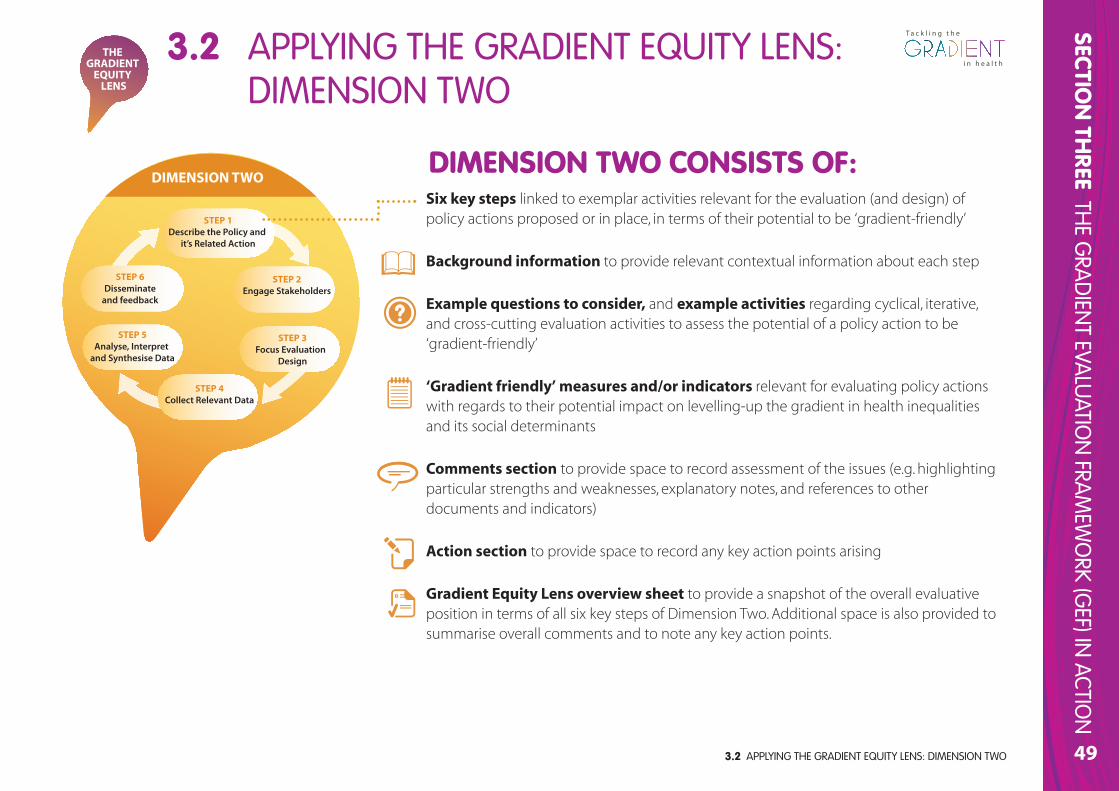
3.2 APPLYING THE GRADIENT EQUITY LENS: DIMENSION TWO
SECTION TH
REETH
E GRA
DIEN
T EVALU
ATION
FRAM
EWO
RK (GEF) IN
ACTION
49
T a c k l i n g t h e
i n h e a l t hi n h e a l t h
DIMENSION TWO
STEP 5Analyse, Interpret
and Synthesise Data
STEP 2Engage Stakeholders
STEP 1Describe the Policy and
it’s Related Action
STEP 6Disseminate
and feedback
STEP 3Focus Evaluation
Design
STEP 4Collect Relevant Data
THE GRADIENT
EQUITY LENS
3.2 APPLYING THE GRADIENT EQUITY LENS: DIMENSION TWO
Six key steps linked to exemplar activities relevant for the evaluation (and design) ofpolicy actions proposed or in place, in terms of their potential to be ‘gradient-friendly’
Background information to provide relevant contextual information about each step
Example questions to consider, and example activities regarding cyclical, iterative,and cross-cutting evaluation activities to assess the potential of a policy action to be‘gradient-friendly’
‘Gradient friendly’ measures and/or indicators relevant for evaluating policy actionswith regards to their potential impact on levelling-up the gradient in health inequalitiesand its social determinants
Comments section to provide space to record assessment of the issues (e.g. highlightingparticular strengths and weaknesses, explanatory notes, and references to otherdocuments and indicators)
Action section to provide space to record any key action points arising
Gradient Equity Lens overview sheet to provide a snapshot of the overall evaluativeposition in terms of all six key steps of Dimension Two. Additional space is also provided tosummarise overall comments and to note any key action points.
DIMENSION TWO CONSISTS OF:
3.2 APPLYING THE GRADIENT EQUITY LENS: DIMENSION TWO50
STEP ONE: DESCRIBE THE POLICY AND ITS RELATED ACTIONS DIMENSION TWO
STEP 5Analyse, Interpret
and Synthesise Data
STEP 2Engage Stakeholders
STEP 1Describe the Policy and
it’s Related Action
STEP 6Disseminate
and feedback
STEP 3Focus Evaluation
Design
STEP 4Collect Relevant Data
SECTION TH
REETH
E GRA
DIEN
T EVALU
ATION
FRAM
EWO
RK (GEF) IN
ACTION
Describing a policy action is an important part of the evaluation process. It provides an opportunity to explainexplicitly what the policy is trying to accomplish and how it tries to bring about those changes. Moreover, it
illustrates the policy action’s core components; establishes its ability to make changes; specifies its stage ofdevelopment or implementation; and describes how the policy fits into the larger socio, cultural, and politicalenvironment. Such descriptions therefore set the frame of reference for all subsequent decisions in the remainder ofthe evaluation activities. Six core elements of an appropriate policy action description include:
a Overall statement of need and goals (e.g. outline of the magnitude and scope of the problem, needsidentification and assessment, level of aggregation of the policy)
b Context (e.g. within which the policy and its related actions operate)
c Values, principles and underlying approach (e.g. WHO Health 21 principles, holistic conceptualisation of health)
d Expectations (e.g. a description of the expected or desired immediate and intermediate impacts and/orlong-term outcomes)
e Activities and resources (e.g. relating to the implementation of policies)
f Stage of development (e.g. policy formulation, planning, pre-implementation, and review).
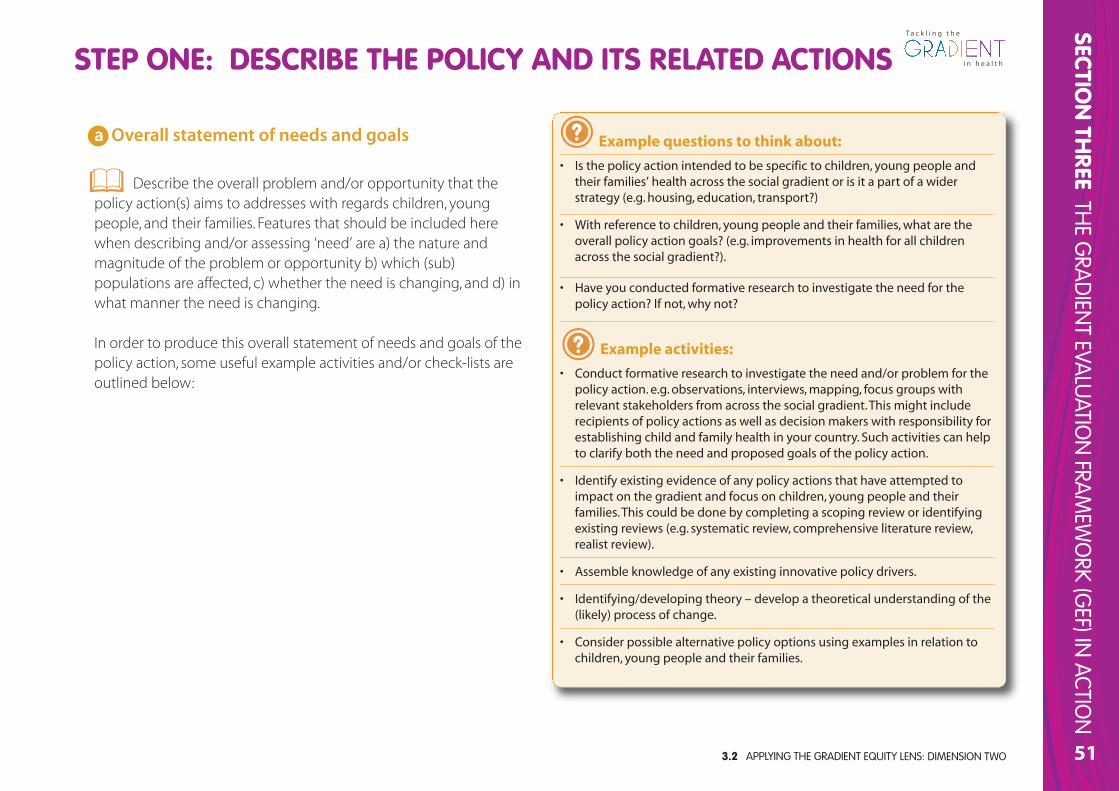
3.2 APPLYING THE GRADIENT EQUITY LENS: DIMENSION TWO
SECTION TH
REETH
E GRA
DIEN
T EVALU
ATION
FRAM
EWO
RK (GEF) IN
ACTION
51
Example questions to think about:
• Is the policy action intended to be specific to children, young people andtheir families’ health across the social gradient or is it a part of a widerstrategy (e.g. housing, education, transport?)
• With reference to children, young people and their families, what are theoverall policy action goals? (e.g. improvements in health for all childrenacross the social gradient?).
• Have you conducted formative research to investigate the need for thepolicy action? If not, why not?
Example activities:
• Conduct formative research to investigate the need and/or problem for thepolicy action. e.g. observations, interviews, mapping, focus groups withrelevant stakeholders from across the social gradient. This might includerecipients of policy actions as well as decision makers with responsibility forestablishing child and family health in your country. Such activities can helpto clarify both the need and proposed goals of the policy action.
• Identify existing evidence of any policy actions that have attempted toimpact on the gradient and focus on children, young people and theirfamilies. This could be done by completing a scoping review or identifyingexisting reviews (e.g. systematic review, comprehensive literature review,realist review).
• Assemble knowledge of any existing innovative policy drivers.
• Identifying/developing theory – develop a theoretical understanding of the(likely) process of change.
• Consider possible alternative policy options using examples in relation tochildren, young people and their families.
T a c k l i n g t h e
i n h e a l t hi n h e a l t h
a Overall statement of needs and goals
Describe the overall problem and/or opportunity that thepolicy action(s) aims to addresses with regards children, youngpeople, and their families. Features that should be included herewhen describing and/or assessing ‘need’ are a) the nature andmagnitude of the problem or opportunity b) which (sub)populations are affected, c) whether the need is changing, and d) inwhat manner the need is changing.
In order to produce this overall statement of needs and goals of thepolicy action, some useful example activities and/or check-lists areoutlined below:
STEP ONE: DESCRIBE THE POLICY AND ITS RELATED ACTIONS
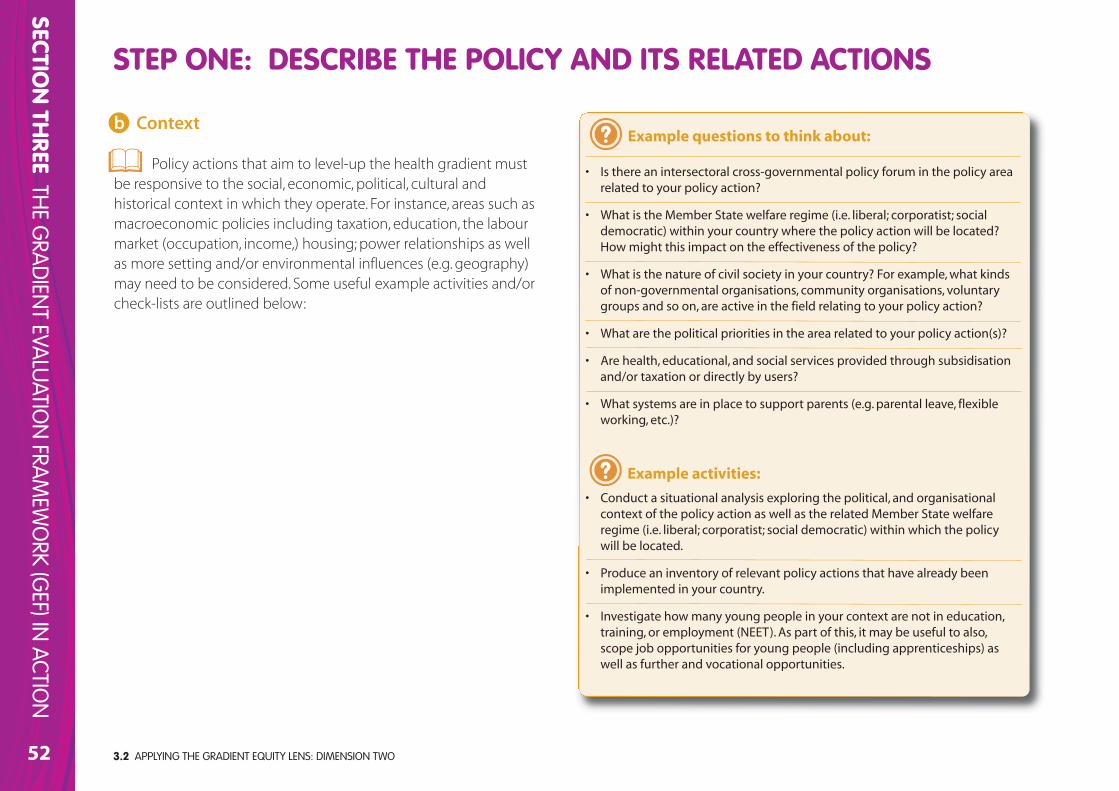
3.2 APPLYING THE GRADIENT EQUITY LENS: DIMENSION TWO52
SECTION TH
REETH
E GRA
DIEN
T EVALU
ATION
FRAM
EWO
RK (GEF) IN
ACTION
b Context
Policy actions that aim to level-up the health gradient mustbe responsive to the social, economic, political, cultural andhistorical context in which they operate. For instance, areas such asmacroeconomic policies including taxation, education, the labourmarket (occupation, income,) housing; power relationships as wellas more setting and/or environmental influences (e.g. geography)may need to be considered. Some useful example activities and/orcheck-lists are outlined below:
Example questions to think about:
• Is there an intersectoral cross-governmental policy forum in the policy arearelated to your policy action?
• What is the Member State welfare regime (i.e. liberal; corporatist; socialdemocratic) within your country where the policy action will be located?How might this impact on the effectiveness of the policy?
• What is the nature of civil society in your country? For example, what kindsof non-governmental organisations, community organisations, voluntarygroups and so on, are active in the field relating to your policy action?
• What are the political priorities in the area related to your policy action(s)?
• Are health, educational, and social services provided through subsidisationand/or taxation or directly by users?
• What systems are in place to support parents (e.g. parental leave, flexibleworking, etc.)?
Example activities:
• Conduct a situational analysis exploring the political, and organisationalcontext of the policy action as well as the related Member State welfareregime (i.e. liberal; corporatist; social democratic) within which the policy will be located.
• Produce an inventory of relevant policy actions that have already beenimplemented in your country.
• Investigate how many young people in your context are not in education,training, or employment (NEET). As part of this, it may be useful to also,scope job opportunities for young people (including apprenticeships) aswell as further and vocational opportunities.
STEP ONE: DESCRIBE THE POLICY AND ITS RELATED ACTIONS
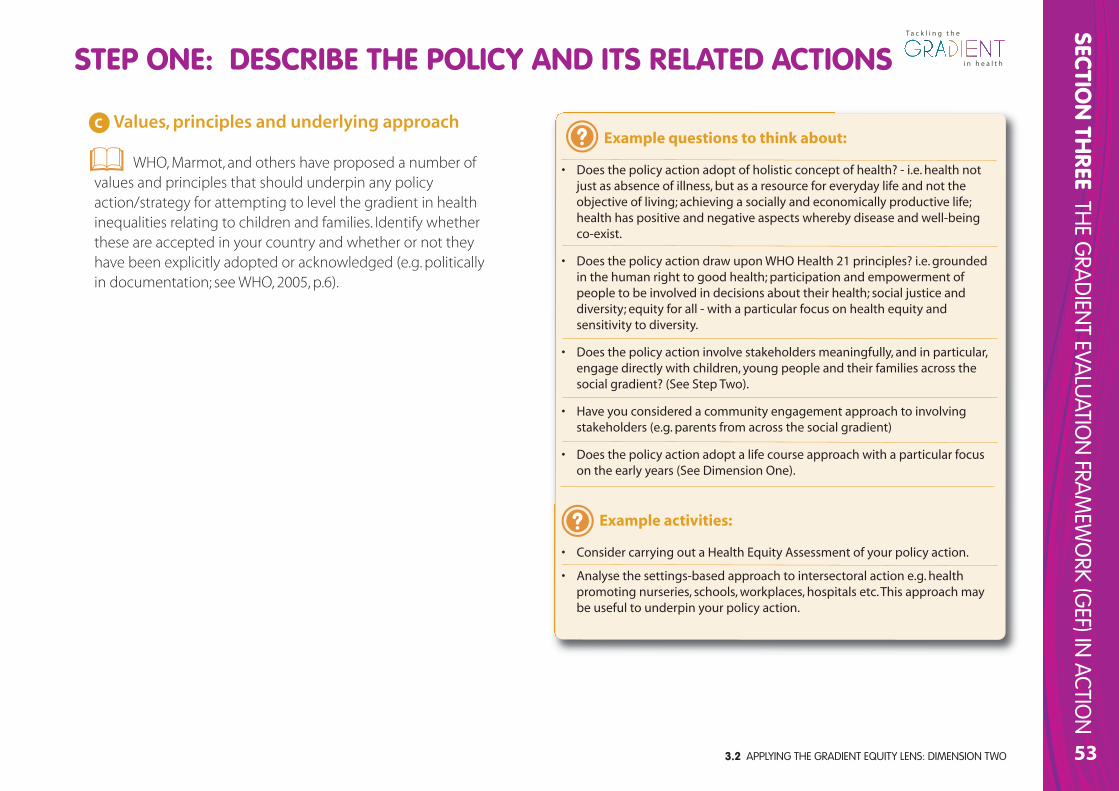
Example questions to think about:
• Does the policy action adopt of holistic concept of health? - i.e. health notjust as absence of illness, but as a resource for everyday life and not theobjective of living; achieving a socially and economically productive life;health has positive and negative aspects whereby disease and well-beingco-exist.
• Does the policy action draw upon WHO Health 21 principles? i.e. groundedin the human right to good health; participation and empowerment ofpeople to be involved in decisions about their health; social justice anddiversity; equity for all - with a particular focus on health equity andsensitivity to diversity.
• Does the policy action involve stakeholders meaningfully, and in particular,engage directly with children, young people and their families across thesocial gradient? (See Step Two).
• Have you considered a community engagement approach to involvingstakeholders (e.g. parents from across the social gradient)
• Does the policy action adopt a life course approach with a particular focuson the early years (See Dimension One).
Example activities:
• Consider carrying out a Health Equity Assessment of your policy action.
• Analyse the settings-based approach to intersectoral action e.g. healthpromoting nurseries, schools, workplaces, hospitals etc. This approach maybe useful to underpin your policy action.
3.2 APPLYING THE GRADIENT EQUITY LENS: DIMENSION TWO 53
T a c k l i n g t h e
i n h e a l t hi n h e a l t h
SECTION TH
REETH
E GRA
DIEN
T EVALU
ATION
FRAM
EWO
RK (GEF) IN
ACTION
c Values, principles and underlying approach
WHO, Marmot, and others have proposed a number ofvalues and principles that should underpin any policyaction/strategy for attempting to level the gradient in healthinequalities relating to children and families. Identify whetherthese are accepted in your country and whether or not theyhave been explicitly adopted or acknowledged (e.g. politicallyin documentation; see WHO, 2005, p.6).
STEP ONE: DESCRIBE THE POLICY AND ITS RELATED ACTIONS
3.2 APPLYING THE GRADIENT EQUITY LENS: DIMENSION TWO54
SECTION TH
REETH
E GRA
DIEN
T EVALU
ATION
FRAM
EWO
RK (GEF) IN
ACTION
T a c k l i n g t h e
i n h e a l t hi n h e a l t h
d Expectations
Descriptions of expectations(objectives) convey what the policy actionmust accomplish in order to be consideredsuccessful. However, progress concerningpolicies to level the gradient and/or reducehealth inequalities regarding children, youngpeople and their families are difficult tomeasure and establish. Working with socialdeterminants is extremely complex; it can takea long time for the effects of an action toshow, and when or if they do, they can rarelybe traced to a specific policy action(s).Moreover, a policy that appears to not besuccessful in the short-term, may well besuccessful in the long-term (Strand et al.,2009). Thus, it is important to differentiatebetween short-term (immediate), medium-term (intermediate) and long-term outcomesor expected effects. Consideration should alsobe given to potential unintendedconsequences of the policy action(s).
Example questions to think about:
• Is there a clear statement of the policy action’s objectives/expected outputs, processes, and outcomes? Is the formulation of these objectives/expectations SMART? i.e. are they:
- Specific - do they specify the target group (e.g. children, young people, and their families) and thefactors that need to change?
- Measurable - are they written in a measurable format (e.g. magnitude of effects, numbers to bereached)?
- Acceptable for the target group? - - -
- Realistic - are they feasible given the available time, money, staffing, political climate and so on?
- Time-framed - do they state the time period within which the objectives or expected effects must bereached?
• Do the expected outcomes show what the final achievement of the policy action will be?
• How will potential unintended consequences of the policy action be captured and/or evaluated?Following reflection, how will these consequences be addressed?
Example activities:
• Being clear about objectives/expected outputs, processes, and outcomes is the key to successfulevaluation of policy actions. Before starting evaluation activities it is crucial to be clear about what thepolicy action is trying to achieve (without this you cannot measure whether or not it has been achieved!)A simple way to do this is to use SMART objectives - see above)..
• Map planned policy action activities against targets (e.g. see Marmot, 2010).
• Try setting out a series of link steps to achieving expectations using a Theory of Change mode and/orlogic model, for example.
• Reflect on relevant past policy actions in order to help clarify your thinking with regards expectedeffects, mechanisms of change and so on.
• Consult key stakeholders across the social gradient to gain input into their expectations of outcomes oreffects of the policy action.
STEP ONE: DESCRIBE THE POLICY AND ITS RELATED ACTIONS
SECTION TH
REETH
E GRA
DIEN
T EVALU
ATION
FRAM
EWO
RK (GEF) IN
ACTION
55
T a c k l i n g t h e
i n h e a l t hi n h e a l t h
e Activities and resources
Descriptions of activities detail what the policy actionactually does in order to bring about the expected effects or
changes. In other words, it demonstrates how each planned activityor programme of action relates to one another and clarifies theroutes through which change is expected to occur. Suchdescriptions should also distinguish between those activities thatare the direct responsibility of the policy from those that areconducted by related policies or partners. Similarly, descriptions ofthe necessary (and available) resources (e.g. time, talent, technology,equipment, information, money, assets and so on) to conduct thepolicy implementation activities are required (see also DimensionOne - Scale and Intensity). Useful resource descriptions shouldconvey the amount and intensity of activities and highlightsituations where a mismatch exists between the desired activitiesand the actual resources available to implement those activities.
Example questions to think about:
• Have planned policy action activities been pre-tested and/or piloted?Has enough time lapsed in order for you to assess whether the activitiesare appropriate?
• How sustainable are the planned activities within your policyintervention? For instance, in terms of sufficiently trained and/orexperienced staff, sufficient funding, etc.
• How do you intend to action proportionate universalism in practice?
Example activities:
• Carry out a sustainability review on activities and resources.
• Create an implementation ‘map’ of how proportionate universalism isintended to be operationalized in practice.
• Produce a timeline of milestones when policy action activities areplanned to be pre-tested and/or piloted. Make sure you allow time forthe activities to be evaluated appropriately, and be prepared to notimplement the action (or adopt changes) if the findings dictate.
STEP ONE: DESCRIBE THE POLICY AND ITS RELATED ACTIONS
3.2 APPLYING THE GRADIENT EQUITY LENS: DIMENSION TWO
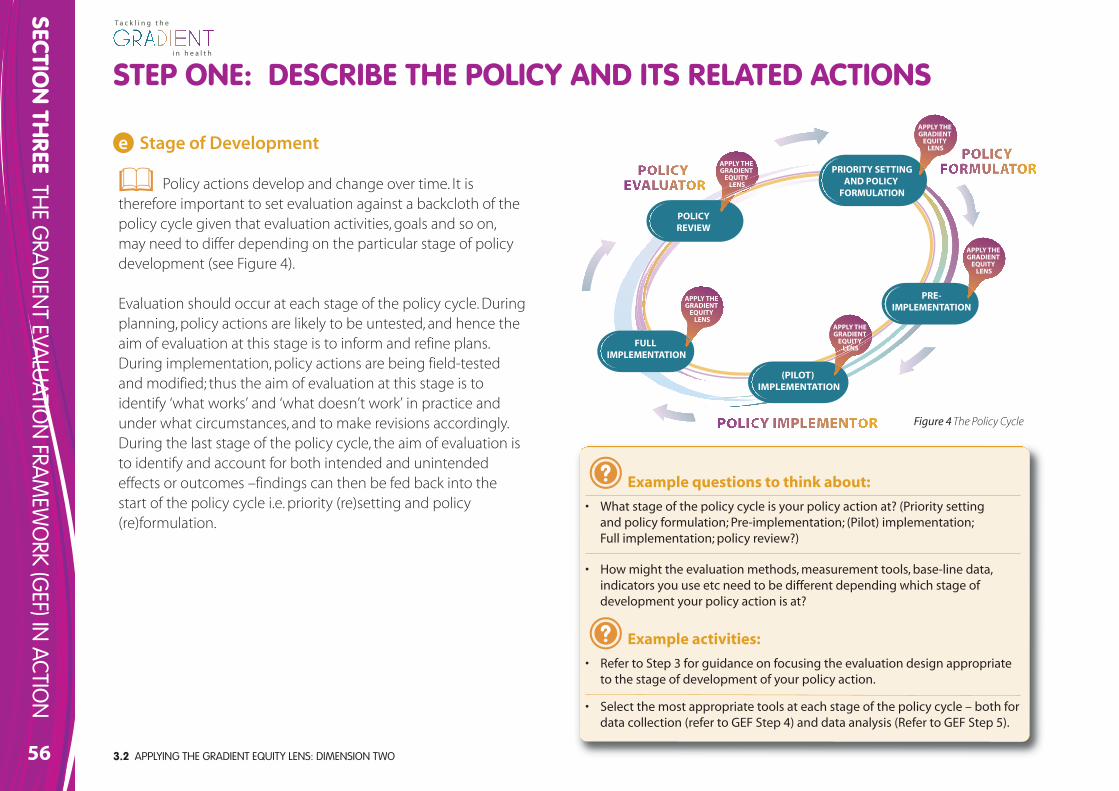
3.2 APPLYING THE GRADIENT EQUITY LENS: DIMENSION TWO56
SECTION TH
REETH
E GRA
DIEN
T EVALU
ATION
FRAM
EWO
RK (GEF) IN
ACTION
T a c k l i n g t h e
i n h e a l t hi n h e a l t h
e Stage of Development
Policy actions develop and change over time. It istherefore important to set evaluation against a backcloth of thepolicy cycle given that evaluation activities, goals and so on,may need to differ depending on the particular stage of policydevelopment (see Figure 4).
Evaluation should occur at each stage of the policy cycle. Duringplanning, policy actions are likely to be untested, and hence theaim of evaluation at this stage is to inform and refine plans.During implementation, policy actions are being field-testedand modified; thus the aim of evaluation at this stage is toidentify ‘what works’ and ‘what doesn’t work’ in practice andunder what circumstances, and to make revisions accordingly.During the last stage of the policy cycle, the aim of evaluation isto identify and account for both intended and unintendedeffects or outcomes –findings can then be fed back into thestart of the policy cycle i.e. priority (re)setting and policy(re)formulation.
Example questions to think about:
• What stage of the policy cycle is your policy action at? (Priority setting and policy formulation; Pre-implementation; (Pilot) implementation; Full implementation; policy review?)
• How might the evaluation methods, measurement tools, base-line data,indicators you use etc need to be different depending which stage ofdevelopment your policy action is at?
Example activities:
• Refer to Step 3 for guidance on focusing the evaluation design appropriateto the stage of development of your policy action.
• Select the most appropriate tools at each stage of the policy cycle – both fordata collection (refer to GEF Step 4) and data analysis (Refer to GEF Step 5).
PRE-IMPLEMENTATION
FULL IMPLEMENTATION
(PILOT) IMPLEMENTATION
PRIORITY SETTINGAND POLICY
FORMULATION
POLICYREVIEW
APPLY THE GRADIENT
EQUITY LENS
APPLY THE GRADIENT
EQUITY LENS
APPLY THE GRADIENT
EQUITY LENS
APPLY THE GRADIENT
EQUITY LENS
APPLY THE GRADIENT
EQUITY LENS
Figure 4The Policy Cycle
STEP ONE: DESCRIBE THE POLICY AND ITS RELATED ACTIONS
3.2 APPLYING THE GRADIENT EQUITY LENS: DIMENSION TWO
SECTION TH
REETH
E GRA
DIEN
T EVALU
ATION
FRAM
EWO
RK (GEF) IN
ACTION
57
T a c k l i n g t h e
i n h e a l t hi n h e a l t h
General Comments
Key Action PointsWhat key areas for action have arisen from completing this self-assessment relating to Describe the Policy and Its Related Actions? What needs to be done toincrease the potential of your policy action to impact on the gradient in health inequalities by addressing the social determinants of health which affect the healthof children, young people, and their families?
Key action point 1
Person responsible:
By when:
Review date:
Key action point 3
Person responsible:
By when:
Review date:
Key action point 2
Person responsible:
By when:
Review date:
Key action point 4
Person responsible:
By when:
Review date:
DIMENSION TWO
STEP 5Analyse, Interpret
and Synthesise Data
STEP 2Engage Stakeholders
STEP 1Describe the Policy and
it’s Related Action
STEP 6Disseminate
and feedback
STEP 3Focus Evaluation
Design
STEP 4Collect Relevant Data
OVERVIEWSTEP ONE: DESCRIBE THE POLICY AND ITS RELATED ACTIONS
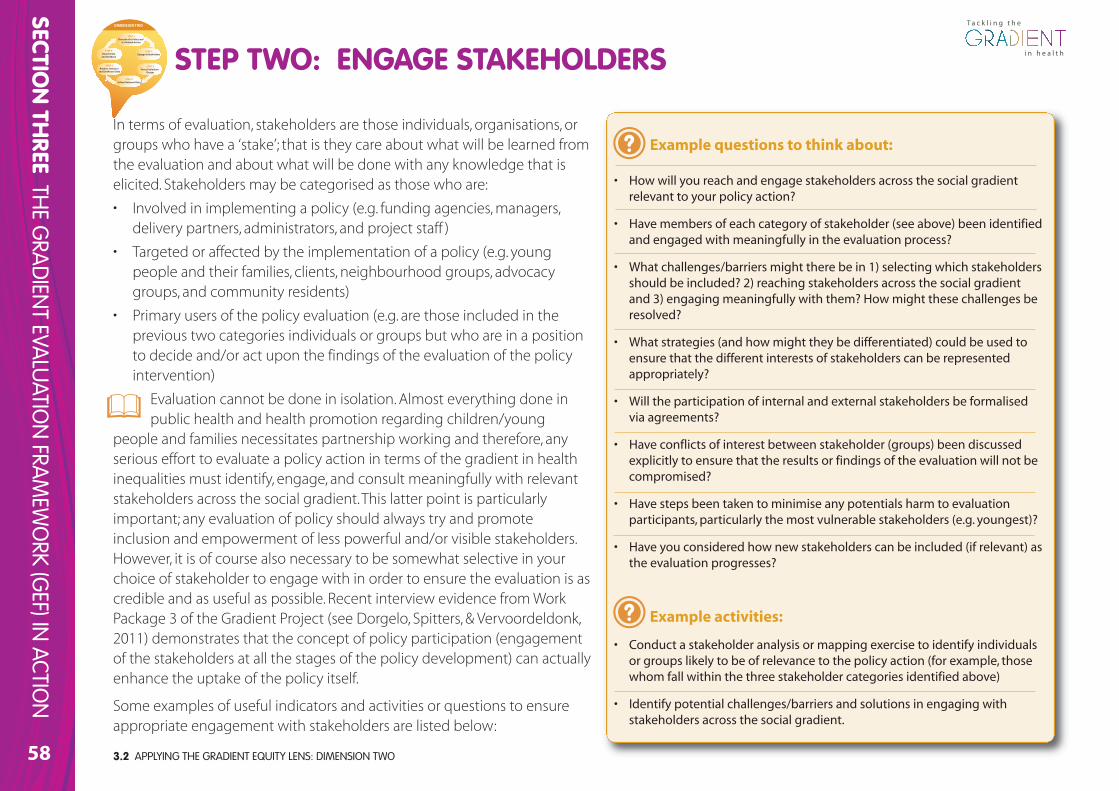
3.2 APPLYING THE GRADIENT EQUITY LENS: DIMENSION TWO58
T a c k l i n g t h e
i n h e a l t hi n h e a l t h
Example questions to think about:
• How will you reach and engage stakeholders across the social gradientrelevant to your policy action?
• Have members of each category of stakeholder (see above) been identifiedand engaged with meaningfully in the evaluation process?
• What challenges/barriers might there be in 1) selecting which stakeholdersshould be included? 2) reaching stakeholders across the social gradientand 3) engaging meaningfully with them? How might these challenges beresolved?
• What strategies (and how might they be differentiated) could be used toensure that the different interests of stakeholders can be representedappropriately?
• Will the participation of internal and external stakeholders be formalisedvia agreements?
• Have conflicts of interest between stakeholder (groups) been discussedexplicitly to ensure that the results or findings of the evaluation will not becompromised?
• Have steps been taken to minimise any potentials harm to evaluationparticipants, particularly the most vulnerable stakeholders (e.g. youngest)?
• Have you considered how new stakeholders can be included (if relevant) asthe evaluation progresses?
Example activities:
• Conduct a stakeholder analysis or mapping exercise to identify individualsor groups likely to be of relevance to the policy action (for example, thosewhom fall within the three stakeholder categories identified above)
• Identify potential challenges/barriers and solutions in engaging withstakeholders across the social gradient.
STEP TWO: ENGAGE STAKEHOLDERSDIMENSION TWO
STEP 5Analyse, Interpret
and Synthesise Data
STEP 2Engage Stakeholders
STEP 1Describe the Policy and
it’s Related Action
STEP 6Disseminate
and feedback
STEP 3Focus Evaluation
Design
STEP 4Collect Relevant Data
In terms of evaluation, stakeholders are those individuals, organisations, orgroups who have a ‘stake’; that is they care about what will be learned fromthe evaluation and about what will be done with any knowledge that iselicited. Stakeholders may be categorised as those who are:
• Involved in implementing a policy (e.g. funding agencies, managers,delivery partners, administrators, and project staff )
• Targeted or affected by the implementation of a policy (e.g. youngpeople and their families, clients, neighbourhood groups, advocacygroups, and community residents)
• Primary users of the policy evaluation (e.g. are those included in theprevious two categories individuals or groups but who are in a positionto decide and/or act upon the findings of the evaluation of the policyintervention)
Evaluation cannot be done in isolation. Almost everything done inpublic health and health promotion regarding children/young
people and families necessitates partnership working and therefore, anyserious effort to evaluate a policy action in terms of the gradient in healthinequalities must identify, engage, and consult meaningfully with relevantstakeholders across the social gradient. This latter point is particularlyimportant; any evaluation of policy should always try and promoteinclusion and empowerment of less powerful and/or visible stakeholders.However, it is of course also necessary to be somewhat selective in yourchoice of stakeholder to engage with in order to ensure the evaluation is ascredible and as useful as possible. Recent interview evidence from WorkPackage 3 of the Gradient Project (see Dorgelo, Spitters, & Vervoordeldonk,2011) demonstrates that the concept of policy participation (engagementof the stakeholders at all the stages of the policy development) can actuallyenhance the uptake of the policy itself.
Some examples of useful indicators and activities or questions to ensureappropriate engagement with stakeholders are listed below:
SECTION TH
REETH
E GRA
DIEN
T EVALU
ATION
FRAM
EWO
RK (GEF) IN
ACTION
3.2 APPLYING THE GRADIENT EQUITY LENS: DIMENSION TWO
SECTION TH
REETH
E GRA
DIEN
T EVALU
ATION
FRAM
EWO
RK (GEF) IN
ACTION
59
T a c k l i n g t h e
i n h e a l t hi n h e a l t h
General Comments
Key Action PointsWhat key areas for action have arisen from completing this self-assessment relating to Engaging Stakeholders? What needs to be done to increase thepotential of your policy action to impact on the gradient in health inequalities by addressing the social determinants of health which affect the health ofchildren, young people, and their families?
Key action point 1
Person responsible:
By when:
Review date:
Key action point 3
Person responsible:
By when:
Review date:
Key action point 2
Person responsible:
By when:
Review date:
Key action point 4
Person responsible:
By when:
Review date:
DIMENSION TWO
STEP 5Analyse, Interpret
and Synthesise Data
STEP 2Engage Stakeholders
STEP 1Describe the Policy and
it’s Related Action
STEP 6Disseminate
and feedback
STEP 3Focus Evaluation
Design
STEP 4Collect Relevant Data STEP TWO - ENGAGE STAKEHOLDERS (DIMENSION TWO)
OVERVIEW
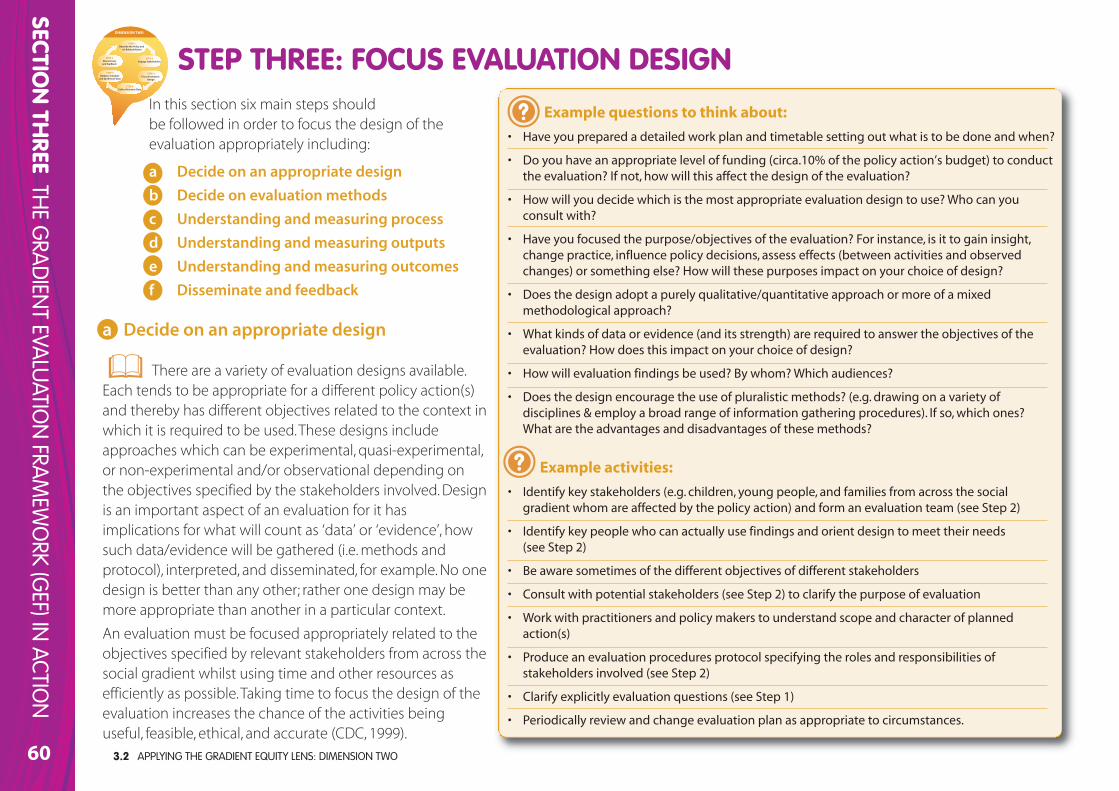
3.2 APPLYING THE GRADIENT EQUITY LENS: DIMENSION TWO60
SECTION TH
REETH
E GRA
DIEN
T EVALU
ATION
FRAM
EWO
RK (GEF) IN
ACTION
a Decide on an appropriate design
There are a variety of evaluation designs available.Each tends to be appropriate for a different policy action(s)and thereby has different objectives related to the context inwhich it is required to be used. These designs includeapproaches which can be experimental, quasi-experimental,or non-experimental and/or observational depending onthe objectives specified by the stakeholders involved. Designis an important aspect of an evaluation for it hasimplications for what will count as ‘data’ or ‘evidence’, howsuch data/evidence will be gathered (i.e. methods andprotocol), interpreted, and disseminated, for example. No onedesign is better than any other; rather one design may bemore appropriate than another in a particular context.
An evaluation must be focused appropriately related to theobjectives specified by relevant stakeholders from across thesocial gradient whilst using time and other resources asefficiently as possible. Taking time to focus the design of theevaluation increases the chance of the activities beinguseful, feasible, ethical, and accurate (CDC, 1999).
Example questions to think about:
• Have you prepared a detailed work plan and timetable setting out what is to be done and when?
• Do you have an appropriate level of funding (circa.10% of the policy action’s budget) to conductthe evaluation? If not, how will this affect the design of the evaluation?
• How will you decide which is the most appropriate evaluation design to use? Who can youconsult with?
• Have you focused the purpose/objectives of the evaluation? For instance, is it to gain insight,change practice, influence policy decisions, assess effects (between activities and observedchanges) or something else? How will these purposes impact on your choice of design?
• Does the design adopt a purely qualitative/quantitative approach or more of a mixedmethodological approach?
• What kinds of data or evidence (and its strength) are required to answer the objectives of theevaluation? How does this impact on your choice of design?
• How will evaluation findings be used? By whom? Which audiences?
• Does the design encourage the use of pluralistic methods? (e.g. drawing on a variety ofdisciplines & employ a broad range of information gathering procedures). If so, which ones? What are the advantages and disadvantages of these methods?
Example activities:
• Identify key stakeholders (e.g. children, young people, and families from across the socialgradient whom are affected by the policy action) and form an evaluation team (see Step 2)
• Identify key people who can actually use findings and orient design to meet their needs (see Step 2)
• Be aware sometimes of the different objectives of different stakeholders
• Consult with potential stakeholders (see Step 2) to clarify the purpose of evaluation
• Work with practitioners and policy makers to understand scope and character of plannedaction(s)
• Produce an evaluation procedures protocol specifying the roles and responsibilities ofstakeholders involved (see Step 2)
• Clarify explicitly evaluation questions (see Step 1)
• Periodically review and change evaluation plan as appropriate to circumstances.
STEP THREE: FOCUS EVALUATION DESIGNDIMENSION TWO
STEP 5Analyse, Interpret
and Synthesise Data
STEP 2Engage Stakeholders
STEP 1Describe the Policy and
it’s Related Action
STEP 6Disseminate
and feedback
STEP 3Focus Evaluation
Design
STEP 4Collect Relevant Data
In this section six main steps should be followed in order to focus the design of the evaluation appropriately including:
a Decide on an appropriate design
b Decide on evaluation methods
c Understanding and measuring process
d Understanding and measuring outputs
e Understanding and measuring outcomes
f Disseminate and feedback
3.2 APPLYING THE GRADIENT EQUITY LENS: DIMENSION TWO 61
SECTION TH
REETH
E GRA
DIEN
T EVALU
ATION
FRAM
EWO
RK (GEF) IN
ACTION
T a c k l i n g t h e
i n h e a l t hi n h e a l t hSTEP THREE: FOCUS EVALUATION DESIGNDIMENSION TWO
STEP 5Analyse, Interpret
and Synthesise Data
STEP 2Engage Stakeholders
STEP 1Describe the Policy and
it’s Related Action
STEP 6Disseminate
and feedback
STEP 3Focus Evaluation
Design
STEP 4Collect Relevant Data
b Decide on evaluation methods
The specific evaluation methods to be used aredependent on the objectives of the policy action, and
are influenced by various factors such as the epistemologicalposition adopted (interpretivist, positivist, or pragmatist), whattype of data or evidence is required, and practically, the skillsand/or experience and preferences of the evaluators. Otherpractical issues which may influence the choice of methodsinclude cost, coverage, feasibility, sampling, and data analysis.What is important is to select the most appropriate methodsfor the evaluation (e.g. rather than personal preference of theevaluator). Thus, there is often a necessity to adopt a flexiblepragmatic approach that may need to be iterative and reflexiveif aspects of the evaluation change (e.g. discovery ofunintended effects).
Evaluation design and methods must also be flexible enoughto encompass unintended outcomes. Because each method ofdata generation has its own advantages and disadvantages,evaluations that mix methods (i.e. adopt pluralistic methods)can generally be more effective.
Example questions to think about:
• How best can intended outcomes, gradient-sensitive indicators and evaluationmethods be interlinked?
• How can both qualitative and quantitative methods be used?
• What are the strengths and weaknesses of the various research methods available?
• Consider the relative benefits of the need to achieve depth or breadth of datacollection
• What evidence can be collected as part of routine activities and what need to becollected at set points?The research methods you close must be compatible with the values underpinningthe policy action.
Example activities:
• Carry out a review or skills analysis of the evaluation team to scope existing skillsand expertise regarding use of particular methods and identify gaps and needs fortraining or resourcing external expertise.
• Think clearly about the purpose of the evaluation and the need for various types ofevidence
• Will questionnaires and interviews provide the right evidence?
• Consider the ethical issues that will influence your choice of evaluation methods
• What are the practical issues that will influence your choice of evaluation methodse.g. availability of resources and equipment, experience of undertaking evaluationusing particular methods, time-scale, coverage, etc.?
3.2 APPLYING THE GRADIENT EQUITY LENS: DIMENSION TWO62
SECTION TH
REETH
E GRA
DIEN
T EVALU
ATION
FRAM
EWO
RK (GEF) IN
ACTION
STEP THREE: FOCUS EVALUATION DESIGNDIMENSION TWO
STEP 5Analyse, Interpret
and Synthesise Data
STEP 2Engage Stakeholders
STEP 1Describe the Policy and
it’s Related Action
STEP 6Disseminate
and feedback
STEP 3Focus Evaluation
Design
STEP 4Collect Relevant Data
c Understanding and measuring process
As noted previously, a whole social systems approach is required to tacklehealth inequalities and level-up the health gradient (Davies & Sherriff, 2011). Thus,effective policy actions should focus both on structure and process, and not juston outcome/s.
Process refers to the series of activities, programmes, or operations that arerequired to deliver a policy action. Understanding process is important as it canprovide valuable insight into i) why aspects of a policy action failed to meet itsobjectives or perhaps delivered unintended consequences, or on the other hand;ii) why particular aspects of a policy action were successful and therefore shouldbe expanded. Process evaluation can be carried out a various stages of policydevelopment and implementation. For example, in terms of the latter, during apilot intervention process evaluation can be useful to assess the quality ofimplementation, identify problems, improve processes and methods andhighlight contextual factors related to variations in outcome. Examples of processindicators relating to policy interventions targeting children, young people, andtheir families to level-up the gradient may include:
• Measured increase in number of children accessing quality early educationand childcare across the gradient
• Increased recruitment of well-qualified staff into the early years workforce
• Increased engagement by health visiting and family nurses in each early yearof the child’s life (e.g. quantity, quality, and reach measures).
• Increased number and quality of parenting programmes (increased take-up ofprogrammes across the gradient).
• Take-up of parental leave.
Example questions to think about:
• Process evaluation requires a wide variety of evaluationmethods and measurements. Linking to earlier sections,which evaluation methods are most appropriate foryour policy action? (e.g. interviews, focus groups, textanalysis, field notes, satisfaction surveys etc.)
• What are the potential facilitating and/or inhibitingfactors to conducting process evaluation of your policyaction?
• What procedures are in place to ensure that findingsfrom process evaluation activities are fed backappropriately and in a timely manner to relevantstakeholders?
• How will you measure or judge whether your policyaction has been delivered as originally planned?
• Which data sources and related indicators will you useto measure process?
• During an evaluation, process indicators may need to bemodified or new ones adopted. How will this bemonitored and/or managed?
Example activities:
• Review Marmot (2010) Policy Objective A for additionalexamples of process indicators relating to children,young people, and their families.
• Ensure that data and indicators related to process areintegrated with policy’s outcomes indicators.
3.2 APPLYING THE GRADIENT EQUITY LENS: DIMENSION TWO
SECTION TH
REETH
E GRA
DIEN
T EVALU
ATION
FRAM
EWO
RK (GEF) IN
ACTION
63
T a c k l i n g t h e
i n h e a l t hi n h e a l t hSTEP THREE: FOCUS EVALUATION DESIGNDIMENSION TWO
STEP 5Analyse, Interpret
and Synthesise Data
STEP 2Engage Stakeholders
STEP 1Describe the Policy and
it’s Related Action
STEP 6Disseminate
and feedback
STEP 3Focus Evaluation
Design
STEP 4Collect Relevant Data
d Understanding and measuring outputs
Output refers to the products of a policy action’simplementation or activities, and is generally measured in termsof activities such as the amount of service delivered, staff hired,systems developed, sessions conducted, materials developed,policies, procedures, and/or legislation created, for example. Inrelation to policy action areas targeting children, young people,and their families to level-up the gradient, examples of outputindicators may include (taken from Marmot, 2010, p.181):
• Growth in services and quality
• Improved parenting skills across the gradient
• Child development milestones
• Social and emotional skills at age six years
• Improved quality standards in early education
Output indicators are important because they tell us how theprogramme is performing. Useful output indicators need to berelevant to the policy action’s activities, feasible to collect, easyto interpret, and ideally enable tracking over time.
Example questions to think about:
• Have outputs been established to show what tasks or activities are being carriedout to achieve the expected objectives/outcomes of the policy action?
• How will be the achievement of outputs be monitored, when and by whom?
Example activities:
• Ensure that data and indicators related to outputs of the policy’s implementationmechanisms (i.e. interventions) are integrated with policy’s outcomes indicators.
• Involve stakeholders in defining output indicators and gathering data to assistcredibility and acceptance of the evaluation findings.
DIMENSION TWO
STEP 5Analyse, Interpret
and Synthesise Data
STEP 2Engage Stakeholders
STEP 1Describe the Policy and
it’s Related Action
STEP 6Disseminate
and feedback
STEP 3Focus Evaluation
Design
STEP 4Collect Relevant Data
3.2 APPLYING THE GRADIENT EQUITY LENS: DIMENSION TWO64
SECTION TH
REETH
E GRA
DIEN
T EVALU
ATION
FRAM
EWO
RK (GEF) IN
ACTION
e Understanding and measuring outcomes
Outcomes need to match the objectives set for the policy action.Once this is clear then appropriate measurements or indicators can
be defined. Health outcomes are normally assessed using health indicatorsand may relate to areas such as behaviours, attitudes, skills, knowledge,values, conditions, or other attributes. In general, outcomes can beconsidered at three levels:
• Immediate short-term (e.g. programme) impacts
• Intermediate medium-term (modifiable determinants of health) impacts
• Long-term health/social outcomes
For small scale actions it is often only possible to measure the immediate orperhaps intermediate outcomes. It is important therefore to understandhow these may influence long-term health and social outcomes (Nutbeam,1999). Differentiating outcomes in this way means that different indicatorsmay be required to measure health outcomes in the short, medium, andlong term.
The following have been suggested as example ‘headline’ indicatorsrelevant to the gradient amongst children, young people and their families:
• Readiness for school (childhood conditions; Strand et al., 2009)
• Not in education, employment or training (NEET) (Work and workingenvironment; Strand et al., 2009)
• Disability free life expectancy (Marmot, 2010).
Example questions to think about:
• Some outcomes will be complex and difficult to measure – in these casesselect the most relevant and practical ones.
• Often indicators only measure a phenomenon indirectly – this needs tobe documented as a limitation in discussion of outcomes.
• Consider the additional complexities involved in evaluating complexcommunity actions – what are the appropriate evaluation approaches?
• What implications does time-span have for evaluation – what aboutlonger-term outcomes which pay occur long after the policy action iscompleted?
• Relative concentration index - Is often proposed by health economistsand used to measure income-related health inequality as itsimultaneously captures the socio-economic dimension of inequality,reflects the experiences of the entire population, and is sensitive tochanges in the distribution of the population across socio-economicgroups.
• Slope and relative index of inequality (SII and RII) - This has been used tosummarise socio-economic gradients and is calculated from a regressionline drawn through a health measure stratified by a measure ofsocioeconomic status e.g. social class.
Example activities:
• Reiew Marmot (2010) Policy Objective A for additional examples ofoutcome indicators relating to children, young people, and their families.
• Involve stakeholders in defining outcome indicators and gathering datato assist credibility and acceptance of the evaluation findings.
• Establish a robust data collection system to underpin your monitoringand evaluation.
• Detail the following: the goals of your policy action; the valuesunderpinning your approach; its immediate objectives; its intermediateobjectives.
• Make a list of the relevant indicators to measure the success of your policy action.
STEP THREE: FOCUS EVALUATION DESIGNHealth outcomes are a change in the health status of anindividual, group or population which is attributable to aplanned intervention or series of interventions, regardless ofwhether such an intervention was intended to change healthstatus…Such a definition emphasises the outcome ofplanned interventions (as opposed, for example, to incidentalexposure to risk), and that outcomes may be for individuals,groups or whole populations. (WHO, 1998, p.10).
3.2 APPLYING THE GRADIENT EQUITY LENS: DIMENSION TWO
SECTION TH
REETH
E GRA
DIEN
T EVALU
ATION
FRAM
EWO
RK (GEF) IN
ACTION
65
T a c k l i n g t h e
i n h e a l t hi n h e a l t hSTEP THREE: FOCUS EVALUATION DESIGNDIMENSION TWO
STEP 5Analyse, Interpret
and Synthesise Data
STEP 2Engage Stakeholders
STEP 1Describe the Policy and
it’s Related Action
STEP 6Disseminate
and feedback
STEP 3Focus Evaluation
Design
STEP 4Collect Relevant Data
f Disseminate and feedback
A crucial step in focusing the design of a gradient sensitiveevaluation is to consider how any findings will be appropriatelydisseminated and fed back to relevant stakeholders. Lessonslearned in the course of an evaluation do not automaticallytranslate into informed decision-making and appropriate action.Instead, specific focus and effort is needed to ensure that theevaluation processes and findings are used and disseminatedappropriately to relevant stakeholders across the social gradient, aswell as being fed back into the on-going development and reviewof the policy action.
Like other aspects of the evaluation, the dissemination strategyshould therefore be discussed in advance with intended users andother stakeholders to ensure that the disseminated informationneeds of relevant audiences will be met.
Example questions to think about:
• Have you developed an appropriate dissemination plan for how theevaluation findings will be used and communicated to relevant audiencesacross the social gradient? (see Step 6)
• Who will be responsible for implementing any dissemination plan?
• What methods could be used reach intended target audiences across thesocial gradient? (e.g. internet, email, printed and electronic reports andpublications, reports, workshops, presentations, focus groups, advocacy etc.).
• What do you see as the role of disseminating your findings in relation to yourpolicy action? E.g. to inform stakeholders, to input into policy review,advocacy etc.?
• What procedures will you put in place to ensure continuous feedback can beprovided to stakeholders? e.g. with regards interim findings from processevaluation that may affect the take-up of a policy action?
Example activities:
• Create a dissemination/communications plan differentiating and targetingrelevant stakeholders across the social gradient.
• Consult with relevant stakeholders across the social gradient to consider howappropriate communications (e.g. flyers, electronic mailing lists, websites,newsletters, press releases, focus groups, workshops, and presentations)might need to be used, adapted or modified to suit the needs of differentaudiences/stakeholders. Such consultation may also consider what types ofinformation may be relevant to different stakeholders (e.g. lessons learned,strengths and weaknesses of evaluation methodology, outcomes).
3.2 APPLYING THE GRADIENT EQUITY LENS: DIMENSION TWO66
SECTION TH
REETH
E GRA
DIEN
T EVALU
ATION
FRAM
EWO
RK (GEF) IN
ACTION
General Comments
Key Action PointsWhat key areas for action have arisen from completing this self-assessment relating to Focus Evaluation Design? What needs to be done to increase the potential ofyour policy action to impact on the gradient in health inequalities by addressing the social determinants of health which affect the health of children, young people,and their families?
Key action point 1
Person responsible:
By when:
Review date:
Key action point 3
Person responsible:
By when:
Review date:
Key action point 2
Person responsible:
By when:
Review date:
Key action point 4
Person responsible:
By when:
Review date:
DIMENSION TWO
STEP 5Analyse, Interpret
and Synthesise Data
STEP 2Engage Stakeholders
STEP 1Describe the Policy and
it’s Related Action
STEP 6Disseminate
and feedback
STEP 3Focus Evaluation
Design
STEP 4Collect Relevant Data STEP THREE: FOCUS EVALUATION DESIGN (DIMENSION TWO)
OVERVIEW
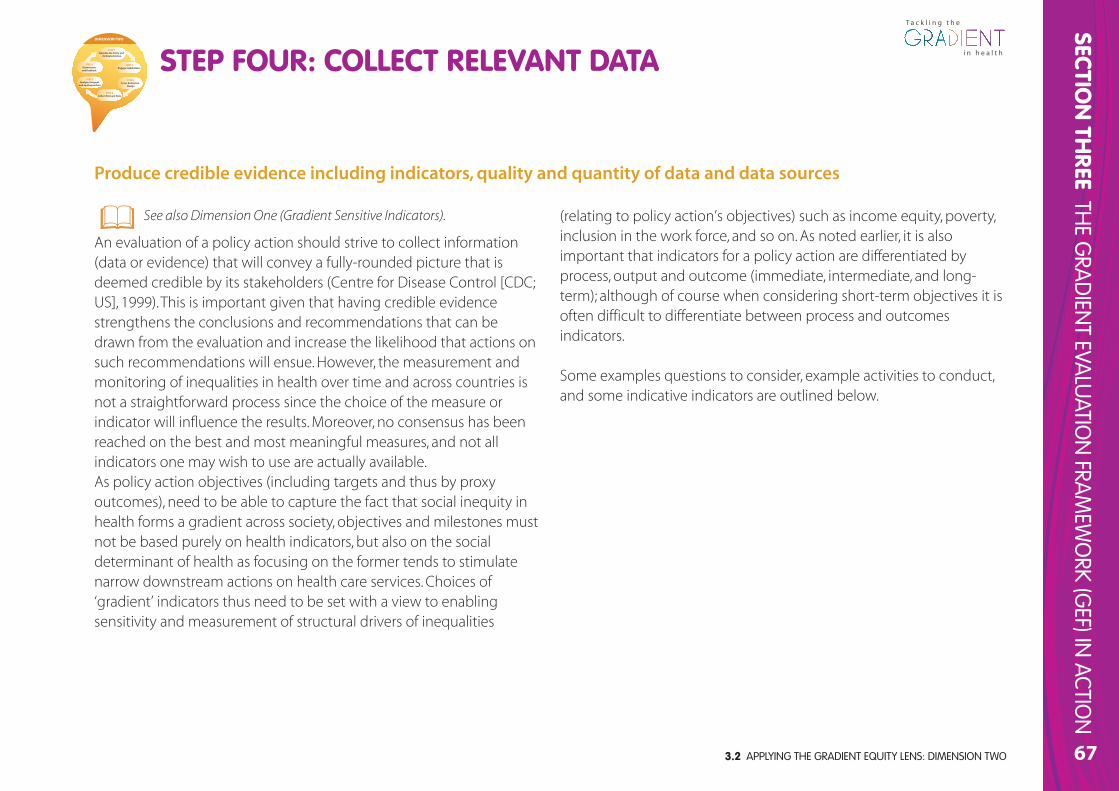
3.2 APPLYING THE GRADIENT EQUITY LENS: DIMENSION TWO
SECTION TH
REETH
E GRA
DIEN
T EVALU
ATION
FRAM
EWO
RK (GEF) IN
ACTION
67
T a c k l i n g t h e
i n h e a l t hi n h e a l t hSTEP FOUR: COLLECT RELEVANT DATADIMENSION TWO
STEP 5Analyse, Interpret
and Synthesise Data
STEP 2Engage Stakeholders
STEP 1Describe the Policy and
it’s Related Action
STEP 6Disseminate
and feedback
STEP 3Focus Evaluation
Design
STEP 4Collect Relevant Data
See also Dimension One (Gradient Sensitive Indicators).
An evaluation of a policy action should strive to collect information(data or evidence) that will convey a fully-rounded picture that isdeemed credible by its stakeholders (Centre for Disease Control [CDC;US], 1999). This is important given that having credible evidencestrengthens the conclusions and recommendations that can bedrawn from the evaluation and increase the likelihood that actions onsuch recommendations will ensue. However, the measurement andmonitoring of inequalities in health over time and across countries isnot a straightforward process since the choice of the measure orindicator will influence the results. Moreover, no consensus has beenreached on the best and most meaningful measures, and not allindicators one may wish to use are actually available. As policy action objectives (including targets and thus by proxyoutcomes), need to be able to capture the fact that social inequity inhealth forms a gradient across society, objectives and milestones mustnot be based purely on health indicators, but also on the socialdeterminant of health as focusing on the former tends to stimulatenarrow downstream actions on health care services. Choices of‘gradient’ indicators thus need to be set with a view to enablingsensitivity and measurement of structural drivers of inequalities
Produce credible evidence including indicators, quality and quantity of data and data sources
(relating to policy action’s objectives) such as income equity, poverty,inclusion in the work force, and so on. As noted earlier, it is alsoimportant that indicators for a policy action are differentiated byprocess, output and outcome (immediate, intermediate, and long-term); although of course when considering short-term objectives it isoften difficult to differentiate between process and outcomesindicators.
Some examples questions to consider, example activities to conduct,and some indicative indicators are outlined below.
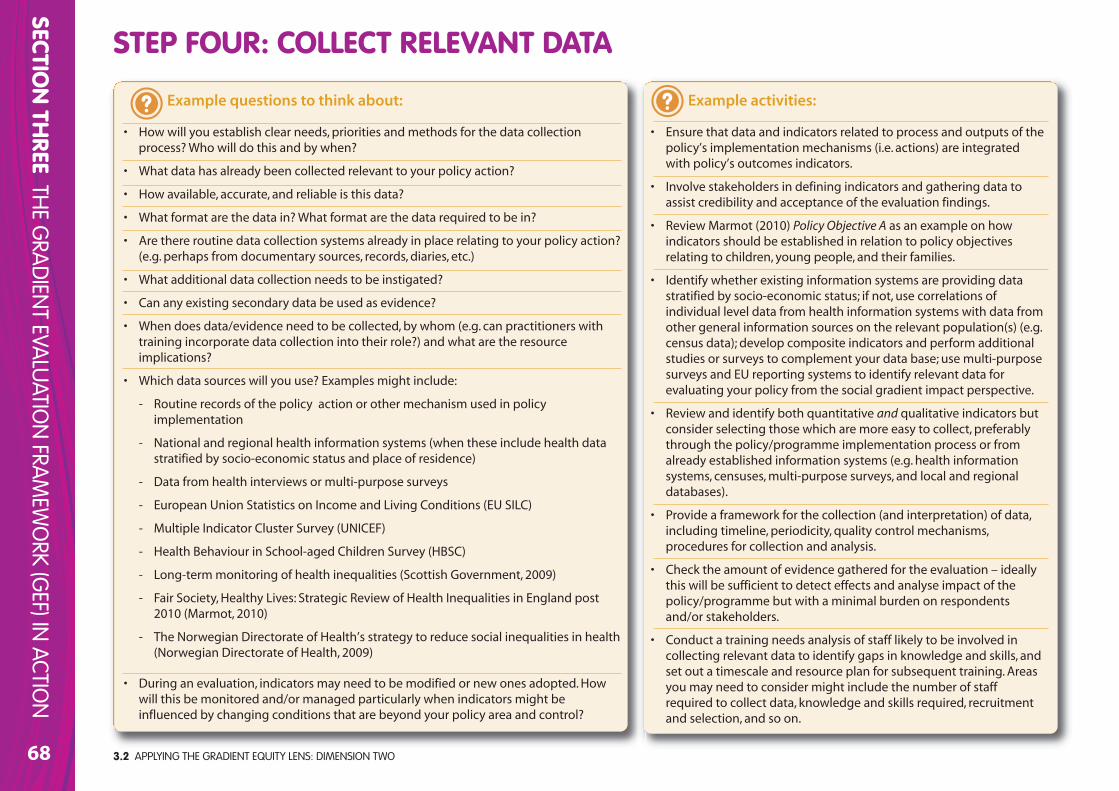
3.2 APPLYING THE GRADIENT EQUITY LENS: DIMENSION TWO68
SECTION TH
REETH
E GRA
DIEN
T EVALU
ATION
FRAM
EWO
RK (GEF) IN
ACTION
Example questions to think about:
• How will you establish clear needs, priorities and methods for the data collectionprocess? Who will do this and by when?
• What data has already been collected relevant to your policy action?
• How available, accurate, and reliable is this data?
• What format are the data in? What format are the data required to be in?
• Are there routine data collection systems already in place relating to your policy action?(e.g. perhaps from documentary sources, records, diaries, etc.)
• What additional data collection needs to be instigated?
• Can any existing secondary data be used as evidence?
• When does data/evidence need to be collected, by whom (e.g. can practitioners withtraining incorporate data collection into their role?) and what are the resourceimplications?
• Which data sources will you use? Examples might include:
- Routine records of the policy action or other mechanism used in policyimplementation
- National and regional health information systems (when these include health datastratified by socio-economic status and place of residence)
- Data from health interviews or multi-purpose surveys
- European Union Statistics on Income and Living Conditions (EU SILC)
- Multiple Indicator Cluster Survey (UNICEF)
- Health Behaviour in School-aged Children Survey (HBSC)
- Long-term monitoring of health inequalities (Scottish Government, 2009)
- Fair Society, Healthy Lives: Strategic Review of Health Inequalities in England post2010 (Marmot, 2010)
- The Norwegian Directorate of Health’s strategy to reduce social inequalities in health(Norwegian Directorate of Health, 2009)
• During an evaluation, indicators may need to be modified or new ones adopted. Howwill this be monitored and/or managed particularly when indicators might beinfluenced by changing conditions that are beyond your policy area and control?
Example activities:
• Ensure that data and indicators related to process and outputs of thepolicy’s implementation mechanisms (i.e. actions) are integratedwith policy’s outcomes indicators.
• Involve stakeholders in defining indicators and gathering data toassist credibility and acceptance of the evaluation findings.
• Review Marmot (2010) Policy Objective A as an example on howindicators should be established in relation to policy objectivesrelating to children, young people, and their families.
• Identify whether existing information systems are providing datastratified by socio-economic status; if not, use correlations ofindividual level data from health information systems with data fromother general information sources on the relevant population(s) (e.g.census data); develop composite indicators and perform additionalstudies or surveys to complement your data base; use multi-purposesurveys and EU reporting systems to identify relevant data forevaluating your policy from the social gradient impact perspective.
• Review and identify both quantitative and qualitative indicators butconsider selecting those which are more easy to collect, preferablythrough the policy/programme implementation process or fromalready established information systems (e.g. health informationsystems, censuses, multi-purpose surveys, and local and regionaldatabases).
• Provide a framework for the collection (and interpretation) of data,including timeline, periodicity, quality control mechanisms,procedures for collection and analysis.
• Check the amount of evidence gathered for the evaluation – ideallythis will be sufficient to detect effects and analyse impact of thepolicy/programme but with a minimal burden on respondentsand/or stakeholders.
• Conduct a training needs analysis of staff likely to be involved incollecting relevant data to identify gaps in knowledge and skills, andset out a timescale and resource plan for subsequent training. Areasyou may need to consider might include the number of staffrequired to collect data, knowledge and skills required, recruitmentand selection, and so on.
STEP FOUR: COLLECT RELEVANT DATA
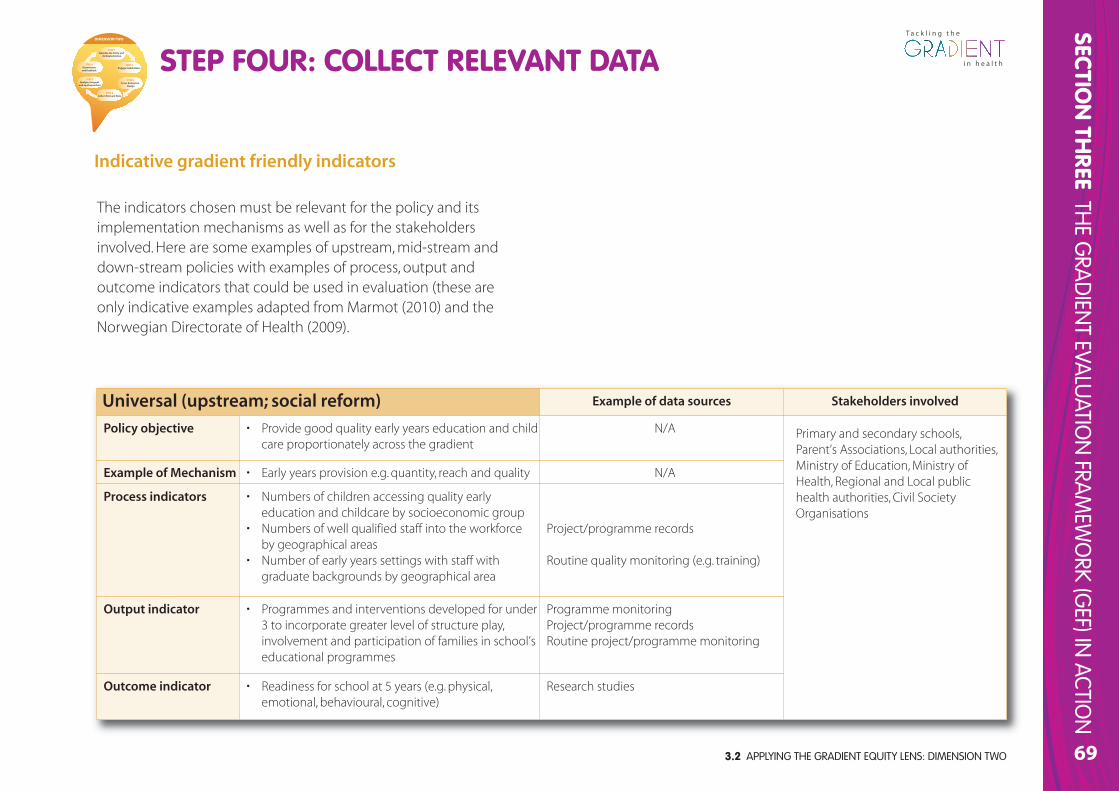
3.2 APPLYING THE GRADIENT EQUITY LENS: DIMENSION TWO
SECTION TH
REETH
E GRA
DIEN
T EVALU
ATION
FRAM
EWO
RK (GEF) IN
ACTION
69
T a c k l i n g t h e
i n h e a l t hi n h e a l t h
Universal (upstream; social reform) Example of data sources Stakeholders involved
Policy objective • Provide good quality early years education and childcare proportionately across the gradient
N/A Primary and secondary schools,Parent’s Associations, Local authorities,Ministry of Education, Ministry ofHealth, Regional and Local publichealth authorities, Civil SocietyOrganisations
Example of Mechanism • Early years provision e.g. quantity, reach and quality N/A
Process indicators • Numbers of children accessing quality earlyeducation and childcare by socioeconomic group
• Numbers of well qualified staff into the workforce by geographical areas
• Number of early years settings with staff withgraduate backgrounds by geographical area
Project/programme records
Routine quality monitoring (e.g. training)
Output indicator • Programmes and interventions developed for under3 to incorporate greater level of structure play,involvement and participation of families in school’seducational programmes
Programme monitoringProject/programme recordsRoutine project/programme monitoring
Outcome indicator • Readiness for school at 5 years (e.g. physical,emotional, behavioural, cognitive)
Research studies
The indicators chosen must be relevant for the policy and itsimplementation mechanisms as well as for the stakeholdersinvolved. Here are some examples of upstream, mid-stream anddown-stream policies with examples of process, output andoutcome indicators that could be used in evaluation (these areonly indicative examples adapted from Marmot (2010) and theNorwegian Directorate of Health (2009).
STEP FOUR: COLLECT RELEVANT DATADIMENSION TWO
STEP 5Analyse, Interpret
and Synthesise Data
STEP 2Engage Stakeholders
STEP 1Describe the Policy and
it’s Related Action
STEP 6Disseminate
and feedback
STEP 3Focus Evaluation
Design
STEP 4Collect Relevant Data
Indicative gradient friendly indicators
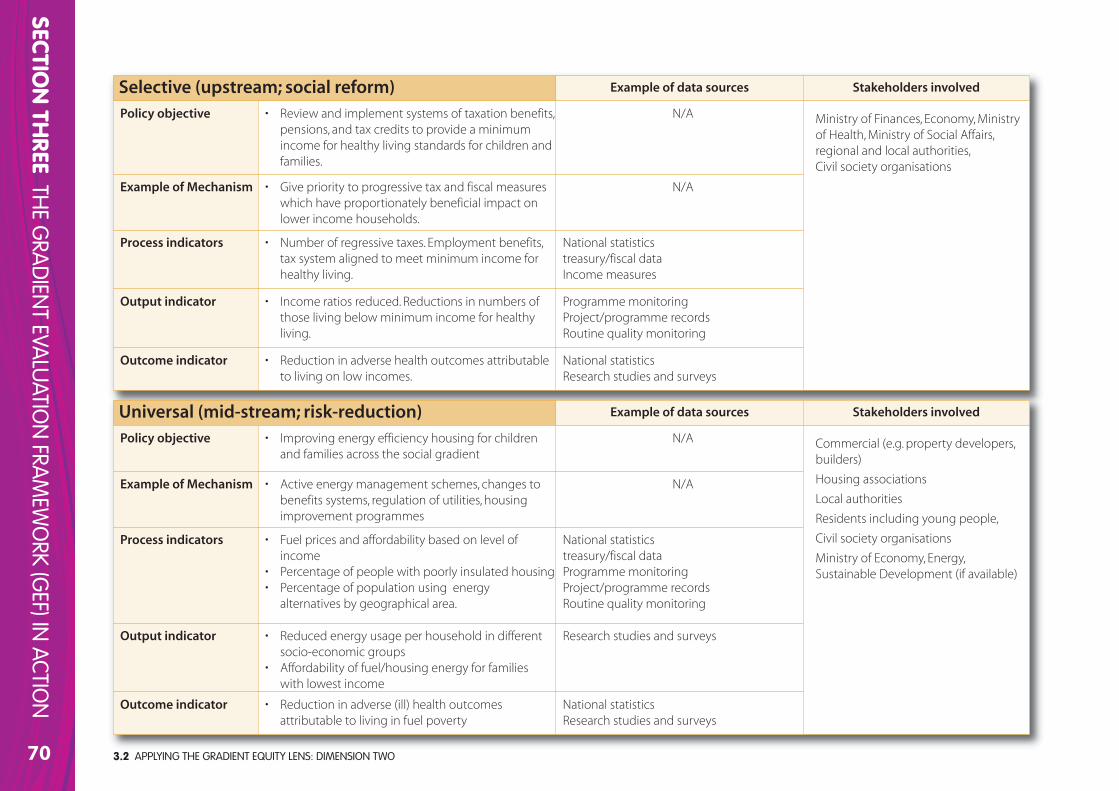
3.2 APPLYING THE GRADIENT EQUITY LENS: DIMENSION TWO70
SECTION TH
REETH
E GRA
DIEN
T EVALU
ATION
FRAM
EWO
RK (GEF) IN
ACTION
Selective (upstream; social reform) Example of data sources Stakeholders involved
Policy objective • Review and implement systems of taxation benefits,pensions, and tax credits to provide a minimumincome for healthy living standards for children andfamilies.
N/A Ministry of Finances, Economy, Ministryof Health, Ministry of Social Affairs,regional and local authorities, Civil society organisations
Example of Mechanism • Give priority to progressive tax and fiscal measureswhich have proportionately beneficial impact onlower income households.
N/A
Process indicators • Number of regressive taxes. Employment benefits,tax system aligned to meet minimum income forhealthy living.
National statisticstreasury/fiscal dataIncome measures
Output indicator • Income ratios reduced. Reductions in numbers ofthose living below minimum income for healthyliving.
Programme monitoringProject/programme recordsRoutine quality monitoring
Outcome indicator • Reduction in adverse health outcomes attributableto living on low incomes.
National statisticsResearch studies and surveys
Universal (mid-stream; risk-reduction) Example of data sources Stakeholders involved
Policy objective • Improving energy efficiency housing for childrenand families across the social gradient
N/A Commercial (e.g. property developers,builders)
Housing associations
Local authorities
Residents including young people,
Civil society organisations
Ministry of Economy, Energy,Sustainable Development (if available)
Example of Mechanism • Active energy management schemes, changes tobenefits systems, regulation of utilities, housingimprovement programmes
N/A
Process indicators • Fuel prices and affordability based on level ofincome
• Percentage of people with poorly insulated housing• Percentage of population using energy
alternatives by geographical area.
National statisticstreasury/fiscal dataProgramme monitoringProject/programme recordsRoutine quality monitoring
Output indicator • Reduced energy usage per household in differentsocio-economic groups
• Affordability of fuel/housing energy for families with lowest income
Research studies and surveys
Outcome indicator • Reduction in adverse (ill) health outcomesattributable to living in fuel poverty
National statisticsResearch studies and surveys
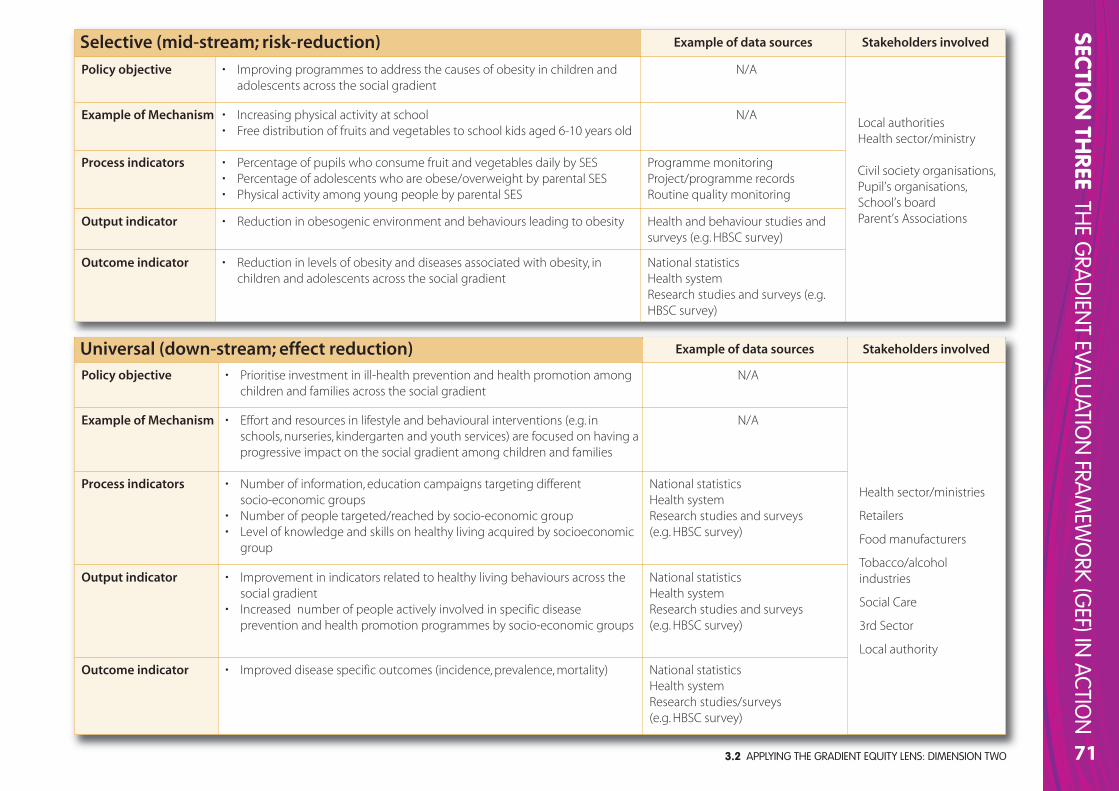
3.2 APPLYING THE GRADIENT EQUITY LENS: DIMENSION TWO
SECTION TH
REETH
E GRA
DIEN
T EVALU
ATION
FRAM
EWO
RK (GEF) IN
ACTION
71
T a c k l i n g t h e
i n h e a l t hi n h e a l t h
Universal (down-stream; effect reduction) Example of data sources Stakeholders involved
Policy objective • Prioritise investment in ill-health prevention and health promotion amongchildren and families across the social gradient
N/A
Health sector/ministries
Retailers
Food manufacturers
Tobacco/alcoholindustries
Social Care
3rd Sector
Local authority
Example of Mechanism • Effort and resources in lifestyle and behavioural interventions (e.g. inschools, nurseries, kindergarten and youth services) are focused on having aprogressive impact on the social gradient among children and families
N/A
Process indicators • Number of information, education campaigns targeting different socio-economic groups
• Number of people targeted/reached by socio-economic group • Level of knowledge and skills on healthy living acquired by socioeconomic
group
National statisticsHealth systemResearch studies and surveys (e.g. HBSC survey)
Output indicator • Improvement in indicators related to healthy living behaviours across thesocial gradient
• Increased number of people actively involved in specific disease prevention and health promotion programmes by socio-economic groups
National statisticsHealth systemResearch studies and surveys (e.g. HBSC survey)
Outcome indicator • Improved disease specific outcomes (incidence, prevalence, mortality) National statisticsHealth systemResearch studies/surveys (e.g. HBSC survey)
Selective (mid-stream; risk-reduction) Example of data sources Stakeholders involved
Policy objective • Improving programmes to address the causes of obesity in children andadolescents across the social gradient
N/A
Local authoritiesHealth sector/ministry
Civil society organisations, Pupil’s organisations, School’s board Parent’s Associations
Example of Mechanism • Increasing physical activity at school• Free distribution of fruits and vegetables to school kids aged 6-10 years old
N/A
Process indicators • Percentage of pupils who consume fruit and vegetables daily by SES • Percentage of adolescents who are obese/overweight by parental SES• Physical activity among young people by parental SES
Programme monitoringProject/programme recordsRoutine quality monitoring
Output indicator • Reduction in obesogenic environment and behaviours leading to obesity Health and behaviour studies andsurveys (e.g. HBSC survey)
Outcome indicator • Reduction in levels of obesity and diseases associated with obesity, inchildren and adolescents across the social gradient
National statisticsHealth systemResearch studies and surveys (e.g.HBSC survey)
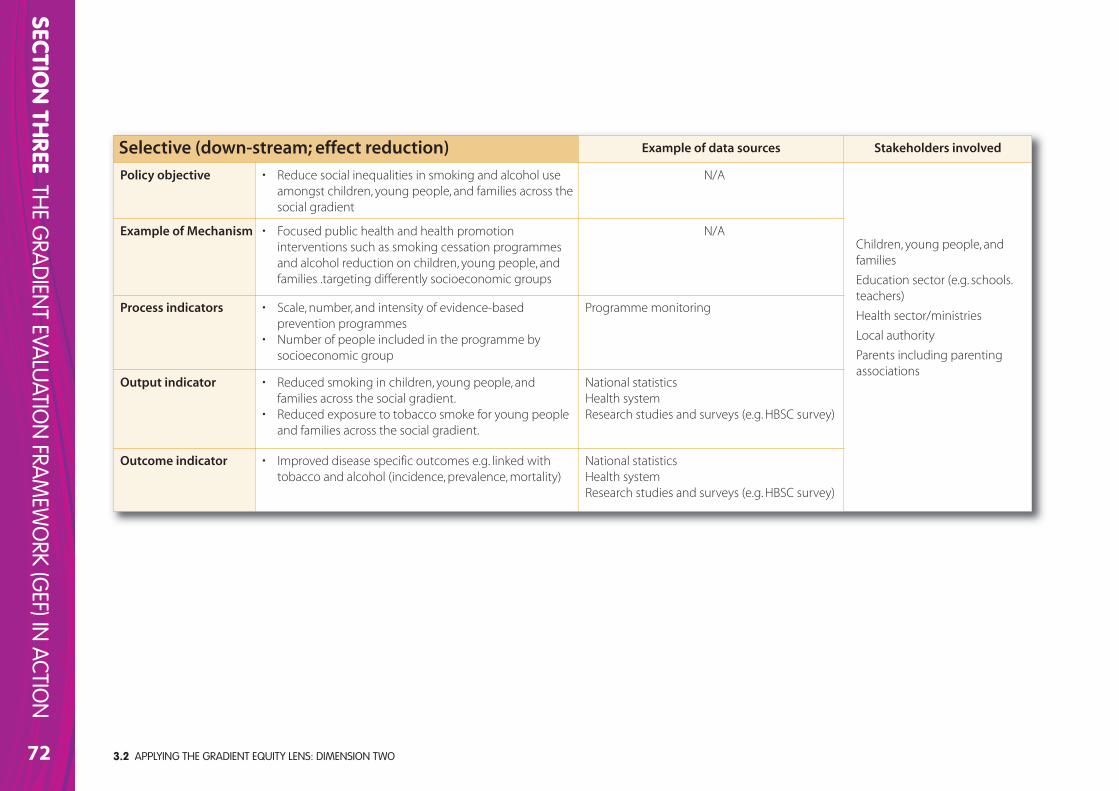
3.2 APPLYING THE GRADIENT EQUITY LENS: DIMENSION TWO72
SECTION TH
REETH
E GRA
DIEN
T EVALU
ATION
FRAM
EWO
RK (GEF) IN
ACTION
Selective (down-stream; effect reduction) Example of data sources Stakeholders involved
Policy objective • Reduce social inequalities in smoking and alcohol useamongst children, young people, and families across thesocial gradient
N/A
Children, young people, andfamilies
Education sector (e.g. schools.teachers)
Health sector/ministries
Local authority
Parents including parentingassociations
Example of Mechanism • Focused public health and health promotioninterventions such as smoking cessation programmesand alcohol reduction on children, young people, andfamilies .targeting differently socioeconomic groups
N/A
Process indicators • Scale, number, and intensity of evidence-basedprevention programmes
• Number of people included in the programme bysocioeconomic group
Programme monitoring
Output indicator • Reduced smoking in children, young people, and families across the social gradient.
• Reduced exposure to tobacco smoke for young peopleand families across the social gradient.
National statisticsHealth systemResearch studies and surveys (e.g. HBSC survey)
Outcome indicator • Improved disease specific outcomes e.g. linked withtobacco and alcohol (incidence, prevalence, mortality)
National statisticsHealth systemResearch studies and surveys (e.g. HBSC survey)
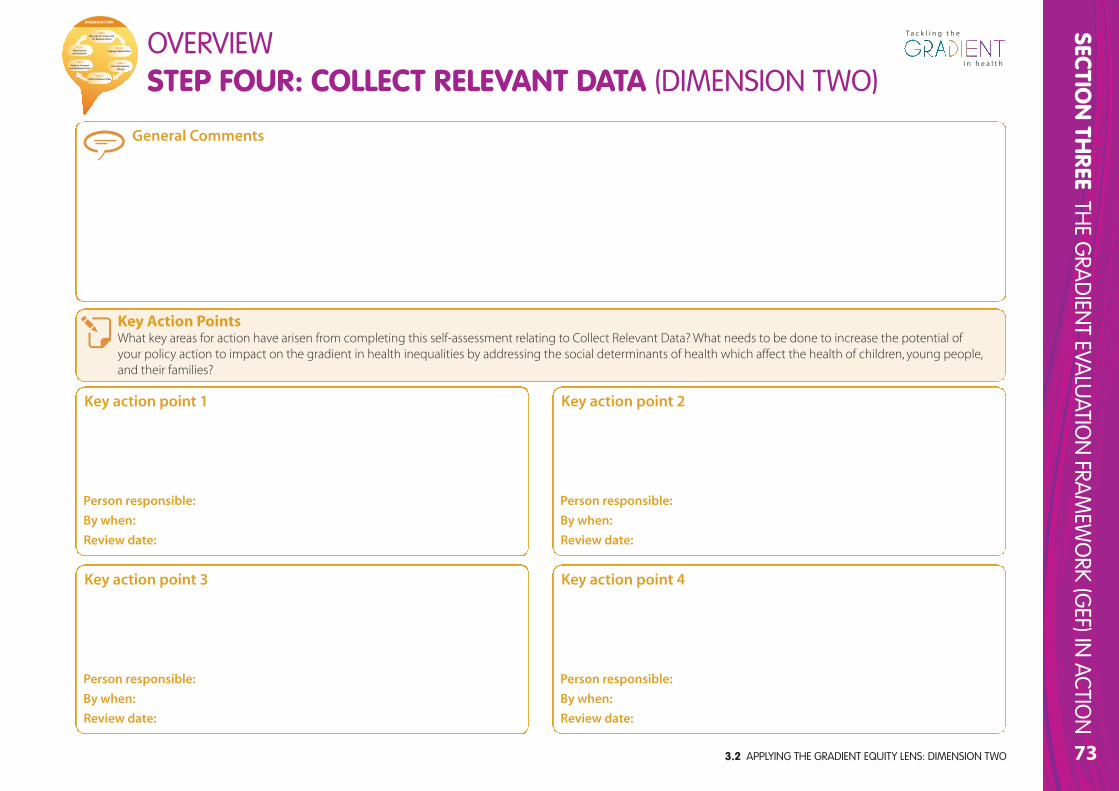
3.2 APPLYING THE GRADIENT EQUITY LENS: DIMENSION TWO
SECTION TH
REETH
E GRA
DIEN
T EVALU
ATION
FRAM
EWO
RK (GEF) IN
ACTION
73
T a c k l i n g t h e
i n h e a l t hi n h e a l t h
General Comments
Key Action PointsWhat key areas for action have arisen from completing this self-assessment relating to Collect Relevant Data? What needs to be done to increase the potential ofyour policy action to impact on the gradient in health inequalities by addressing the social determinants of health which affect the health of children, young people,and their families?
Key action point 1
Person responsible:
By when:
Review date:
Key action point 3
Person responsible:
By when:
Review date:
Key action point 2
Person responsible:
By when:
Review date:
Key action point 4
Person responsible:
By when:
Review date:
DIMENSION TWO
STEP 5Analyse, Interpret
and Synthesise Data
STEP 2Engage Stakeholders
STEP 1Describe the Policy and
it’s Related Action
STEP 6Disseminate
and feedback
STEP 3Focus Evaluation
Design
STEP 4Collect Relevant Data STEP FOUR: COLLECT RELEVANT DATA (DIMENSION TWO)
OVERVIEW
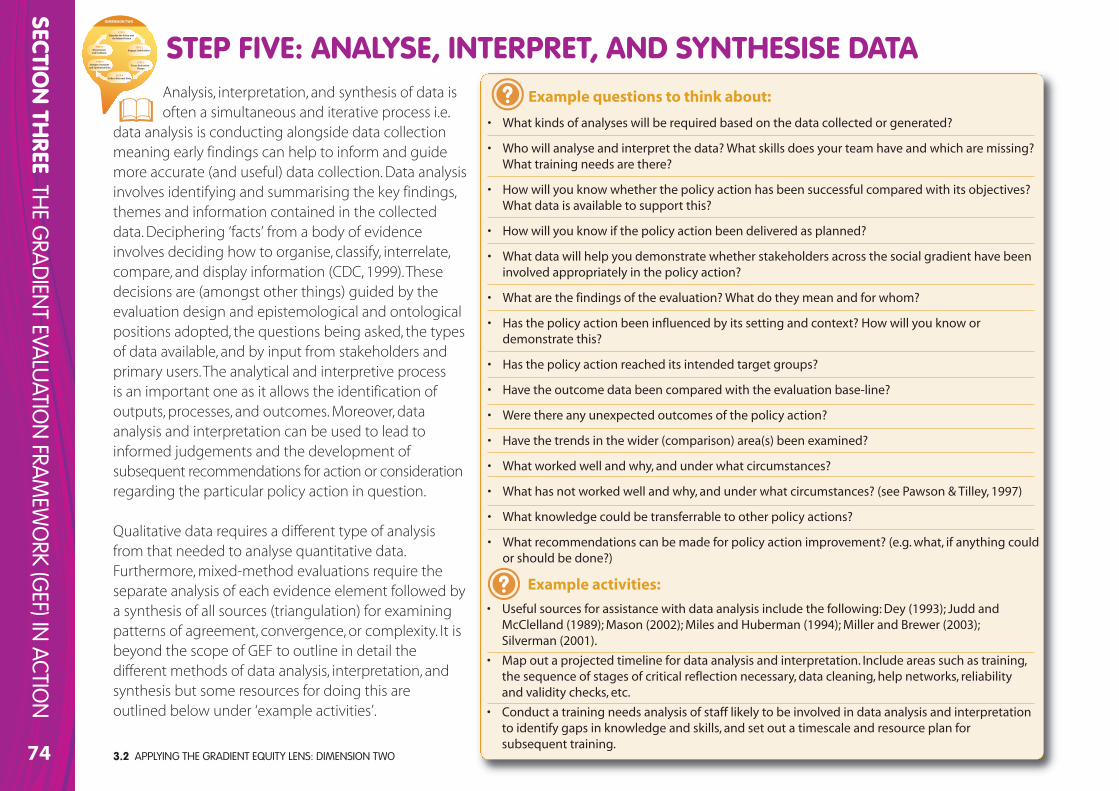
DIMENSION TWO
STEP 5Analyse, Interpret
and Synthesise Data
STEP 2Engage Stakeholders
STEP 1Describe the Policy and
it’s Related Action
STEP 6Disseminate
and feedback
STEP 3Focus Evaluation
Design
STEP 4Collect Relevant Data
3.2 APPLYING THE GRADIENT EQUITY LENS: DIMENSION TWO74
SECTION TH
REETH
E GRA
DIEN
T EVALU
ATION
FRAM
EWO
RK (GEF) IN
ACTION
Example questions to think about:
• What kinds of analyses will be required based on the data collected or generated?
• Who will analyse and interpret the data? What skills does your team have and which are missing?What training needs are there?
• How will you know whether the policy action has been successful compared with its objectives?What data is available to support this?
• How will you know if the policy action been delivered as planned?
• What data will help you demonstrate whether stakeholders across the social gradient have beeninvolved appropriately in the policy action?
• What are the findings of the evaluation? What do they mean and for whom?
• Has the policy action been influenced by its setting and context? How will you know ordemonstrate this?
• Has the policy action reached its intended target groups?
• Have the outcome data been compared with the evaluation base-line?
• Were there any unexpected outcomes of the policy action?
• Have the trends in the wider (comparison) area(s) been examined?
• What worked well and why, and under what circumstances?
• What has not worked well and why, and under what circumstances? (see Pawson & Tilley, 1997)
• What knowledge could be transferrable to other policy actions?
• What recommendations can be made for policy action improvement? (e.g. what, if anything couldor should be done?)
Example activities:
• Useful sources for assistance with data analysis include the following: Dey (1993); Judd andMcClelland (1989); Mason (2002); Miles and Huberman (1994); Miller and Brewer (2003);Silverman (2001).
• Map out a projected timeline for data analysis and interpretation. Include areas such as training,the sequence of stages of critical reflection necessary, data cleaning, help networks, reliabilityand validity checks, etc.
• Conduct a training needs analysis of staff likely to be involved in data analysis and interpretationto identify gaps in knowledge and skills, and set out a timescale and resource plan forsubsequent training.
Analysis, interpretation, and synthesis of data isoften a simultaneous and iterative process i.e.
data analysis is conducting alongside data collectionmeaning early findings can help to inform and guidemore accurate (and useful) data collection. Data analysisinvolves identifying and summarising the key findings,themes and information contained in the collecteddata. Deciphering ‘facts’ from a body of evidenceinvolves deciding how to organise, classify, interrelate,compare, and display information (CDC, 1999). Thesedecisions are (amongst other things) guided by theevaluation design and epistemological and ontologicalpositions adopted, the questions being asked, the typesof data available, and by input from stakeholders andprimary users. The analytical and interpretive process is an important one as it allows the identification ofoutputs, processes, and outcomes. Moreover, dataanalysis and interpretation can be used to lead toinformed judgements and the development ofsubsequent recommendations for action or considerationregarding the particular policy action in question.
Qualitative data requires a different type of analysisfrom that needed to analyse quantitative data.Furthermore, mixed-method evaluations require theseparate analysis of each evidence element followed bya synthesis of all sources (triangulation) for examiningpatterns of agreement, convergence, or complexity. It isbeyond the scope of GEF to outline in detail thedifferent methods of data analysis, interpretation, andsynthesis but some resources for doing this areoutlined below under ‘example activities’.
STEP FIVE: ANALYSE, INTERPRET, AND SYNTHESISE DATA
3.2 APPLYING THE GRADIENT EQUITY LENS: DIMENSION TWO
SECTION TH
REETH
E GRA
DIEN
T EVALU
ATION
FRAM
EWO
RK (GEF) IN
ACTION
75
T a c k l i n g t h e
i n h e a l t hi n h e a l t h
General Comments
Key Action PointsWhat key areas for action have arisen from completing this self-assessment relating to Analyse, Interpret, and Synthesise Data? What needs to be done to increasethe potential of your policy action to impact on the gradient in health inequalities by addressing the social determinants of health which affect the health ofchildren, young people, and their families?
Key action point 1
Person responsible:
By when:
Review date:
Key action point 3
Person responsible:
By when:
Review date:
Key action point 2
Person responsible:
By when:
Review date:
Key action point 4
Person responsible:
By when:
Review date:
DIMENSION TWO
STEP 5Analyse, Interpret
and Synthesise Data
STEP 2Engage Stakeholders
STEP 1Describe the Policy and
it’s Related Action
STEP 6Disseminate
and feedback
STEP 3Focus Evaluation
Design
STEP 4Collect Relevant Data
STEP FIVE: ANALYSE, INTERPRET, AND SYNTHESISE DATA(DIMENSION TWO)
OVERVIEW
3.2 APPLYING THE GRADIENT EQUITY LENS: DIMENSION TWO76
SECTION TH
REETH
E GRA
DIEN
T EVALU
ATION
FRAM
EWO
RK (GEF) IN
ACTION
DIMENSION TWO
STEP 5Analyse, Interpret
and Synthesise Data
STEP 2Engage Stakeholders
STEP 1Describe the Policy and
it’s Related Action
STEP 6Disseminate
and feedback
STEP 3Focus Evaluation
Design
STEP 4Collect Relevant Data
Example questions to think about:
• How will you ensure that findings of the evaluation are disseminated torelevant stakeholders across the social gradient? How will you know if thishas been done?
• How will evaluation findings feedback into the design of the policy action?What kinds of information will need to be communicated and to whom?
• How will findings be communicated at different geographic levels e.g.local, national, European? What local, national, European networks and/orpartnerships are available to facilitate this?
• What facilitating or inhibiting factors may impact on effective and timelydissemination of evaluation findings?
• How might your dissemination activities raise the profile for actions tolevel-up the gradient among children, young people, and their families?
Example activities:
• Revisit and update your dissemination/communications plan as necessary.
• Consider a variety of very different communication techniques to reachdifferent stakeholders across the social gradient such as short reports,flyers, workshops, topical articles in the ‘trades press’, journal articles,feedback seminars and so on.
• Disseminate both procedures/processes used as well as outcomes fromevaluation activities to relevant stakeholders across the gradient tailoredto meet their needs.
• Consider putting together practical examples of how aspects of yourevaluation findings can influence practice.
Communicating lessons learned
As stated earlier, lessons learned in the course of anevaluation do not automatically translate into informeddecision-making and appropriate action. Focus and effort istherefore needed to ensure that findings are used anddisseminated appropriately to relevant stakeholders acrossthe social gradient, as well as being fed back into the on-going development and review of the policy action.
STEP SIX: DISSEMINATE AND FEEDBACK
3.2 APPLYING THE GRADIENT EQUITY LENS: DIMENSION TWO
SECTION TH
REETH
E GRA
DIEN
T EVALU
ATION
FRAM
EWO
RK (GEF) IN
ACTION
77
T a c k l i n g t h e
i n h e a l t hi n h e a l t h
General Comments
Key Action PointsWhat key areas for action have arisen from completing this self-assessment relating to Disseminate and Feedback? What needs to be done to increase thepotential of your policy action to impact on the gradient in health inequalities by addressing the social determinants of health which affect the health of children,young people, and their families??
Key action point 1
Person responsible:
By when:
Review date:
Key action point 3
Person responsible:
By when:
Review date:
Key action point 2
Person responsible:
By when:
Review date:
Key action point 4
Person responsible:
By when:
Review date:
DIMENSION TWO
STEP 5Analyse, Interpret
and Synthesise Data
STEP 2Engage Stakeholders
STEP 1Describe the Policy and
it’s Related Action
STEP 6Disseminate
and feedback
STEP 3Focus Evaluation
Design
STEP 4Collect Relevant Data STEP SIX: DISSEMINATE AND FEEDBACK (DIMENSION TWO)
OVERVIEW
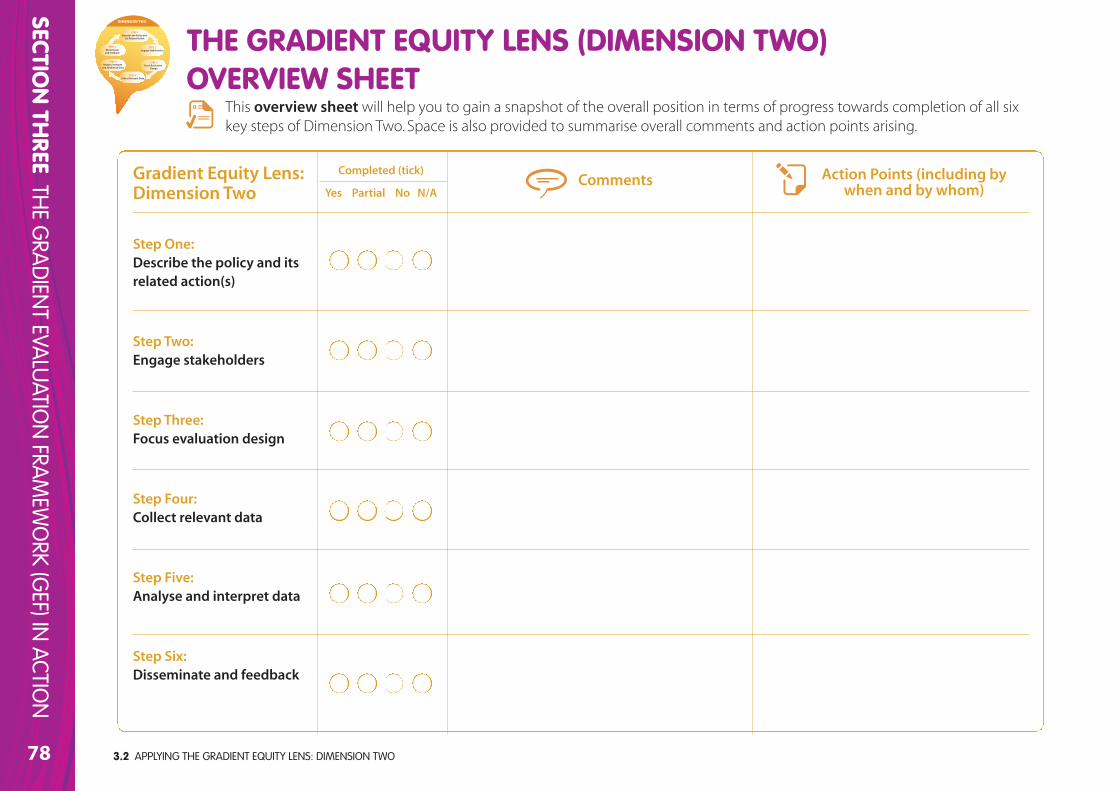
3.2 APPLYING THE GRADIENT EQUITY LENS: DIMENSION TWO78
SECTION TH
REETH
E GRA
DIEN
T EVALU
ATION
FRAM
EWO
RK (GEF) IN
ACTION
Gradient Equity Lens: Dimension Two
Step One: Describe the policy and itsrelated action(s)
Step Two: Engage stakeholders
Step Three:Focus evaluation design
Step Four: Collect relevant data
Step Five: Analyse and interpret data
Step Six: Disseminate and feedback
Comments
This overview sheetwill help you to gain a snapshot of the overall position in terms of progress towards completion of all sixkey steps of Dimension Two. Space is also provided to summarise overall comments and action points arising.
THE GRADIENT EQUITY LENS (DIMENSION TWO)OVERVIEW SHEET
DIMENSION TWO
STEP 5Analyse, Interpret
and Synthesise Data
STEP 2Engage Stakeholders
STEP 1Describe the Policy and
it’s Related Action
STEP 6Disseminate
and feedback
STEP 3Focus Evaluation
Design
STEP 4Collect Relevant Data
Completed (tick)
Yes Partial No N/A
Action Points (including bywhen and by whom)

SECTION
FOU
RRESO
URCES
79
SECTION FOURRESOURCES
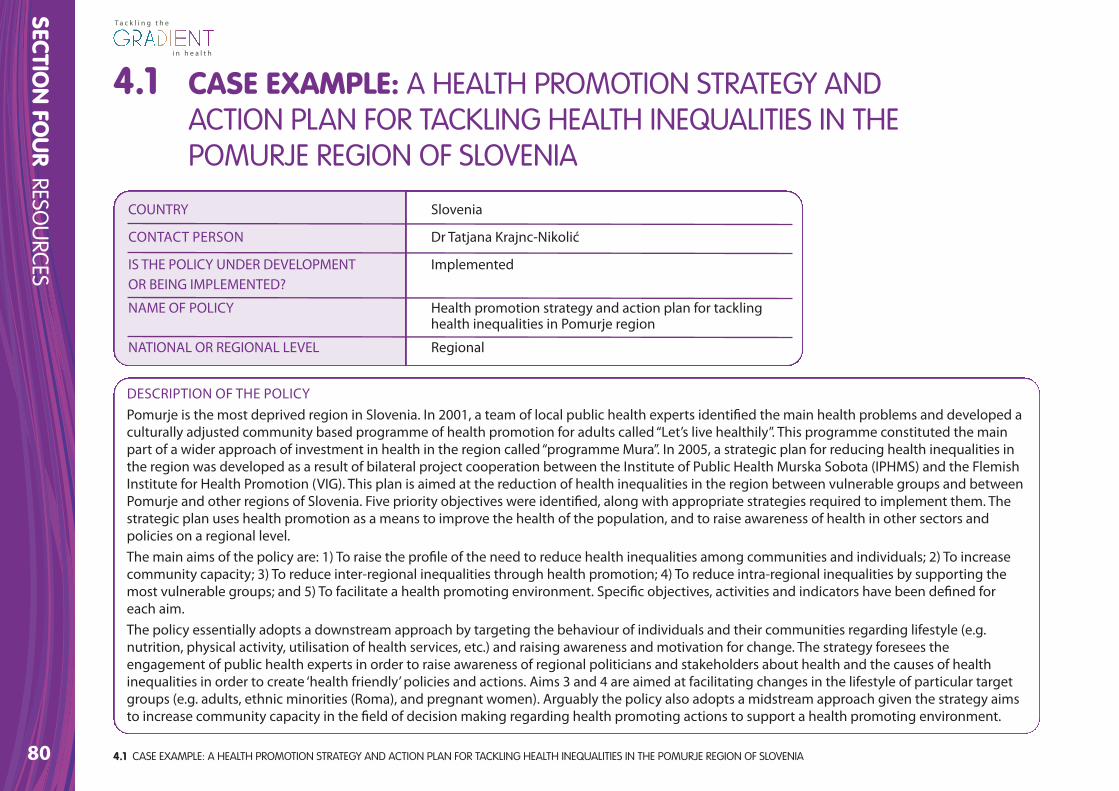
coUntry slovenia
contAct person Dr tatjana Krajnc-nikolić
is the policy UnDer DeVelopMent implementedor beinG iMpleMenteD?
nAMe of policy health promotion strategy and action plan for tacklinghealth inequalities in pomurje region
nAtionAl or reGionAl leVel regional
4.1 CASE EXAMPLE: A HEALTH PROMOTION STRATEGY AND ACTION PLAN FOR TACKLING HEALTH INEQUALITIES IN THE POMURJE REGION OF SLOVENIA80
SECTION
FOU
RRESO
URCES
T a c k l i n g t h e
i n h e a l t hi n h e a l t h
4.1 CASE EXAMPLE: A HEALTH PROMOTION STRATEGY ANDACTION PLAN FOR TACKLING HEALTH INEQUALITIES IN THEPOMURJE REGION OF SLOVENIA
Description of the policypomurje is the most deprived region in slovenia. in 2001, a team of local public health experts identified the main health problems and developed aculturally adjusted community based programme of health promotion for adults called “let’s live healthily”. this programme constituted the mainpart of a wider approach of investment in health in the region called “programme Mura”. in 2005, a strategic plan for reducing health inequalities inthe region was developed as a result of bilateral project cooperation between the institute of public health Murska sobota (iphMs) and the flemishinstitute for health promotion (ViG). this plan is aimed at the reduction of health inequalities in the region between vulnerable groups and betweenpomurje and other regions of slovenia. five priority objectives were identified, along with appropriate strategies required to implement them. thestrategic plan uses health promotion as a means to improve the health of the population, and to raise awareness of health in other sectors andpolicies on a regional level. the main aims of the policy are: 1) to raise the profile of the need to reduce health inequalities among communities and individuals; 2) to increasecommunity capacity; 3) to reduce inter-regional inequalities through health promotion; 4) to reduce intra-regional inequalities by supporting themost vulnerable groups; and 5) to facilitate a health promoting environment. specific objectives, activities and indicators have been defined foreach aim. the policy essentially adopts a downstream approach by targeting the behaviour of individuals and their communities regarding lifestyle (e.g.nutrition, physical activity, utilisation of health services, etc.) and raising awareness and motivation for change. the strategy foresees theengagement of public health experts in order to raise awareness of regional politicians and stakeholders about health and the causes of healthinequalities in order to create ‘health friendly’ policies and actions. Aims 3 and 4 are aimed at facilitating changes in the lifestyle of particular targetgroups (e.g. adults, ethnic minorities (roma), and pregnant women). Arguably the policy also adopts a midstream approach given the strategy aimsto increase community capacity in the field of decision making regarding health promoting actions to support a health promoting environment.
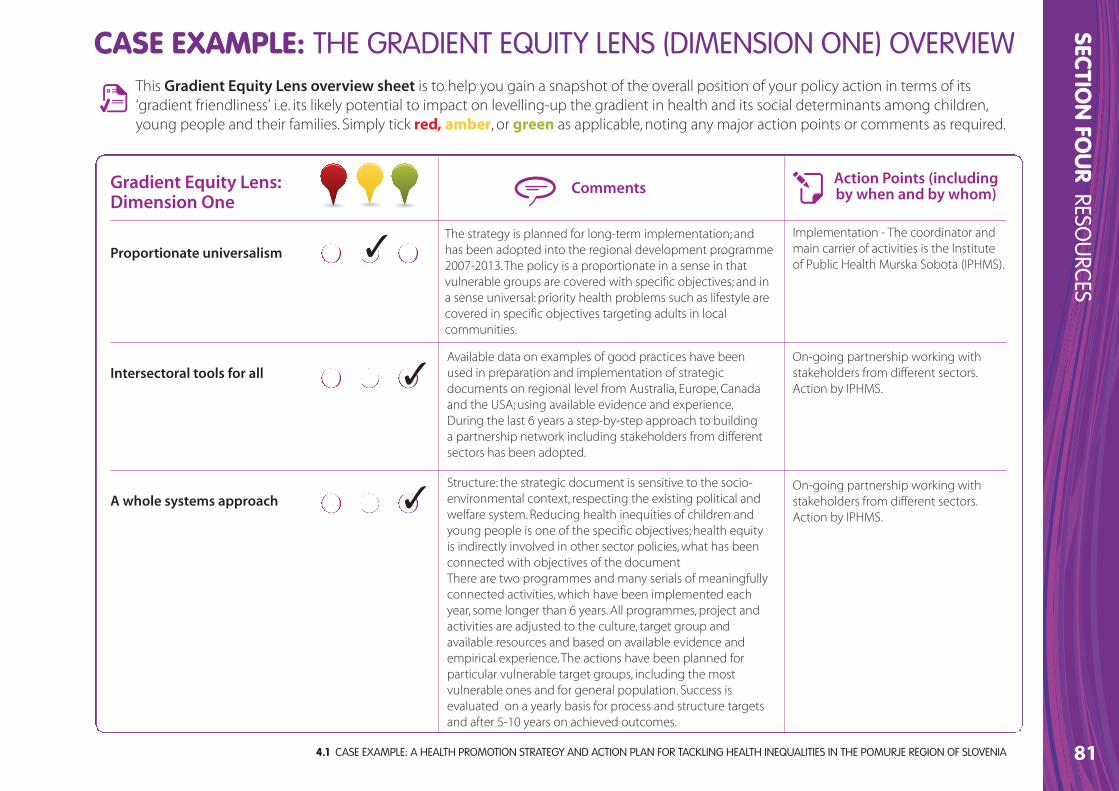
4.1 CASE EXAMPLE: A HEALTH PROMOTION STRATEGY AND ACTION PLAN FOR TACKLING HEALTH INEQUALITIES IN THE POMURJE REGION OF SLOVENIA
SECTION
FOU
RRESO
URCES
81
Gradient Equity Lens: Dimension One
Proportionate universalism
Intersectoral tools for all
A whole systems approach
Comments
This Gradient Equity Lens overview sheet is to help you gain a snapshot of the overall position of your policy action in terms of its‘gradient friendliness’ i.e. its likely potential to impact on levelling-up the gradient in health and its social determinants among children,young people and their families. Simply tick red, amber, or green as applicable, noting any major action points or comments as required.
CASE EXAMPLE: THE GRADIENT EQUITY LENS (DIMENSION ONE) OVERVIEW
Action Points (includingby when and by whom)
✓
✓
✓
The strategy is planned for long-term implementation; andhas been adopted into the regional development programme2007-2013. The policy is a proportionate in a sense in thatvulnerable groups are covered with specific objectives; and ina sense universal: priority health problems such as lifestyle arecovered in specific objectives targeting adults in localcommunities.
Implementation - The coordinator andmain carrier of activities is the Instituteof Public Health Murska Sobota (IPHMS).
Available data on examples of good practices have beenused in preparation and implementation of strategicdocuments on regional level from Australia, Europe, Canadaand the USA; using available evidence and experience.During the last 6 years a step-by-step approach to buildinga partnership network including stakeholders from differentsectors has been adopted.
On-going partnership working withstakeholders from different sectors.Action by IPHMS.
Structure: the strategic document is sensitive to the socio-environmental context, respecting the existing political andwelfare system. Reducing health inequities of children andyoung people is one of the specific objectives; health equityis indirectly involved in other sector policies, what has beenconnected with objectives of the documentThere are two programmes and many serials of meaningfullyconnected activities, which have been implemented eachyear, some longer than 6 years. All programmes, project andactivities are adjusted to the culture, target group andavailable resources and based on available evidence andempirical experience. The actions have been planned forparticular vulnerable target groups, including the mostvulnerable ones and for general population. Success isevaluated on a yearly basis for process and structure targetsand after 5-10 years on achieved outcomes.
On-going partnership working withstakeholders from different sectors.Action by IPHMS.
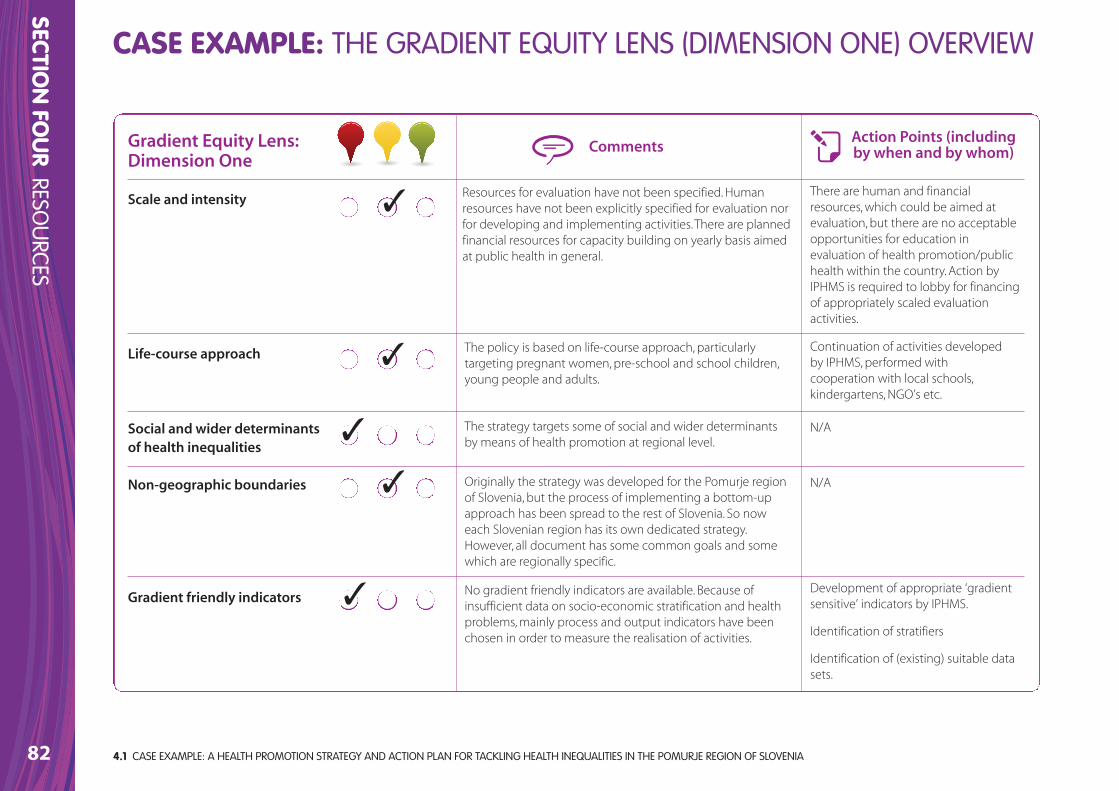
82
SECTION
FOU
RRESO
URCES
CASE EXAMPLE: THE GRADIENT EQUITY LENS (DIMENSION ONE) OVERVIEW
Gradient Equity Lens: Dimension One
Scale and intensity
Life-course approach
Social and wider determinantsof health inequalities
Non-geographic boundaries
Gradient friendly indicators
CommentsAction Points (includingby when and by whom)
✓
✓
✓
✓
✓
Resources for evaluation have not been specified. Humanresources have not been explicitly specified for evaluation norfor developing and implementing activities. There are plannedfinancial resources for capacity building on yearly basis aimedat public health in general.
There are human and financialresources, which could be aimed atevaluation, but there are no acceptableopportunities for education inevaluation of health promotion/publichealth within the country. Action byIPHMS is required to lobby for financingof appropriately scaled evaluationactivities.
The policy is based on life-course approach, particularlytargeting pregnant women, pre-school and school children,young people and adults.
Continuation of activities developedby IPHMS, performed withcooperation with local schools,kindergartens, NGO’s etc.
The strategy targets some of social and wider determinantsby means of health promotion at regional level.
N/A
Originally the strategy was developed for the Pomurje regionof Slovenia, but the process of implementing a bottom-upapproach has been spread to the rest of Slovenia. So noweach Slovenian region has its own dedicated strategy.However, all document has some common goals and somewhich are regionally specific.
N/A
No gradient friendly indicators are available. Because ofinsufficient data on socio-economic stratification and healthproblems, mainly process and output indicators have beenchosen in order to measure the realisation of activities.
Development of appropriate ‘gradientsensitive’ indicators by IPHMS.
Identification of stratifiers
Identification of (existing) suitable datasets.
4.1 CASE EXAMPLE: A HEALTH PROMOTION STRATEGY AND ACTION PLAN FOR TACKLING HEALTH INEQUALITIES IN THE POMURJE REGION OF SLOVENIA
4.2 GLOSSARY
SECTION
FOU
RRESO
URCES
83
T a c k l i n g t h e
i n h e a l t hi n h e a l t h
action to health outcomes (e.g. because of the technical difficulties of isolating cause and effect in complex, ‘real-life’ situations). Indeed,“...good evaluation does not necessarily provide definitive answers –instead they reduce uncertainty about the consequences of a choice”(Leviton, 2010). Evaluations inform a body of evidence that over time helps to frame the issues and sharpen the focus on how wethink about the net benefits for health, quality of life and otheringredients of happiness. Evaluation is thus inherently political andcontext specific.
Evaluation frameworkIn GEF an evaluation framework is seen as a coherent mechanism forthe evaluation of all aspects of a policy and/or its relation action,programme, intervention, or project. An evaluation framework maycomprise a series of relevant questions, as well as indicators, datasources, and specific methods for collecting evaluation data.
EvidenceKnowledge from a variety of sources including qualitative andquantitative research, programme evaluations, client values andpreferences, and professional experience (Scott & Gall, 2006).
HealthHealth is a state of complete physical, mental and social well-being,and not merely the absence of disease or infirmity. Health is a resourcefor everyday life, not the object of living and is a positive conceptemphasising social and personal resources as well as physicalcapacities (WHO, 1998).
Baseline The situation at the start of a policy action before any part of theaction has been carried out. The information that helps to define thenature and extent of the problem.
Decision makerSee policy-maker.
Determinants of healthDeterminants of health are factors which influence health status anddetermine health differentials or health inequalities. They are manyand varied and include, for example, natural, biological factors, such asage, gender and ethnicity; behaviour and lifestyles, such as smoking,alcohol consumption, diet and physical exercise; the physical andsocial environment, including housing quality, the workplace and thewider urban and rural environment; and access to health care.(Lalonde, 1974; Labonté 1993) All of these are closely interlinked anddifferentials in their distribution lead to health inequalities.
EffectivenessThe measure of an ability of an action, programme, intervention,project, and/or policy to do what it was intended to do: produce adesired result or effect that can be quantitatively measured (from theEuropean Observatory on Health Systems and Policies Glossary).
EvaluationAn assessment of the extent to which public health/health promotionactions achieve a particularly valued or desired outcome. However, inmany cases it is difficult to trace the pathway which links particular
4.2 GLOSSARY
Health Equity Audit/Assessment Health equity audits (HEAs) or assessments identify how fairly servicesor other resources are distributed in relation to the health needs ofdifferent groups and areas, and the priority action to provide servicesrelative to need.
Health Equity/Equity in HealthEquity is the absence of unfair, avoidable differences among groups ofpeople whether these groups are defined socially, economically,geographically or demographically (WHO, 2009). Health equity/equityin health means that everyone should have a fair opportunity to attaintheir full health potential, and no one should be disadvantaged fromachieving their potential (WHO 2009). Health equity is the absence ofhealth inequalities (Ministry of Health and Social Policy of Spain, 2010).
Health Impact Assessment (HIA)HIA is an approach that ensures decision-making at all levels considersthe potential impacts of decisions on health and health inequalities,and the distribution of those impacts within a population. It identifiesactions that can enhance positive effects and reduce or eliminatenegative effects.
Health InequalitiesHealth inequalities are differences in health status or in thedistribution of health determinants between different populationgroups. Inequality can apply to any variation but inequity is applied tovariations which are deemed to be unjust and preventable; in otherwords it has a moral or ethical dimension. For the purposes of theGradient framework we use the term inequalities and we take it assynonymous with inequity.
Health promotionThe comprehensive social and political process of enabling people toincrease control over and improve their health through actions aimedat strengthening individual awareness and skill; changing individualbehaviour; and changing social, organisational, political, and economicconditions that support good health practices (WHO, 1986).
Healthy public policy Is characterised by an explicit concern for health and equity in all areasof policy, and by an accountability for health impact. The main aim ofhealthy public policy is to create a supportive environment to enablepeople to lead healthy lives. Such a policy makes healthy choicespossible or easier for citizens. It makes social and physicalenvironments health enhancing (WHO, 1998, p.13-14).
Intersectoral collaborationThe factors that influence health inequalities extend far beyond theresponsibilities of the health sector. The intersectoral collaboration is arecognised relationship between part or parts of different sectors ofsociety which has been formed to take action on an issue to achievehealth outcomes or intermediate health outcomes in a way which ismore effective, efficient or sustainable than might be achieved by thehealth sector acting alone (WHO, 1998).
Life-course approachThe life-course approach, also known as a life-course perspective or lifecourse theory, refers to an approach developed for analysing people'slives within structural, social, and cultural contexts. A life course isdefined as ‘a sequence of socially defined events and roles that the
4.2 GLOSSARY84
SECTION
FOU
RRESO
URCES
T a c k l i n g t h e
i n h e a l t hi n h e a l t h
4.2 GLOSSARY
SECTION
FOU
RRESO
URCES
85
T a c k l i n g t h e
i n h e a l t hi n h e a l t h
individual enacts over time’. In particular, the approach focuses on theconnection between individuals and the historical and socioeconomiccontext in which these individuals lived (Mortimer & Shanahan, 2003).
Milestones Key points during the life of a policy action. They are decided at the planning stage and can be time-based or event-based (Swanton, 2008)
MonitoringThe process of continually assessing whether or not particular (policy)actions are achieving or have achieved their objectives. Monitoring isalso used to check whether the processes being used are workingeffectively. Monitoring is carried out throughout the life of a (policy)action, while evaluation is only carried out at specific points in time(Adapted from Swanton, 2008).
Output A piece of work produced for a (policy) action. An output is notnecessarily the final purpose …outputs are usually things that need tobe done in order to produce the desired result. During the life of apolicy action, outputs are monitored to make sure they are beingachieved on time and with the resources available (Adapted fromSwanton, 2008).
OutcomesNutbeam and Bauman (2006) define three levels of outcomes -immediate (short-term) outcomes (e.g. programme impacts),
intermediate outcomes (modifiable determinants of health) anddesired long-term health and social outcomes (reductions inmorbidity, avoidable mortality and disability, improved quality of life,for example).
PolicyA policy can be defined as an agreement or consensus on a range ofissues, goals and objectives which need to be addressed (Ritsatakis,Barnes, Dekker, Harrington, Kokko & Makara, 2000). For example, “SavingLives: Our Healthier Nation” can be seen as a national health policyaimed at improving the health of the population of England, reducinghealth inequalities and setting objectives and targets which can beused to monitor progress towards the policy’s overall goal or aims(WHO, 2011)
Policy actionWe use the term ‘policy action(s)’ to recognise that any policy has tobe operationalised through specific actions which may includeprogrammes, projects, and activities that bring about identifiableoutcomes.
Policy-maker/Decision-makerA person with formal power to influence or determine policies andpractices at European, international, national, regional, or local level. InGEF, we use ‘policy-makers’ as a generic term to refer to both policyformulators or decision makers (e.g. Ministers of Health) and theirpolicy evaluators or senior technical advisors (e.g. civil servants,external experts etc.).
ProgrammeThe term programme usually refers to a group of activities which aredesigned to be implemented in order to reach policy objectives(Ritsatakis et al., 2000). For example, many Single Regeneration Budgetprogrammes and New Deal for Communities initiatives have a rangeof themes within their programmes – often including health,community safety (crime), education, employment and housing – andwithin these themes are a number of specific projects which, together,make up the overall programme (WHO, 2011).
ProjectA project is usually a discrete piece of work addressing a specificpopulation group or health determinant, usually with a pre-set timelimit (WHO, 2011)
Proportionate universalismThe term “progressive (or proportionate) universalism” is based on theprinciple whereby ‘the scale and intensity of provision of universalservices is proportionate to the level of disadvantage’ (Marmot, 2010).Socio-economic advantage is linked to better health across all socialeconomic groups not just a dichotomy between the richest andpoorest. Therefore targeted approaches do not provide the completeanswer. Policy actions must be universal but with a different scale ofintensity to reduce the steepness of the social gradient in health.
Socioeconomic Gradient in Health Refers to the linear or step-wise decrease in health that comes withdecreasing social position (Marmot, 2004). It represents the associationbetween socioeconomic position and health across the wholepopulation. In whatever way health is measured, there tends to be a
4.2 GLOSSARY86
SECTION
FOU
RRESO
URCES
T a c k l i n g t h e
i n h e a l t hi n h e a l t h
gradient on which the most socially and economically advantagedgroup have better health and well-being, and lower rates of illness anddeath than disadvantaged groups. In western societies, the shape ofthe gradient tends to be relatively smooth with mortality andmorbidity increasing, and self-reported health and well-beingdecreasing steadily as social disadvantage increases. Over time, thegradient as a whole tends to shift upwards because overall the healthof most groups is improving. However, the degree and rate ofimprovement tend to be greater in higher social groupings, meaningthat relative differences, and therefore the degree of inequities andinequalities, also tend to increase.
Socio-economic groupA grouping of people with similar values, interests, income, education,and occupations (Mosby's Medical Dictionary 2009).
Socioeconomic Status (SES)Socio-economic status (SES) describes an individual or family’s relativeposition in society. This relative position is operationally defined byindicators such as educational attainment, occupation, income andhouse or car ownership. These variables are therefore considered toprovide a good indication of the likelihood that they will be exposedto health damaging factors or possess particular health enhancingresources. Differences in socioeconomic status reflect differences in:
- Economic resources (income, house holding)
- Psychosocial resources (self-efficacy, social capital)
- Cultural resources (cultural capital, educational differentiation)
- Demographic resources (migration, ethnic groups)
- Geographic resources (district variations, urban and rural areas).
4.2 GLOSSARY
SECTION
FOU
RRESO
URCES
87
T a c k l i n g t h e
i n h e a l t hi n h e a l t h
StrategyThe term strategy usually refers to a series of broad lines of actionintended to achieve a set of goals and targets set out within a policyor programme (Ritsatakis et al., 2000). For example, within the themesof Single Regeneration Budget or New Deal for Communitiesinitiatives it is usual to set out the strategic direction needed to betaken in order to achieve the goals and objectives of each theme, suchas reducing unemployment, improving health or raising educationalattainment (WHO, 2011).
‘Tackling’ or ‘levelling-up’ the Gradient?The term ‘tackling the gradient’ is often used in the academicliterature and in doing so conflates or ‘fudges’ the distinction betweenlevelling-up the gradient and reducing health inequalities (i.e.reducing health gaps and reducing disadvantage). Consequently, weprefer to use term ‘levelling-up’ the gradient rather than ‘tackling’ or‘reducing health inequalities’ in order to be clearer about intention.
Targeted Policy Approach (see also: Universal Policy Approach)The targeted program strategy identifies a target population segmentand monitors the outcomes being attained as the program develops.This strategy is extensively used and may well be aligned with othersocial programs. However, it has limitations, since its beneficiaries are asubgroup accounting for only a small percentage of the populationand its specific problems. In other words, it may not help reduceinequity because it neither integrates action on other structural orintermediary factors nor is it targeted to other social groups (WHO, 2009).
Universal Policy Approach (see also: Targeted Policy Approach)Universal approaches, which produce overall health improvement,involves comprehensive efforts intended to impact on the health ofthe entire population, including groups in different social strata. Someexamples are actions against violence and traffic accidents, theimprovement of work conditions and areas (smoking), or the fight toimprove environmental conditions. In general, universal interventionstend to be both easier to implement and more cost effective thantargeted programs in the long run (WHO, 2009).
4.3 REFERENCES88
SECTION
FOU
RRESO
URCES
T a c k l i n g t h e
i n h e a l t hi n h e a l t h
Amler, B., Betke, D., Eger, H.,Ehrich, C., Hoesle, U., Kohler, A., Kösel, C., Lossau, A., Lutz, W., Müller, U., Schwedersky, T., Seidemann, S., Siebert, M., Trux, A. & Zimmermann, W.(1999) Land use planning methods, strategies and tools. Berlin, GTZ.
Bambra, C., Joyce, K. & Maryon-Davis, A. (2009) Task group on priority publichealth conditions: final report. Submission to the Marmot Review.http://dro.dur.ac.uk/6396/ (accessed 27th October, 2011).
Bauer, G., Davies, J.K., Pelikan, J., Noack, H., Broesskamp, U. & Hill, C. (2003)Advancing a theoretical model for public health and health promotionindicator development, European Journal of Public Health, 13, 107-13.
Bauer, G., Davies, J. K. & Pelikan, J. (2006) The EUHPID health developmentmodel for the classification of public health indicators, Health PromotionInternational, 21 (2), 153-9.
Cameron, J. (2000) A short guide to health impact assessment. London, NHS Executive.
Center for Disease Control [CDC] (1999) Framework for program evaluationin public health. MMWR, 48 (RR-11).
Chen, E. (2004) Why socioeconomic status affects the health of children: a psychosocial perspective, Current Directions in Psychological Science, 13, 112–115.
Chen, E., Martin, A. & Matthews, K. (2006) Socioeconomic status and health: dogradients differ within childhood and adolescence? Social Science & Medicine,62, 2161-2170.
Chen, E., Martin, A. & Matthews, K. (2007) Trajectories of socio-economic statusacross children's lifetime predict health, Pediatrics, 120(2), 297-30.
Crombie I.K., Irvine L., Elliott L., Wallace H. ( 2005) Closing the health inequalitiesgap: an international perspective. Copenhagen. WHO Regional Office forEurope, World Health Organisation.
CSDH (2007) A conceptual framework for action on the social determinants ofhealth. Discussion paper for the Commission on Social Determinants of Health.Geneva, World Health Organisation.
CSDH (2008) Closing the gap in a generation: health equity through action onthe social determinants of health. Final report of the Commission on SocialDeterminants of Health. Geneva, World Health Organisation.
Crombie, I., Irvine, L., Elliott, L. & Wallace, H. (2005) Closing the health inequalitiesgap: an international perspective. Copenhagen, World Health Organisation.
Dahlgren, G. & Whitehead, M (1991) Policies and strategies to promote socialequity in health. Stockholm, Institute for Policy Studies.
Dahlgren, G. & Whitehead, M. (2006) Levelling up part 2: a discussion paper onEuropean strategies for tackling inequalities in health. Copenhagen, WorldHealth Organisation.
Davies, J.K. & Sherriff, N.S. (2011) The gradient in health inequalities amongfamilies and children: a review of evaluation frameworks, Health Policy, 10, 1-10.
Davies, J.K. & Sherriff, N.S. (2012, forthcoming) Evaluating policies: applying thegradient equity lens. In Ieven, A., Barbareschi, G., Costongs, C. & Needle, C.(2012) Levelling the Gradient in Child and Adolescent Health in Europe: Evidence,Policy and Practice. European Commission Publications.
4.3 REFERENCES

4.3 REFERENCES
SECTION
FOU
RRESO
URCES
89
T a c k l i n g t h e
i n h e a l t hi n h e a l t h
Department of Health (UK) (2000) Working in partnership: developing a wholesystems approach: a good practice guide. London, Stationery Office.
Dey, I. (1993)Qualitative data analysis: A user-friendly guide for social scientists.London, Routledge.
Donabedian, A. (1966) Evaluating the quality of medical care, MilbankMemorial Fund Quarterly 44 (1).
Donabedian, A. (1988) The quality of care: how can it be assessed? Journal ofAmerican Medical Association, 260, 1743-1748.
Donabedian, A. (2003) An introduction to quality assurance in health care. NewYork, Oxford University Press.
Dorgelo, A., Spitters, H. & Vervoordeldonk, J. (2011) Success factors and barriersinfluencing the effect of policies on the Health Gradient: the voices of policymakers and policy users.Woerden, NIGZ.
Douglas, M., Thomson, H., Jepson, R., Higgins, M., Muirie, J. & Gorman, D. (Eds.)(2007) Health impact assessment of transport initiatives: a guide. Edinburgh,NHS Scotland.
European Commission (2009) Solidarity in health: reducing health inequalitiesin the EU. Brussels, Commission of European Communities.
European Observatory on Health Systems & Policies.www.euro.who.int/en/home/projects/observatory (Accessed 27th October,2011).
European Union Statistics on Income and Living Conditions (EU-SILC),http://epp.eurostat.ec.europa.eu/portal/page/portal/microdata/eu_silc(Accessed 27th October, 2011).
Graham, H. (2001) Understanding health inequalities. Buckingham, OpenUniversity Press.
Graham, H. (2004) Tackling inequalities in health in England: remedyinghealth disadvantages, narrowing health gaps or reducing health gradients?Journal of Social Policy, 33 (1), 115-131.
Graham, H. & Kelly, M. (2004) Health inequalities: concepts, frameworks andpolicy. Briefing paper. London, Health Development Agency.
Graham, H. & Power, C. (2004) Childhood disadvantage and adult health: alifecourse framework. London, Health Development Agency.
Health Behaviour and Schoolchildren Survey (HBSC).www.hbsc.org/overview.html (Accessed 27th October, 2011).
Heckman, J.J. (2006) Skill formation and the economics of investing indisadvantaged children, Science, 312 (5782), 1900-02.
Hertzman, C., Siddiqi, A., Hertzma, E., Irwin, L., Vaghri, Z., Houweling, T., Bell, R.,Tinajero, A. & Marmot, M. (2010) Bucking the inequality gradient through earlychild development, British Medical Journal, 340, c468.
House of Commons Select Committee (HCSC) (2009) Health inequalities: 3rdreport of session 2008-09 vol 1. London, The Stationery Office.
Irwin, A., Valentine, N., Brown, C., Loewenson, R., Solar, O., Brown, H., Koller, T. &Vega, J. (2006) The Commission on Social Determinants of Health: tacklingthe social roots of health inequities, PLoS Medicine 3(6), e106.Judd, C. M. & McClelland, G. H. (1989) Data analysis: A model-comparisonapproach. San Diego, CA, Harcourt Brace Jovanovich.
4.3 REFERENCES90
SECTION
FOU
RRESO
URCES
T a c k l i n g t h e
i n h e a l t hi n h e a l t h
Judge, K., Platt, S., Costongs, C. & Jurczak, K. (2006) Tackling health inequalities: achallenge for Europe. London, Department of Health.
Labonte, R. (1993) Health promotion and empowerment: practice frameworks,University of Toronto, ParticipACTION.
Lalonde, M. (1974) A new perspective on the health of Canadians. Ottawa,Government of Canada.
Leviton, L. (2010) Let’s practice better evaluation, Journal of Public Health, 32(8), 8-9.
Mackenbach, J. (2006) Health inequalities: Europe in profile. An independentexpert report commissioned by the UK Presidency of the EU. Rotterdam.Department of Public Health, University Medical Centre Rotterdam.
Mackenbach, J., Stirbu, I., Roskam, A., Schaap, M., Menvielle, G., Leinsalu, M. &Kunst A. (2007) Socio-economic inequalities in mortality and morbidity: a cross-European perspective tackling health inequalities in Europe: an integratedapproach. Eurothine final report. Rotterdam, Department of Public Health,University Medical Centre Rotterdam.
Marmot, M (2004) The status syndrome: how social standing affects our healthand longevity. London, Bloomsbury.
Marmot Review (2010) Fair society, healthy lives: strategic review of healthinequalities in England post 2010. London, The Marmot Review.
Mason, J. (2002) Qualitative Researching. London, Sage. McCoy, D. (2003) Global equity gauge alliance: reflections on earlyexperiences. Journal of Health Population & Nutrition, 21 (3), 273-87.
Metcalfe, O., Higgins, C. & Lavin, T. (2009) Health impact assessment: guidance.Ireland, Institute of Public Health in Ireland.
Miles, M. B. & Huberman, A. M. (1994). Qualitative data analysis. (2nd Ed.).California, Sage Publications.
Miller, R. L. & Brewer, J. D. (Eds.) (2003) The A-Z of Social Research. London, SagePublications.
Ministry of Health and Social Policy of Spain (2010) Moving forward equity inhealth: monitoring social determinants and the reduction of health inequalities.Madrid, Ministry of Health & Social Policy.
Mortimer, J.T. & Shanahan, M.J. (2003) (Eds.) Handbook of the life course. NewYork, Kluwer Academic Publishers.
Mosby's Medical Dictionary (2009), 8th Edition. New York. Elsevier.
Norwegian Directorate for Health and Social Affairs (2005) The Challenge ofthe Gradient. Oslo, NDHSA.
Norwegian Ministry of Health and Care Services (2007) National strategy toreduce social inequalities in health. Report No 20 (2006-2007) to the Storting.Oslo, Helsedirektoratet.
Norwegian Directorate of Health (2009) Annual report on measures to reducesocial inequalities in health. Norwegian public health policy report 2009. Oslo,Helsedirektoratet.
Nutbeam, D (1999) The challenge of providing ‘evidence’ in healthpromotion. Health Promotion International, 14(2), 99-101.
4.3 REFERENCES
SECTION
FOU
RRESO
URCES
91
T a c k l i n g t h e
i n h e a l t hi n h e a l t h
Nutbeam, D. & Bauman A. (2006) Evaluation in a nutshell: a practical guide tothe evaluation of health promotion programmes. Sydney, McGraw-Hill.
Office for Social Inclusion (2009) National action plan for social inclusion 2007-2016 annual report. Dublin, Department of Social and Family Affairs.
Oliver, S., Kavanagh, J., Caird, J., Lorenc, T., Oliver, K., Harden, A., Thomas, J.,Greaves, A. & Oakley, A. (2008) Health promotion, inequalities and youngpeople’s health: a systematic review of research. London, EPPI-Centre, SocialScience Research Unit, Institute of Education, University of London.
Pawson, R. & Tilley, N. (1997) Realistic Evaluation. London, Sage.
Pan American Health Organization (PAHO) (2004) Epidemiological bulletin, 25(4)Washington, PAHO. www.paho.org/english/dd/ais/EB_v25n4.pdf(Accessed 27th October, 2011).
Poulton, R., Caspi, A., Milne, B.J., Murray Thomson, W., Taylor, A., Sears, M.R. &Moffitt, T.E. (2002) Association between children’s experience ofsocioeconomic disadvantage and adult health: a life-course study, The Lancet,360 (9346), 1640-145.
Power, C. & Kuh, D. (2006) Life course development of unequal health. In:Siegrist, J., and Marmot, M. (Eds) Social inequalities in health: new evidence andpolicy implications. New York, Oxford University Press, 27–54.
PHAC (2004). Program evaluation tool kit. Ottawa, Public Health Agency ofCanada, www.phac-aspc.gc.ca/php-psp/toolkit-eng.php (Accessed 27thOctober, 2011).
Ritsatakis, A., Barnes, R., Dekker, E., Harrington, P., Kokko, S. & Makara, P. (2000)Exploring Policy Developments in Europe. Copenhagen, World HealthOrganisation.
Scott, C. & Gall, N. (2006) Knowledge Use in the Calgary Health Region: a Scan ofInitiatives That Support Use of Evidence in Practice. Calgary (Alberta), CalgaryHealth Region.
Scottish Government (2008) Equally well: report of the ministerial task force onhealth inequalities - Volume 2. Edinburgh, The Scottish Government.
Scottish Government (2009) Long-term monitoring of health inequalities.Edinburgh, The Scottish Government.
Signal, L., Martin, J., Cram, F. & Robson, B. (2008) The health equity assessmenttool: A user’s guide. Wellington, Ministry of Health (New Zealand).
Silverman, D. (2001) Interpreting qualitative data: Methods for analysing talk,text, and interaction. (2nd Ed.). London, Sage.
Strand, M., Brown, C., Torgersen, T. & Giaever, O. (2009) Setting the politicalagenda to tackle health inequity in Norway. Copenhagen, World HealthOrganisation.
Stronks, K (2002) Generating evidence on interventions to reduceinequalities in health: the Dutch case. Scandinavian Journal of Public Health,30; 20-25.
Swanton, K. (2008) Healthy weight healthy lives: a toolkit for developing localstrategies. London, National Health Forum.
Themessl-Huber, M., Lazenbatt, A. & Taylor, J. (2008) Overcoming healthinequalities: a participative evaluation framework fit for the task. Journal of theRoyal Society for the Promotion of Health, 128(3):117-22.
4.3 REFERENCES92
SECTION
FOU
RRESO
URCES
T a c k l i n g t h e
i n h e a l t hi n h e a l t h
Torgersen, T., Giaever, O. & Stigen, O. (2007) Developing an intersectoral nationalstrategy to reduce social inequalities in health: the Norwegian case.Copenhagen, WHO.
UNICEF Multiple Indicator Cluster Surveys,www.unicef.org/statistics/index_24302.html, (Accessed 27th October, 2011).
Whitehead, M. & Dahlgren, G. (2006) Levelling-up (part 1) a discussion paper onconcepts and principles for tackling social inequities in health. Copenhagen,World Health Organisation.
WHO (1986) The Ottawa charter for health promotion. Geneva, World HealthOrganisation.
WHO (1998) Health promotion glossary. Geneva, World Health Organisation.
WHO (2005) European strategy for child and adolescent health anddevelopment. Copenhagen, World Health Organisation.
WHO (2008) Closing the gap in a generation: health equity thought action onthe social determinants of health. Geneva, World Health Organisation.
WHO (2009) A snapshot of the health of young people in Europe: a reportprepared for the European Commission conference on youth health, Brussels,Belgium, 9-10 July. Copenhagen, World Health Organisation.
WHO/UCL (2010) Interim 1st report on social determinants of health and thehealth divide in the WHO European region. Copenhagen/London, World HealthOrganisation/University College London.
WHO (2011) Health impact assessment: glossary of terms used,www.who.int/hia/about/glos/en/index1.html, (Accessed 27th October, 2011).
Wilkinson, R. & Pickett, K. (2009) The spirit level: why equality is better foreveryone. London, Penguin Books.

SECTION
FOU
RRESO
URCES
93
T a c k l i n g t h e
i n h e a l t hi n h e a l t h
NOTES

94
SECTION
FOU
RRESO
URCES
T a c k l i n g t h e
i n h e a l t hi n h e a l t h
NOTES

SECTION
FOU
RRESO
URCES
95
T a c k l i n g t h e
i n h e a l t hi n h e a l t h
NOTES

96
SECTION
FOU
RRESO
URCES
T a c k l i n g t h e
i n h e a l t hi n h e a l t h
NOTES


T a c k l i n g t h e
i n h e a l t hi n h e a l t hFor more information visit: www.health-gradient.eu
Project CoordinatorWork Package Two Partners