Embed Size (px)
Citation preview
STUDY OF SEVERE MALNUTRITION IN
PRESCHOOL CHILDREN OF MELGHAT(A tribal block of Villages in Maharashtra, India)
By
Shirishkumar V. Naidu1 Dr. Shaila Gajbhiye2
Dr Meena Shriniwas Shelgaonkar3
1MSc Clinical Research, ICRI Mumbai 2Ex- Dean ICRI Mumbai
3(Clinical Pharmacologist Central India Institute of Medical Sciences, Bajaj Nagar Nagpur-10),
Director Phytabolites Neutraceuticals Pvt Ltd Nasik, Ex Associate Prof ICRI Mumbai,
Executive committee Member , Amhi Amchya Arogyasathi , Kurkheda Gadchiroli
+91 9527411453
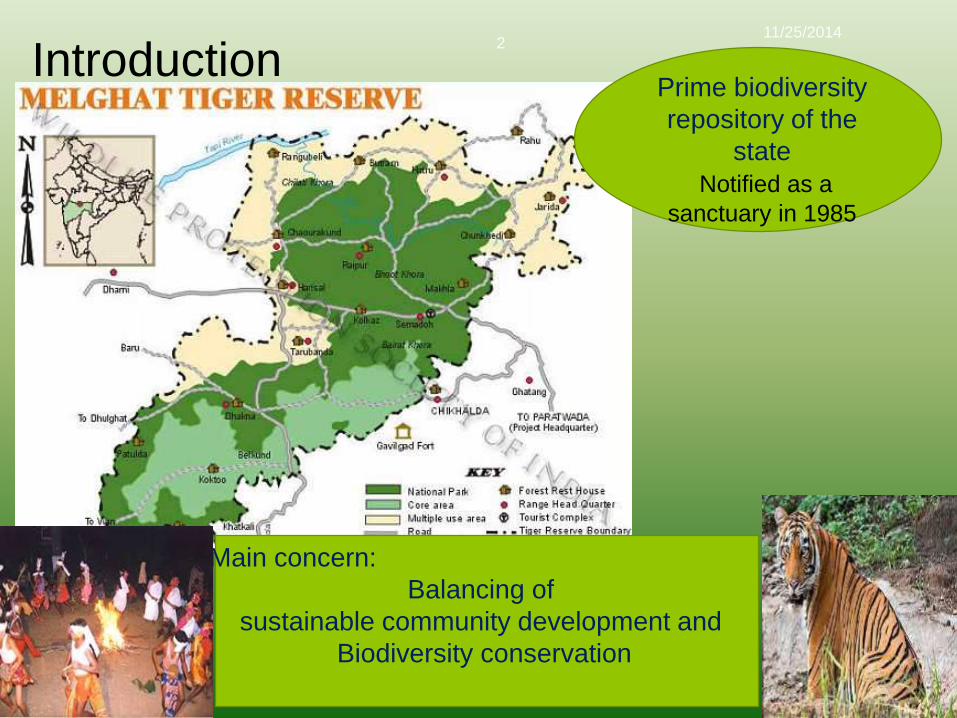
Introduction 11/25/2014
Dr Meena S Shelgaonkar
2
Main concern:
Balancing of
sustainable community development and
Biodiversity conservation
Prime biodiversity
repository of the
state
Notified as a
sanctuary in 1985
11/25/20143
Dr Meena S Shelgaonkar
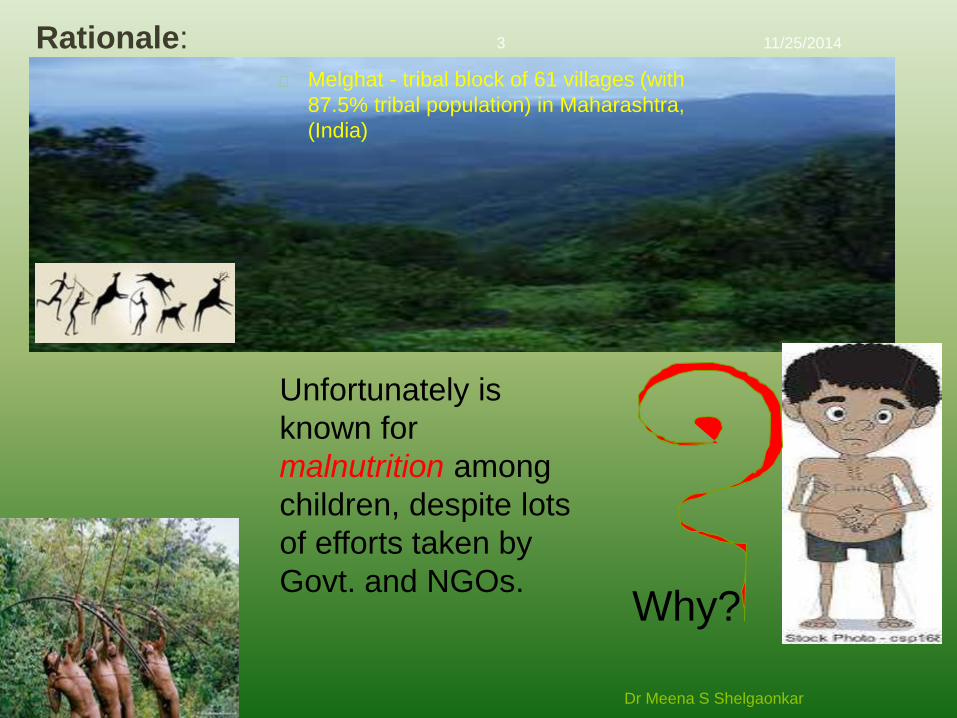
Rationale:
Melghat - tribal block of 61 villages (with
87.5% tribal population) in Maharashtra,
(India)
Unfortunately is
known for
malnutrition among
children, despite lots
of efforts taken by
Govt. and NGOs.Why?
11/25/20144
Dr Meena S Shelgaonkar
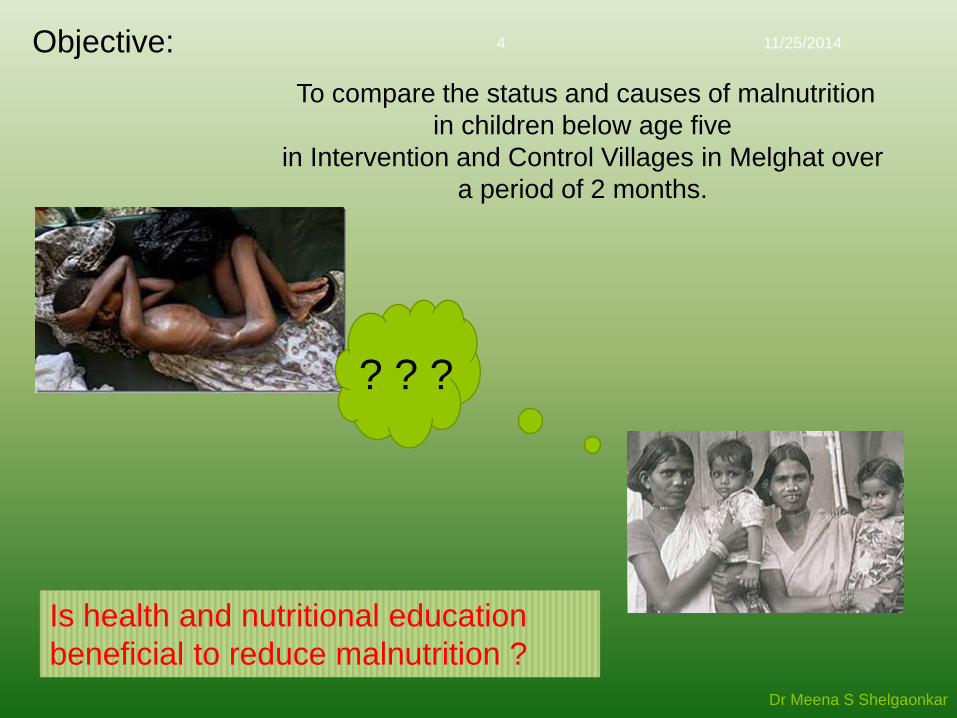
Objective:
Is health and nutritional education
beneficial to reduce malnutrition ?
To compare the status and causes of malnutrition
in children below age five
in Intervention and Control Villages in Melghat over
a period of 2 months.
? ? ?
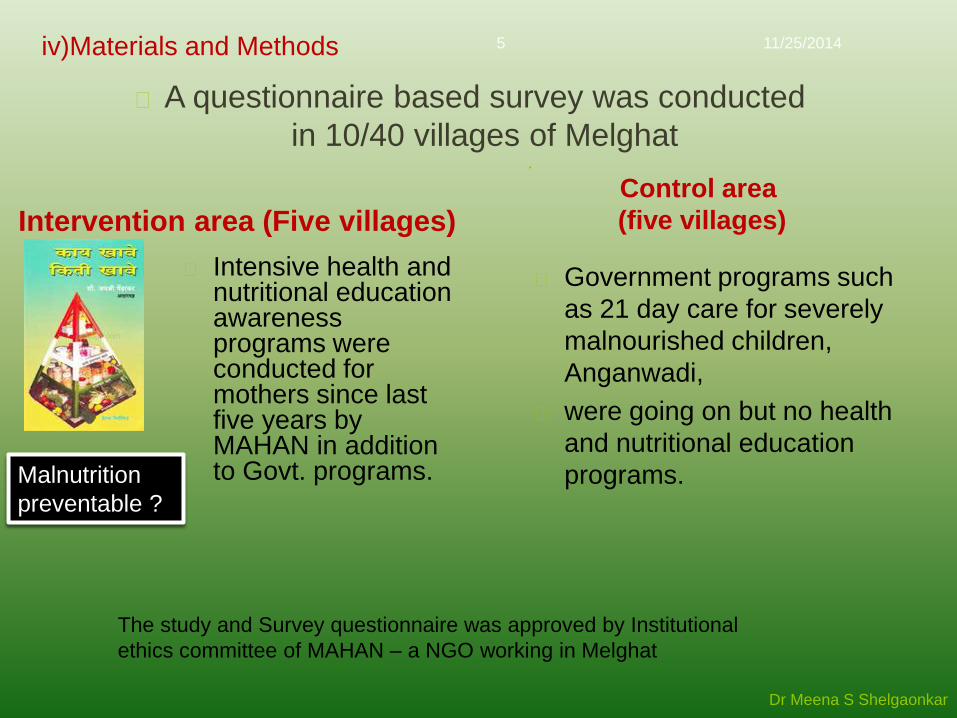
iv)Materials and Methods
Intervention area (Five villages)
Intensive health and nutritional education awareness programs were conducted for mothers since last five years by MAHAN in addition to Govt. programs.
.
Control area
(five villages)
Government programs such
as 21 day care for severely
malnourished children,
Anganwadi,
were going on but no health
and nutritional education
programs.
11/25/2014
Dr Meena S Shelgaonkar
5
A questionnaire based survey was conducted
in 10/40 villages of Melghat
The study and Survey questionnaire was approved by Institutional
ethics committee of MAHAN – a NGO working in Melghat
Malnutrition
preventable ?

Inclusion criteria
Children of both sexes in the
age group of 0-5 years
Children residing in selected
villages only.
Exclusion criteria
Children of both sexes above 5
years of age
Children not residing in
selected area
11/25/2014
Dr Meena S Shelgaonkar
6
Intervention area
+
Control Area
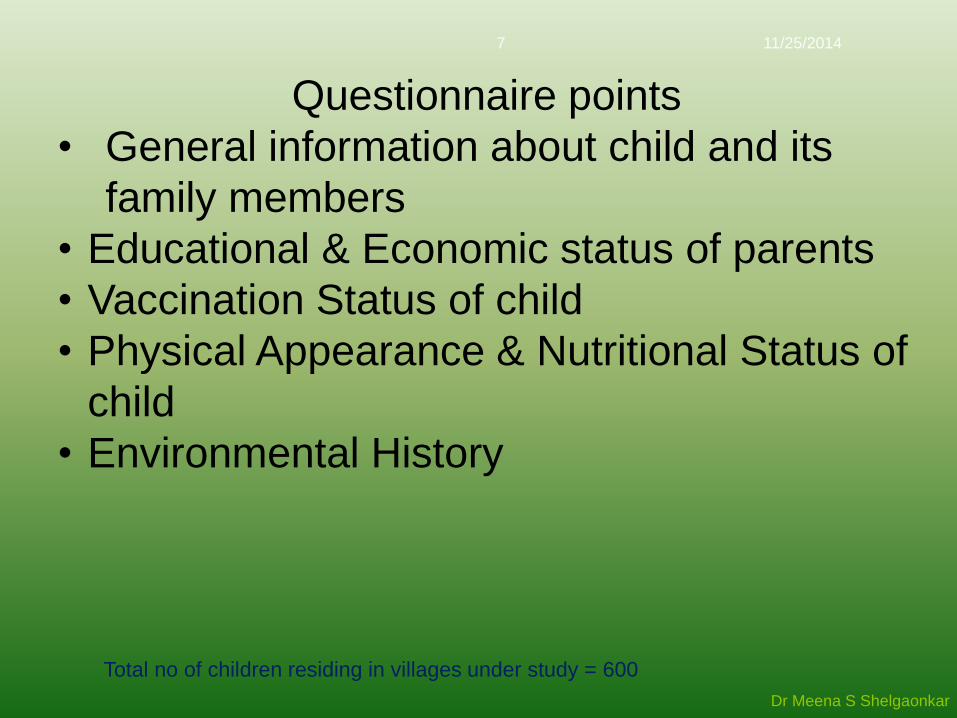
Total no of children residing in villages under study = 600
11/25/2014
Dr Meena S Shelgaonkar
7
Questionnaire points
• General information about child and its
family members
• Educational & Economic status of parents
• Vaccination Status of child
• Physical Appearance & Nutritional Status of
child
• Environmental History
Result
s11/25/2014
Dr Meena S Shelgaonkar
8
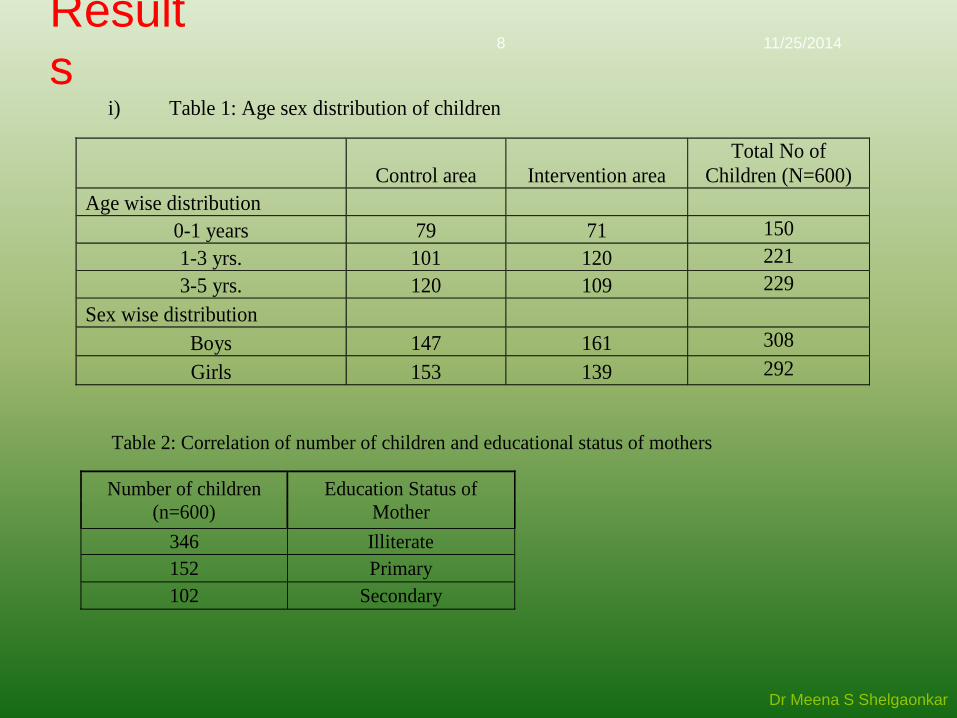
i) Table 1: Age sex distribution of children
Control area Intervention area
Total No of
Children (N=600)
Age wise distribution
0-1 years 79 71 150
1-3 yrs. 101 120 221
3-5 yrs. 120 109 229
Sex wise distribution
Boys 147 161 308
Girls 153 139 292
Table 2: Correlation of number of children and educational status of mothers
Number of children
(n=600)
Education Status of
Mother
346 Illiterate
152 Primary
102 Secondary
11/25/2014
Dr Meena S Shelgaonkar
9
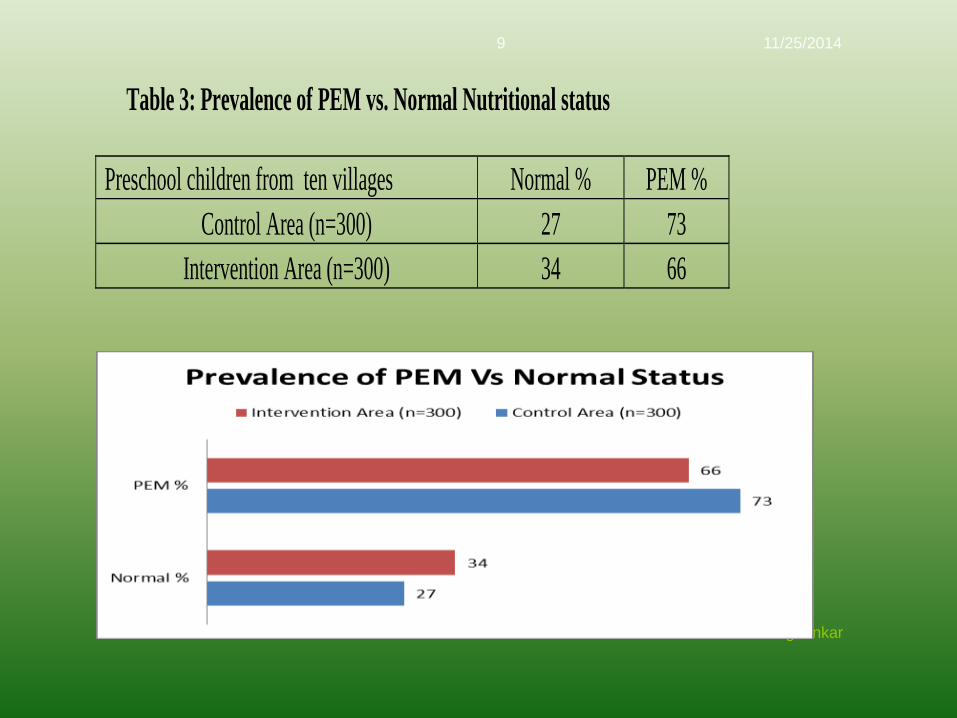
Table 3: Prevalence of PEM vs. Normal Nutritional status
Preschool children from ten villages Normal % PEM %
Control Area (n=300) 27 73
Intervention Area (n=300) 34 66
11/25/2014
Dr Meena S Shelgaonkar
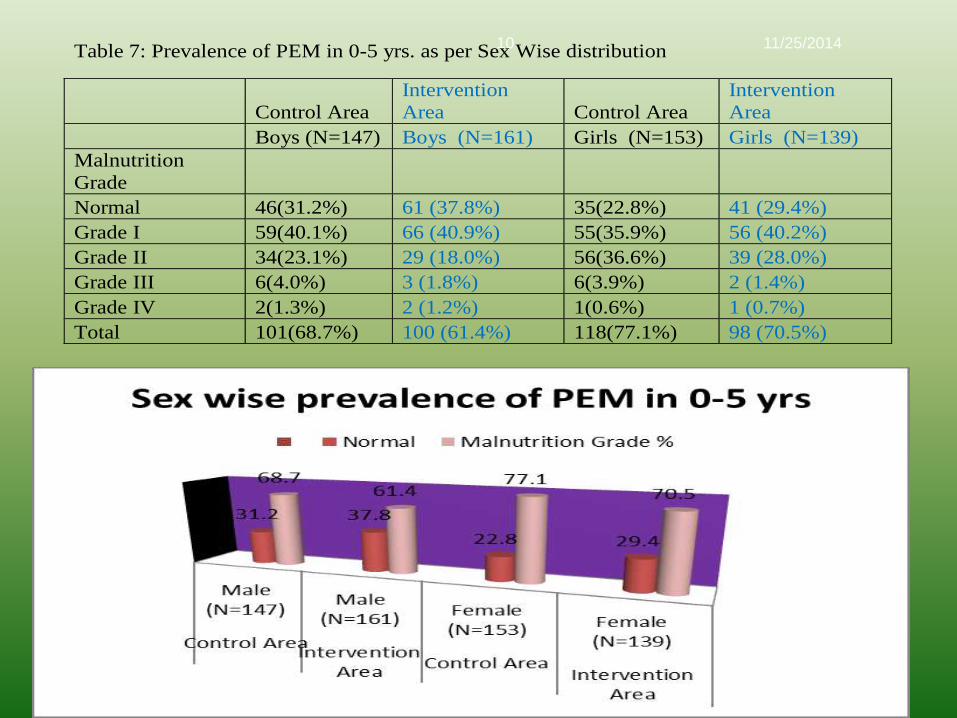
10Table 7: Prevalence of PEM in 0-5 yrs. as per Sex Wise distribution
Control Area
Intervention
Area Control Area
Intervention
Area
Boys (N=147) Boys (N=161) Girls (N=153) Girls (N=139)
Malnutrition
Grade
Normal 46(31.2%) 61 (37.8%) 35(22.8%) 41 (29.4%)
Grade I 59(40.1%) 66 (40.9%) 55(35.9%) 56 (40.2%)
Grade II 34(23.1%) 29 (18.0%) 56(36.6%) 39 (28.0%)
Grade III 6(4.0%) 3 (1.8%) 6(3.9%) 2 (1.4%)
Grade IV 2(1.3%) 2 (1.2%) 1(0.6%) 1 (0.7%)
Total 101(68.7%) 100 (61.4%) 118(77.1%) 98 (70.5%)
11/25/2014
Dr Meena S Shelgaonkar
11
0
10
20
30
40
50
60
70
0-1 yrs (n=79) 1-3 Yrs(n=101)
3-5 yrs(n=120)
0-1 yrs (n=71) 1-3 Yrs(n=120)
3-5 yrs(n=109)
Control Area (n=300) Intervention Area (n=300)
Prevalence of PEM in 0-5 yrs children
Normal
Grade I
Grade II
Grade III
Grade IV
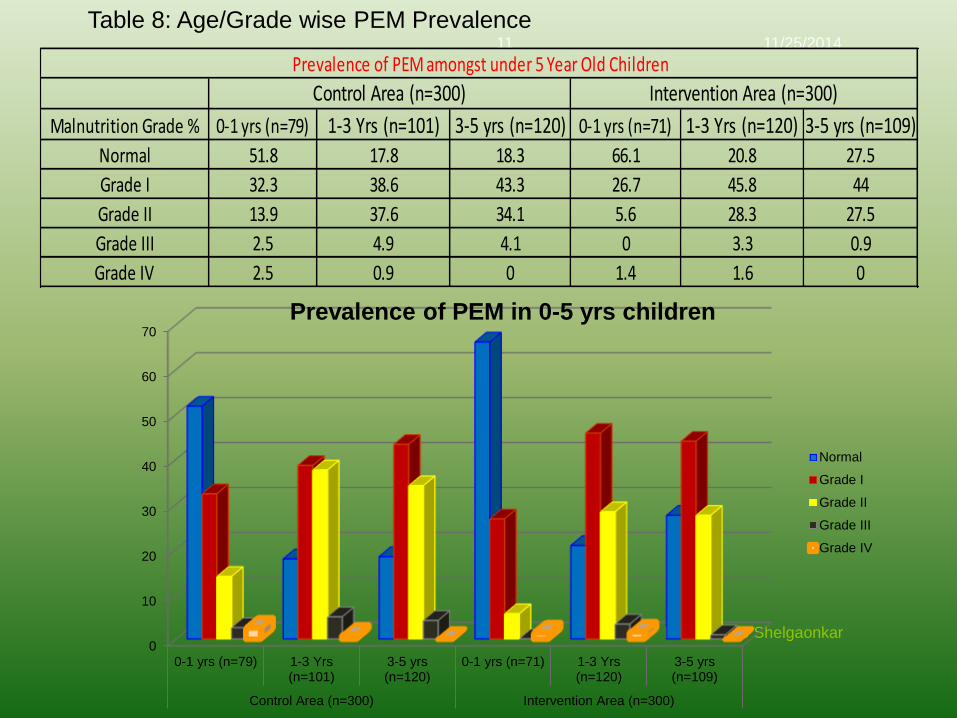
Malnutrition Grade % 0-1 yrs (n=79) 1-3 Yrs (n=101) 3-5 yrs (n=120) 0-1 yrs (n=71) 1-3 Yrs (n=120) 3-5 yrs (n=109)
Normal 51.8 17.8 18.3 66.1 20.8 27.5
Grade I 32.3 38.6 43.3 26.7 45.8 44
Grade II 13.9 37.6 34.1 5.6 28.3 27.5
Grade III 2.5 4.9 4.1 0 3.3 0.9
Grade IV 2.5 0.9 0 1.4 1.6 0
Control Area (n=300) Intervention Area (n=300)
Prevalence of PEM amongst under 5 Year Old Children
Table 8: Age/Grade wise PEM Prevalence
11/25/2014
Dr Meena S Shelgaonkar
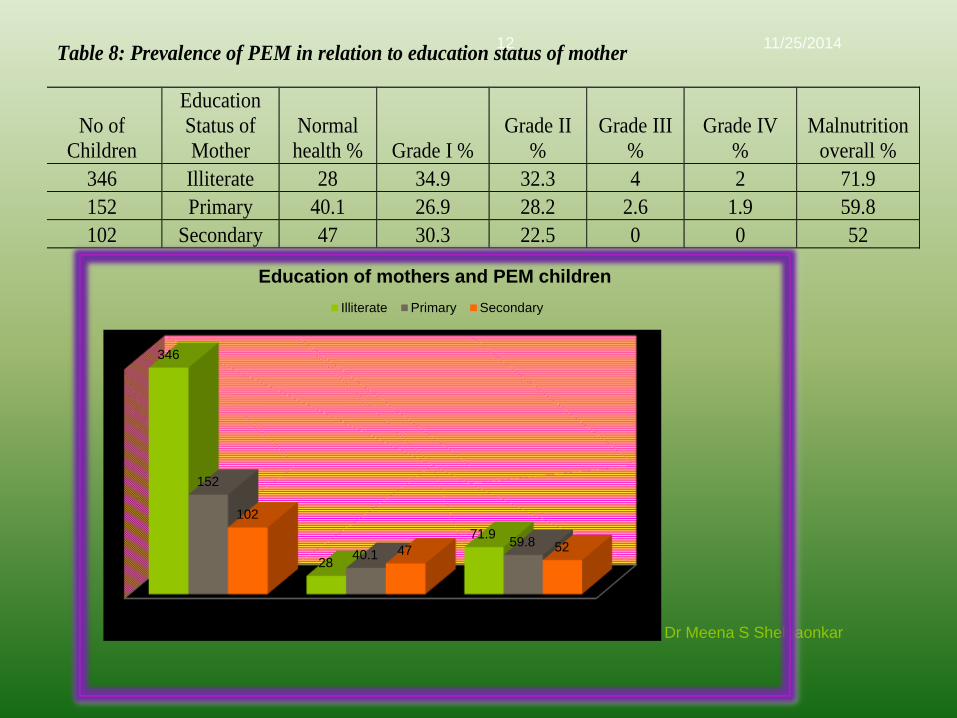
12Table 8: Prevalence of PEM in relation to education status of mother
No of
Children
Education
Status of
Mother
Normal
health % Grade I %
Grade II
%
Grade III
%
Grade IV
%
Malnutrition
overall %
346 Illiterate 28 34.9 32.3 4 2 71.9
152 Primary 40.1 26.9 28.2 2.6 1.9 59.8
102 Secondary 47 30.3 22.5 0 0 52
No of Children Normal healthy children%
children with PEM %
346
28
71.9
152
40.159.8
102
47 52
Education of mothers and PEM children
Illiterate Primary Secondary

11/25/2014
Dr Meena S Shelgaonkar
13
Discussion and conclusion:
Prevalence of malnutrition among the children under five years of age was
higher in Control villages (73.0 %) as compared to those in Intervention
villages (66.0 %).
The percentage of children under the normal Grade were higher in
Intervention villages (34.0 %) as compared to that of Control villages (27.0
%).
Children who are severely malnourished i.e. of Grade III the children under
Intervention villages showed less percentage (1.3 %) as compared to those
of children under Control villages (4.0 %).
This was basically due to lack of health and nutritional education practices in
control villages.
Malnutrition is preventable once it is known that it is due to lack of proper
diet.
More the education less is malnutrition.

Thank you very much
11/25/2014
Dr Meena S Shelgaonkar
14
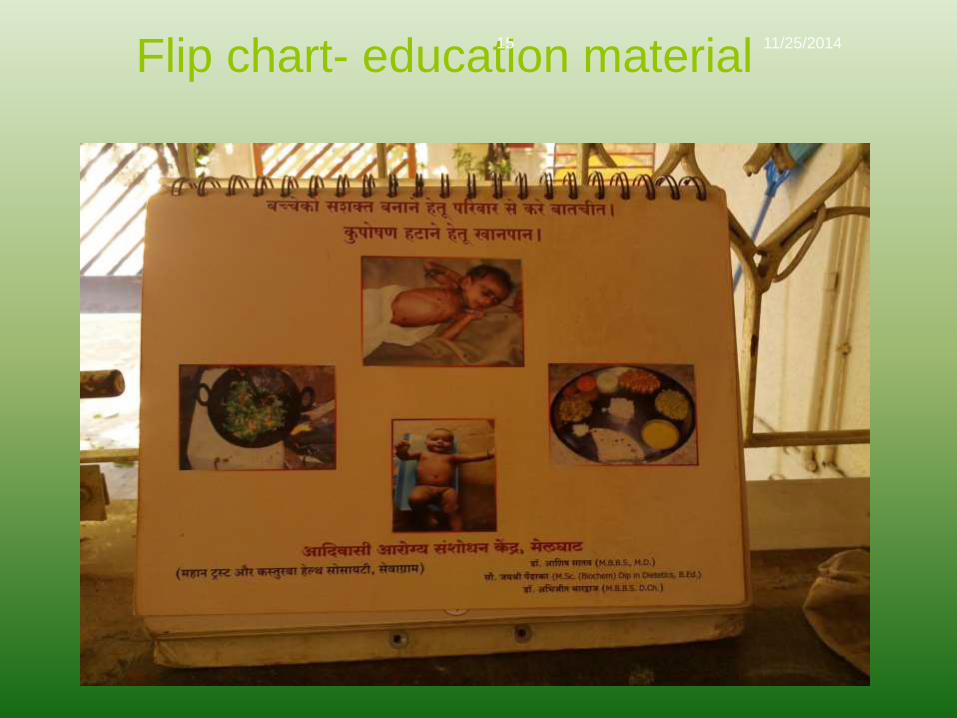
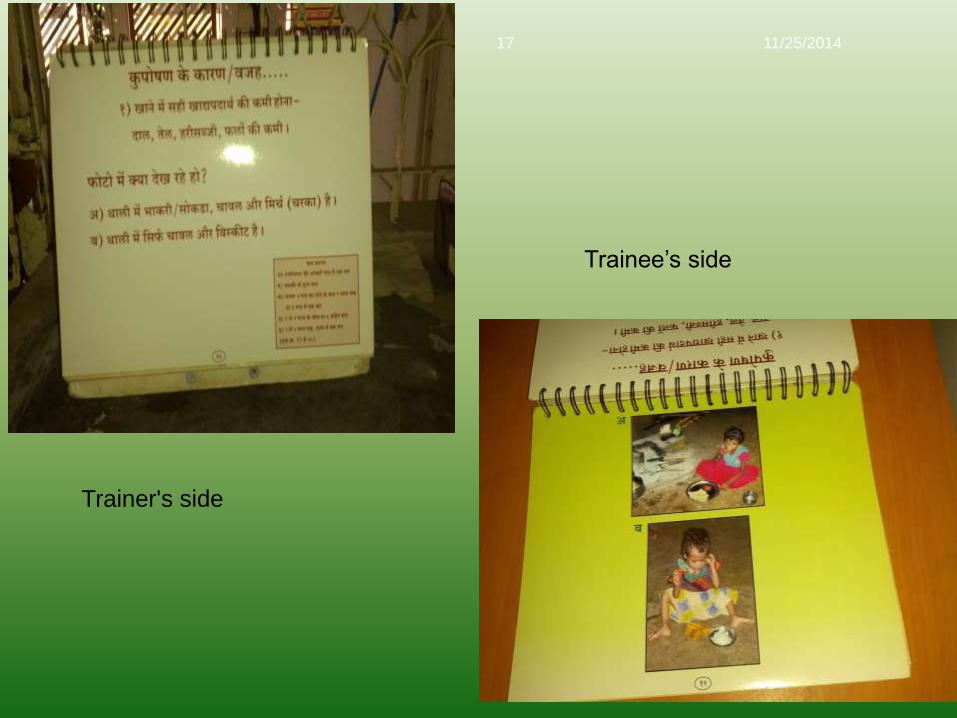
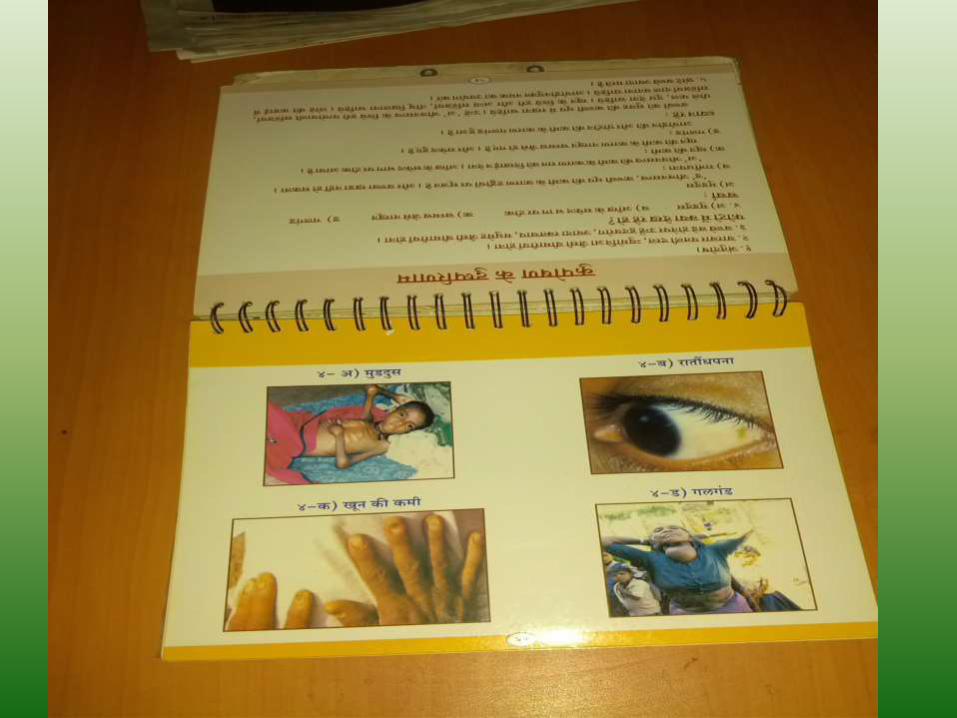
Flip chart- education material 11/25/2014
Dr Meena S Shelgaonkar
15

11/25/2014
Dr Meena S Shelgaonkar
16
11/25/2014
Dr Meena S Shelgaonkar
17
Trainer's side
Trainee’s side
11/25/2014
Dr Meena S Shelgaonkar
18

![Dietary Diversity as a Component of Food Security among ... · 8/3/2020 · malnutrition [8],[9]. Preschool children are particularly vulnerable under general conditions of poverty](https://img.pdfslide.us/doc/110x75/6076252b37b16306d705cfe2/dietary-diversity-as-a-component-of-food-security-among-832020-malnutrition.jpg)