Embed Size (px)
Citation preview

Cross-boundary, Cross-
sector – using simulation
Claire Cordeaux: Executive Director, Healthcare

SIMUL8 Corporation | SIMUL8.com | [email protected]
Agenda
• Healthcare policy agenda
• How simulation can help:• Prevention
• Screening for Hepatitis C
• Long Term Conditions
• Year of Care
• Schizophrenia
• Emergency Care Flow
• Community Services
• Questions
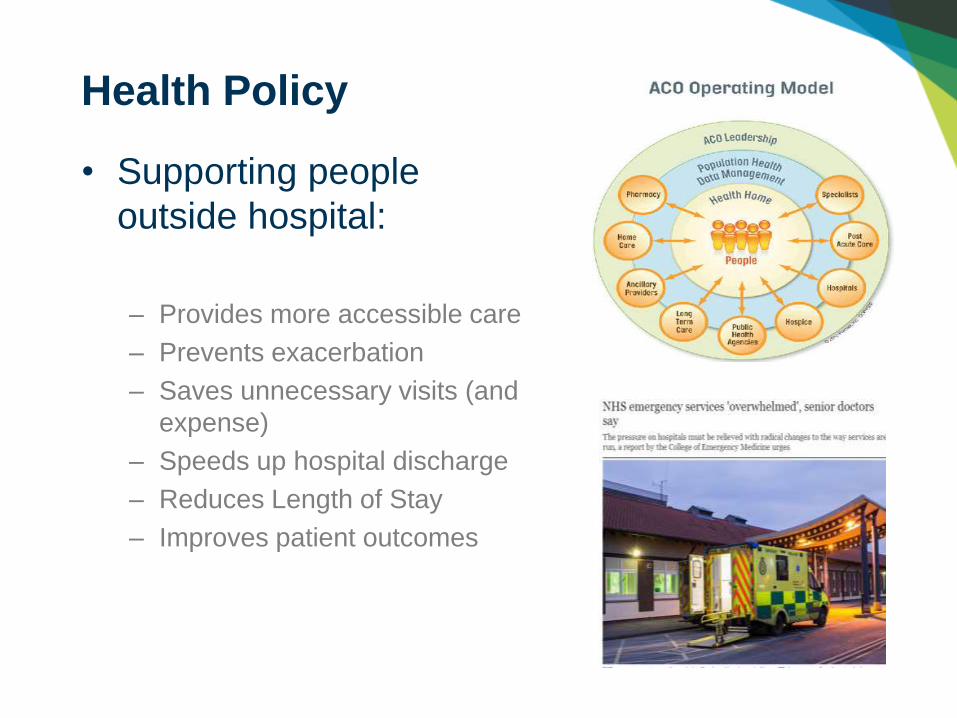
• Supporting people
outside hospital:
– Provides more accessible care
– Prevents exacerbation
– Saves unnecessary visits (and
expense)
– Speeds up hospital discharge
– Reduces Length of Stay
– Improves patient outcomes
Health Policy

Health Policy

SIMUL8 Corporation | SIMUL8.com | [email protected]
• International studies
• But what does that mean for us?
• Hospital at home
• Intermediate care
• Early discharge
• Admission avoidance
• Transfer of care
• Telemedicine
The Evidence
SIMUL8 Corporation | SIMUL8.com | [email protected]
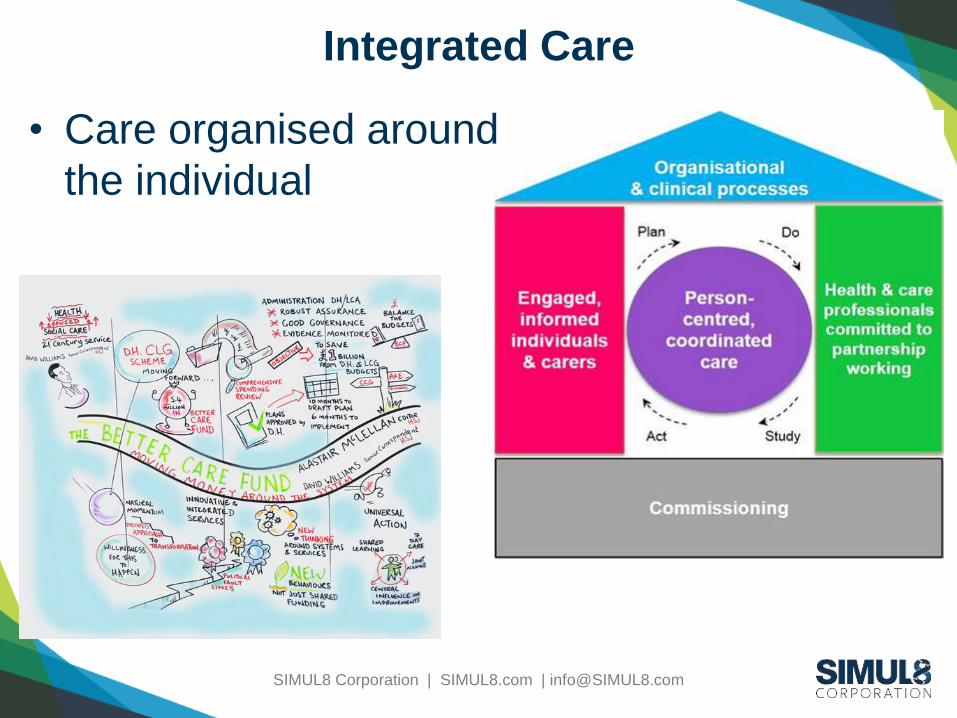
Integrated Care
• Care organised around
the individual

SIMUL8 Corporation | SIMUL8.com | [email protected]
Why simulation?
• A service and system redesign
• Understanding the impact of changing service
utilization on:
– Flow
– Cost
– Capacity/Resource
• No historic data
• Different impacts on organizations, costs and
patients

SIMUL8 Corporation | SIMUL8.com | [email protected]
Health and Care System Flow
Lack of capacity?
Rural/urban
population?
Lack of access? Vulnerable
groups?
Not 24/7?

Click to edit Master title styleClick to edit Master title style
SIMUL8 Corporation | SIMUL8.com | [email protected]
SIMULATION APPROACH:
PREVENTION

SIMUL8 Corporation | SIMUL8.com | [email protected]
Case Study 1: Hepatitis C Screening –
preventing liver disease
• Impact of future demand if a new Hep C
service is delivered locally, increasing
patient attendance:– on future burden of disease
– projected treatment costs for the service

SIMUL8 Corporation | SIMUL8.com | [email protected]
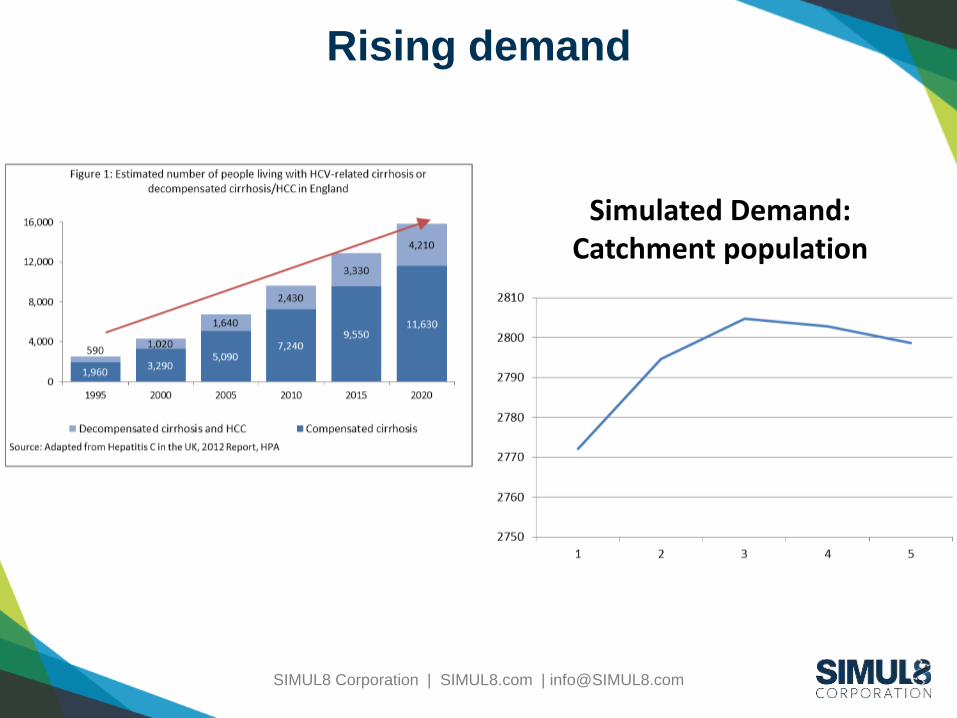
Simulating demand
Age-banded population projections
Age-banded disease
prevalenceDemand
749,805 X Hep C 0.45% = 2771(2.5% diagnosed, 55% not Genotype 1)
SIMUL8 Corporation | SIMUL8.com | [email protected]
Rising demand
Simulated Demand: Catchment population

SIMUL8 Corporation | SIMUL8.com | [email protected]
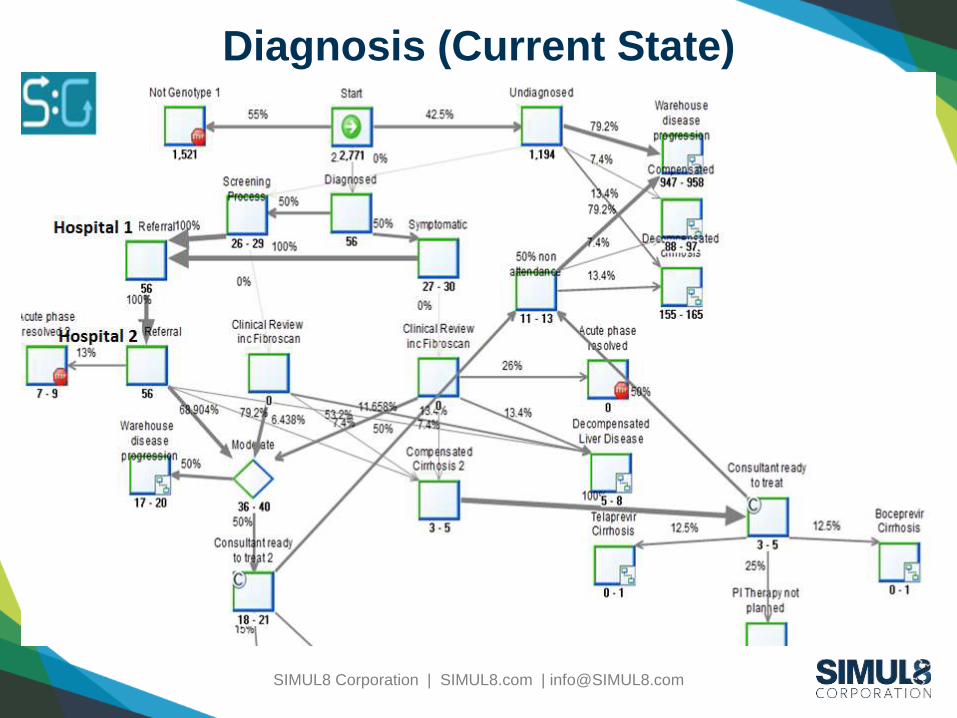
Burden of Disease
All patients undiagnosed or not cured go to
“warehouse” where disease progresses with
an annual cost

SIMUL8 Corporation | SIMUL8.com | [email protected]
Costs
Step Unit CostInitial screening 6.3Further Screening 42.83Nurse Consultation 25 20Genotype test 52.61FBC 3 2.66HCVRNA and FBC 16.34HCVRNA 13.68
Consultant at initial treatment and 6 months SVR 55.98Warehouse disease progression p.a. 882Compensated Cirrhosis p.a. 1400Decompensated cirrhosis p.a. 11,218Carcinoma p.a. 9,996

SIMUL8 Corporation | SIMUL8.com | [email protected]
Validation
Activity Data Source ScenarioGenerator result
Confirmed cases 56 Annual Hep Report 2012 p46
56
Commencing treatment
42 Annual Hep Report 2012 p44
42 (moderateand compensated cirrhosis)

SIMUL8 Corporation | SIMUL8.com | [email protected]
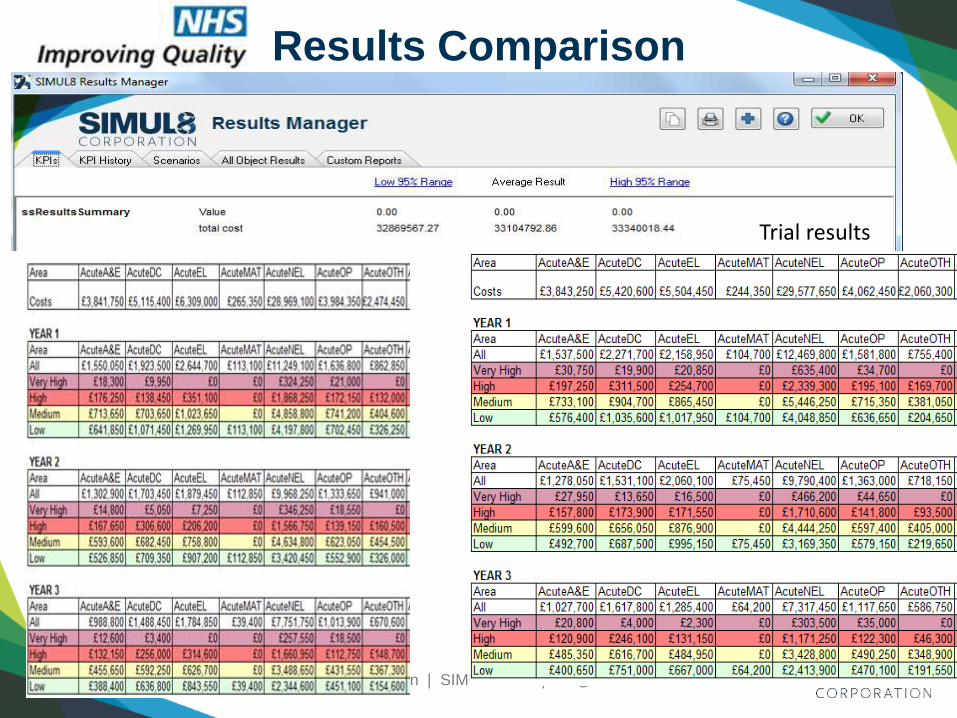
Treated as current vs Treated in local
hospital– cost over 5 years
• Assumed 50% of currently treated patients
do not attend after initial appointment
• Costs reduce with increased diagnosis
• Costs include annual inflation

SIMUL8 Corporation | SIMUL8.com | [email protected]
Patients cured and cost – 5 yearsBy:
• current state
• future state
• increasing diagnosis by 5%, 10% and 20%
Patients Cured by ScenarioIncreased diagnosis = increased patients cured
Cost per patient cured - decreases with increasing diagnosis
SIMUL8 Corporation | SIMUL8.com | [email protected]
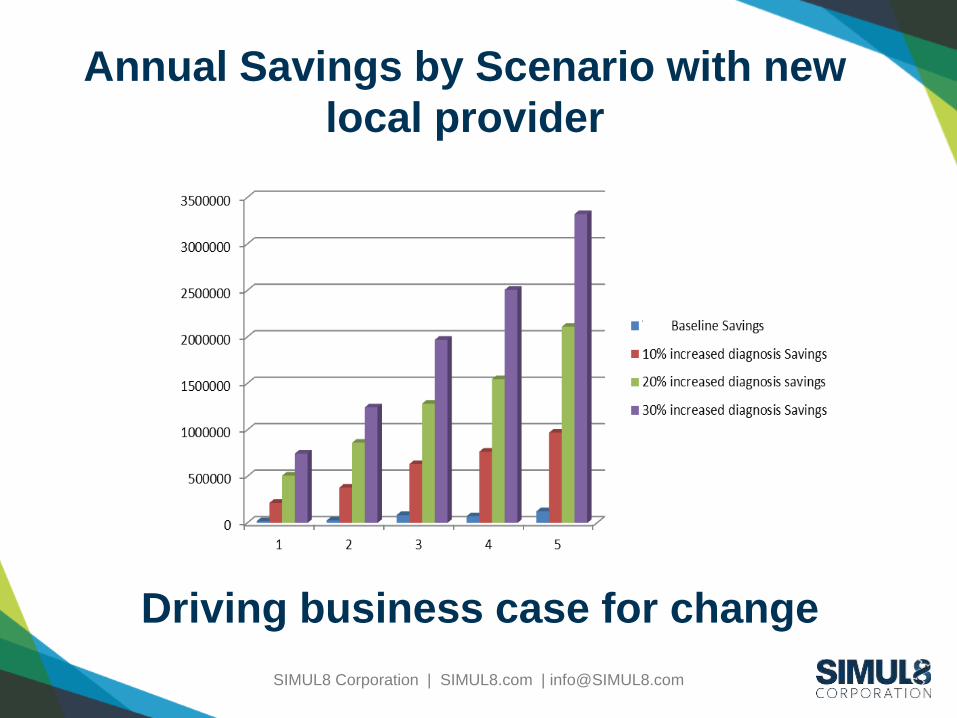
Annual Savings by Scenario with new
local provider
Driving business case for change

Click to edit Master title styleClick to edit Master title style
SIMUL8 Corporation | SIMUL8.com | [email protected]
SIMULATION APPROACH:
SEGMENTING POPULATIONS

SIMUL8 Corporation | SIMUL8.com | [email protected]
Case Study 2: Long Term Conditions Year of
Care
Using risk stratification to identify and manage
patients with multiple conditions and test:
• What if they are proactively managed or
unmanaged?
• What if we applied an annual tariff?

SIMUL8 Corporation | SIMUL8.com | [email protected]
Starting to simulate a new approach
Services “consumed”
Assessment of Need
Patients at Risk
Exacerbation

SIMUL8 Corporation | SIMUL8.com | [email protected]
• No real correlation between risk score and level of need
But…
Assessment of Need
Patients at Risk

Click to edit Master title styleClick to edit Master title style
SIMUL8 Corporation | SIMUL8.com | [email protected]
WHAT THE DATA IS
TELLING US
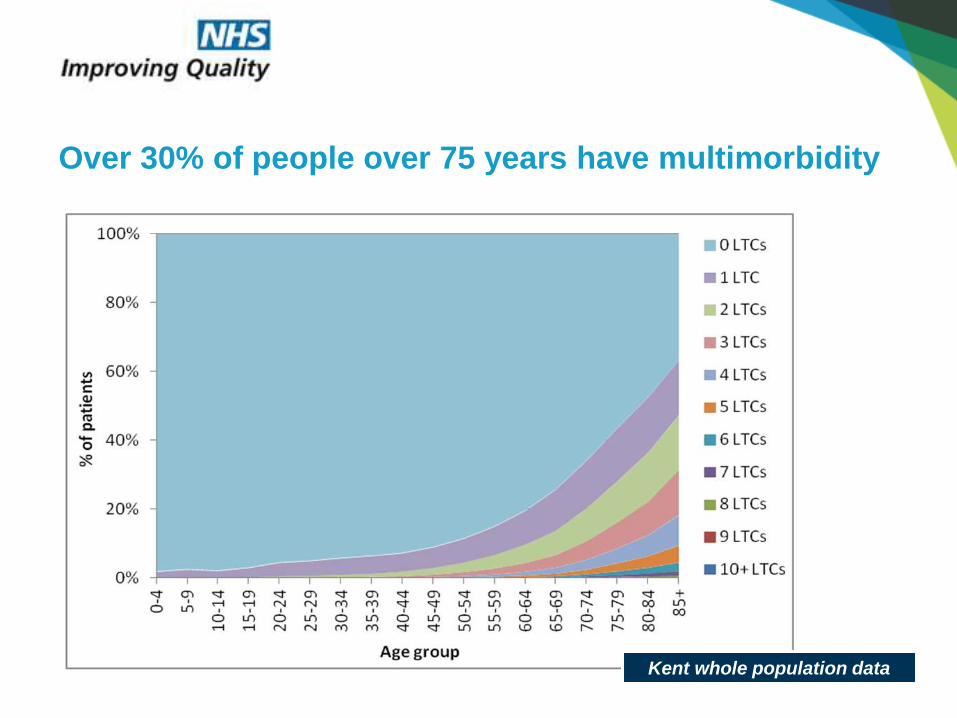
Kent whole population data
Over 30% of people over 75 years have multimorbidity

Multimorbidity is more common than single morbidity
Kent whole population data

The total health and social care cost is strongly related
to multimorbidity
Kent whole population data

The main contributors to total health & social care cost
are acute non-elective admissions
Kent whole population data

People with complex health & social care needs appear
to demonstrate a ‘crisis curve’
Kent whole population data
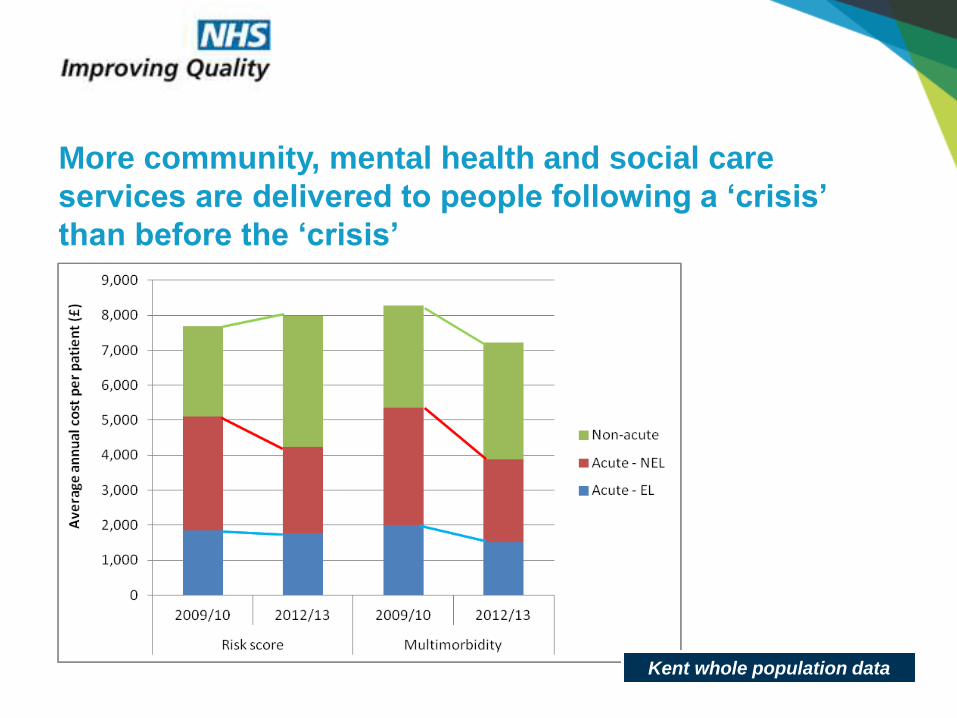
More community, mental health and social care
services are delivered to people following a ‘crisis’
than before the ‘crisis’
Kent whole population data

Some indications that an integrated care plan changes
the pattern of services delivered to people
BHR Costing Data

• Use local
data to test
assumptions
• Ability to
update and
review
Simulation
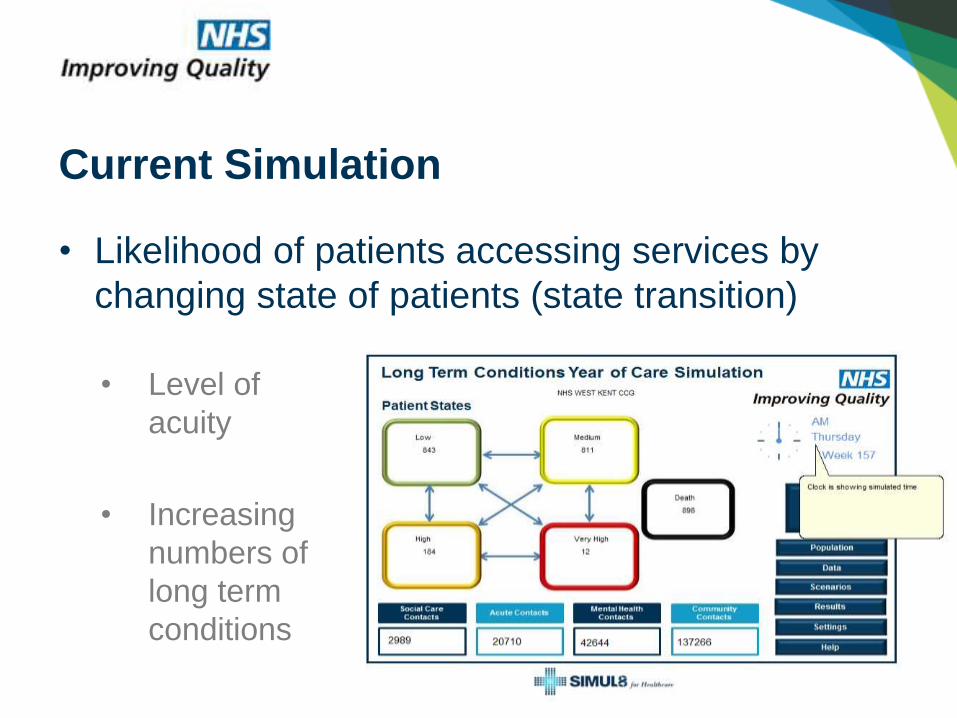
• Level of
acuity
• Increasing
numbers of
long term
conditions
Current Simulation
• Likelihood of patients accessing services by
changing state of patients (state transition)
SIMUL8 Corporation | SIMUL8.com | [email protected]
• Patients in each “state” have
– A likelihood of accessing certain types of service
(Acute, Community, Mental Health, Social Care),
including accessing services more than once
• Costs associated with those services
How it works
SIMUL8 Corporation | SIMUL8.com | [email protected]
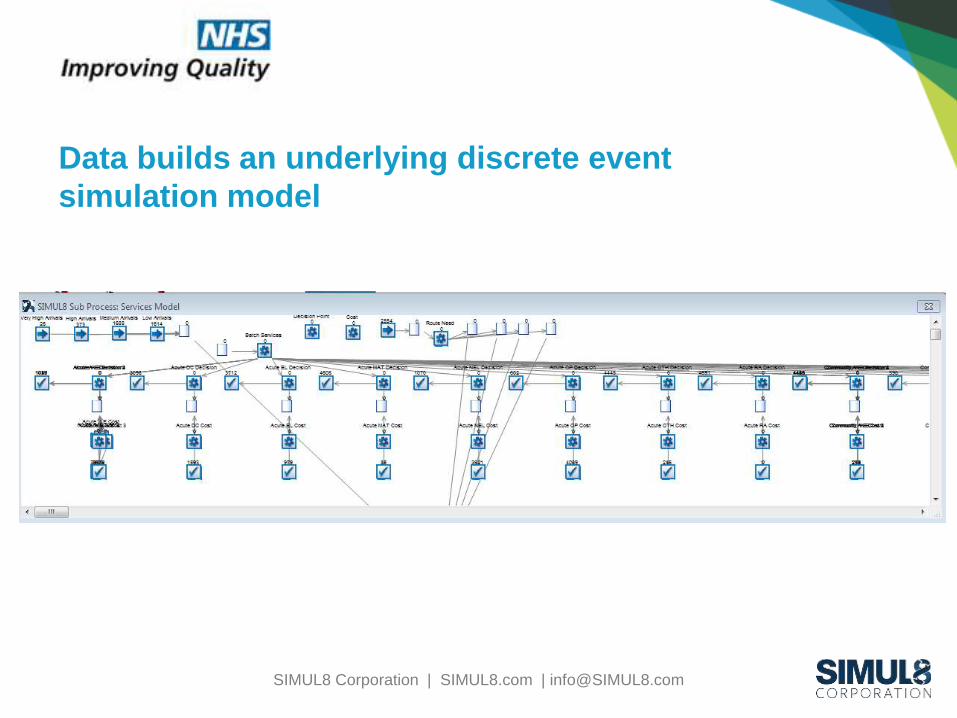
Data builds an underlying discrete event
simulation model
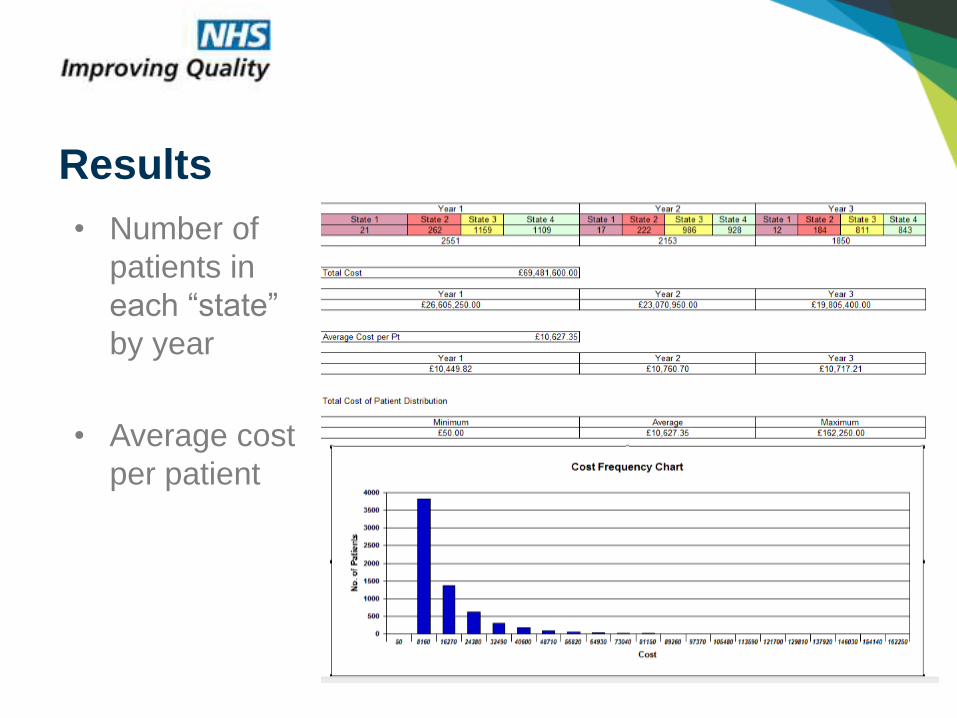
• Number of
patients in
each “state”
by year
• Average cost
per patient
Results

• Cost by each area of service/organisation
Results

• Costs by state per year
• Average cost per patient
• Comparison with tariff
Results

SIMUL8 Corporation | SIMUL8.com | [email protected]
• Known to integrated care team or not?
• Test against proposed tariff?
• Change variation in cost for services?
• Decrease transitions through states?
Scenarios

SIMUL8 Corporation | SIMUL8.com | [email protected]
• Planning for demand
• Testing an improvement scenario
• Negotiation between healthcare providers
How is this helping?
SIMUL8 Corporation | SIMUL8.com | [email protected]
Purpose of simulation
• To reduce pressure on acute mental health
services
• Test the impact of additional referrals to
– Early intervention services
– Rehabilitation
On costs and resource utilization
SIMUL8 Corporation | SIMUL8.com | [email protected]
Feedback from Janssen partners:
“encouraging”
• Trusts are interested and want to put their
own data in the model
• Generating engagement and discussion in
change
• Testing service redesign – business case
for change without jeopardising patient
• Efficient way of looking at the numbers
• Cost savings

Click to edit Master title styleClick to edit Master title style
SIMUL8 Corporation | SIMUL8.com | [email protected]
SIMULATION APPROACH: WHOLE
SYSTEM FLOW
SIMUL8 Corporation | SIMUL8.com | [email protected]
Case Study 4: Improving the emergency
care flow North Staffordshire
• Impact of increasing out of hospital services on
cost and capacity

SIMUL8 Corporation | SIMUL8.com | [email protected]
• What does current unscheduled care flow
look like?
• What will it look like in 5 years taking into
account population change?
• What is the impact of increasing referrals to
domiciliary care direct from hospital?
Initially to answer following questions
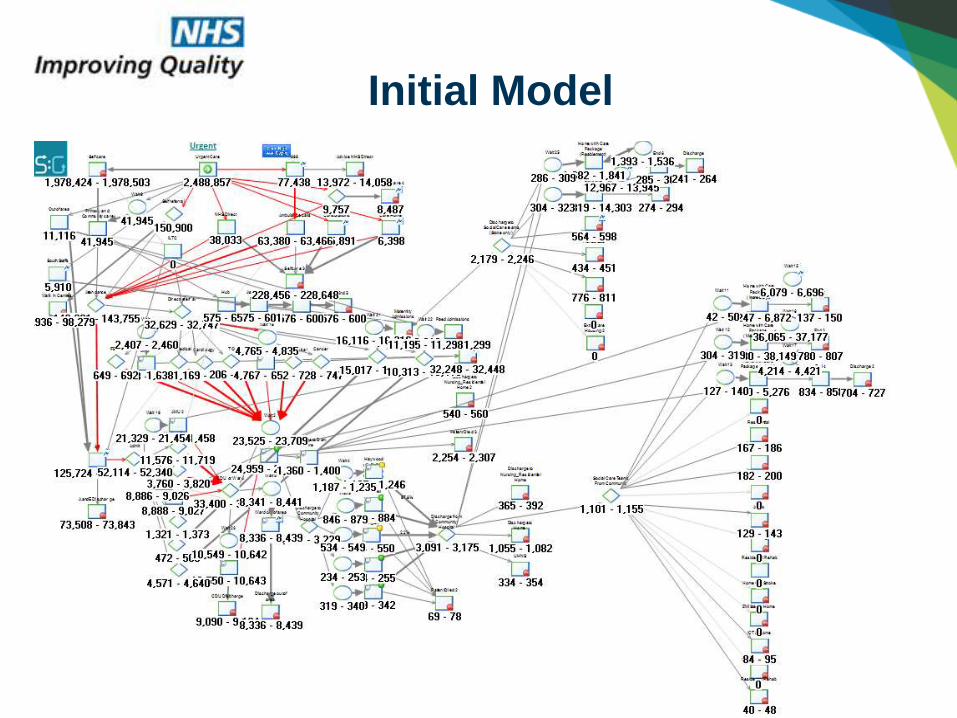
Initial Model

Area NHS data
Scenario Generator
%
A+E 108,472125,302 (17,026 out-of-area)A&E out of area (5% S Staffs) 17,000
0.99864512
Total NEL Admissions 84,297 84,4701.00205227
Elective admissions 12,674 12,7101.00284046
Daycase 49,983 49,8950.9982394
Discharges to CommunityHospital
4560 4507
0.98837719
Discharge to social care teams (Stoke)
2183 2203
1.0091617
Discharges from Community Hospital
4347 4430
1.01909363
Intermediate Care (admission avoidance)
590 581
0.98474576
• Ran the model
through with
the received
population
data
• Set routing
percentages
so model
matches
activity data.
Baseline Results – 10 run trial

Item £ LOS
Hospital Bed £500 a day AMU/SAU/CDUInpatient
CommunityHospital Bed
£263 per day 21 days
Intermediate care £47 per hour 30 hours
A&E £105.5
Cost and Length of Stay Assumptions

SIMUL8 Corporation | SIMUL8.com | [email protected]
With population increase
In 5 years
+ £11.3m (£1m domiciliary care)
(1% annual inflation)
Increase in A&E and
admissions over 9 years

SIMUL8 Corporation | SIMUL8.com | [email protected]
Potential Domiciliary Care Scenario
• Average 6 week package for rehabilitation
• Other packages average 48 weeks
Scenario:
• Increase direct referrals from hospital – 30% of community
hospital referrals
• Average 2 additional days in hospital
• Referrals 10% to complex, 38% maintenance, 51% re-ablement

SIMUL8 Corporation | SIMUL8.com | [email protected]
Cost per hour
Hours pw (normal)
LOSwks
Capacity (hrs pw)
Packagespw
Discharges to reablement from community 2.50% £20.98 11 6 1400 127
Discharges to reablement from acute 10.10% £20.98 11 6 1400 127
Discharges to maintenance care from community 4.50% £13.20 7 48 4100 586
Discharges to maintenance care from acute 7.60% £13.20 7 48 4100 586Discharge from reablement to maintenance 15% £13.20 7 48 4100 586
Discharge to complex £13.20 22 48 4100 186
All discharges from acute (stoke) 2183
All discharges from community (stoke) 876
Domiciliary Care Assumptions

• £2.6m savings overall
– Plus £4m social care
– Plus 1.3m additional LOS, max bed occupancy +
10, +1% utilization
– £7.6m savings community hospital, utilisation
reduced by 25%, max bed occupancy minus 90
Domiciliary care scenario results

SIMUL8 Corporation | SIMUL8.com | [email protected]
Impacts
• Understanding the financial impacts
• Allows negotiation across providers and
between payers and providers

SIMUL8 Corporation | SIMUL8.com | [email protected]
So let’s imagine…
• We have prevented disease
• We are managing long term conditions
effectively in the community
• Hospital admissions are reduced
• But how are community services coping?

Click to edit Master title styleClick to edit Master title style
SIMUL8 Corporation | SIMUL8.com | [email protected]
SIMULATION APPROACH:
OPERATIONAL IMPACT ON SERVICES

SIMUL8 Corporation | SIMUL8.com | [email protected]
• What is the impact of improvement interventions
on a community team workload?
• For example: what is the impact of faster healing
wounds on workload (60%)?
– More time to care?
– More time to see other patients?
• Engaging with community team – what are the
pain points?
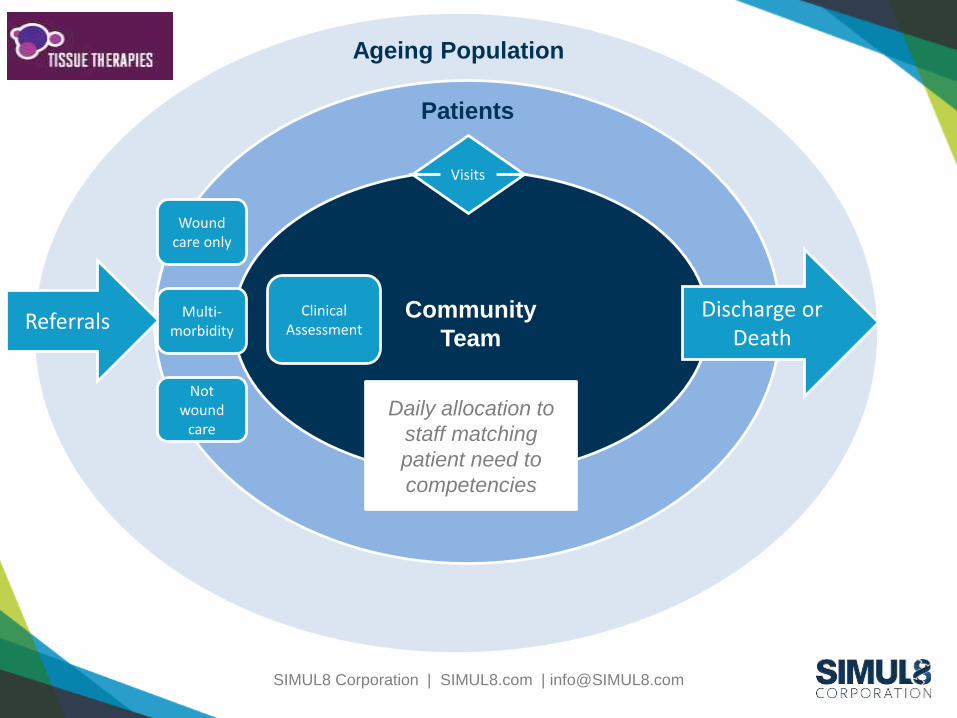
Case Study 5 - Impact on Community team
capacity
SIMUL8 Corporation | SIMUL8.com | [email protected]
Community
Team
Patients
Daily allocation to
staff matching
patient need to
competencies
Referrals
Visits
Discharge or Death
Ageing Population
Clinical Assessment
Wound care only
Multi-morbidity
Not wound
care

SIMUL8 Corporation | SIMUL8.com | [email protected]

SIMUL8 Corporation | SIMUL8.com | [email protected]
Localising and testing improvements on
capacity and patient throughput.
• Change referrals, patient
types and priority
• Change visit times and
frequency
• Include travel times
• Test impact of
improvements by
condition on capacity and
patient wait times

SIMUL8 Corporation | SIMUL8.com | [email protected]
Final Thoughts
• Simulation supporting understanding of the
health and social care system
• Evidence:– To support cross-border/cross-sector dialogue
– To better understand the impact of change
– To inform financial and operational decision-making
Helping to define and solve problems

Click to edit Master title styleClick to edit Master title style
SIMUL8 Corporation | SIMUL8.com | [email protected]
QUESTIONS?