Embed Size (px)
Citation preview
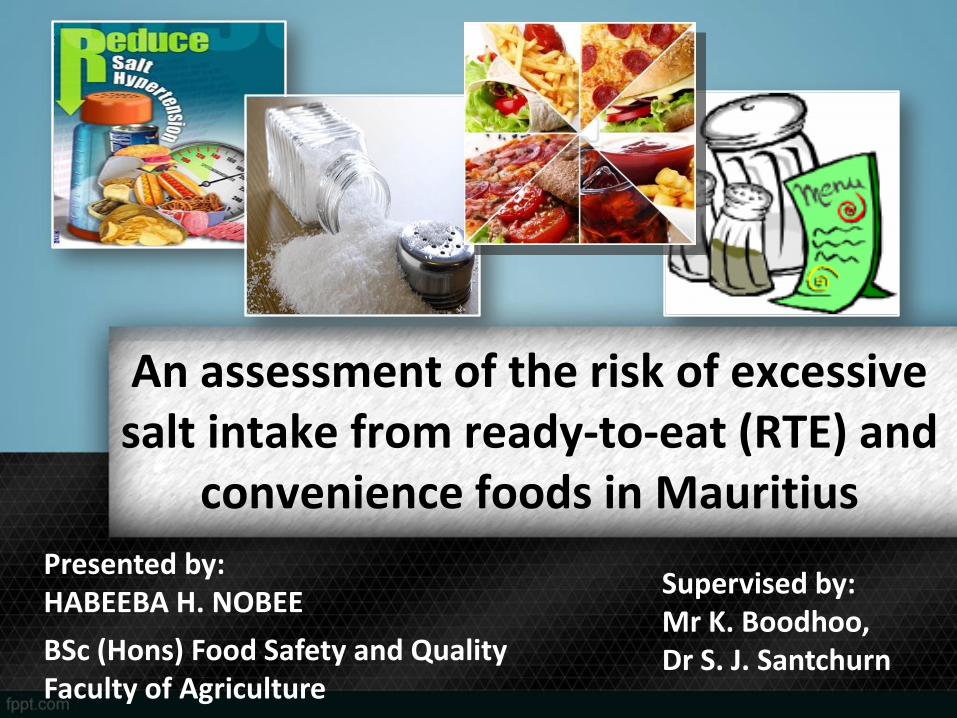
An assessment of the risk of excessive salt intake from ready-to-eat (RTE) and
convenience foods in Mauritius
Presented by:HABEEBA H. NOBEE
BSc (Hons) Food Safety and QualityFaculty of Agriculture
Supervised by:Mr K. Boodhoo,Dr S. J. Santchurn
Description of research problem (I)
In Mauritius, dietary salt intake > 5g and 6g.
Mean salt intake of Mauritian adults (30-59 years): 7.9g per day
[Men: 8.5g/day; Women: 7.4g/day] (MoHQL, 2009)
83.2 % of Mauritian adults (30-59 years) consume 5g or more of salt daily (MoHQL, 2012).
Recommended salt intake:WHO guideline: 5g salt per day (< 2g sodium per day)
Mauritian guideline: 6g salt per day (≈ 1 tsp salt or 2.36g sodium per day)
Table salt or sodium chloride is the primary source of sodium in the diet (Taormina, 2010).
Shortage of sodium is unlikely.
Excessive intake of sodium is more common.
(WHO, 2012; MoHQL, 2002)
2
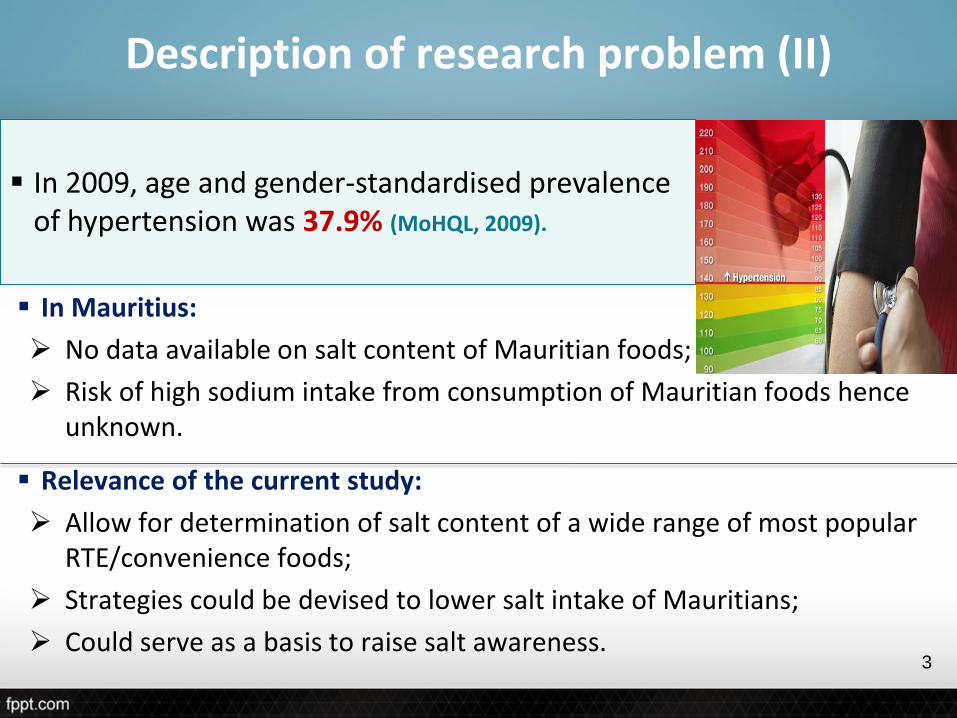
Description of research problem (II)
In 2009, age and gender-standardised prevalence of hypertension was 37.9% (MoHQL, 2009).
In Mauritius:
No data available on salt content of Mauritian foods;
Risk of high sodium intake from consumption of Mauritian foods hence unknown.
Relevance of the current study:
Allow for determination of salt content of a wide range of most popular RTE/convenience foods;
Strategies could be devised to lower salt intake of Mauritians;
Could serve as a basis to raise salt awareness.3
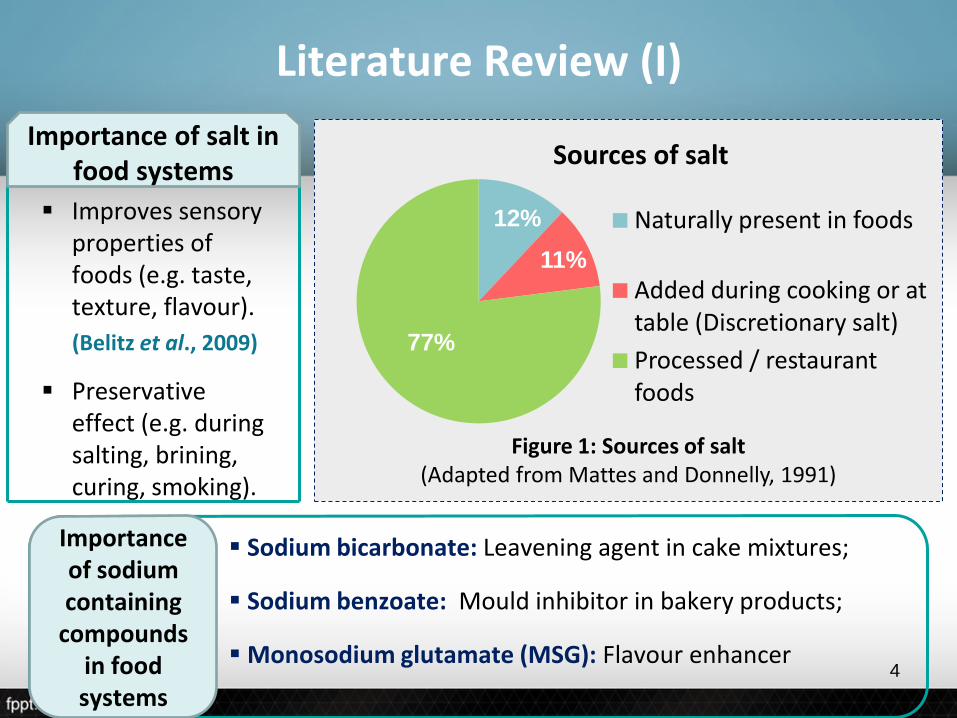
12%
11%
77%
Sources of salt
Naturally present in foods
Added during cooking or at table (Discretionary salt)
Processed / restaurant foods
Figure 1: Sources of salt(Adapted from Mattes and Donnelly, 1991)
Improves sensory properties of foods (e.g. taste, texture, flavour).
(Belitz et al., 2009)
Preservative effect (e.g. during salting, brining, curing, smoking).
Importance of salt in food systems
Sodium bicarbonate: Leavening agent in cake mixtures;
Sodium benzoate: Mould inhibitor in bakery products;
Monosodium glutamate (MSG): Flavour enhancer
Importance of sodium containing
compounds in food systems
Literature Review (I)
4
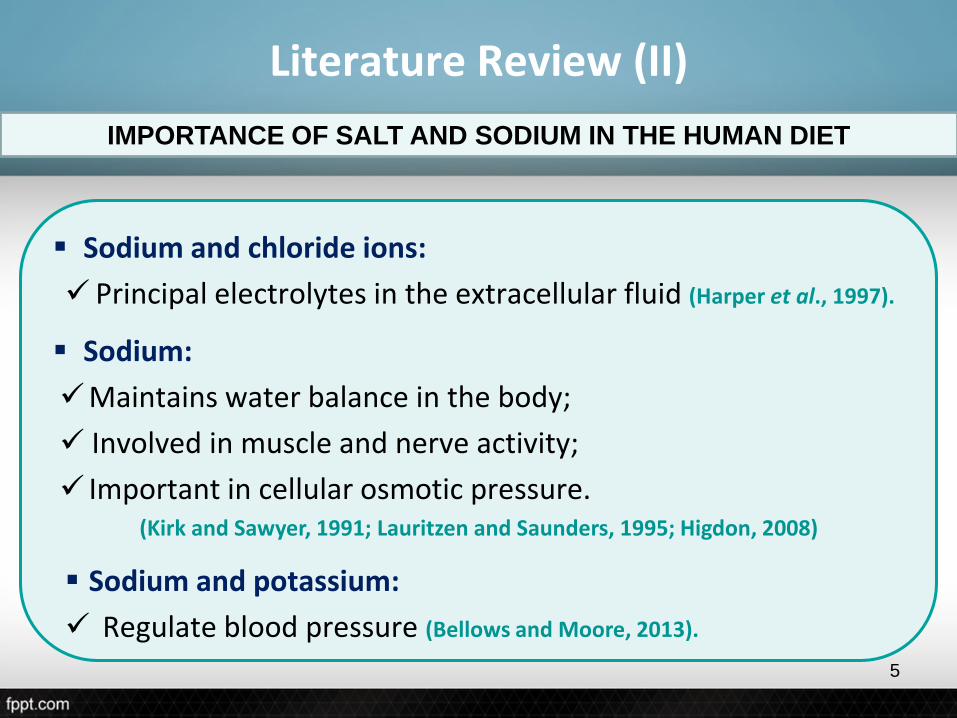
Sodium and chloride ions:
Principal electrolytes in the extracellular fluid (Harper et al., 1997).
Sodium:
Maintains water balance in the body;
Involved in muscle and nerve activity;
Important in cellular osmotic pressure. (Kirk and Sawyer, 1991; Lauritzen and Saunders, 1995; Higdon, 2008)
Sodium and potassium:
Regulate blood pressure (Bellows and Moore, 2013).
Literature Review (II)
IMPORTANCE OF SALT AND SODIUM IN THE HUMAN DIET
5
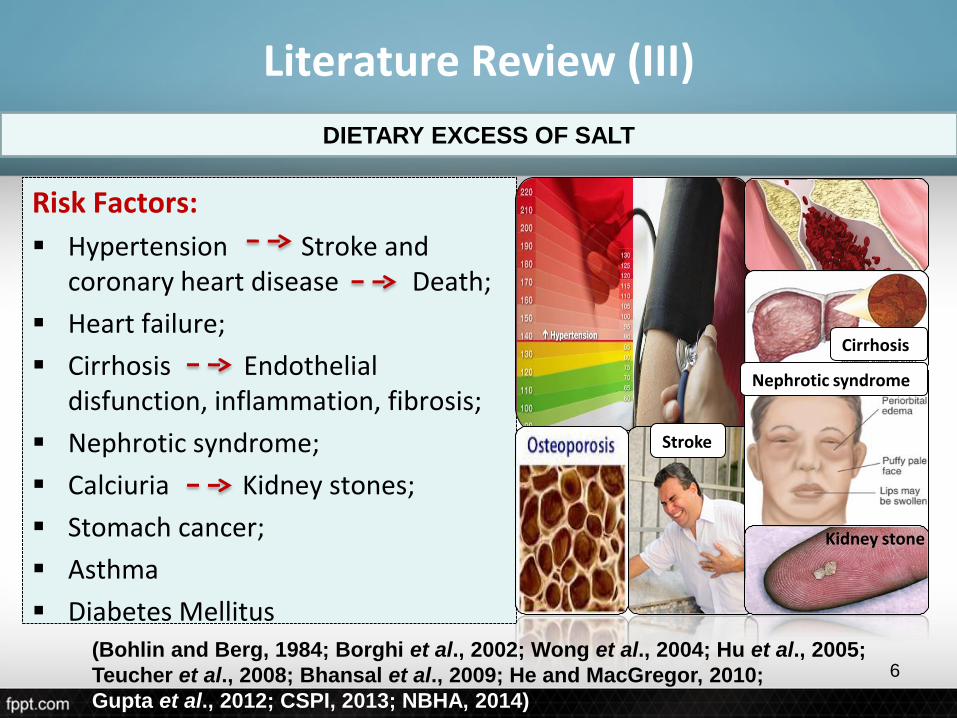
Risk Factors:
Hypertension Stroke and coronary heart disease Death;
Heart failure;
Cirrhosis Endothelial disfunction, inflammation, fibrosis;
Nephrotic syndrome;
Calciuria Kidney stones;
Stomach cancer;
Asthma
Diabetes Mellitus
Literature Review (III)
DIETARY EXCESS OF SALT
Nephrotic syndrome
Cirrhosis
Kidney stone
Stroke
(Bohlin and Berg, 1984; Borghi et al., 2002; Wong et al., 2004; Hu et al., 2005;
Teucher et al., 2008; Bhansal et al., 2009; He and MacGregor, 2010;
Gupta et al., 2012; CSPI, 2013; NBHA, 2014)
6
Objectives
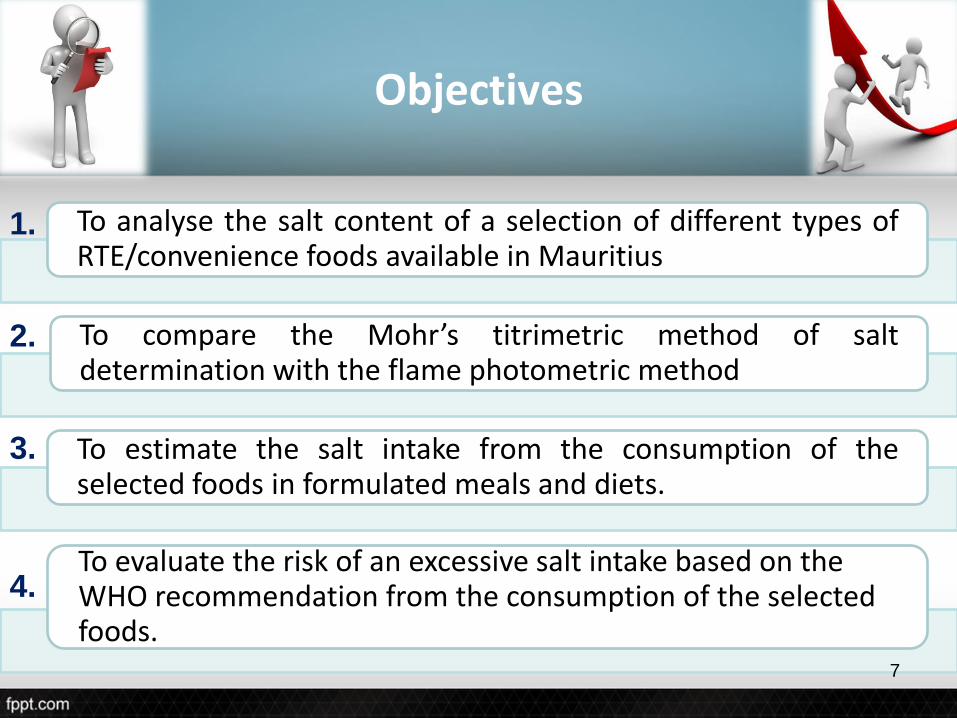
To analyse the salt content of a selection of different types ofRTE/convenience foods available in Mauritius
To compare the Mohr’s titrimetric method of saltdetermination with the flame photometric method
To estimate the salt intake from the consumption of theselected foods in formulated meals and diets.
To evaluate the risk of an excessive salt intake based on the WHO recommendation from the consumption of the selected foods.
1.
2.
3.
4.
7
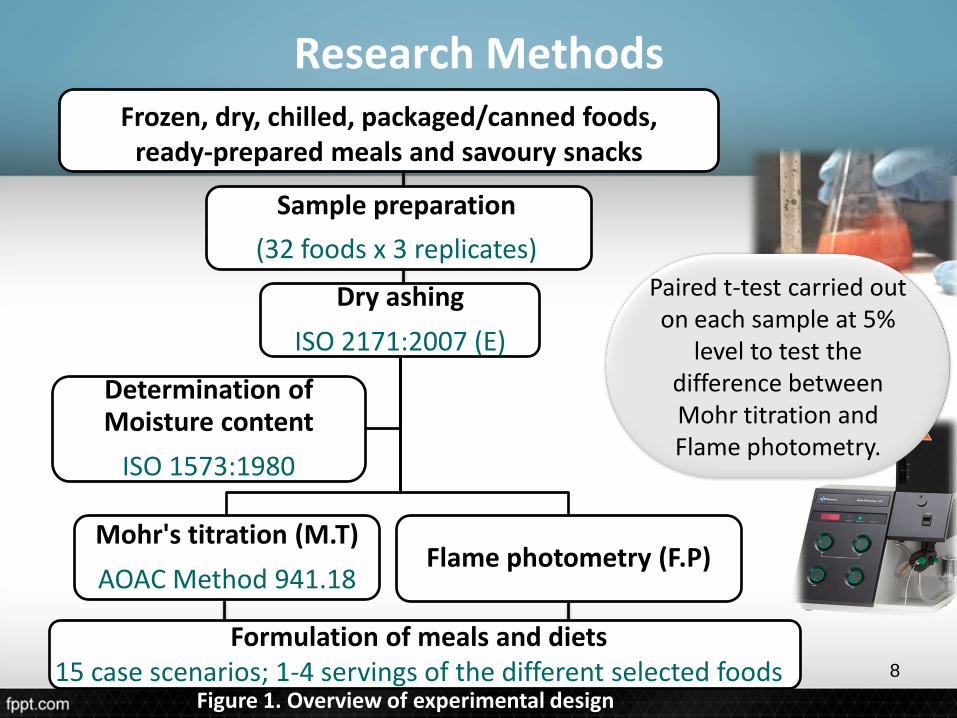
Research Methods
Dry ashing
ISO 2171:2007 (E)
Mohr's titration (M.T)
AOAC Method 941.18Flame photometry (F.P)
Determination of Moisture content
ISO 1573:1980
Frozen, dry, chilled, packaged/canned foods, ready-prepared meals and savoury snacks
Sample preparation
(32 foods x 3 replicates)
Formulation of meals and diets15 case scenarios; 1-4 servings of the different selected foods
Paired t-test carried out on each sample at 5%
level to test the difference between Mohr titration and Flame photometry.
Figure 1. Overview of experimental design
8
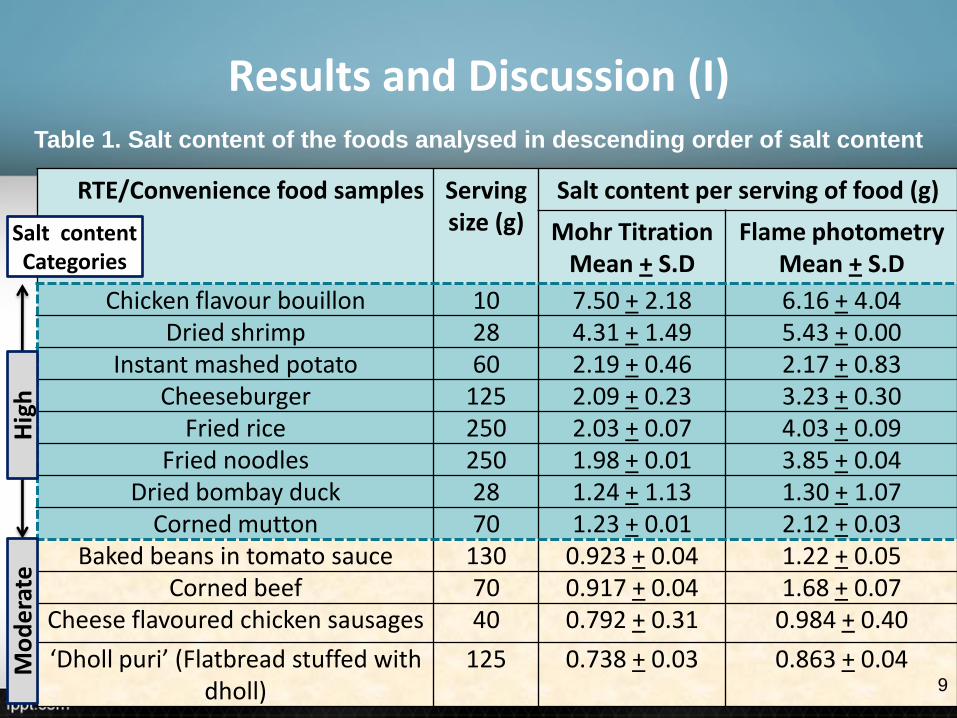
Results and Discussion (I)
RTE/Convenience food samples Serving size (g)
Salt content per serving of food (g)
Mohr TitrationMean + S.D
Flame photometryMean + S.D
Chicken flavour bouillon 10 7.50 + 2.18 6.16 + 4.04Dried shrimp 28 4.31 + 1.49 5.43 + 0.00
Instant mashed potato 60 2.19 + 0.46 2.17 + 0.83Cheeseburger 125 2.09 + 0.23 3.23 + 0.30
Fried rice 250 2.03 + 0.07 4.03 + 0.09Fried noodles 250 1.98 + 0.01 3.85 + 0.04
Dried bombay duck 28 1.24 + 1.13 1.30 + 1.07Corned mutton 70 1.23 + 0.01 2.12 + 0.03
Baked beans in tomato sauce 130 0.923 + 0.04 1.22 + 0.05Corned beef 70 0.917 + 0.04 1.68 + 0.07
Cheese flavoured chicken sausages 40 0.792 + 0.31 0.984 + 0.40
‘Dholl puri’ (Flatbread stuffed with dholl)
125 0.738 + 0.03 0.863 + 0.04
Table 1. Salt content of the foods analysed in descending order of salt content
Mo
de
rate
Hig
h
Salt contentCategories
9

Results and Discussion (II)
RTE/Convenience food samples Serving size (g)
Salt content per serving of food (g)
Mohr TitrationMean + S.D
Flame photometryMean + S.D
Corn flakes 40 0.724 + 0.05 1.26 + 0.22Banana chips 40 0.700 + 0.43 0.936 + 0.14White bread 100 0.650 + 0.19 0.960 + 0.06Cheese pizza 60 0.606 + 0.01 0.828 + 0.06
Chicken luncheon meat 28 0.591 + 0.02 1.04 + 0.06Marinated chicken 70 0.546 + 0.07 0.903 + 0.08
Roasted and salted peanuts 40 0.512 + 0.15 0.576 + 0.23Processed cheddar cheese 25 0.508 + 0.07 0.923 + 0.10
Chicken ham 30 0.438 + 0.03 1.02 + 0.05Crabsticks 25 0.350 + 0.05 0.533 + 0.71
Vegetarian chicken burger 30 0.315 + 0.05 0.765 + 0.27
‘Sev’ (Chickpea flour based fried snack) 30 0.309 + 0.09 0.420 + 0.23
Tuna flakes in brine 45 0.306 + 0.36 0.500 + 0.59
Smoked marlin 25 0.273 + 0.14 0.463 + 0.21
Table 1. Salt content of the foods analysed in descending order of salt content
(Continued)
Low
Mo
de
rate
Salt contentCategories
10
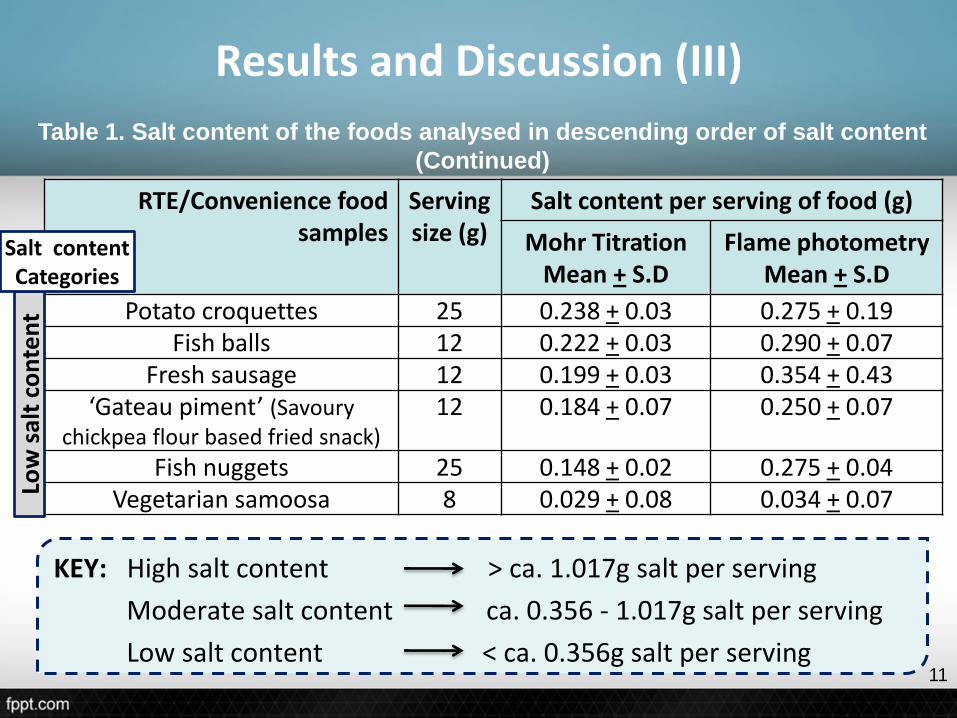
Results and Discussion (III)
KEY: High salt content > ca. 1.017g salt per serving
Moderate salt content ca. 0.356 - 1.017g salt per serving
Low salt content < ca. 0.356g salt per serving
RTE/Convenience food samples
Serving size (g)
Salt content per serving of food (g)
Mohr TitrationMean + S.D
Flame photometryMean + S.D
Potato croquettes 25 0.238 + 0.03 0.275 + 0.19Fish balls 12 0.222 + 0.03 0.290 + 0.07
Fresh sausage 12 0.199 + 0.03 0.354 + 0.43‘Gateau piment’ (Savoury
chickpea flour based fried snack)12 0.184 + 0.07 0.250 + 0.07
Fish nuggets 25 0.148 + 0.02 0.275 + 0.04Vegetarian samoosa 8 0.029 + 0.08 0.034 + 0.07
Table 1. Salt content of the foods analysed in descending order of salt content
(Continued)
Low
sal
t co
nte
nt
Salt contentCategories
11
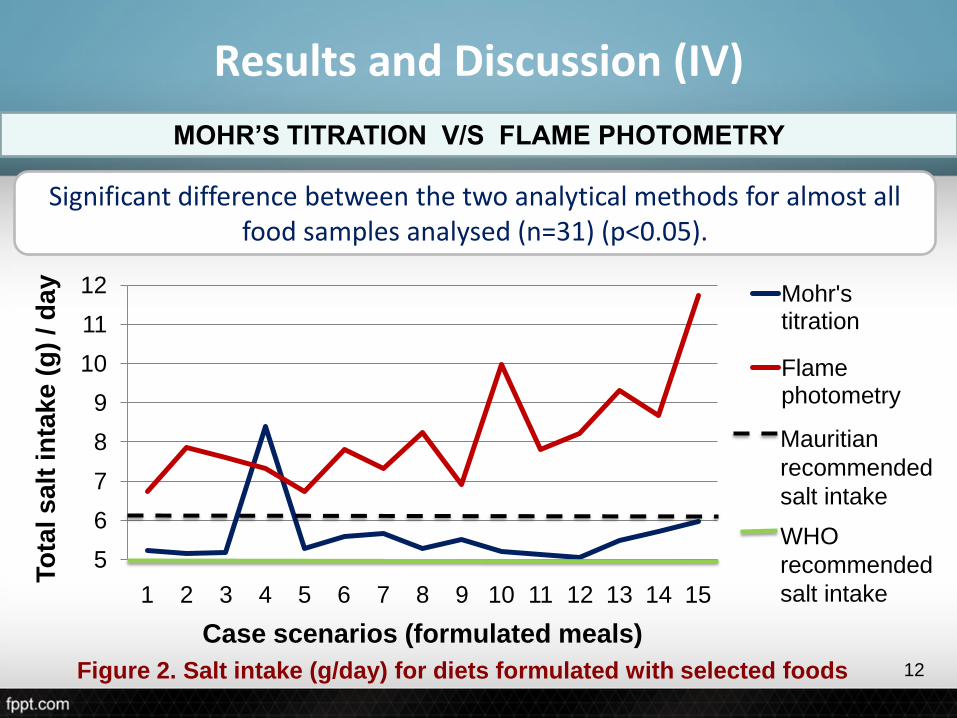
Results and Discussion (IV)
Significant difference between the two analytical methods for almost all food samples analysed (n=31) (p<0.05).
MOHR’S TITRATION V/S FLAME PHOTOMETRY
5
6
7
8
9
10
11
12
1 2 3 4 5 6 7 8 9 10 11 12 13 14 15
To
tal s
alt
in
tak
e (
g)
/ d
ay
Case scenarios (formulated meals)
Mohr's titration
Flame photometry
Mauritian
recommended
salt intake
WHO
recommended
salt intake
Figure 2. Salt intake (g/day) for diets formulated with selected foods 12
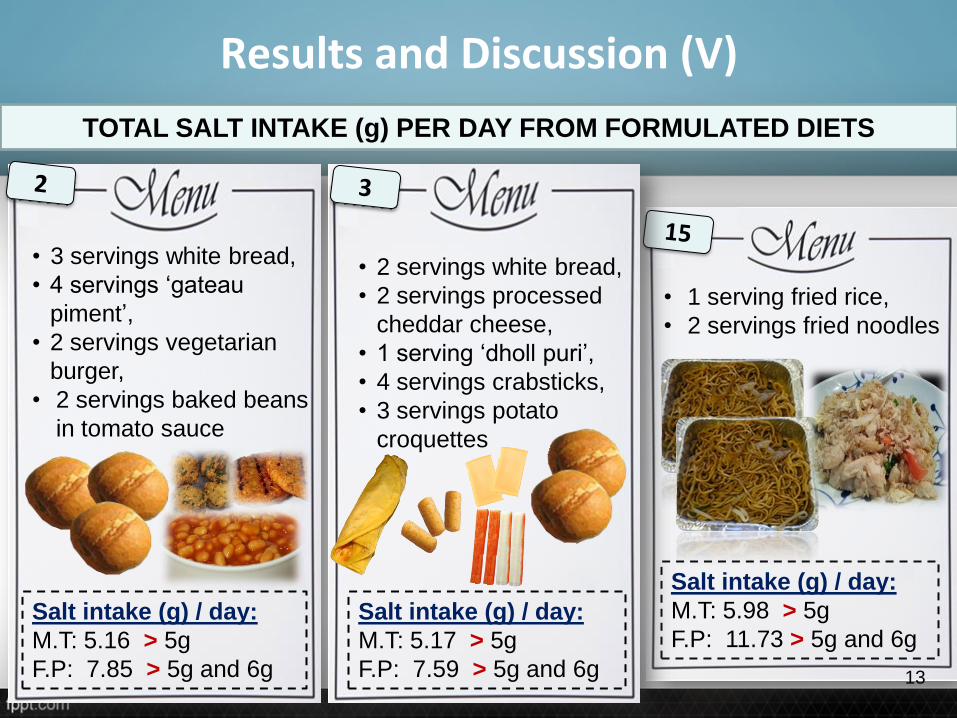
TOTAL SALT INTAKE (g) PER DAY FROM FORMULATED DIETS
Results and Discussion (V)
• 3 servings white bread,
• 4 servings ‘gateau
piment’,
• 2 servings vegetarian
burger,
• 2 servings baked beans
in tomato sauce
Salt intake (g) / day:
M.T: 5.16 > 5g
F.P: 7.85 > 5g and 6g
• 1 serving fried rice,
• 2 servings fried noodles
Salt intake (g) / day:
M.T: 5.98 > 5g
F.P: 11.73 > 5g and 6g
• 2 servings white bread,
• 2 servings processed
cheddar cheese,
• 1 serving ‘dholl puri’,
• 4 servings crabsticks,
• 3 servings potato
croquettes
Salt intake (g) / day:
M.T: 5.17 > 5g
F.P: 7.59 > 5g and 6g 13
FACTORS AFFECTING OVERALL SALT OR SODIUM INTAKE PER DAY
Results and Discussion (VI)
Use of sodium-containing compounds, ingredients naturally rich in sodium, and/or preservative techniques like salting.
Foods with a high salt content significantly impacted on overall salt intake.
As the number of food servings and/or serving size increased, so did the total salt content of the foods.
Multiple servings of least and moderately salted foods contributed to 1g or more of salt in a single diet, and greater than 2g in some of the formulated diets.
14
Conclusion
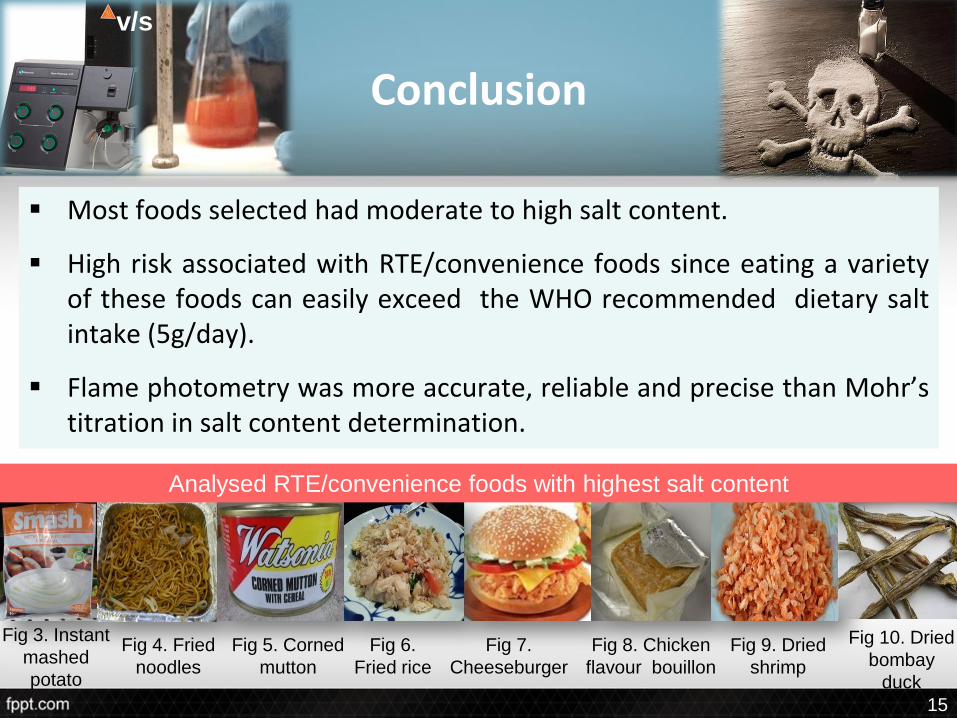
Most foods selected had moderate to high salt content.
High risk associated with RTE/convenience foods since eating a varietyof these foods can easily exceed the WHO recommended dietary saltintake (5g/day).
Flame photometry was more accurate, reliable and precise than Mohr’stitration in salt content determination.
Fig 10. Dried
bombay
duck
Fig 9. Dried
shrimp
Fig 8. Chicken
flavour bouillon
Fig 7.
Cheeseburger
Fig 6.
Fried rice
Fig 5. Corned
mutton
Fig 4. Fried
noodles
Fig 3. Instant
mashed
potato
Analysed RTE/convenience foods with highest salt content
v/s
15
Recommendations
o Development of effective and efficient salt reduction strategies.
o Use of effective dissemination channels to communicate salt reductionguidelines and create public salt awareness.
o Stricter laws applying to bread manufacturers who add > 400mg salt(including salt-containing compounds) to bread since bread exceeded itsrecommended amount of salt by > 250mg.
o Improvement of nutritional labels by providing salt content of foodproducts instead of the sodium content.
16
References (I)
Belitz, H.D., Gosch, W. and Schieberle, P. (2009). Food Chemistry, 4th revised and extended edition. Springer-Verlag Berlin, Heidelberg. 1070 pp.
Bellows, L. and Moore, R. (2013). Sodium and the diet. Colorado State University Extension, United States.(http://www.ext.colostate.edu/pubs/foodnut/09354.html).
Bhansal, S., Lindenfeld, J. and Schrier, R.W. (2009). Sodium retention in heart failure and cirrhosis: potential role of natriuretic doses of mineralocorticoid antagonist? Circ Heart Fail., 2(4), 370-376. (http://circheartfailure.ahajournals.org/content/2/4/370.full).
Bohlin, A.B. and Berg, U. (1984). Renal sodium handling in minimal change nephrotic syndrome. Archives of Disease in Childhood, 59 (9), 825-830. (http://adc.bmj.com/content/59/9/825.full.pdf).
Borghi, L., Schianchi, T., Meschi, T., Guerra, A., Allegri, F., Maggiore, U. and Novarini, A. (2002). A comparison of two diets for the prevention of recurrent stones in diopathichypercalciuria. NewEngl J Med, 346 (2), 77–84.(http://www.nejm.org/doi/full/10.1056/NEJMoa010369).
CSPI (2013). Salt Assault: Brand Name Comparisons of Processed Foods, 3rd edition. Center for Science in the Public Interest, Washington, D.C., United States.
(http://cspinet.org/salt/Salt-Assault-3rd-Edition.pdf) 17
References (II)
Gupta, D., Georgiopoulou, V.V., Kalogeropoulos, A.P., Dunbar, S.B., Reilly, C.M., Sands, J.M., Fonarow, G.C., Jessup, M., Gheorghiade, M., Yancy, C. and Butler, J. (2012). Contemporary Reviews in Cardiovascular Medicine: Dietary Sodium Intake in Heart Failure. Circulation, 126 (4), 479-485.(https://circ.ahajournals.org/content/126/4/479.full).
Harper, M.E., Willis, J.S. and Patrick, J. (1997). Sodium and chloride in nutrition. In: Handbook of nutritionally essential minerals. (Eds. B.L. O’Dell and R.A. Sunde). New York, United States, Marcel Dekker Inc. 712 pp.
He, F.J. and MacGregor, G.A. (2010). Reducing population salt intake worldwide: From evidence to implementation. Progress in Cardiovascular Diseases, 52 (5), 363-382.(http://www.sciencedirect.com/science/article/pii/S0033062009001273).
Higdon, J. (2008). Sodium (Chloride).Linus Pauling Institute, Oregon State University, United States.(http://lpi.oregonstate.edu/infocenter/minerals/sodium/).
Hu, G., Jousilahti, P., Pelton, M., Lindstrom, J. and Tuomilehto, J. (2005). Urinary sodium and potassium excretion and the risk of type 2diabetes: a prospective study in Finland. Diabetologia, 48 (8), 1477–1483.(http://www.ncbi.nlm.nih.gov/pubmed/15971060).
ISO 1573 (1980). Tea – Determination of loss in mass at 103 degrees C. Geneva, Switzerland.
18
References (III)
ISO 2171 (2007). Cereals, pulses and by-products - Determination of ash yield by incineration. Geneva, Switzerland.
Kirk, R.S. and Sawyer, R. (1991). Pearson’s composition and analysis of foods, 9th edition, pp 35, 273. Longman Group UK Ltd., UK.
Latimer, G.W. (2012). Official Methods of Analysis of AOAC International, 19th edition, Vol. 2, Appendix A, pp 18. AOAC International, USA.
Lauritzen, G.C. and Saunders, K. (1995). Sodium. Utah State University Cooperative Extension, United States.
(http://extension.usu.edu/files/publications/publication/FN_220.pdf).
Mattes, R.D. and Donnelly, D. (1991). Relative contributions of dietary sodium sources.J Am Coll Nutr., 10 (4), 383–393.
MoHQL (2002). Dietary guidelines for the prevention of NCD’s in Mauritius. Republic of Mauritius, Mauritius.(http://mih.gov.mu/English/Documents/Info%20Gateway%20-%20Guidelines%20and%20Protocols/Dietary%20guidelines%20for%20the%20prevention%20of%20NCD%27s%20in%20Mauritius.pdf).
19
References (IV)
MoHQL (2009). The trends in diabetes and cardiovascular disease risk in Mauritius: The Mauritius non communicable diseases survey 2009. MoHQL, Mauritius.(http://www.gov.mu/portal/sites/smokefree/file/diabcar.pdf).
MoHQL (2012). Mauritius salt intake study report 2012. Ministry of Health & Quality of Life, Mauritius.
NBHA (2014). Why diets high in salt deplete calcium. Washington, D.C., United States.(http://www.4bonehealth.org/why-diets-high-in-salt-deplete-calcium/).
State Government of Victoria (2013). Salt. Victoria, Australia.(http://www.betterhealth.vic.gov.au/bhcv2/bhcarticles.nsf/pages/Salt).
Taormina, P.J. (2010). Implications of salt and sodium reduction on microbial food safety. Crit Rev Food SciNutr., 50 (3), 209-227.(http://www.tandfonline.com/doi/pdf/10.1080/10408391003626207#.Uh-KrH9Z4SM).
Teucher, B., Dainty, J.R., Spinks, C.A., Majsak-Newman, G., Berry, D.J., Hoogewerff, J.A., Foxall, R.J., Jakobsen, J., Cashman, K.D., Flynn, A. and Fairweather-Tait, S.J. (2008). Sodium and bone health: impact of moderately high and low salt intakes on calcium metabolism in postmenopausal women. J Bone Miner Res., 23 (9), 1477-1485.(http://www.ncbi.nlm.nih.gov/pubmed/18410231).
20
References (V)
Birch, G.G., Cameron, A.G. and Spencer, M. (1986).Food Science, 3rd edition, pp 154.Pergamon Books Ltd., UK.
CDC (2012). Vital signs: Food categories contributing the most to sodium consumption – United States, 2007-2008. MMWR, Vol. 61, pp1-7. United States.(http://www.cdc.gov/mmwr/pdf/wk/mm61e0207.pdf).
Cotton, P.A., Subar, A.F., Friday, J.E. and Cook, A. (2004).Dietary sources of nutrients among US adults, 1994 to 1996. J Am Diet Assoc., 104 (6), 921–930.
WHO (2012). Guideline: Sodium intake for adults and children. World Health Organization, Geneva, Switzerland.(http://www.who.int/nutrition/publications/guidelines/sodium_intake_printversion.pdf).
Wong, B.C., Lam, S.K., Wong, W.M., Chen, J.S., Zheng, T.T., Feng, R.E., Lai, K.C., Hu, W.H., Yuen, S.T., Leung, S.Y., Fong, D.Y., Ho, J. and Ching, C.K. (2004). Helicobacter pylori eradication to prevent gastric cancer in a high risk region of China: a randomized controlled trial. J Am Med Ass, 291 (2), 187–194.(http://www.ncbi.nlm.nih.gov/pubmed/14722144).
21

THANK YOU!