Embed Size (px)
Citation preview

Long-term Forecast of
Medicaid Enrollment and
Spending in Alaska: Supplement 2012–2032
Sean Parnell, Governor
State of Alaska
William J. Streur, Commissioner Department of Health and Social Services
Prepared by: Medicaid Budget Group Finance and Management Services
Department of Health and Social Services
July 2013


This page is intentionally left
blank


Table of Contents Introduction .................................................................................................................................................. 1
Alaska Medicaid History ............................................................................................................................ 1
Alaska Medicaid Is a Fee for Service Program .......................................................................................... 3
Origins of the Long-term Medicaid Forecast ............................................................................................ 3
Chapter 1 – MESA Projections Results 2012-2032 ....................................................................................... 5
Population ................................................................................................................................................. 5
Enrollment and Participation .................................................................................................................... 8
Utilization ................................................................................................................................................ 11
Spending ................................................................................................................................................. 12
State Spending ........................................................................................................................................ 18
Chapter 2 – Other Medicaid Payments and Offsets ................................................................................... 20
Chapter 3 – Summary ................................................................................................................................. 23
Appendix A: Medicaid Eligibility Classification Descriptions .................................................................. 24
Appendix B: Federal Financial Participation (FFP) Rates ........................................................................ 25
Appendix C: Medicaid Service Category Descriptions ............................................................................ 26
Appendix D: Detailed Tables of 2012-2032 MESA Forecast ................................................................... 27
Appendix E: Glossary and Definition of Terms ....................................................................................... 35
Table of Tables
Table 1: The elderly population is projected to grow faster than other age groups .................................... 7 Table 2: Elderly enrollment is projected to grow faster than other age groups .......................................... 9 Table 3: Enrollment in eligibility groups associated with the disabled and elderly will grow faster than other eligibility categories .......................................................................................................................... 11 Table 4: Service category designations in the MESA forecast .................................................................... 11 Table 5: Spending on the elderly will grow nearly twice as fast as spending on other age groups ........... 13 Table 6: Long-term care is projected to be the fastest growing service category ..................................... 16 Table 7: State share of Medicaid funding increases throughout the forecast period ................................ 19 Table 8: Other Medicaid payments will increase total Medicaid spending in 2032 to $6.3 billion............ 22 Table 9: Forecast of Population by Subpopulations ................................................................................... 27 Table 10: Forecast of Enrollment by Subpopulations ................................................................................. 28
Long Term Forecast of Medicaid Enrollment and Spending in Alaska: 2012 – 2032 i

Table 11: Enrollment Rates by Subpopulations .......................................................................................... 29 Table 12: Enrollment Levels by Eligibility Groups ....................................................................................... 29 Table 13: Total Spending on Medicaid Services by Subpopulations (in millions) ....................................... 30 Table 14: Spending per Enrollee on Medicaid Services by Subpopulations ............................................... 31 Table 15: Spending on Medicaid Services by Service Category (in millions) .............................................. 32 Table 16: Average Spending per Recipient by Service Category (in dollars) .............................................. 33 Table 17: Forecast of State Claims Spending by Service Category (in millions) ......................................... 34 Table 18: Historical Enrollment by Demographic Group ............................................................................ 34
Table of Figures
Figure 1: Alaska's population growth has slowed in recent decades ........................................................... 6 Figure 2: Alaska's rate of population growth is projected to decline through the forecast period ............. 7 Figure 3: Enrollment growth slows down over time. The elderly remain the fastest growing group. ......... 8 Figure 4: Enrollment will continue to increase throughout the projection period ...................................... 9 Figure 5: The percentage of enrollees who are elderly will increase over the next 20 years .................... 10 Figure 6: HCB Waiver and Personal Care are projected to experience growth in utilization in excess of 5 percent per year.......................................................................................................................................... 12 Figure 7: Growth in Medicaid spending on the elderly will accelerate between 2012 & 2017 and then slow throughout the forecast period .......................................................................................................... 13 Figure 8: Claims spending for the elderly will converge with and then surpass spending on working-age adults and children ..................................................................................................................................... 14 Figure 9: Spending on each elderly enrollee will continue to outpace spending per enrollee on children and working-age adults ............................................................................................................................... 14 Figure 10: Due in large part to rapid growth in spending on long-term care services, total spending on Medicaid will quadruple between 2012 and 2032 ..................................................................................... 15 Figure 11: Growth in total spending has slowed dramatically in recent years ........................................... 15 Figure 12: Spending on long-term care services will increase as a share of total Medicaid spending ....... 16 Figure 13: Home and Community Based Waivers and Personal Care are the fastest growing service categories .................................................................................................................................................... 17 Figure 14: Healthcare price inflation accounts for the largest part of increased claims spending ............ 18
Long Term Forecast of Medicaid Enrollment and Spending in Alaska: 2012 – 2032 ii

Introduction
Introduction Medicaid is an entitlement program created in 1965 by the federal government, but administered by the states, to provide payment for healthcare services for low-income citizens. People qualify for Medicaid by meeting federal income and asset standards and meeting specified eligibility requirements. Medicaid covers the aged, blind, or disabled persons and single parent families. In addition, Medicaid expanded coverage in 1998 through the Children’s Health Insurance Program (CHIP) to children whose family income is too high to qualify for regular Medicaid, but too low to afford private health insurance. In Alaska, the CHIP program is administered through the Division of Health Care Services. The Division of Public Assistance manages enrollment for regular Medicaid and CHIP. Alaska Medicaid History Medicaid is jointly funded by the federal government and by the individual states, with each state managing its own program. Participation in the Medicaid program is optional, but all states choosing to participate in the program must follow certain federal guidelines pertaining to eligibility and services to be provided. An individual state is permitted to make a Medicaid state plan amendment (SPA) in order to modify how Medicaid is operated within the state. However, the Center for Medicare and Medicaid Services (CMS) must review and approve the SPA for consistency with federal laws and regulations before the state is allowed to implement a Medicaid program modification. The website for the Alaska Division of Public Assistance contains the following information about Alaska’s Medicaid program: 1
“Medicaid was established by Title XIX of the Social Security Act in 1965 to provide medical assistance to certain low-income needy individuals and families. Medicaid is basically intended to provide coverage for needy children, pregnant women, and aged, blind and disabled persons. The Alaska Department of Health and Social Services administers the Medicaid program in accordance with federal and state laws and regulations. The Medicaid program is authorized under Title XIX and Title XXI of the Social Security Act and the Code of Federal Regulations, Title 42 Part 435 and Title 45 Part 233. Alaska joined the Medicaid program in September 1972. New services and eligible groups have been added to the program since that time by the Legislature. The Medicaid
1 http://dpaweb.hss.state.ak.us/manuals/fam-med/5000/5000-1_introduction_to_medicaid.htm http://dpaweb.hss.state.ak.us/manuals/fam-med/5300/5300_denalikidcare.htm
Long Term Forecast of Medicaid Enrollment and Spending in Alaska: 2012 – 2032 1

Introduction
program in Alaska is authorized under Alaska Statutes 47.07.010 - 47.07.900 and the Alaska Administrative Code, Title 7 Chapter 43 and Chapter 100. Persons receiving Adult Public Assistance (APA) and Supplemental Security Income (SSI) are automatically eligible for Medicaid. There are eligibility categories for pregnant women and children based on having income below a percentage of the federal poverty level for Alaska. There are number of narrow eligibility categories that follow SSI or APA eligibility policy, but are for the elderly or disabled who are not recipients of those cash programs. Alaska also purchases Part B Medicare for Medicaid-eligible recipients, and provides payment for long term care services for persons whose income is within 300% of the SSI Supplemental Security Income payment level. Before July 1, 1997, individuals and families who were eligible for and/or received Aid to Families with Dependent Children [AFDC] were automatically eligible for Medicaid. This entitlement was removed by the enactment of the Personal Responsibility and Work Opportunity Reconciliation Act of 1996. As a result of this major welfare reform legislation, families who are receiving cash assistance through the Alaska Temporary Assistance Program (ATAP), generally referred to as “Temporary Assistance” (TA), are not automatically eligible for Medicaid. This legislation eliminated the program, but required that Medicaid continue to be available to those who would have qualified for AFDC. This category of Medicaid is now called Family Medicaid. The Balanced Budget Act of 1997 established the Child Health Insurance Program (CHIP) in Title 21 of the Social Security Act. This program provides Alaska with enhanced federal matching money to expand Medicaid eligibility to more children. At the same time, eligibility was also expanded for pregnant women. Beginning March 1, 1999, children under age 19 and pregnant women qualified for health care coverage if their household income was at or below 200 percent of the federal poverty guideline (FPG) for Alaska.”
On September 1, 2003, the eligibility standard for children without insurance and pregnant women was reduced from 200 percent to 175 percent of the 2003 federal poverty guideline (FPG) for Alaska. This 175 percent FPG standard was frozen at the 2003 level and did not increase each year as it had historically. Effective July 1, 2007, the eligibility standard for children without insurance and pregnant women was increased to 175 percent of the 2007 federal poverty guideline for Alaska due to a change in law. This standard will increase each year along with the annual increases in the FPG. Denali KidCare is an expansion of Medicaid, using the same basic infrastructure and benefit package. The Denali KidCare name encompasses the Medicaid eligibility subtypes of pregnant and postpartum women (PB, PC, PR, and PX), CHIP children (CP, H2, and S2), as well as other
Long Term Forecast of Medicaid Enrollment and Spending in Alaska: 2012 – 2032 2

Introduction
children (H1, S1, HC, and SU).2 Application intake and processing occur in the specialized Denali KidCare office.3 Alaska Medicaid Is a Fee for Service Program Alaska Medicaid reimburses hospitals, physicians, and other healthcare providers for providing healthcare services to Medicaid enrollees. Alaska runs its program as fee-for-service program, meaning that it reimburses providers as payments per unit of service rendered according to an established payment rate. This is in contrast to managed care, where a healthcare organization receives a monthly payment for each Medicaid recipient enrolled in the plan. In a managed care arrangement, the health care organization is responsible for ensuring that the enrollees have access to a comprehensive range of medical services. Origins of the Long-term Medicaid Forecast In April 2005 the Alaska Department of Health and Social Services (HSS) contracted with the Lewin Group and ECONorthwest to develop a long-term forecasting model of Medicaid spending for the State of Alaska. In February 2006 a report, based on the results of the forecasting model, was submitted to the Alaska Legislature to inform policy makers of the projected growth in total spending on Alaska’s Medicaid program over the 20-year period ending in 2025. The purpose of the Long-term Medicaid forecast (assigned the acronym MESA—Medicaid Enrollment and Spending in Alaska—by HSS in 2007) is to provide a long-term view of future enrollment and spending in the Alaska Medicaid program under the current mix of Medicaid services and the current eligibility criteria for enrollment in the Medicaid program. MESA provides department executives and the Alaska State Legislature with information on the direction and approximate magnitude of growth in enrollment and state matching fund spending for the Medicaid program.
2 Pregnant and Postpartum Women: PR = Pregnant with income < 133% FPG; PX = Pregnant with income > 133% FPG =< 175% FPG; PB = Postpartum income < 133% FPG; PC = Postpartum income > 133% FPG =< 175% FPG
CHIP Children: CP = > 150% & <= 175% (age 0-8); H2 = > 133% & <= 150% (age 0-8); S2 = > 100% & <= 133% (age 6-18);
Other Children: H1 = > 133% & <= 150% (age 0-8); S1 = > 100% & <= 133% (age 6-18); HC = > 100% & <= 133% (age 0-5); SU <= 100% FPG (age 6-18) 3 Appendix B contains a list of descriptions for Denali KidCare eligibility subtypes, as well as the other eligibility subtypes. The Medicaid expenses for children who are eligible for the Medicaid program because of the Children’s Health Insurance Program (CHIP) are eligible to be reimbursed by the federal government at the Enhanced Federal Medical Assistance Percentage (Enhanced FMAP). The Enhanced FMAP reduces the state’s share of spending by 30 percent. If the regular FMAP for a state is 50 percent, the Enhanced FMAP is 65 percent.
Long Term Forecast of Medicaid Enrollment and Spending in Alaska: 2012 – 2032 3

Introduction
In each successive year since the original forecast, the Medicaid Budget Group, at first with consultation from ECONorthwest and now with Evergreen Economics, has updated the underlying enrollment and claims data on which the MESA forecasting model depends, and has re-estimated the model to project enrollment and spending over the successive 20-year period. By integrating a successive year of data into the MESA model, we update the Medicaid program’s status quo with respect to eligibility, enrollment trends, and spending. Thus, as changes are made to the Medicaid program by HSS or the Legislature, MESA provides estimates of the long-term impact of the changes.
Long Term Forecast of Medicaid Enrollment and Spending in Alaska: 2012 – 2032 4

Chapter 1 – MESA projections results 2012 – 2032
Chapter 1 – MESA Projections Results 2012-2032 This chapter covers projections for claims on services provided to individual.4 The analysis combines historical Alaska Medicaid enrollment and claims data, based on date of service, for fiscal years 1997 through 2011,5 with U.S. Census data and population projections from the Alaska Department of Labor and Workforce Development (ADLWD) to develop forecasts of enrollment in the Medicaid program and utilization of and spending on Medicaid services. The projections are based on the Medicaid program as it currently exists. Population The population of Alaska has changed substantially in the years since statehood. In 1960, one year after Alaska became a state, the population was 226,167 and about one-fifth (44,237) of all Alaskans lived in Anchorage.6 By the time Alaska started its Medicaid program in 1972, the population of the state had increased to 329,800, for an average annual growth of 3.2 percent.7 Population continued to grow quickly through the 1970s and 1980s, partly influenced by the construction of the Trans-Alaska Pipeline from 1975 to 1977 and other jobs related to the oil industry.8 By 1990, the State’s population had risen to 550,043 and the population of Anchorage had grown to 226,338 residents, or just over two-fifths of the state population.9 Alaska’s population growth has slowed in recent years. From 1990 to 2012, the population increased on average by 1.3 percent per year, reaching 732,298 in 2012. Of these residents, 298,842 lived in Anchorage (41 percent).10 While the ratio of males to females has moved toward the national average over the past decades, in 2012, there were still about 108 males in Alaska for every 100 females.11
4 Chapter 2 deals with other Medicaid payments and offsetting recoveries, which are not directly tied to a particular claim. 5 Since the forecast is based on date of service and providers have up to a year to submit claims, many of the medical claims for services that were provided during fiscal year 2012 have not yet entered the claims system. 6 http://www2.census.gov/prod2/decennial/documents/15611103.pdf 7 See the Alaska Department of Labor and Workforce Development’s report Alaska Population Overview 2009 Estimates, page 13, available at http://labor.alaska.gov/research/pop/estimates/pub/popover.pdf 8 Population grew at an average annual rate of 2.9 percent over this period. For more information on the impact of the Trans-Alaska Pipeline see http://www.alyeska-pipe.com/pipelinefacts.html 9 See http://www.census.gov/prod/cen1990/cph2/cph-2-3.pdf 10 See http://laborstats.alaska.gov/pop/popest.htm 11 See http://www.census.gov/prod/cen2010/briefs/c2010br-03.pdf
Long Term Forecast of Medicaid Enrollment and Spending in Alaska: 2012 – 2032 5

Chapter 1 – MESA projections results 2012 – 2032
Figure 1: Alaska's population growth has slowed in recent decades ALASKA’S POPULATION AND ANNUAL GROWTH RATES FROM 1960 – 2010
Source: U.S. Census Bureau Even though Alaska’s population has grown substantially over the past 50 years, it is important to keep in mind that there have been significant fluctuations in the year-to-year growth rates, and there have been some years when the population has decreased.12 An extremely strong or extremely weak economic climate—relative to the rest of the nation—could lead to similar swings in growth in future years. Based on analysis by the ADLWD, the population of Alaska is projected to grow at an average rate of 1.02 percent per year over the next 20 years, reaching 893,978 residents in 2032.13 Population growth is expected to lead to growth in Medicaid enrollment and in turn more spending by the state on Medicaid services.
12 See the Alaska Department of Labor and Workforce Development’s report Alaska Population Overview 2009 Estimates, page 13, available at http://labor.alaska.gov/research/pop/estimates/pub/popover.pdf for details about the Alaska population estimates from 1945 to 2009. 13 See Table 12 in Appendix D. Population projections are derived from the growth rates within the ADLWD’s report Alaska Population Projections 2010 to 2034, available at http://labor.alaska.gov/research/pop/projected/pub/popproj.pdf.
Long Term Forecast of Medicaid Enrollment and Spending in Alaska: 2012 – 2032 6

Chapter 1 – MESA projections results 2012 – 2032
Figure 2: Alaska's rate of population growth is projected to decline through the forecast period ALASKA’S PROJECTED POPULATION AND GROWTH FROM 2012 TO 2032
Source: MESA model, December 2012, using data from the Alaska Department of Labor and Workforce Development and adjusting for 2010 Census data. The ADLWD projects the distribution of residents by gender and age will change over the next two decades as the state adds more females than males and the overall population ages. We expect this to have an impact on the Medicaid program as females enroll in the Medicaid program at a greater rate and tend to incur higher costs on average than men.14 The population will also grow older, with the highest percent growth in the state being those above age 75. The elderly population not only tends to enroll in Medicaid at a higher rate than working-age adults, but the costs associated with caring for the elderly are also significantly higher than they are for children or working-age adults. Table 1: The elderly population is projected to grow faster than other age groups ALASKA’S PROJECTED POPULATION BY AGE GROUP FOR SELECTED YEARS, 2012—2032
Age Group 2012 2017 2022 2027 2032 Average
Annual Change
Children (0-19) 210,758 224,857 238,216 249,453 257,541 1.01%
Working Age Adults (20-64) 455,938 464,050 465,282 469,461 484,400 0.30%
Elderly (65+) 62,950 87,744 115,319 138,755 152,038 4.51%
Total Population 729,645 776,651 818,817 857,669 893,978 1.02% Source: MESA model, using data from the Alaska Department of Labor and Workforce Development.
14 More specifically, working-age females incur greater costs on average than working age males and elderly females incur greater costs on average than elderly males. Average Medicaid costs for male and female children are approximately equal.
Long Term Forecast of Medicaid Enrollment and Spending in Alaska: 2012 – 2032 7
Chapter 1 – MESA projections results 2012 – 2032
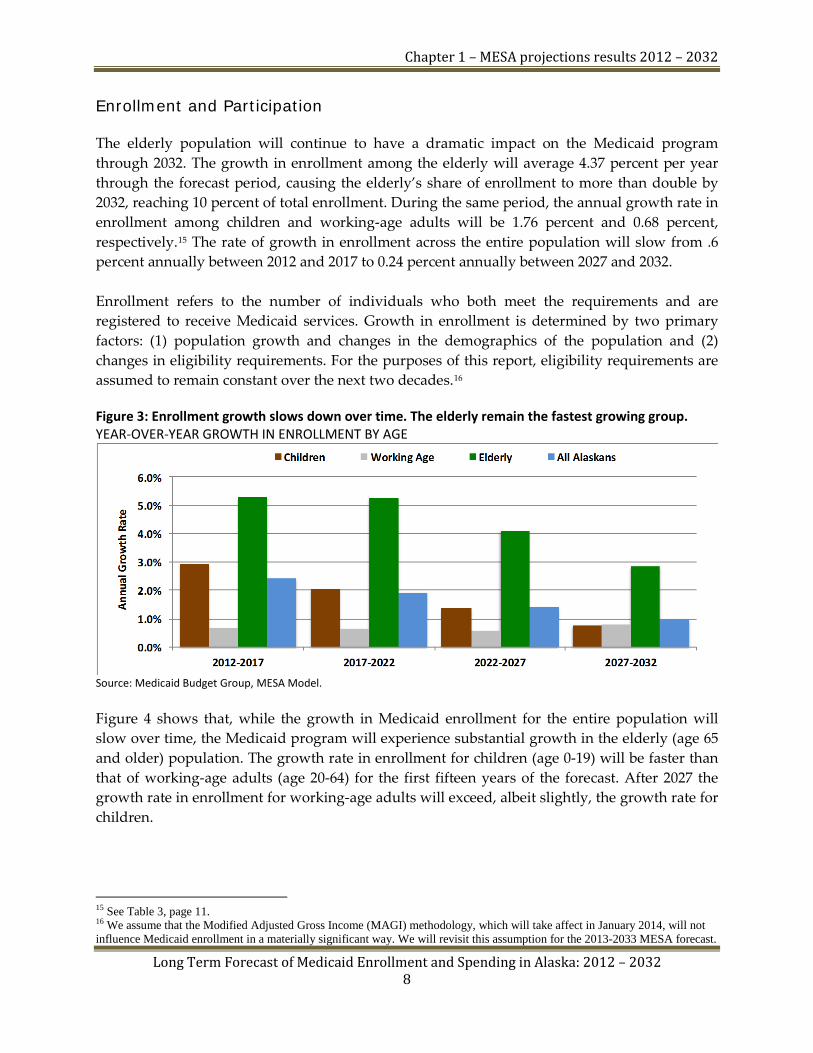
Enrollment and Participation The elderly population will continue to have a dramatic impact on the Medicaid program through 2032. The growth in enrollment among the elderly will average 4.37 percent per year through the forecast period, causing the elderly’s share of enrollment to more than double by 2032, reaching 10 percent of total enrollment. During the same period, the annual growth rate in enrollment among children and working-age adults will be 1.76 percent and 0.68 percent, respectively.15 The rate of growth in enrollment across the entire population will slow from .6 percent annually between 2012 and 2017 to 0.24 percent annually between 2027 and 2032. Enrollment refers to the number of individuals who both meet the requirements and are registered to receive Medicaid services. Growth in enrollment is determined by two primary factors: (1) population growth and changes in the demographics of the population and (2) changes in eligibility requirements. For the purposes of this report, eligibility requirements are assumed to remain constant over the next two decades.16 Figure 3: Enrollment growth slows down over time. The elderly remain the fastest growing group. YEAR-OVER-YEAR GROWTH IN ENROLLMENT BY AGE
Source: Medicaid Budget Group, MESA Model. Figure 4 shows that, while the growth in Medicaid enrollment for the entire population will slow over time, the Medicaid program will experience substantial growth in the elderly (age 65 and older) population. The growth rate in enrollment for children (age 0-19) will be faster than that of working-age adults (age 20-64) for the first fifteen years of the forecast. After 2027 the growth rate in enrollment for working-age adults will exceed, albeit slightly, the growth rate for children.
15 See Table 3, page 11. 16 We assume that the Modified Adjusted Gross Income (MAGI) methodology, which will take affect in January 2014, will not influence Medicaid enrollment in a materially significant way. We will revisit this assumption for the 2013-2033 MESA forecast.
Long Term Forecast of Medicaid Enrollment and Spending in Alaska: 2012 – 2032 8

Chapter 1 – MESA projections results 2012 – 2032
Table 2: Elderly enrollment is projected to grow faster than other age groups MEDICAID ENROLLMENT BY AGE GROUP FOR SELECTED YEARS, 2012 – 2032
Age Group 2012 2016 2021 2026 2032 Average
Annual Change
Children (0-19) 92,683 106,993 118,356 126,571 131,398 1.76%
Working Age Adults (20-64) 44,531 46,052 47,590 48,991 50,977 0.68%
Elderly (65+) 9,263 11,988 15,491 18,941 21,801 4.37%
Total Enrollment 146,476 165,033 181,436 194,504 204,176 1.67% Source: Medicaid Budget Group, MESA Model. Figure 4: Enrollment will continue to increase throughout the projection period HISTORICAL & PROJECTED ENROLLMENT BY AGE GROUP
Source: Medicaid Budget Group, MESA Model The demographic characteristics of Medicaid enrollees have changed and will continue to do so in the future. The share of children as a percent of all participants enrolled in Medicaid increased in the late 1990s and continued to increase until 2004, when they accounted for 67 percent of enrollees. This coincided with the introduction of Denali KidCare, which expanded Medicaid to more pregnant women and individuals. From 2004 to 2007, the household income eligibility requirements for Denali KidCare were locked into place instead of being adjusted for inflation, so some individuals fell off the rolls. The proportion of enrollees who are children has since dropped to 63 percent. With a projected 1.76 percent annual growth rate from 2012 to 2032, children’s share of enrollment will remain largely unchanged; by 2032, enrollment is projected to include 131,398 children, accounting for 64 percent of enrollment. The proportion of Medicaid enrollees who are working-age adults decreased from 35 percent of enrollment in 1997 to 27 percent of enrollment in 2002. Enrollment of working-age adults is projected to grow over the forecast period at 0.68 percent per year—slower than the projected rate for children and much slower than the projected rate for the elderly. The share of enrollees
Long Term Forecast of Medicaid Enrollment and Spending in Alaska: 2012 – 2032 9

Chapter 1 – MESA projections results 2012 – 2032
who are working-aged adults is projected to decrease throughout the forecast period, from 30 percent in 2012 to 25 percent in 2032. Figure 5: The percentage of enrollees who are elderly will increase over the next 20 years SHARE OF TOTAL ENROLLEES BY AGE GROUP
Source: Medicaid Budget Group, MESA Model With ever more people in the Baby Boom Generation reaching retirement age, the elderly will account for a larger share of Medicaid enrollees over the forecast period, increasing from 6 percent of enrollment to 11 percent in 2032. Enrollment of elderly is expected to grow at an annual rate of 4.37 percent over the next 20 years, from 9,200 in 2012 to 22,000 in 2032. The proportion of enrollees by gender is projected to remain stable throughout the forecast period at approximately 55 percent female and 45 percent male.17 The Native/Non-Native ratio of enrollees will also remain stable throughout the forecast period; Alaska Natives currently make up a little more than 36 percent of Medicaid enrollees, and that figure will remain roughly the same in 2032. The forecast projects an increase in enrollment levels for each eligibility group,18 with the greatest growth tending to be in eligibility categories that have a larger share of the disabled and the elderly. These groups include Other Disabled, Long Term Care Non-Cash, and SSI/APA/LTC Cash,19 which we project will experience average annual enrollment growth of 1.3 percent, 4.2 percent, and 2.9 percent, respectively. SSI/APA/LTC Cash is the eligibility group that we project will experience the greatest increase in enrollment between 2012 and 2032 (19,400 additional enrollees).
17 See Table 12 in Appendix D 18 See Table 13 in Appendix D 19 SSI = Social Security income; APA = Adult Public Assistance; LTC Cash = long-term care cash assistance
Long Term Forecast of Medicaid Enrollment and Spending in Alaska: 2012 – 2032 10

Chapter 1 – MESA projections results 2012 – 2032
Table 3: Enrollment in eligibility groups associated with the disabled and elderly will grow faster than other eligibility categories MEDICAID ENROLLMENT FOR SELECTED ELIGIBILITY GROUPS Eligibility group 2012 2017 2022 2027 2032 Annual Change LTC Non-cash 2,596 3,227 4,049 5,011 5,953 4.2% Medicare 552 601 634 651 664 0.9% SSI/APA/LTC Cash 25,651 30,609 36,054 41,123 45,096 2.9% All Other Eligibility Categories 117,677 130,596 140,699 147,719 152,462 1.3%
Source: Medicaid Budget Group, MESA Model Utilization In the above sections of this report we presented information pertaining to projected population growth in Alaska and projected Medicaid enrollment growth. In this section, we present information pertaining to the utilization of Medicaid services. The term “utilization” has multiple meanings in healthcare economics. For our purposes, we define utilization as the annual unduplicated count of Medicaid enrollees who received a particular Medicaid service during a fiscal year. These enrollees are referred to as “recipients” or “beneficiaries.” Recipients are counted as utilizing a Medicaid service category if they used a Medicaid service during the fiscal year that resulted in a paid claim greater than zero dollars. Recipients are counted only once per fiscal year for any given service category, whether they used a service category once or used it multiple times during the fiscal year. To summarize, for the purposes of the MESA analysis, “utilization” measures the number of individuals who used a Medicaid service during a fiscal year, but it does not measure the quantity (or "intensity") of the service that an individual used. The quantity of use of a Medicaid service is considered in the forecast of spending on Medicaid services. Table 4: Service category designations in the MESA forecast Dental Inpatient Hospital Pharmacy DME20 / Supplies Inpatient Psychiatric Physician / Practitioner EPSDT21 Lab / X-Ray Residential Psychiatric / BRC22 Family Planning Nursing Home Therapy / Rehabilitation HCB23 Waiver Outpatient Hospital Transportation Health Clinic Outpatient Mental Health Vision Home Health / Hospice Personal Care Currently, the service category with the highest utilization is Physician / Practitioner services, which had an estimated 108,800 users during 2012. We project that it will remain the service category with the highest utilization throughout the forecast period. This does not mean,
20 Durable Medical Equipment 21 Early and Periodic Screening, Diagnosis, and Treatment 22 Behavioral Rehabilitation Centers 23 Home and Community Based Waiver
Long Term Forecast of Medicaid Enrollment and Spending in Alaska: 2012 – 2032 11

Chapter 1 – MESA projections results 2012 – 2032
however, that it is the fastest growing service category. In fact, with a growth rate in utilization averaging 2.1 percent per year, the Physician / Practitioner service category is one of the slower growing Medicaid service categories. It is projected that in 2032, approximately 165,000 Alaskans will receive Physician / Practitioner services through the Medicaid program. The two service categories that are expected to see the highest percentage growth in utilization over the next twenty years are Personal Care, with an average annual growth of 6.6 percent, and Home and Community Based (HCB) Waiver (5.5 percent). The increasing number of the elderly in the Medicaid program will drive the increased utilization of these services. In spite of the high growth rates in utilization for services related to the elderly, Personal Care and HCB Waiver will continue to have low utilization relative to many other service categories. Figure 6: HCB Waiver and Personal Care are projected to experience growth in utilization in excess of 5 percent per year AVERAGE ANNUAL PERCENT GROWTH IN UTILIZATION FOR SELECTED SERVICE CATEGORIES
Source: Medicaid Budget Group, MESA model Spending We project that total Medicaid spending will increase by 7.6 percent annually between 2012 and 2032. This projection is based on the Medicaid program as it currently exists and does not consider policy changes that may occur during the forecast period. Service categories that primarily serve the elderly are projected to experience the highest growth in spending during the forecast period.24 These services also tend to have the highest average per capita costs.
24 See Appendix Table 14 Long Term Forecast of Medicaid Enrollment and Spending in Alaska: 2012 – 2032
12

Chapter 1 – MESA projections results 2012 – 2032
Table 5: Spending on the elderly will grow nearly twice as fast as spending on other age groups MEDICAID SPENDING BY AGE GROUP FOR SELECTED YEARS, 2012 – 2032 (IN MILLIONS) Age Group 2012 2017 2022 2027 2032 Annual Growth Children (0-19) $524.3 $789.9 $1,121.0 $1,529.0 $1,977.4 6.9% Working Age Adults (20-64) $631.5 $868.3 $1,137.7 $1,470.9 $1,895.5 5.7%
Elderly (65+) $228.5 $425.9 $779.7 $1,352.2 $2,112.4 11.8%
Total $1,384.3 $2,084.0 $3,038.4 $4,352.0 $5,985.3 7.6% Source: Medicaid Budget Group: MESA Model Figure 7: Growth in Medicaid spending on the elderly will accelerate between 2012 & 2017 and then slow throughout the forecast period ANNUAL GROWTH IN TOTAL CLAIMS SPENDING BY AGE GROUP
Source: Medicaid Budget Group, MESA Model We project the average annual growth rate in spending for the elderly will be 11.76 percent through 2032. In comparison, we project average annual growth rates of 6.9 percent for children and 5.7 percent for working-age adults. Claims spending for all groups will grow from $1.4 billion in 2012 to $6.0 billion in 2032, for an annual growth rate of 7.6 percent. The higher projected growth rates in spending on the elderly, relative to children and working-age adults, is due in large part to the higher projected growth rate in enrollment of the elderly, relative to the younger age groups.
Long Term Forecast of Medicaid Enrollment and Spending in Alaska: 2012 – 2032 13

Chapter 1 – MESA projections results 2012 – 2032
Figure 8: Claims spending for the elderly will converge with and then surpass spending on working-age adults and children TOTAL CLAIMS SPENDING BY AGE GROUP
Source: Medicaid Budget Group: MESA Model The higher costs of caring for the elderly will increase the total share of spending on elderly care. By 2032, we project spending for the elderly will account for 35 percent of total spending, even though the elderly will account for only 11 percent of Medicaid enrollees. Figure 9: Spending on each elderly enrollee will continue to outpace spending per enrollee on children and working-age adults AVERAGE TOTAL CLAIMS SPENDING PER ENROLLEE BY AGE CATEGORY25
Source: Medicaid Budget Group: MESA Model
25 For more in-depth information about average spending per enrollee by demographic group, see Table 15 in Appendix.
Long Term Forecast of Medicaid Enrollment and Spending in Alaska: 2012 – 2032 14

Chapter 1 – MESA projections results 2012 – 2032
Figure 10: Due in large part to rapid growth in spending on long-term care services, total spending on Medicaid will quadruple between 2012 and 2032 TOTAL CLAIMS SPENDING BY TYPE OF HEALTHCARE SERVICE
Source: Medicaid Budget Group: MESA Model Note: All spending on Medicaid services is categorized into one and only one of these three types of healthcare services Figure 11: Growth in total spending has slowed dramatically in recent years ANNUAL GROWTH IN SPENDING BY SERVICE GROUP
Source: Medicaid Budget Group: MESA Model Figure 11 shows the growth rate in Alaska’s historical and projected Medicaid spending. Spending on Medicaid increased rapidly from 1997 to 2002; annual growth rates never dropped below 10 percent in any year and averaged 16 percent annually for the period. The large spending increases of the late 1990s and early 2000s were brought under control from 2006 through 2008. The slowing down of the growth in spending from 2006 to 2008 was due at least in part to program changes put in place by the Legislature and Department following the release of the Long-Term Forecast of Medicaid Enrollment and Spending in Alaska: 2005-2025 in January 2006. However, with the severe economic recession that hit the country in 2008, enrollment in and spending on Medicaid increased in 2009 and 2010. Medicaid claims spending
Long Term Forecast of Medicaid Enrollment and Spending in Alaska: 2012 – 2032 15

Chapter 1 – MESA projections results 2012 – 2032
in 2010 increased by 13.7 percent over 2009. Medicaid spending is projected to average a 7.6 percent annual growth over the forecast period. Spending on long-term care services, such as Home and Community Based (HCB) Waiver and Personal Care,26 is projected to grow faster than spending on Primary Care and Behavioral Health. Long-term Care, which is expected to grow from 31 percent to 51 percent of total spending, has a larger share of recipients over the age of 65 than either Primary Care or Behavioral Health. Figure 12: Spending on long-term care services will increase as a share of total Medicaid spending PERCENT OF TOTAL CLAIMS SPENDING BY SERVICE GROUP
Source: Medicaid Budget Group: MESA Model Table 6: Long-term care is projected to be the fastest growing service category MEDICAID SPENDING ON CLAIM PAYMENTS BY SERVICE GROUP FOR SELECTED YEARS (IN MILLIONS) Service 2012 2017 2022 2027 2032 Annual Growth
Behavioral Health $162.41 $230.67 $325.23 $456.36 $626.59 6.98%
Long-Term Care $432.66 $761.77 $1,282.49 $2,064.75 $3,075.07 10.30%
Primary Care $789.27 $1,091.61 $1,430.65 $1,830.85 $2,283.65 5.46%
Total $1,384.33 $2,084.04 $3,038.37 $4,351.97 $5,985.31 7.60% Source: Medicaid Budget Group, MESA model. While total Medicaid spending is projected to grow at an average annual rate of 7.6 percent through the forecast period, there is significant variation in the growth rates of the individual services. Spending on HCB Waiver is projected to grow by an average of 9.5 percent per year. Personal Care is projected to grow by 13.1 percent per year. By 2032, HCB Waiver will account
26 The HCB Waiver program allows people who would otherwise need an institutional level of care to live in their home or community and receive the care they need. These “waivers” are approved by the federal government and allow Alaska Medicaid to provide expanded services to people who meet the eligibility criteria for the specific waiver. Home and Community Based Waiver programs help the elderly and disabled, mentally retarded, developmentally disabled, and certain other disabled adults.
Long Term Forecast of Medicaid Enrollment and Spending in Alaska: 2012 – 2032 16

Chapter 1 – MESA projections results 2012 – 2032
for $1.3 billion or 38 percent of Medicaid claims spending, up from the current 35 percent.27 Personal Care will also make large gains, with an increase from 20 percent of total claims spending ($120 million) in 2012 to 41 percent of spending ($1.4 billion) in 2032. Spending in both of these programs is driven largely by growth in enrollment of the elderly. Figure 13: Home and Community Based Waivers and Personal Care are the fastest growing service categories TOTAL CLAIMS SPENDING FOR SELECTED SERVICE CATEGORIES
Source: Medicaid Budget Group, MESA model Conversely, Inpatient Hospital is currently one of the largest categories of spending in 2012, second only to HCB Waiver, and is not as heavily influenced by growth in the enrollment of the elderly. Inpatient Hospital spending is projected to grow by 3.8 percent annually, resulting in a decrease in share of Medicaid spending from 30 percent in 2012 to 11 percent in 2032.28 Despite the relatively high rate of growth in the elderly population, the rate of spending growth for Nursing Homes is projected to be slower than the growth in spending for Medicaid as a whole. As a result, the Nursing Home category will drop from 16 percent of total Medicaid spending in 2012 to 9 percent by 2032. The data suggests that recipients may be shifting from Nursing Homes, where services are received in an institutional setting, to Personal Care and Home and Community Based Waivers, where care is received in one’s own home. Figure 14 shows the growth in total spending by components that affect spending growth. The components of spending growth are as follows: Status Quo refers to what would happen if there were no health cost inflation, no growth in population, and no growth in the use and intensity of services provided. The status quo assumes that everything in future years remains exactly the same as in 2012.
27 See Table 16 in Appendix 28 IBID
Long Term Forecast of Medicaid Enrollment and Spending in Alaska: 2012 – 2032 17

Chapter 1 – MESA projections results 2012 – 2032
Enrollment Growth is the additional cost on top of the status quo resulting from growth in enrollment. Only the increase in total enrollment is taken into account and not demographic changes such as an aging population. Growth in Services includes the additional spending associated with a greater use and intensity of services provided. Growth in services is the result of an aging population and other demographic changes, as well as the change in amount, duration, and scope of services provided from an increase of technology. Inflation is the rate at which the price of a given medical service is expected to increase over time. The component that will have the largest influence on growth in total spending is healthcare price inflation. Without inflation, Medicaid claims spending would increase from $1.3 billion to $3.2 billion in 2032, an average annual growth rate of 4.3 percent. Healthcare price inflation, however, increases the amount of spending in 2032 by an additional $2.8 billion for a total cost of $6.0 billion – a combined annual increase of 7.6 percent over the forecast period. Figure 14: Healthcare price inflation accounts for the largest part of increased claims spending PROJECTED SPENDING ON MEDICAID SERVICES BY INDIVIDUAL COMPONENTS OF GROWTH
Source: Medicaid Budget Group, MESA model State Spending State spending is projected to grow at 7.9 percent annually for the forecast period, compared to a projected 7.3 percent annual growth in federal spending.29 The Federal Financial Participation (FFP) rate that applies to the majority of Medicaid spending is known as the Federal Medical Assistance Percentage (FMAP).30 During the second half of calendar year 2011, the FMAP
29 See Table 18 in Appendix 30 Historically approximately 80 percent of Alaska Medicaid spending is reimbursed at the Regular FMAP rate. Alaska also has a substantial amount of Indian Health Services (IHS) spending, which is reimbursed at 100 percent. Family planning services are
Long Term Forecast of Medicaid Enrollment and Spending in Alaska: 2012 – 2032 18

Chapter 1 – MESA projections results 2012 – 2032
leveled off at 50 percent and is expected to remain approximately at the same level throughout the forecast period. This projection, therefore, does not incorporate possible changes to the rate of federal financial participation in the future. Federal financial participation rates are set at the federal level, and are largely outside of state control. The state’s portion of Medicaid Service costs differs according to the recipient’s Medicaid eligibility group, category of Medicaid service, provider of Medicaid-related service, and Native/Non-native status. Table 7: State share of Medicaid funding increases throughout the forecast period MEDICAID SPENDING BY FUND SOURCE AS A PERCENT OF TOTAL SPENDING, 2012 – 2032
Fund Source 2012 2017 2022 2027 2032 State and Other Match Funds (Percent of Total) 42.2% 42.8% 43.6% 44.4% 45.0%
Federal (Percent of Total) 57.8% 57.2% 56.4% 55.6% 55.0%
Source: Medicaid Budget Group, MESA model. The FMAP is based on a three-year average of per capita personal income, ranked among states. While each state has its own FMAP, it can be no lower than 50 percent. Although the majority of Medicaid benefits are reimbursed at the regular FMAP rate, certain subgroups have higher reimbursement rates (e.g., qualified Indian Health Services claims are reimbursed 100 percent). Where possible, the state contains costs by taking advantage of higher reimbursement rates.
reimbursed at 90 percent. Breast and Cervical Cancer services and Title XXI (CHIP) services are both reimbursed at what is called the “Enhanced FMAP”, which is expected to be about 65 percent throughout the forecast period.
Long Term Forecast of Medicaid Enrollment and Spending in Alaska: 2012 – 2032 19

Chapter 2 – Other Medicaid Payments and Offsets
Chapter 2 – Other Medicaid Payments and Offsets Chapter 2 deals with other (“special”) Medicaid payments and offsetting recoveries, which are not tied to services provided to any individual Medicaid enrollee. The share of total spending attributed to the special payments and offsets varies from year to year. For example, in 2005 the special payments accounted for 13 percent of total Medicaid spending, compared to 5 percent during 2009. These additional payments and offsets include Medicare premium payments, Medicare “clawback” payments, Disproportionate Share Hospital (DSH) payments, Continuing Care Agreement payments, and Tribal Encounter payments.31 Medicare Part A premium payments: Medicare Part A, or Hospital Insurance (HI), is a Medicaid program that helps pay for the costs of hospital stays, including meals, supplies, testing, and a semi-private room. The Medicaid Part A program also pays for home health care such as physical, occupational, and speech therapy that is provided on a part-time basis and deemed medically necessary. Care in a skilled nursing facility as well as certain medical equipment for the aged and disabled such as walkers and wheelchairs are also covered by Part A. Part A is generally available without having to pay a monthly premium, since payroll taxes are used to cover these costs. Medicare Part B premium payments: Medicare Part B is also called Supplementary Medical Insurance (SMI). It helps pay for medically necessary physician visits, outpatient hospital visits, home health care costs, and other services for the aged and disabled. Medicare Part D clawback: Medicare Part D is a federal program to subsidize the costs of prescription drugs for Medicare beneficiaries in the United States. It was enacted as part of the Medicare Prescription Drug, Improvement, and Modernization Act of 2003 (MMA) and went into effect on January 1, 2006. Prior to Medicare Part D going into effect, the state’s Medicaid program paid the drug costs for seniors in the Medicaid program. The federal government now pays the drug benefits for these individuals, but also requires that the state contribute payments on behalf of these individuals. These payments are called the Medicare Part D clawback. Disproportionate Share Hospital (DSH) payments: DSH payments are designed to help hospitals that serve large numbers of Medicaid and uninsured patients. The Medicaid DSH
31 Medicare is a federal program that provides health insurance to people age 65 or older, people under age 65 with certain disabilities, and people of all ages with End Stage Renal Disease. The program is voluntary and beneficiaries must pay monthly premiums. If Medicare beneficiaries have low-income, they may also be eligible for benefits under Medicaid. Because Medicaid is the payer of last resort, Medicare pays for ‘dual-eligible’ beneficiaries’ claims before Medicaid does. Medicaid pays the premium for low-income Medicare Part A and Part B beneficiaries who cannot afford the insurance because it costs substantially less to pay the premium than to pay the claim.
Long Term Forecast of Medicaid Enrollment and Spending in Alaska: 2012 – 2032 20

Chapter 2 – Other Medicaid Payments and Offsets
payments are in addition to Medicaid payments paid to hospitals for services provided to individual Medicaid enrollees. Continuing Care Agreement payments: These payments are paid to Tribal health care providers, which must provide particular services and perform certain administrative functions for children in the Medicaid program. Some of the medical services include the screening, diagnosis, treatment, and referral for follow-up services and physician’s services needed by the recipient for acute, episodic, or chronic illnesses or conditions. Administrative functions include maintaining the recipient’s consolidated health history and submitting any reports that the state Medicaid agency may reasonably require. Reimbursing Tribal continuing care providers for the cost of actually delivering the comprehensive range of health services offered at Tribal facilities helps ensure financial stability for the Tribal health care delivery system. It also avoids the costs (partially state funded) of transporting Medicaid clients elsewhere in the state to receive the health care services they need. Encounter payments: These payments have been used for a quarter-century to pay Indian Health Services (IHS) and tribally operated facilities for services provided to Medicare and Medicaid enrollees. The encounter rate is a flat daily rate per visit that is published annually in the federal register. There are different inpatient and outpatient rates calculated for Alaska and the lower 48 states for Medicaid and Medicare Services. Offsetting recoveries: “Offsetting recoveries” refers to credits used to reduce expenses and they include collections for third-party liability on claims and drug rebates. One of the tenants of Medicaid is that Medicaid is the payer of last resort; therefore, the department does not pay medical claims that are payable by a third party. The department contracts for the collection of medical expenses paid by Medicaid from potential third parties and does not pay medical claims that are payable by a third party. There is uncertainty about the magnitude of the effect that special payments will have on Medicaid spending in the future. The Medicaid program is always changing, and payments that are acceptable one year may be disallowed by Centers for Medicare and Medicaid Services (CMS) in later years.32 Because of this, we are unable to develop reasonable estimates of spending on special Medicaid payments and offsetting recoveries by type. However, on average total spending on these payments historically has been approximately 5 percent of total spending on Medicaid claims. Therefore, special payments are represented in this forecast by adding an additional 5 percent onto the forecast, based on claims data. In any given year, the forecast assumes that the share of total spending paid by the federal government will be the same for these special payments as it was for the claims payments.
32 FairShare and ProShare are two examples of supplemental payment programs that have been discontinued in recent years.
Long Term Forecast of Medicaid Enrollment and Spending in Alaska: 2012 – 2032 21

Chapter 2 – Other Medicaid Payments and Offsets
Table 8: Other Medicaid payments will increase total Medicaid spending in 2032 to $6.3 billion MEDICAID SPENDING BY FUND SOURCE FOR SELECTED YEARS, 2012 – 2032 (IN MILLIONS) 2012 2017 2022 2027 2032
Claims payments
Federal $800.5 $1,192.2 $1,715.0 $2,421.8 $3,291.3 State Match $583.9 $891.9 $1,323.4 $1,930.1 $2,694.0 Total $1,384.3 $2,084.0 $3,038.4 $4,352.0 $5,985.3
Other Payments
Federal $40.0 $59.6 $85.8 $121.1 $164.6 State Match $29.2 $44.6 $66.2 $96.5 $134.7 Total $69.2 $104.2 $151.9 $217.6 $299.3
Total Payments
Federal $840.5 $1,251.8 $1,800.8 $2,542.9 $3,455.9 State Match $613.1 $936.5 $1,389.5 $2,026.6 $2,828.7 Total $1,453.6 $2,188.3 $3,190.3 $4,569.6 $6,284.6
Source: Medicaid Budget Group: MESA Model. Estimates include only the costs for Medicaid services.
Long Term Forecast of Medicaid Enrollment and Spending in Alaska: 2012 – 2032 22

Chapter 3 – Summary
Chapter 3 – Summary We project total spending on Alaska’s Medicaid program to grow at an average annual rate of 7.6 percent over the next 20 years and to reach $6.3 billion by 2032 (see Table 8, page 22). Over this same period, State spending is expected to grow at 8.0 percent and reach $2.8 billion. In addition to healthcare price inflation, which is expected to average 3.3 percent per year, growth in spending on the Medicaid program through 2032 is the result of the following factors: Growth in Alaska’s Population – expected to average 1.0 percent per year Growth in Medicaid Enrollment – expected to average 0.7 percent per year Growth in the Utilization of Medicaid Services – expected to average 0.9 percent per year Growth in Intensity of Service Provided – expected to average 1.7 percent per year The population forecast includes assumptions about the changing demographic profile of Alaska. The average annual growth rate in enrollment of the elderly (65 and older) is expected to be 4.5 percent, which is higher than the growth rate for other age groups. As a result, the overall focus of the Medicaid program will shift from a child-based program to programs more evenly distributed between the elderly, working-age adults, and children. This demographic change affects spending, because spending on the elderly is growing at a rate over double that of children and working-age adults; this growth is likely to continue. A shift in spending towards the elderly is still expected to occur, but the timing will be delayed compared to earlier forecasts. Services used more heavily by the elderly, such as Personal Care and Home and Community Based Waivers, will experience the highest spending growth throughout the forecast period. The purpose of this forecast is to enable policy makers and the Department of Health and Social Services to see where Medicaid is headed, based on key growth components. By looking farther into the future, policy can be based more on proactive rather than reactive measures.
Long Term Forecast of Medicaid Enrollment and Spending in Alaska: 2012 – 2032 23

Appendix A: Medicaid Eligibility Categories
Appendix A: Medicaid Eligibility Classification Descriptions
Eligibility Class Description AFDC & Related Eligible for AFDC-based Family Medicare or Transitional Medicaid Alien (Foreign) Illegal, sponsored, or amnesty alien Exams Disability, waiver, or pregnancy determination pending Kids in Custody Children in custody of DHSS LTC Non-cash Elderly or disabled individual not receiving SSI or cash supplement Medicare Eligible for Medicare cost-sharing assistance only Other Disabled Working disabled or eligible due to breast/cervical cancer screening Pregnancy/Post Partum Eligible during pregnancy and for 60 days after giving birth SSI/APA/LTC Cash Eligible for SSI or other state cash supplement Title XIX Kids Children under age 19 not eligible for coverage under CHIP Title XXI Kids Children under age 19 eligible for coverage under CHIP
Long Term Forecast of Medicaid Enrollment and Spending in Alaska: 2012 – 2032 24

Appendix B: Federal Financial Participation
Appendix B: Federal Financial Participation (FFP) Rates
FFP Type Rate of Federal Financial Participation
Regular Medicaid “FMAP” Not Less than 50 Percent
CHIP “Enhanced FMAP” Regular FMAP + ≈15 percentage points ≈ 65 Percent
Breast and Cervical Cancer “Enhanced FMAP” Regular FMAP + ≈15 percentage points ≈ 65 Percent
Indian Health Services 100 Percent
Family Planning (always 90% federal) 90 Percent
State Only 0 Percent
Long Term Forecast of Medicaid Enrollment and Spending in Alaska: 2012 – 2032 25

Appendix C: Medicaid Service Categories
Appendix C: Medicaid Service Category Descriptions Service Group Service Category Description Behavioral Health
Inpatient Psychiatric Hospital Inpatient psychiatric hospital services
Behavioral Health
Outpatient Mental Health
Outpatient mental health services, psychology services, and drug abuse centers
Behavioral Health
Residential Psychiatric/Behavioral Rehabilitation Services
Residential psychiatric treatment centers and behavioral rehabilitation services (BRS)
Long-term Care Home & Community Based Waiver
Home and community based long-term care services offered through Medicaid Waivers including Alaska Pioneer Homes, assisted living homes, respite care, adult day care, chore services, residential and day habilitation, nutrition, and meals.
Long-term Care Home Health/Hospice Home health services, hospice care, nutrition services, and private duty nursing
Long-term Care Nursing Home Skilled nursing and intermediate care facilities including intermediate-care facilities for the mentally retarded; and temporary long-term care services
Long-term Care Personal Care Personal care attendant services including agency-based and consumer-directed programs
Primary Care Dental Dental services for children and adults
Primary Care Durable Medical Equipment/Supplies
Durable medical equipment (DME), medical supplies, prosthetics, and orthotics
Primary Care Early & Periodic Screening, Diagnosis & Testing
Early, periodic screening, diagnosis and treatment (EPSDT) including preventive health checkups, health screenings and immunizations
Primary Care Health Clinic Health clinic services including rural health clinics, federally-qualified health clinics and tribal health clinics
Primary Care Inpatient Hospital Inpatient hospital services Primary Care Laboratory/X-Ray Laboratory, x-ray and diagnostic services Primary Care Other Services Other services not classified elsewhere
Primary Care Outpatient Hospital Outpatient hospital services, outpatient surgery services, and end-stage renal disease services
Primary Care Pharmacy Prescription drugs
Primary Care Physician/Practitioner Services
Physician, podiatrist, advanced nurse practitioner, and midwifery services
Primary Care Therapy/Rehabilitation Outpatient rehabilitation, physical therapy, occupational therapy, speech therapy, audiology, and chiropractic services
Primary Care Transportation Emergency and non-emergency medically necessary transportation and accommodation
Primary Care Vision Optometrist services and eyeglasses
Long Term Forecast of Medicaid Enrollment and Spending in Alaska: 2012 – 2032 26

Appendix D: Detailed Tables of 2012 – 2032 MESA Forecast
Appendix D: Detailed Tables of 2012-2032 MESA Forecast Table 9: Forecast of Population by Subpopulations
Calendar Year
Annual % Change 2012 2017 2022 2027 2032
State 729,645 776,651 818,817 857,669 893,978 1.02% Gender
Male 378,978 402,145 422,509 441,057 458,239 0.95% Female 350,667 374,506 396,308 416,611 435,739 1.09%
Native Status Native 122,873 130,154 136,682 142,780 148,289 0.94% Non-Native 606,772 646,498 682,135 714,888 745,689 1.04%
Region
Northern 123,415 131,341 138,465 145,253 152,160 1.05% Western 43,156 45,883 48,489 50,903 53,108 1.04% South Central 97,093 100,273 102,847 104,670 105,732 0.43% Anchorage / Mat-Su 394,286 425,896 456,413 485,379 513,070 1.33% Southeast 71,695 73,258 72,603 71,464 69,908 -0.13%
Age Group
0-4 56,137 60,613 61,575 62,202 64,230 0.68% 5-9 52,573 58,400 62,530 63,606 64,337 1.01% 10-14 51,584 54,683 60,052 64,270 65,427 1.20% 15-19 50,463 51,161 54,059 59,375 63,547 1.16% 20-24 54,025 50,330 49,614 52,307 57,427 0.31% 25-34 109,517 114,971 112,101 109,280 112,009 0.11% 35-44 92,854 101,922 115,429 122,455 120,218 1.30% 45-54 106,361 96,545 92,400 99,738 113,069 0.31% 55-64 93,181 100,282 95,738 85,681 81,676 -0.66% 65-74 41,532 60,378 77,074 84,340 80,234 3.35% 75+ 21,417 27,367 38,245 54,415 71,803 6.24%
Long Term Forecast of Medicaid Enrollment and Spending in Alaska: 2012 – 2032 27

Appendix D: Detailed Tables of 2012 – 2032 MESA Forecast
Table 10: Forecast of Enrollment by Subpopulations
Calendar Year Annual %
Change 2012 2017 2022 2027 2032 State 146,476 165,033 181,436 194,504 204,176 1.7%
Gender Male 66,582 74,791 82,491 88,443 92,563 1.7%
Female 79,894 90,242 98,945 106,061 111,612 1.7% Native Status
Native 53,719 59,945 64,851 68,760 71,615 1.4% Non-Native 92,757 105,088 116,585 125,744 132,560 1.8%
Region Northern 18,366 20,988 23,174 24,910 26,222 1.8%
Western 20,947 23,647 25,943 27,831 29,304 1.7% South Central 19,320 21,374 23,004 24,153 24,770 1.3% Anchorage / Mat-Su 74,023 84,023 93,844 102,005 108,443 1.9% Southeast 13,820 15,001 15,471 15,606 15,437 0.6%
Age Group 0-4 32,152 37,104 39,229 40,606 42,272 1.4%
5-9 22,661 28,677 32,202 33,663 34,310 2.1% 10-14 19,835 22,978 26,560 29,249 29,974 2.1% 15-19 18,035 18,234 20,365 23,054 24,842 1.6% 20-24 8,704 7,383 7,496 8,079 8,978 0.2% 25-34 13,645 15,501 15,576 15,510 16,031 0.8% 35-44 8,574 9,759 11,372 12,334 12,254 1.8% 45-54 7,794 6,113 5,990 6,574 7,497 -0.2% 55-64 5,814 7,296 7,154 6,494 6,216 0.3% 65-74 4,874 6,370 8,147 9,344 9,277 3.3% 75+ 4,389 5,619 7,343 9,598 12,524 5.4%
Long Term Forecast of Medicaid Enrollment and Spending in Alaska: 2012 – 2032 28

Appendix D: Detailed Tables of 2012 – 2032 MESA Forecast
Table 11: Enrollment Rates by Subpopulations Calendar Year Annual %
Change 2012 2017 2022 2027 2032 State 20.1% 21.2% 22.2% 22.7% 22.8% 0.6% Gender Male 17.6% 18.6% 19.5% 20.1% 20.2% 0.7% Female 22.8% 24.1% 25.0% 25.5% 25.6% 0.6% Native Status Native 43.7% 46.1% 47.4% 48.2% 48.3% 0.5% Non-Native 15.3% 16.3% 17.1% 17.6% 17.8% 0.8% Region Northern 14.9% 16.0% 16.7% 17.1% 17.2% 0.7% Western 48.5% 51.5% 53.5% 54.7% 55.2% 0.6% South Central 19.9% 21.3% 22.4% 23.1% 23.4% 0.8% Anchorage / Mat-Su 18.8% 19.7% 20.6% 21.0% 21.1% 0.6% Southeast 19.3% 20.5% 21.3% 21.8% 22.1% 0.7% Age Group 0-4 57.3% 61.2% 63.7% 65.3% 65.8% 0.7% 5-9 43.1% 49.1% 51.5% 52.9% 53.3% 1.1% 10-14 38.5% 42.0% 44.2% 45.5% 45.8% 0.9% 15-19 35.7% 35.6% 37.7% 38.8% 39.1% 0.4% 20-24 16.1% 14.7% 15.1% 15.4% 15.6% -0.1% 25-34 12.5% 13.5% 13.9% 14.2% 14.3% 0.7% 35-44 9.2% 9.6% 9.9% 10.1% 10.2% 0.5% 45-54 7.3% 6.3% 6.5% 6.6% 6.6% -0.5% 55-64 6.2% 7.3% 7.5% 7.6% 7.6% 1.0% 65-74 11.7% 10.5% 10.6% 11.1% 11.6% -0.1% 75+ 20.5% 20.5% 19.2% 17.6% 17.4% -0.8% Table 12: Enrollment Levels by Eligibility Groups
Calendar Year Annual %
2012 2017 2022 2027 2032 Change AFDC & Related 47,387 51,621 55,015 57,469 59,280 1.13% Title XIX Kids 6,741 7,012 7,211 7,488 7,886 0.79% Title XXI Kids 44,410 50,207 54,393 57,064 58,729 1.41% Pregnancy/Post Partum 13,229 15,018 16,552 17,536 17,986 1.55% Kids in Custody 4,585 5,146 5,624 5,942 6,096 1.43% Alien (Foreign) 4 5 5 6 7 2.83% SSI/APA/LTC Cash 25,651 30,609 36,054 41,123 45,096 2.86% LTC Non-cash 2,596 3,227 4,049 5,011 5,953 4.24% Other Disabled 476 635 809 961 1,058 4.08% Medicare 552 601 634 651 664 0.93% Exams 846 952 1,089 1,253 1,421 2.63% Total (Undup. Count) 146,476 165,033 181,436 194,504 204,176 1.67%
Long Term Forecast of Medicaid Enrollment and Spending in Alaska: 2012 – 2032 29

Appendix D: Detailed Tables of 2012 – 2032 MESA Forecast
Table 13: Total Spending on Medicaid Services by Subpopulations (in millions)
Calendar Year Annual %
Change 2012 2017 2022 2027 2032 State $1,384.3 $2,084.0 $3,038.4 $4,352.0 $5,985.3 7.6%
Gender Male $605.7 $920.5 $1,348.8 $1,932.9 $2,649.6 7.7% Female $778.6 $1,163.6 $1,689.6 $2,419.1 $3,335.7 7.5%
Native Status Native $464.0 $687.6 $984.1 $1,387.3 $1,883.5 7.3% Non-Native $920.3 $1,396.4 $2,054.3 $2,964.6 $4,101.8 7.8%
Region Northern $146.1 $222.0 $326.4 $470.6 $651.4 7.8% Western $151.8 $228.3 $332.1 $474.7 $652.3 7.6% South Central $214.0 $314.9 $451.2 $635.5 $857.4 7.2% Anchorage / Mat-Su $716.5 $1,093.7 $1,619.8 $2,353.7 $3,281.1 7.9% Southeast $156.0 $225.2 $308.8 $417.5 $543.2 6.4%
Age Group 0-4 $176.1 $266.1 $360.9 $472.4 $609.3 6.4% 5-9 $83.8 $131.9 $190.0 $251.2 $317.1 6.9% 10-14 $115.6 $175.0 $259.5 $361.3 $458.5 7.1% 15-19 $148.8 $216.9 $310.6 $444.1 $592.6 7.2% 20-24 $97.5 $123.5 $160.0 $216.9 $297.5 5.7% 25-34 $152.8 $217.7 $279.5 $350.5 $447.3 5.5% 35-44 $106.3 $158.4 $235.8 $322.3 $395.4 6.8% 45-54 $141.6 $173.0 $216.6 $299.7 $422.3 5.6% 55-64 $133.2 $195.8 $245.8 $281.4 $333.0 4.7% 65-74 $82.3 $167.8 $293.7 $432.5 $536.2 9.8% 75+ $146.2 $258.0 $485.9 $919.6 $1,576.1 12.6%
Long Term Forecast of Medicaid Enrollment and Spending in Alaska: 2012 – 2032 30

Appendix D: Detailed Tables of 2012 – 2032 MESA Forecast
Table 14: Spending per Enrollee on Medicaid Services by Subpopulations Calendar Year Annual %
Change 2012 2017 2022 2027 2032 State $9,451 $12,628 $16,746 $22,375 $29,315 5.8% Gender Male $9,097 $12,307 $16,350 $21,855 $28,625 5.9% Female $9,746 $12,894 $17,076 $22,808 $29,886 5.8% Native Status Native $8,638 $11,471 $15,175 $20,177 $26,300 5.7% Non-Native $9,922 $13,288 $17,620 $23,577 $30,943 5.9% Region Northern $7,954 $10,579 $14,084 $18,891 $24,841 5.9% Western $7,246 $9,653 $12,802 $17,055 $22,260 5.8% South Central $11,076 $14,731 $19,614 $26,312 $34,613 5.9% Anchorage / Mat-Su $9,679 $13,017 $17,261 $23,075 $30,256 5.9% Southeast $11,287 $15,010 $19,961 $26,754 $35,187 5.8% Age Group 0-4 $5,476 $7,172 $9,201 $11,634 $14,413 5.0% 5-9 $3,697 $4,599 $5,901 $7,461 $9,242 4.7% 10-14 $5,828 $7,614 $9,768 $12,352 $15,297 4.9% 15-19 $8,253 $11,897 $15,250 $19,265 $23,854 5.5% 20-24 $11,207 $16,724 $21,338 $26,854 $33,139 5.6% 25-34 $11,199 $14,044 $17,942 $22,601 $27,900 4.7% 35-44 $12,401 $16,232 $20,736 $26,126 $32,266 4.9% 45-54 $18,170 $28,297 $36,166 $45,588 $56,327 5.8% 55-64 $22,915 $26,832 $34,363 $43,335 $53,573 4.3% 65-74 $16,890 $26,348 $36,055 $46,291 $57,800 6.3% 75+ $33,313 $45,924 $66,172 $95,817 $125,854 6.9%
Long Term Forecast of Medicaid Enrollment and Spending in Alaska: 2012 – 2032 31

Appendix D: Detailed Tables of 2012 – 2032 MESA Forecast
Table 15: Spending on Medicaid Services by Service Category (in millions)
Service
Calendar Year Annual % Change 2012 2017 2022 2027 2032
Dental $61.4 $93.3 $132.0 $180.1 $236.2 7.0% DME/Supplies $19.4 $28.3 $39.8 $55.1 $73.7 6.9% EPSDT $0.0 $0.0 $0.0 $0.0 $0.0 0.2% HCB Waiver $212.5 $363.9 $586.8 $907.2 $1,318.5 9.6% Health Clinic $57.8 $89.3 $125.8 $169.4 $219.3 6.9% Home Health/Hospice $6.0 $8.7 $12.5 $17.9 $25.2 7.5% Inpatient Hospital $183.4 $233.8 $283.6 $337.1 $393.3 3.9% Inpatient Psychiatric $19.2 $31.4 $51.5 $78.6 $110.4 9.1% Lab/X-ray $2.4 $3.0 $3.7 $4.4 $5.2 4.0% Nursing Home $94.7 $133.3 $188.1 $258.1 $320.1 6.3% Other Services $0.1 $0.1 $0.1 $0.1 $0.1 0.9% Outpatient Hospital $144.2 $199.0 $260.6 $334.2 $418.9 5.5% Outpatient Mental Health $111.0 $148.0 $191.2 $244.4 $305.9 5.2% Personal Care $119.5 $256.4 $498.2 $890.9 $1,439.6 13.3% Pharmacy $89.7 $119.8 $154.3 $196.2 $244.3 5.1% Physician/Practitioner $133.2 $184.0 $241.9 $313.8 $399.4 5.6% Residential Psych/BRC $32.2 $50.3 $75.5 $109.4 $149.7 8.0% Therapy/Rehabilitation $24.2 $35.3 $48.5 $64.4 $81.9 6.3% Transportation $67.5 $96.8 $131.0 $172.4 $219.5 6.1% Vision $5.9 $9.3 $13.4 $18.4 $24.1 7.3%
Total Service Spending $1,384.3 $2,084.0 $3,038.4 $4,352.0 $5,985.3 7.6%
Long Term Forecast of Medicaid Enrollment and Spending in Alaska: 2012 – 2032 32

Appendix D: Detailed Tables of 2012 – 2032 MESA Forecast
Table 16: Average Spending per Recipient by Service Category (in dollars) Calendar Year Annual %
Change Service 2012 2017 2022 2027 2032 Dental $1,049 $1,275 $1,539 $1,883 $2,296 4.0% DME/Supplies $1,454 $1,714 $2,009 $2,394 $2,869 3.5% EPSDT $162 $163 $165 $168 $170 0.2% HCB Waiver $34,560 $41,704 $49,794 $60,450 $73,723 3.9% Health Clinic $1,477 $1,711 $1,949 $2,249 $2,615 2.9% Home Health/Hospice $9,180 $11,220 $13,844 $17,588 $22,647 4.6% Inpatient Hospital $11,206 $13,110 $15,044 $17,321 $19,981 2.9% Inpatient Psychiatric $19,296 $26,818 $39,138 $55,096 $73,303 6.9% Lab/X-ray $150 $178 $208 $245 $290 3.4% Nursing Home $95,631 $123,337 $157,896 $200,284 $243,417 4.8% Other Services $446 $535 $637 $769 $923 3.7% Outpatient Hospital $2,009 $2,360 $2,732 $3,195 $3,750 3.2% Outpatient Mental Health $8,890 $11,080 $13,714 $17,189 $21,564 4.5% Personal Care $25,682 $35,830 $48,450 $65,112 $85,907 6.2% Pharmacy $1,143 $1,347 $1,577 $1,865 $2,209 3.3% Physician/Practitioner $1,273 $1,503 $1,759 $2,096 $2,514 3.5% Residential Psychiatric/BRC $49,289 $63,485 $82,983 $109,421 $141,011 5.4% Therapy/Rehabilitation $2,697 $3,204 $3,753 $4,426 $5,188 3.3% Transportation $2,588 $3,084 $3,603 $4,230 $4,961 3.3% Vision $199 $239 $281 $333 $394 3.5% Total Service Spending $2,826 $3,552 $4,504 $5,809 $7,422 4.9%
Long Term Forecast of Medicaid Enrollment and Spending in Alaska: 2012 – 2032 33

Appendix D: Detailed Tables of 2012 – 2032 MESA Forecast
Table 17: Forecast of State Claims Spending by Service Category (in millions) Calendar Year Annual %
Change Service 2012 2017 2022 2027 2032 Dental $23.6 $36.0 $51.0 $69.5 $90.9 7.0% DME/Supplies $9.7 $14.1 $19.9 $27.5 $36.7 6.9% EPSDT $0.0 $0.0 $0.0 $0.0 $0.0 0.0% HCB Waiver $104.2 $179.1 $289.4 $448.5 $651.5 9.6% Health Clinic $4.5 $7.0 $9.9 $13.4 $17.3 6.9% Home Health/Hospice $2.7 $3.9 $5.6 $8.0 $11.3 7.5% Inpatient Hospital $70.5 $90.2 $109.4 $130.0 $151.3 3.9% Inpatient Psychiatric $9.4 $14.7 $24.8 $39.5 $58.7 9.6% Lab/X-ray $1.2 $1.5 $1.8 $2.2 $2.6 4.0% Nursing Home $45.4 $65.6 $92.8 $127.6 $158.2 6.4% Other Services $0.1 $0.1 $0.1 $0.1 $0.1 0.9% Outpatient Hospital $48.2 $66.8 $87.5 $112.2 $140.3 5.5% Outpatient Mental Health $50.5 $69.6 $92.3 $122.9 $162.7 6.0% Personal Care $59.6 $126.2 $245.7 $440.5 $711.3 13.2% Pharmacy $37.4 $50.1 $64.6 $82.1 $102.0 5.1% Physician/Practitioner $55.7 $77.2 $101.6 $131.6 $167.1 5.6% Residential Psych/BRC $15.6 $23.6 $36.4 $55.0 $79.6 8.5% Therapy/Rehabilitation $11.3 $16.5 $22.7 $30.2 $38.3 6.3% Transportation $31.4 $45.2 $61.2 $80.5 $102.2 6.1% Vision $2.9 $4.5 $6.5 $8.9 $11.6 7.3%
Total Service Spending $583.9 $891.9 $1,323.4 $1,930.1 $2,694.0 7.9%
Table 18: Historical Enrollment by Demographic Group
Year Non-
Native Native Female Male Children Working
Age Elderly Total 1997 59,803 30,327 52,149 37,981 53,098 31,290 5,742 90,130 1998 58,154 30,572 50,967 37,759 52,103 30,754 5,869 88,726 1999 62,994 32,840 54,381 41,453 58,296 31,444 6,094 95,834 2000 72,898 37,368 61,889 48,377 71,649 32,133 6,484 110,266 2001 76,732 39,524 64,603 51,653 77,477 32,038 6,741 116,256 2002 80,588 41,021 67,201 54,408 81,677 32,943 6,989 121,609 2003 84,045 42,621 69,828 56,838 85,171 34,116 7,379 126,666 2004 84,943 44,611 71,305 58,249 87,027 34,946 7,581 129,554 2005 85,450 46,569 72,742 59,277 87,485 36,619 7,915 132,019 2006 85,269 47,695 73,215 59,749 87,232 37,433 8,299 132,964 2007 81,048 47,027 70,580 57,495 83,930 35,829 8,316 128,075 2008 78,813 46,325 68,745 56,393 81,694 35,126 8,318 125,138 2009 80,670 47,274 70,193 57,751 82,930 36,578 8,436 127,944 2010 85,733 49,353 74,014 61,072 86,502 39,849 8,735 135,086
Long Term Forecast of Medicaid Enrollment and Spending in Alaska: 2012 – 2032 34

Appendix E: Glossary and Definition of Terms
Appendix E: Glossary and Definition of Terms ADLWD: Alaska Department of Labor and Workforce Development AFDC: Aid to Families with Dependent Children APA: Adult Public Assistance BCC: Breast and Cervical Cancer BEA: Bureau of Economic Analysis BRS: Behavioral Rehabilitation Services CHIP: Children’s Health Insurance Program CMS: Center for Medicare and Medicaid Services CPI: Consumer Price Index CY: Calendar Year DME: Durable Medical Equipment DSH: Disproportionate Share Hospital EPSDT: Early & Periodic Screening, Diagnosis and Treatment FFP: Federal Financial Participation FFY: Federal Fiscal Year FMAP: Federal Medical Assistance Percentage FY: Fiscal Year GDP: Gross Domestic Product HCB: Home and Community Based IHS: Indian Health Services HSS: Alaska Department of Health and Social Services ISER: Institute for Social and Economic Research JUCE: Juneau Claims and Eligibility System LTC: Long Term Care MMIS: Medicaid Management Information System PCPI: Per Capital Personal Income PDL: Preferred Drug List SCHIP: State Children’s Health Insurance Program/Denali KidCare SFY: State Fiscal Year SHP: Supplemental Hospital Payments SSI: Supplemental Security Income SURS Surveillance and Utilization Review System Title XIX: Medicaid Title XXI: CHIP, which is an expansion to Alaska’s Medicaid program that receives
an enhanced FMAP TPL: Total Personal Income TPL: Third Party Liability
Long Term Forecast of Medicaid Enrollment and Spending in Alaska: 2012 – 2032 35

Appendix E: Glossary and Definition of Terms
SPONSORED ALIEN: A sponsored alien is an alien admitted into the United States for permanent residence as defined in the immigration and Nationality Act and, as a condition of entry, was sponsored by a person who executed an affidavit of support for the alien. Sponsored Alien is ineligible for Supplemental Security Income/Adult Public assistance. SSI “1619” ELIGIBLE: Section 1619(b) Blind or disabled individuals who have had their SSI eligibility maintained for Medicaid purposes by section 1619(b) of the Social Security Act. SSI ELIGIBLE WHO HAVE NOT APPLIED FOR SSI: This phrase refers to those applicants who are ineligible for Supplemental Security Income/Adult Public assistance because of requirements that do not apply to Medicaid. TITLE IV-E SUBSIDIZED ADOPTION: Title IV-E is created to prevent unnecessary placement of children from low-income families by offering state fiscal incentives for providing preventive services. Title IV-E subsidized adoption program is to ensure that “special needs” children who are difficult to place in adoptive homes do not remain in foster care solely for financial reasons. TITLE XIX: Title XIX of the Social Security Act is the federal legislation that established Medicaid, a joint federal state program that provides Medical Assistance to low-income consumers of all ages who need care but cannot afford it. TITLE XXI: Title XXI of the Social Security Act provides funds to States to enable them to initiate and expand the provision of child health assistance to uninsured, low-income children in an effective and efficient manner that is coordinated with other sources of health benefits coverage for children.
Long Term Forecast of Enrollment and Spending in Alaska: 2012 – 2032 36
Appendix E: Glossary and Definition of Terms
This page is intentionally left
blank
Long Term Forecast of Medicaid Enrollment and Spending in Alaska: 2012 – 2032 37

Long-term Forecast of
Medicaid Enrollment
and
Spending in Alaska:
Supplement 2012–2032
For more information on this report, contact:
Alaska Department of Health and Social Services Finance and Management Services
350 Main Street P.O. Box 110650
Juneau Alaska 99811-0650 Phone: (907) 465-3331 Fax: (907) 465-1850
This report is available on the Internet at:
http://dhss.alaska.gov/fms
Material in this publication is public information and, with appropriate credit, may be reproduced without permission.