Embed Size (px)
Citation preview

©2016 SCIO Health Analytics®. Confidential and Proprietary. All rights reserved. |1
SCIO Health Analytics®
Leveraging Analytics in a Value-
Based Reimbursement World
October 17, 2016

©2016 SCIO Health Analytics®. Confidential and Proprietary. All rights reserved. |5
MARKET DRIVERS

©2016 SCIO Health Analytics®. Confidential and Proprietary. All rights reserved. |6
Provider Consolidation and Shifting Care
Traditional Fee for Service
Patient PCP
Hospital
Lab
Specialist
SNF

©2016 SCIO Health Analytics®. Confidential and Proprietary. All rights reserved. |7
Provider Consolidation and Shifting Care
Traditional Fee for Service
Patient PCP
Hospital
Lab
Specialist
SNF
RegulationsTechnology Needs
PenaltiesComplex Patients

©2016 SCIO Health Analytics®. Confidential and Proprietary. All rights reserved. |8
Provider Consolidation and Shifting Care
New Types of Organizations: ACOs, IDNs, CINs, PCMHs, and Others
Hospital
Primary Care Provider
Aftercare Provider
Clinic
PayviderSNF
Testing Center
Provider Groups
Home Care
Patient
©2016 SCIO Health Analytics®. Confidential and Proprietary. All rights reserved. |9
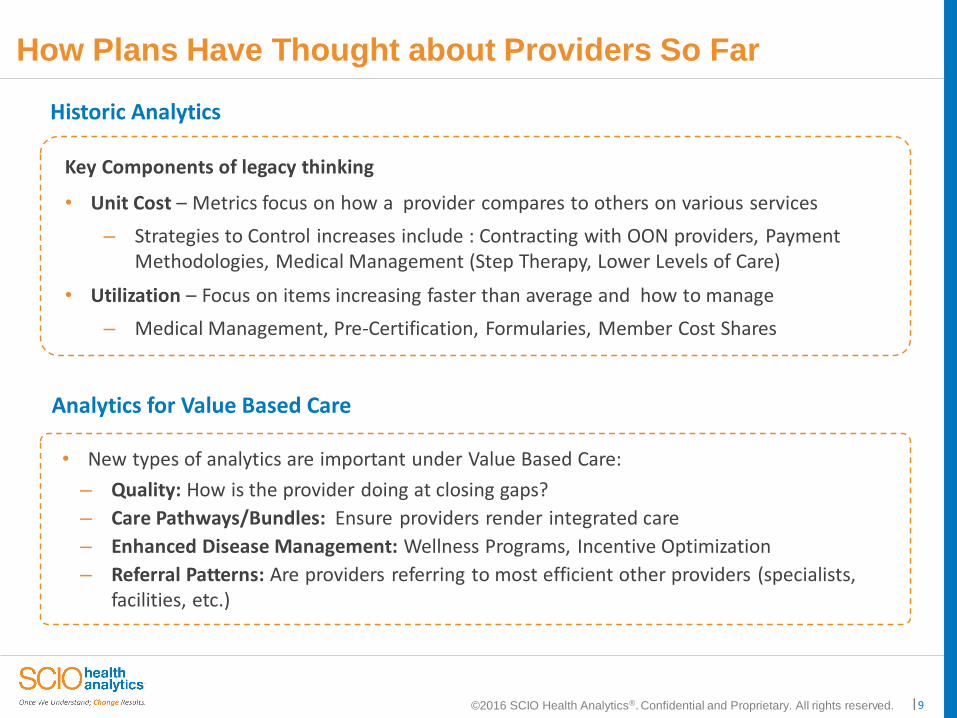
How Plans Have Thought about Providers So Far
Analytics for Value Based Care
• New types of analytics are important under Value Based Care:
– Quality: How is the provider doing at closing gaps?
– Care Pathways/Bundles: Ensure providers render integrated care
– Enhanced Disease Management: Wellness Programs, Incentive Optimization
– Referral Patterns: Are providers referring to most efficient other providers (specialists, facilities, etc.)
Historic Analytics
Key Components of legacy thinking
• Unit Cost – Metrics focus on how a provider compares to others on various services
– Strategies to Control increases include : Contracting with OON providers, Payment Methodologies, Medical Management (Step Therapy, Lower Levels of Care)
• Utilization – Focus on items increasing faster than average and how to manage
– Medical Management, Pre-Certification, Formularies, Member Cost Shares

©2016 SCIO Health Analytics®. Confidential and Proprietary. All rights reserved. |10
Impact of These Shifts
Customers
Consumers become money managers
Increased focus on wellness & prevention
Aging Populations with Chronic Conditions
Providers
New reimbursement models that shift risk
& favor value over volume
Changing organizational structures
(Hospitals employing physicians)
New Services (Personalized Medicine)
Shift care to lower intensity settings:
outpatient, nursing facilities and home
Changes create new risks for payment
errors, abuse, and fraud
Efficiency Quality Satisfaction
Employers Members

©2016 SCIO Health Analytics®. Confidential and Proprietary. All rights reserved. |11
MANAGING COST & CARE ACROSS THE
CONTINUUM

©2016 SCIO Health Analytics®. Confidential and Proprietary. All rights reserved. |12
Thriving in a Value-Based Reimbursement World
• Understanding How Individuals Vary in Impactability and Population Health Needs
Identifying Highest Risk Individuals (Illness and Cost)
• Utilizing Assessment and Targeting Analytics in Managing Finite Resources
Leveraging the Right Resources to Optimize Clinical
and Financial Results
• Engaging Providers in Managing and Optimizing Network Performance
Delivering Care in the Optimal Site of Service and Intensity of
Service
• Establishing Data Sharing and Transparency Collaborating with Key Stakeholders: Payers, Providers, & Patients
Challenge Analytic Needs

©2016 SCIO Health Analytics®. Confidential and Proprietary. All rights reserved. |13
Using Analytics to Better Understand
1. Identify Outliers
2. Engage
3. Measure Results

©2016 SCIO Health Analytics®. Confidential and Proprietary. All rights reserved. |14
The Foundation of Actionable Analytics: Robust Profiles
Behaviors & Attitudes
Demographic & Attribution
Clinical Factors
Cost & Quality
Utilization
Risk

©2016 SCIO Health Analytics®. Confidential and Proprietary. All rights reserved. |15
Example of Personas – Member / Patient Analysis
HEALTHY & AFFLUENT
BALANCEDADULTS
HIGH UTILIZERSQUALITYDRIVEN
COSTCONSCIOUS
CHRONIC OLDER ADULTS
HIGH COST BABY
BOOMERS
No.of chronic
conditions
ER Paid PMPM
IP Paid PMPM
ER Utilization
IP Utilization
0.540.70 0.71
0.86 0.82
1.021.13
Median Risk Prospective Score
0.6 0.7 0.8 1.2 1.2 1.3 1.6
0.09 0.05 0.10 0.04 0.07 0.08 0.09
0.25 0.22 0.34 0.23 0.18 0.21 0.23
$75 $73 $147 $54 $75 $118 $248
$10 $9 $14 $9 $7 $10 $11

©2016 SCIO Health Analytics®. Confidential and Proprietary. All rights reserved. |16
POPULATION HEALTH ANALYTICS:
FINDING MEMBERS YOU CAN IMPACT

©2016 SCIO Health Analytics®. Confidential and Proprietary. All rights reserved. |17
Precise Care: Higher Quality and Lower Costs
TOTAL POPULATION
ACTIONABLE MEMBERS

©2016 SCIO Health Analytics®. Confidential and Proprietary. All rights reserved. |18
View Members Through the Lens of Impactability
Population
100%
Impactability Prospective Risk
Moderate Impactability
12% of Members
Low Impactability
75% of Members
High Impactability
12% of Members
High
Low
Op
po
rtun
ity
Goal
Close Gaps and Steerage
to Managed
Networks
Close Gaps and Steerage
to Managed
Networks
Manage High Costs
and Risk
Factors
Manage High Costs
High Risk
10%
Moderate Risk
1.5%
Low Risk
0.5%
High Risk
8%
Moderate Risk
3%
Low Risk
1%
High Risk
13.5%
Moderate Risk
27%
Low Risk
34.5%
High Cost
1% of Members

©2016 SCIO Health Analytics®. Confidential and Proprietary. All rights reserved. |19
Allocate Resources Towards Impactable Conditions
Diabetes, $326,515,914
COPD, $56,262,780
Seizures, $20,743,606
Obesity, $53,401,848
Rheumatoid Arthritis, $47,819,586
Inflammatory Bowel, $13,258,925
Back Pain, $303,270,098
Depression, $158,480,248
Hyperlipidemia, $326,077,730
Asthma, $119,587,531 CHF, $69,839,071
Maternity, $69,955,753
CKD, $48,898,470
Parkinson Disease, $1,602,486
CAD, $112,816,271
Hypertension, $497,076,823
-10
-8
-6
-4
-2
0
2
4
6
8
10
-10.0 -8.0 -6.0 -4.0 -2.0 0.0 2.0 4.0 6.0 8.0 10.0
Condition Intervention Summary
Harder to Impact
More Complex Interventions
Less Complex Interventions
Easier to Impact
High Volume Silent Diseases
High Volume Symptomatic Diseases
Maternity
Symptomatic Chronic Low Numbers
Diabetes, $497,076,823
Hypertension,
$326,515,914

©2016 SCIO Health Analytics®. Confidential and Proprietary. All rights reserved. |20
Allocate Resources Towards Impactable Conditions
Diabetes, $326,515,914
COPD, $56,262,780
Seizures, $20,743,606
Obesity, $53,401,848
Rheumatoid Arthritis, $47,819,586
Inflammatory Bowel, $13,258,925
Back Pain, $303,270,098
Depression, $158,480,248
Hyperlipidemia, $326,077,730
Asthma, $119,587,531 CHF, $69,839,071
Maternity, $69,955,753
CKD, $48,898,470
Parkinson Disease, $1,602,486
CAD, $112,816,271
Hypertension, $497,076,823
-10
-8
-6
-4
-2
0
2
4
6
8
10
-10.0 -8.0 -6.0 -4.0 -2.0 0.0 2.0 4.0 6.0 8.0 10.0
Condition Intervention Summary
Harder to Impact
More Complex Interventions
Less Complex Interventions
Easier to Impact
High Volume Silent Diseases
High Volume Symptomatic Diseases
Maternity
Symptomatic Chronic Low Numbers
Diabetes, $497,076,823
Hypertension,
$326,515,914
Optimal Interventions for Diabetes
1 Eye Exam
2 HbA1c
3 Lipid Test
4 Medication Regimen Compliance

©2016 SCIO Health Analytics®. Confidential and Proprietary. All rights reserved. |21
Prioritize Care Gap Closure at an Individual Level
Member ID Risk Score Impactability Score Gap1 Gap2 Gap3
000000010506 0.89 1.68 Diabetes - Consider Foot Exam HbA1c Less Than 7 Target
000000010331 0.83 1.51 Lipid Panel Spirometry
000000010043 0.81 1.64 Consider Pulmonary Rehabilitation AST Test Physical Therapy
000000010154 0.73 1.39 Lipid Panel Spirometry Alpha-Glucosidase
000000010539 0.73 1.04Diabetes and Macroalbuminuria - Consider
Adding an ACE Inhibitor or ARB
Diabetics 50 years and Older - Consider
Screening for Peripheral Arterial Disease
Member ID
In Last 12 Months Cost Incurred in Last 12 Months Probability
of ER
Admission
Predicted
Probability of ER
Admit IF all the
gaps are closed
DifferenceImpactability
Score#
Hospitalization
# ER
Visits
InPatient
(PMPM)
ER
(PMPM)
OutPatient
(PMPM)
Professional
(PMPM)
Pharmacy
(PMPM)
000000010506 1 1 $2,999 $302 $209 $201 $130 93% 22% 71% 1.68
000000010331 0 0 $237 $158 $147 90% 27% 64% 1.51
000000010043 0 2 $287 $231 $225 $133 91% 22% 69% 1.64
000000010154 0 0 $231 $178 $103 74% 16% 58% 1.39
000000010539 0 0 $340 $181 $96 70% 27% 44% 1.04
000000010507 0 0 $333 $208 $134 73% 24% 49% 1.15

©2016 SCIO Health Analytics®. Confidential and Proprietary. All rights reserved. |22
Understanding Patient Risk with Analytics
1WHERE ARE HIGH RISK
PATIENTS?2
WHAT ARE THE PATIENT PERSONA TRENDS,
AND WHAT IS DRIVING THE RESULT?
3WHAT GAPS IN CARE ARE DRIVING
PATIENT COSTS?4
WHAT ARE MY QUALITY MEASURE GAPS?
WHERE DO WE AGREE ON RISK?

©2016 SCIO Health Analytics®. Confidential and Proprietary. All rights reserved. |23
ANALYTICS TO STANDARDIZE CARE AROUND TOP
PERFORMERS & WATCH FOR ABERRANCIES

©2016 SCIO Health Analytics®. Confidential and Proprietary. All rights reserved. |24
Network Analytics – The Need
Focus resources on areas to improve risk-
adjusted utilization against benchmarks in
key areas
Insight into performance on quality
measures
Drive improved efficiency (both
utilization & unit cost)
Demonstrate opportunities to
improve network leakage (based on hypothesis of why)

©2014 SCIO Health Analytics®. Confidential and Proprietary. All rights reserved. |25
Case Study
Evaluation of Provider Quality and Efficiency – Advanced Analysis
EFFICIENCY RESULTS QUALITY RESULTS
OVERALL RESULTS
Provider Analytics: Attribution, Performance
Physician ID
Total Members
ObservedCost/
Member
Expected Cost/
Member
Efficiency(Observed/ Expected)
00001 53 $11,939 $10,450 1.14
00002 46 $7,987 $9,052 0.88
00003 42 $7,460 $9,925 0.75
00004 39 $14,218 $12,150 1.17
Physician ID
Total Members
ObservedGap
Expected Gap
Quality (Observed/ Expected)
00001 53 42% 47% 0.89
00002 46 47% 45% 1.04
00003 42 45% 48% 0.94
00004 39 45% 50% 0.90
Physician ID
Total Members
Efficiency(Observed/ Expected)
Quality (Observed/ Expected)
00001 53 1.14 0.89
00002 46 0.88 1.04
00003 42 0.75 0.94
00004 39 1.17 0.90
Best Combination of
Efficiency & Quality

©2016 SCIO Health Analytics®. Confidential and Proprietary. All rights reserved. |26
The Squeeze is On: Increase in Outpatient Care
Chronic Condition Management
RAC Audits
Readmission Penalties
Inpatient Care
OutpatientCare

©2016 SCIO Health Analytics®. Confidential and Proprietary. All rights reserved. |27
The Outpatient Challenge
Various Forces are Driving Treatment to Lower Levels of Care
Target
• Good/Better Outcomes for Patients
• Typically Lower Cost
• Increased patient satisfaction
COMBINE TO DRIVE EXCESSIVE OUTPATIENT UTILIZATION
External Forces
Coordinated Care Management,
Re-Admission Penalties
RAC Short Stay Audits.
Internal Strategies
Converting Buildings
Buying Ancillary Providers
Moving Care from Office to OP
As Inpatient services are shrinking, Hospitals are Providing more Services in
Outpatient Settings. They are also adjusting to Balance Revenue lost from
reduced inpatient stays

©2016 SCIO Health Analytics®. Confidential and Proprietary. All rights reserved. |28
• “Improved” efficiency
• Unclear if this was a net improvement for the system as a whole
• Things not included in bonus might get more expensive
• Possible incentive to misrepresent the risk of their population
Unexpected Consequences of Value-Based Programs
Before Incentive
Par Doctor
Facility 1
Facility 2
$$$
$
After Incentive
Par Doctor
Facility 1
Facility 2
$$$
$
Concerns:

©2016 SCIO Health Analytics®. Confidential and Proprietary. All rights reserved. |29
PAYER-PROVIDER COLLABORATION:
WORKING TOGETHER TOWARDS COMMON GOALS

©2016 SCIO Health Analytics®. Confidential and Proprietary. All rights reserved. |30
Payer, Provider, and Patient Engagement
Am I compensated
correctly?
Do I have all the data I
need?
Am I receiving the best care?
Transparent
Data Sharing Supports
Care & Revenue Optimization

©2016 SCIO Health Analytics®. Confidential and Proprietary. All rights reserved. |31
Analytics Driving Engagement Outreach

©2016 SCIO Health Analytics®. Confidential and Proprietary. All rights reserved. |32
Small Improvements Carry Significant Revenue Implications
Calculation: $800 average pmpm payment x RAF
A 45,000 member health plan purchases Medicare risk adjustment
and HEDIS/Star/P4P monitoring analytics
Within 90 days their systems are online to support new suspecting and provider collaboration programs:
• Identification: A prioritized list of all patients that need to be seen by 12/31 to ensure care gaps are closed
and revenue streams remain constant
• Provider Collaboration: Each morning physicians receive patient-specific pre-populated forms containing
previously diagnosed conditions and any outstanding Stars measure assessments needed for that member.
PMPM Revenue
In two months, the health plan increases their average Medicare RAF score from .95 to .98 and sees significant
improvement on a number of clinical Star measures
$760
$784
$0 $100 $200 $300 $400 $500 $600 $700 $800 $900
.98 RAF
.95 RAF
Pre-Solution Revenue Post-Solution Revenue
$24

©2016 SCIO Health Analytics®. Confidential and Proprietary. All rights reserved. |33
Small Improvements Carry Significant Revenue Implications
Calculation: $800 average pmpm payment x RAF
A 45,000 member health plan purchases Medicare risk adjustment
and HEDIS/Star/P4P monitoring analytics
Within 90 days their systems are online to support new suspecting and provider collaboration programs:
• Identification: A prioritized list of all patients that need to be seen by 12/31 to ensure care gaps are closed
and revenue streams remain constant
• Provider Collaboration: Each morning physicians receive patient-specific pre-populated forms containing
previously diagnosed conditions and any outstanding Stars measure assessments needed for that member.
PMPM Revenue
In two months, the health plan increases their average Medicare RAF score from .95 to .98 and sees significant
improvement on a number of clinical Star measures
$760
$784
$0 $100 $200 $300 $400 $500 $600 $700 $800 $900
.98 RAF
.95 RAF
Pre-Solution Revenue Post-Solution Revenue
$24
Provider
Reimbursement for many providers is based on % of revenue/premium
At 35% of premium, this example generates an additional provider revenue of
$4,500,000
Health Plan
An increase of just 0.03 to the RAF score generated an additional $24/member/month.
For a 45,000 member plan, this equates to an annual revenue increase of
$12,960,000

©2016 SCIO Health Analytics®. Confidential and Proprietary. All rights reserved. |34
Our Vision for Analytics
Use new types of data and analytics to build robust views and models based
on enhanced member & provider profiles in order to:
• Better identify patterns of behavior that merit review• Prioritize limited resources• Enhance provider collaboration to improve shared results• Improve performance overall
Goal