Embed Size (px)
Citation preview

February 24, 2016
Demonstrating Who You Are in CJR: Data Describes the Problem, Providers Deliver the Solution
© QURE 2016
Agenda• Introduction• CJR review• Cost management
strategies• Defining CJR success• Q&A
2
Jay Sultan, Edifecs Principal Strategy Advisor
John Peabody, MD, PhD, FACP President, QURE Healthcare Professor, UCSF, UCLA
Speakers
© QURE 2016
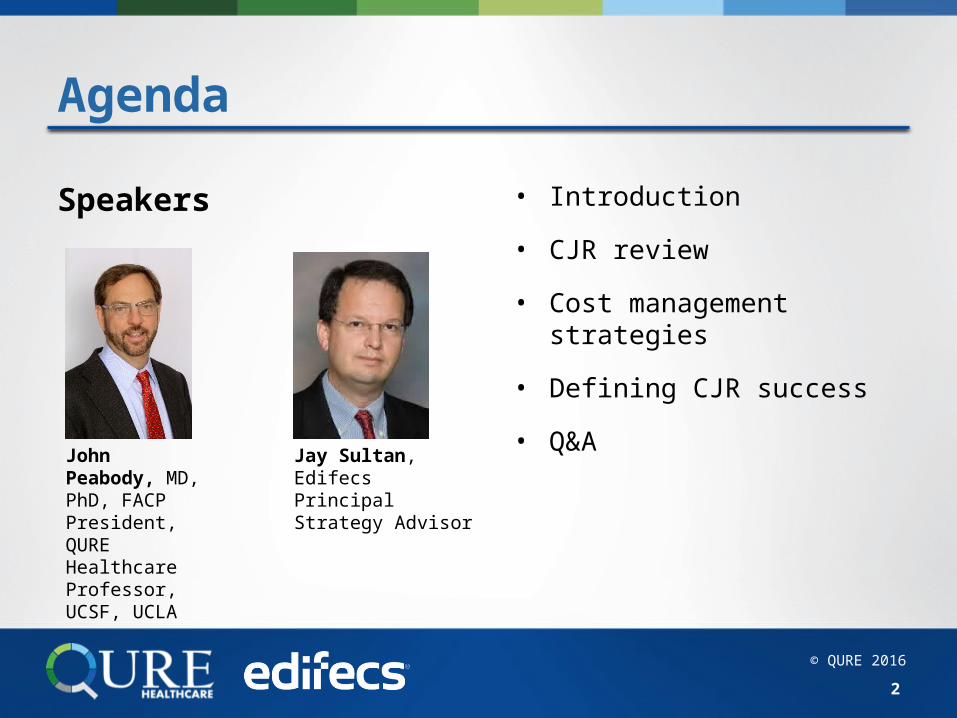
CJR Highlights• No choice about participation• Focus on post-acute care• Risk is borne by hospitals• New opportunities for
improving care • Mandate to lower total
episode costs• Episode impact will not be
limited to CJR
3
Critical implications for hospitals
© QURE 2016
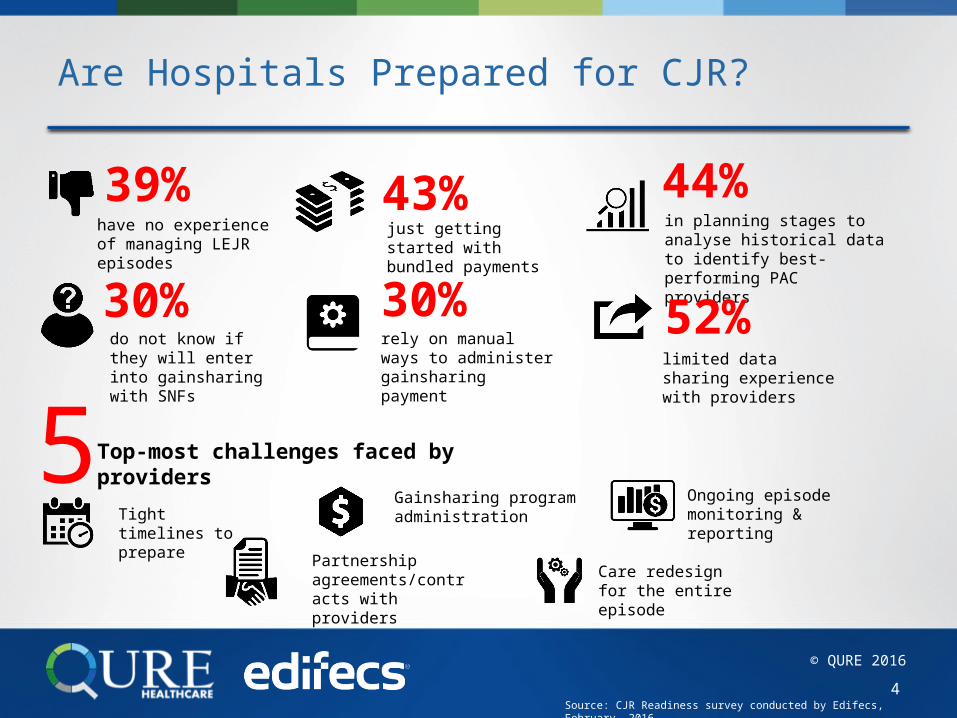
Are Hospitals Prepared for CJR?
4
39%have no experience of managing LEJR episodes
43%just getting started with bundled payments
44%in planning stages to analyse historical data to identify best-performing PAC providers
30%do not know if they will enter into gainsharing with SNFs
30%rely on manual ways to administer gainsharing payment
52%limited data sharing experience with providers
5Top-most challenges faced by providers
Tight timelines to prepare
Gainsharing program administration
Ongoing episode monitoring & reporting
Partnership agreements/contracts with providers
Care redesign for the entire episode
Source: CJR Readiness survey conducted by Edifecs, February, 2016.
© QURE 2016
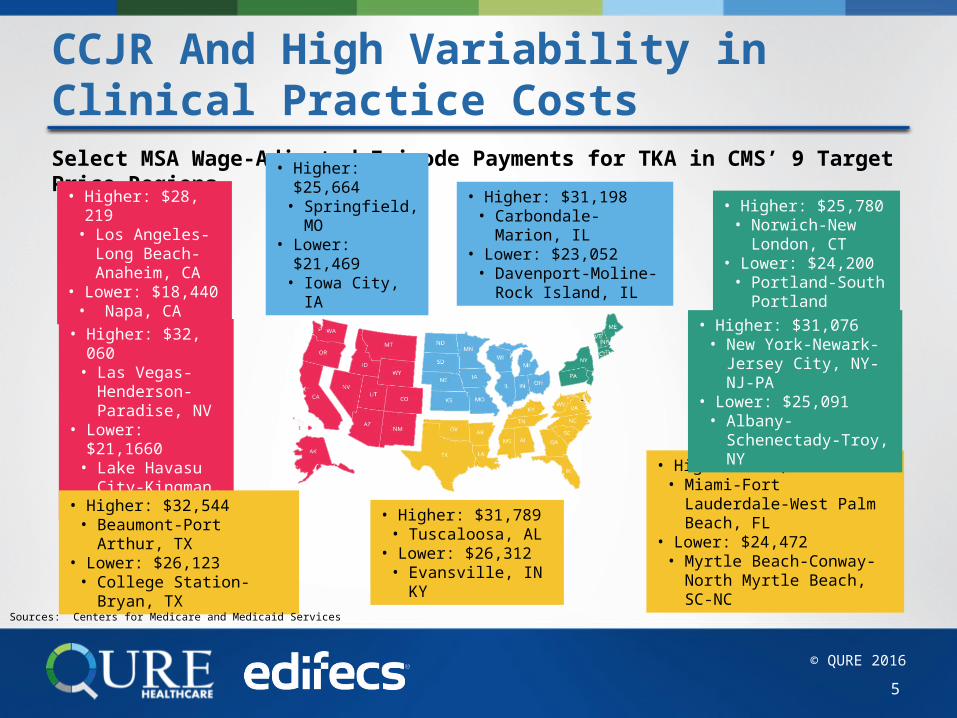
CCJR And High Variability in Clinical Practice Costs Select MSA Wage-Adjusted Episode Payments for TKA in CMS’ 9 Target Price Regions
• Higher: $32, 060• Las Vegas-
Henderson-Paradise, NV
• Lower: $21,1660• Lake Havasu
City-Kingman, AZ
• Higher: $28, 219• Los Angeles-
Long Beach-Anaheim, CA
• Lower: $18,440• Napa, CA
• Higher: $25,780 • Norwich-New
London, CT• Lower: $24,200
• Portland-South Portland
• Higher: $33,072 • Miami-Fort Lauderdale-West
Palm Beach, FL• Lower: $24,472
• Myrtle Beach-Conway-North Myrtle Beach, SC-NC
• Higher: $31,076 • New York-Newark-
Jersey City, NY-NJ-PA• Lower: $25,091
• Albany-Schenectady-Troy, NY
• Higher: $32,544 • Beaumont-Port Arthur, TX
• Lower: $26,123 • College Station-Bryan, TX
• Higher: $31,789 • Tuscaloosa, AL
• Lower: $26,312 • Evansville, IN KY
• Higher: $31,198 • Carbondale-Marion, IL
• Lower: $23,052 • Davenport-Moline-Rock
Island, IL
• Higher:$25,664• Springfield, MO
• Lower: $21,469 • Iowa City, IA
Sources: Centers for Medicare and Medicaid Services
5
© QURE 2016
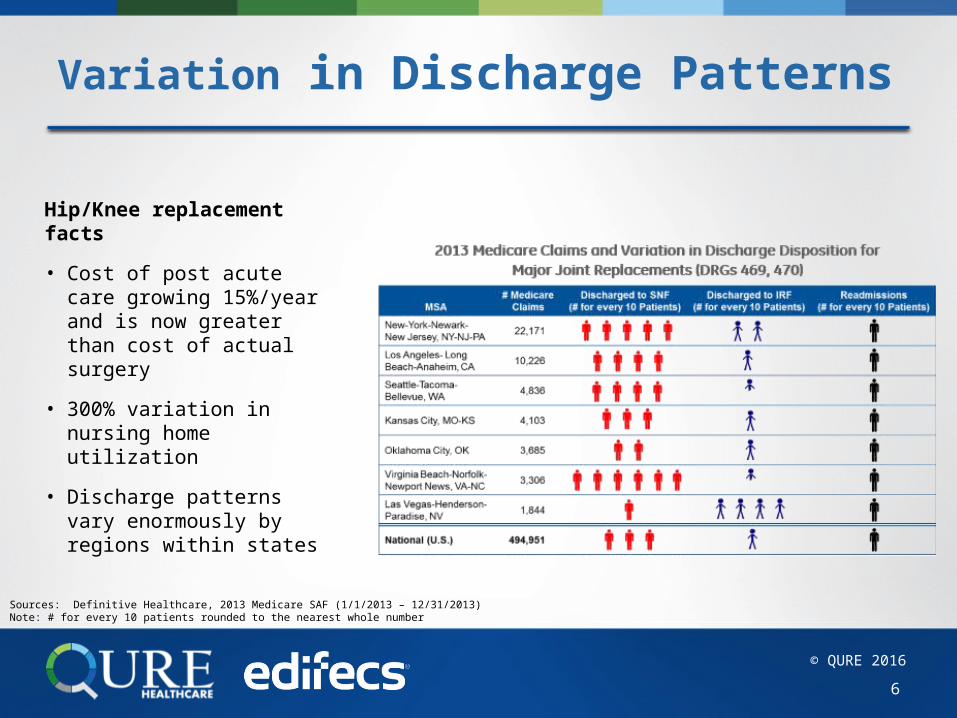
Variation in Discharge Patterns
Hip/Knee replacement facts• Cost of post acute care
growing 15%/year and is now greater than cost of actual surgery
• 300% variation in nursing home utilization
• Discharge patterns vary enormously by regions within states
6
Sources: Definitive Healthcare, 2013 Medicare SAF (1/1/2013 – 12/31/2013)Note: # for every 10 patients rounded to the nearest whole number
© QURE 2016
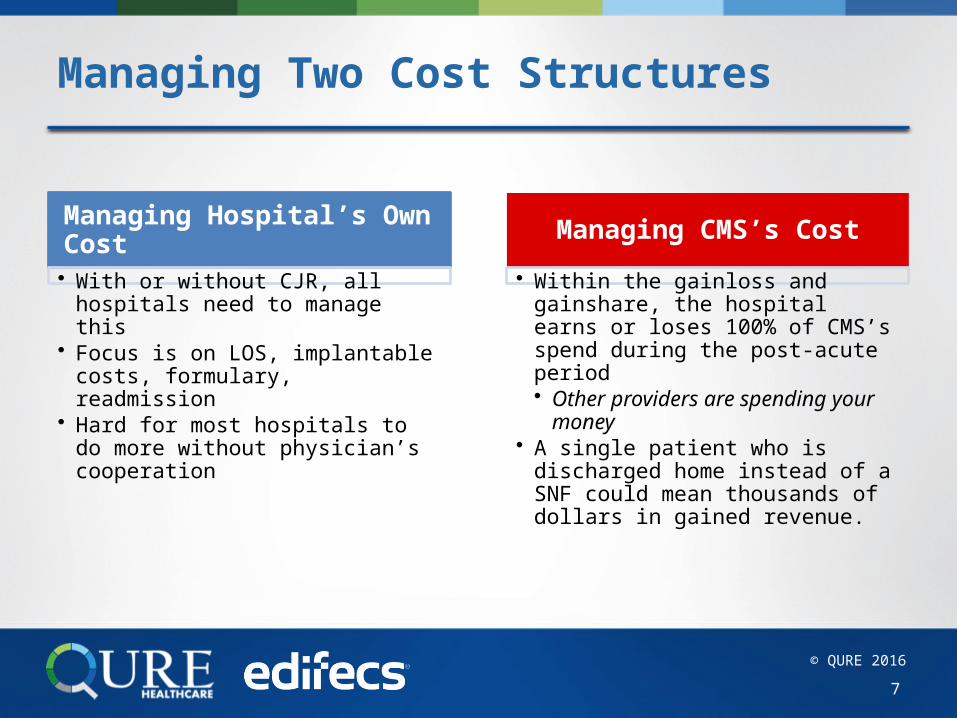
Managing Two Cost Structures
7
Managing Hospital’s Own Cost• With or without CJR, all hospitals
need to manage this• Focus is on LOS, implantable
costs, formulary, readmission• Hard for most hospitals to do
more without physician’s cooperation
Managing CMS’s Cost• Within the gainloss and
gainshare, the hospital earns or loses 100% of CMS’s spend during the post-acute period• Other providers are spending
your money• A single patient who is
discharged home instead of a SNF could mean thousands of dollars in gained revenue.
© QURE 2016
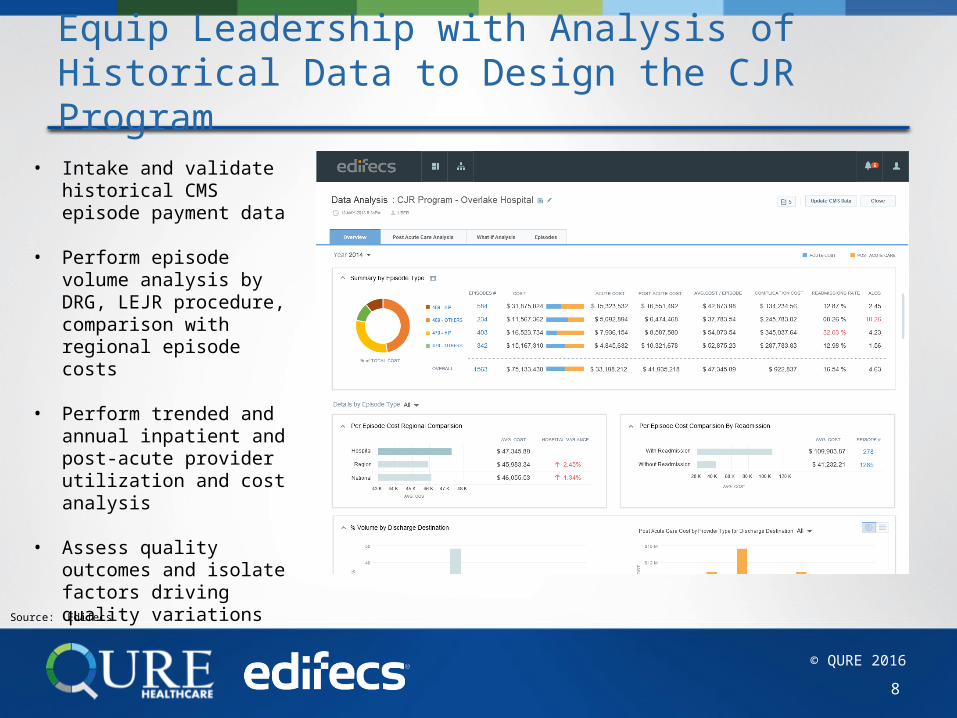
Equip Leadership with Analysis of Historical Data to Design the CJR Program
8
• Intake and validate historical CMS episode payment data
• Perform episode volume analysis by DRG, LEJR procedure, comparison with regional episode costs
• Perform trended and annual inpatient and post-acute provider utilization and cost analysis
• Assess quality outcomes and isolate factors driving quality variations
Source: Edifecs
© QURE 2016
Key Considerations for Cost Management, All Start with Better Care
Pre-Admission (surgeon’s office)Better screening and management of conditions prior to admission, to reduce LOS and complicationsBetter patient engagement (and education) pre-admission, to set expectations on pain and other topics and to start discharge planning with a presumption on home discharge when possible
During Acute Care (hospital and physicians)Better management of all costs related to implantable vendor choiceBetter coordination between anesthesia and surgeon (reduction of unwarranted variation, better pain management)Better engagement of physician in managing post acute (what they can do before or at time of discharge, what they can do post discharge)
9
© QURE 2016
Implementation
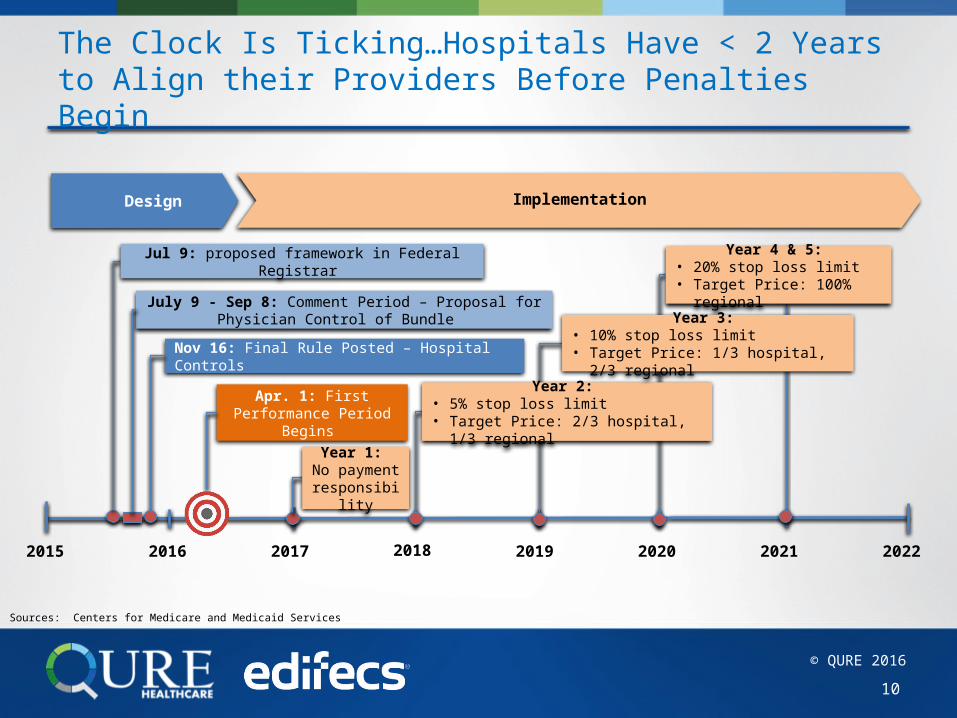
The Clock Is Ticking…Hospitals Have < 2 Years to Align their Providers Before Penalties Begin
10
Apr. 1: First Performance Period Begins
2015 2016 2017 2018 2019 2020 2021 2022
Design
Year 2: • 5% stop loss limit• Target Price: 2/3 hospital, 1/3 regional
Year 4 & 5: • 20% stop loss limit• Target Price: 100% regional
Year 3: • 10% stop loss limit• Target Price: 1/3 hospital, 2/3 regional
Year 1: No payment responsibility
Nov 16: Final Rule Posted – Hospital Controls
Jul 9: proposed framework in Federal Registrar
July 9 - Sep 8: Comment Period – Proposal for Physician Control of Bundle
Sources: Centers for Medicare and Medicaid Services
© QURE 2016
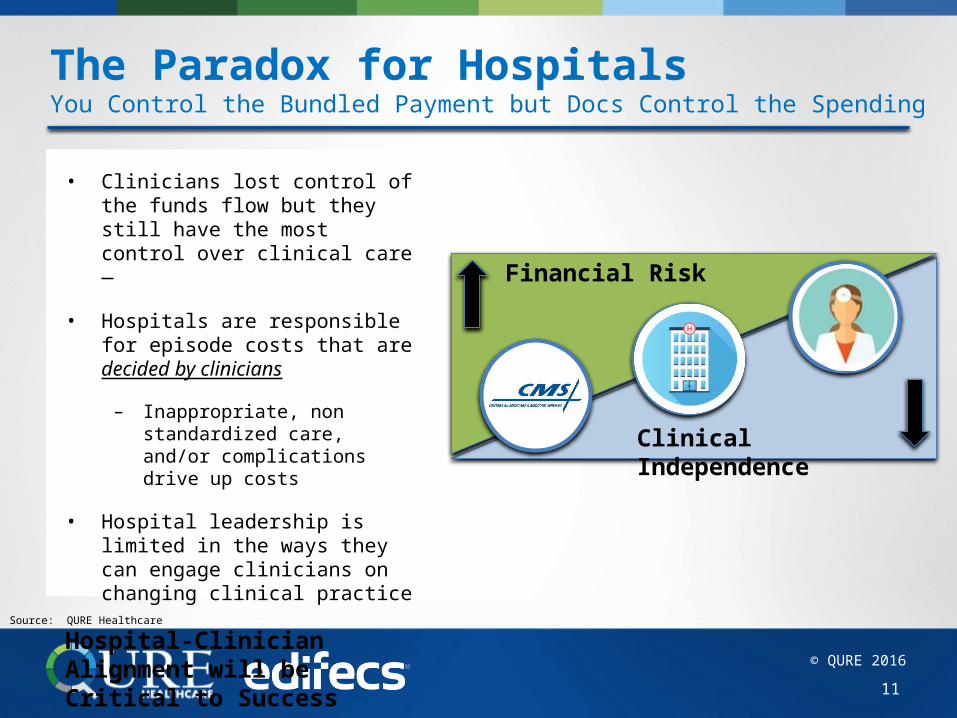
The Paradox for HospitalsYou Control the Bundled Payment but Docs Control the Spending
• Clinicians lost control of the funds flow but they still have the most control over clinical care
• Hospitals are responsible for episode costs that are decided by clinicians
– Inappropriate, non standardized care, and/or complications drive up costs
• Hospital leadership is limited in the ways they can engage clinicians on changing clinical practice
Hospital-Clinician Alignment will be Critical to Success
11
Clinical Independence
Financial Risk
Source: QURE Healthcare
© QURE 2016
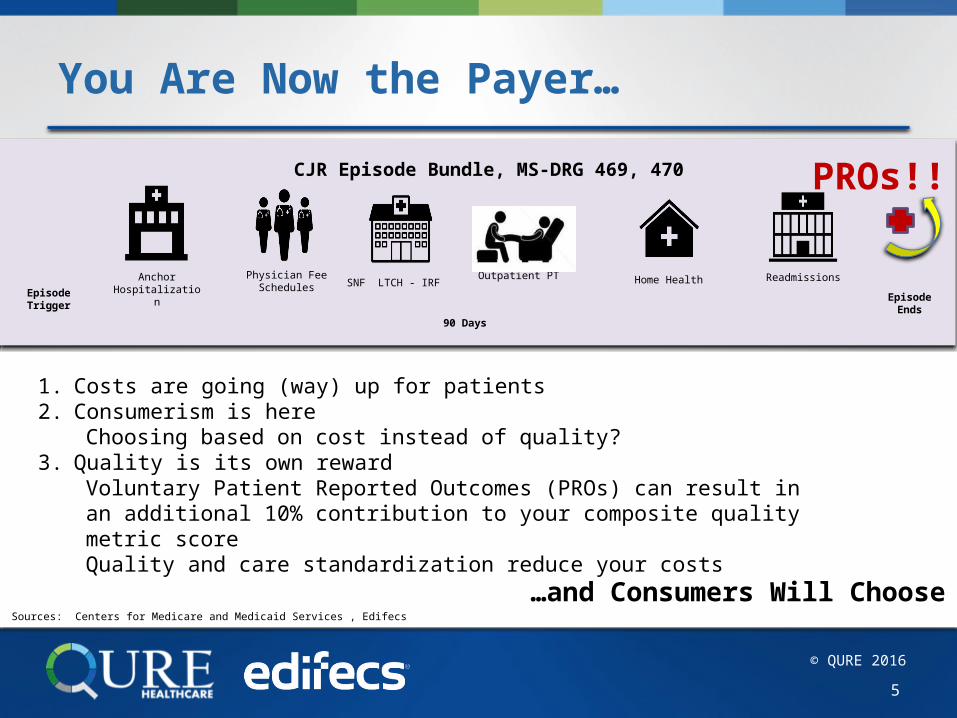
Home HealthAnchor Hospitalization
Physician Fee SchedulesSNF LTCH - IRF Readmissions
CJR Episode Bundle, MS-DRG 469, 470
Outpatient PT
Episode EndsEpisode Trigger
90 Days
You Are Now the Payer…
…and Consumers Will Choose
1. Costs are going (way) up for patients2. Consumerism is here
Choosing based on cost instead of quality? 3. Quality is its own reward
Voluntary Patient Reported Outcomes (PROs) can result in an additional 10% contribution to your composite quality metric scoreQuality and care standardization reduce your costs
PROs!!
Sources: Centers for Medicare and Medicaid Services , Edifecs
5
© QURE 2016
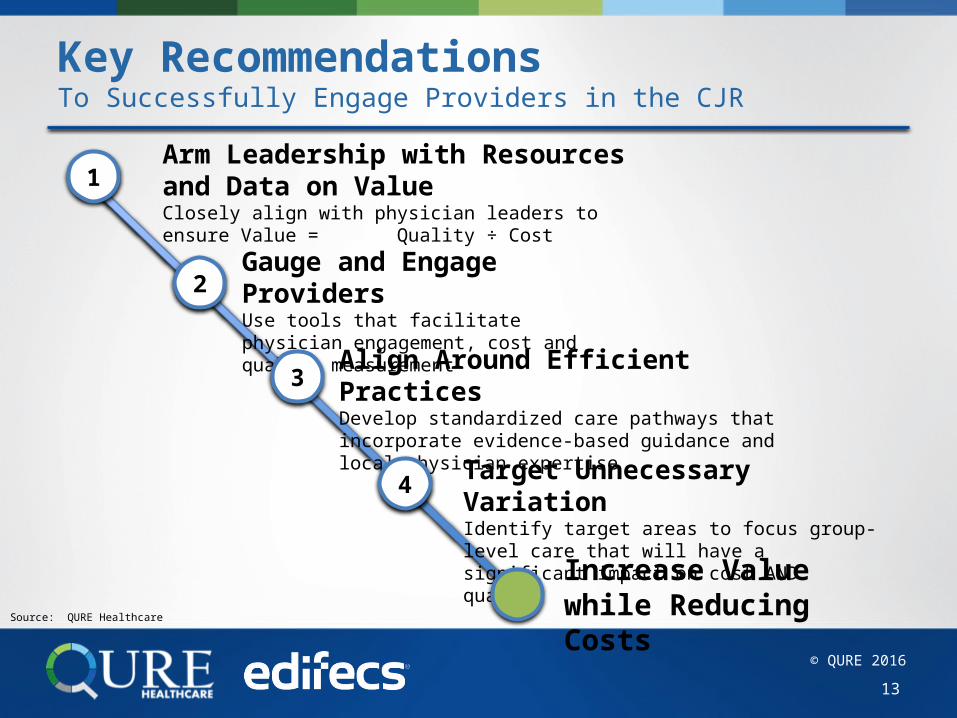
Key Recommendations To Successfully Engage Providers in the CJR
13
Align Around Efficient PracticesDevelop standardized care pathways that incorporate evidence-based guidance and local physician expertise
Target Unnecessary Variation Identify target areas to focus group-level care that will have a significant impact on cost AND quality
Gauge and Engage ProvidersUse tools that facilitate physician engagement, cost and quality measurement
Arm Leadership with Resources and Data on Value Closely align with physician leaders to ensure Value = Quality ÷ Cost
2
4
3
1
Increase Value while Reducing Costs
Source: QURE Healthcare
© QURE 2016
Lower Extremity Joint Replacement, Several Expert Consensus Clinical Guides Are Needed
14
Source: respective organization websites
© QURE 2016
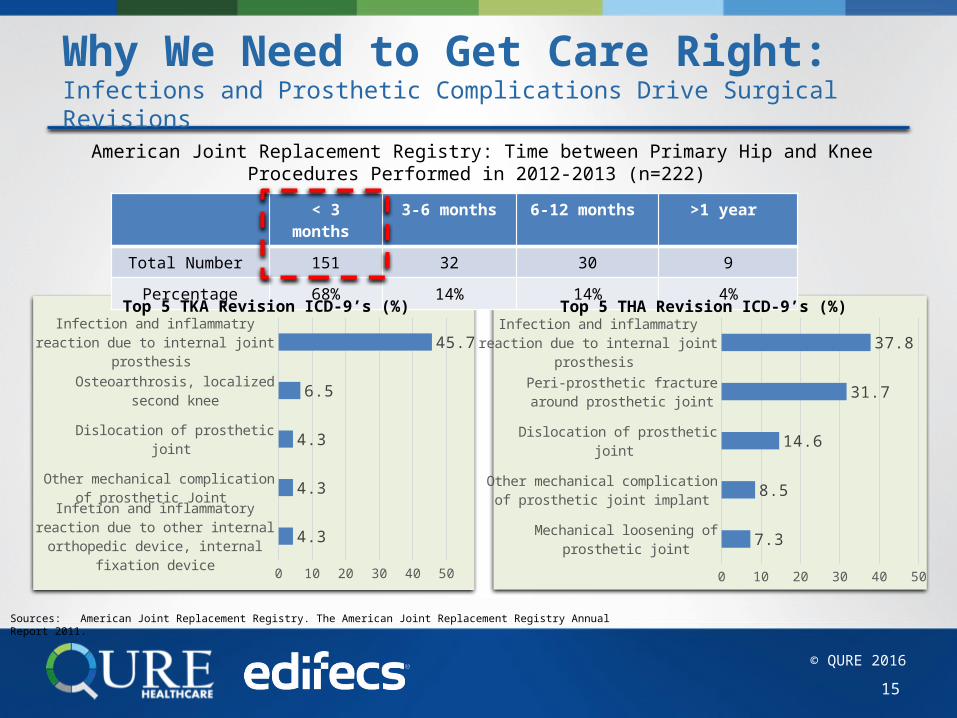
Infetion and inflammatory reac-tion due to other internal ortho-
pedic device, internal fixation de-vice
Other mechanical complication of prosthetic Joint
Dislocation of prosthetic joint
Osteoarthrosis, localized second knee
Infection and inflammatry reac-tion due to internal joint prosthesis
0 10 20 30 40 50
4.3
4.3
4.3
6.5
45.7
Why We Need to Get Care Right: Infections and Prosthetic Complications Drive Surgical Revisions
15
< 3 months
3-6 months 6-12 months >1 year
Total Number 151 32 30 9Percentage 68% 14% 14% 4%
American Joint Replacement Registry: Time between Primary Hip and Knee Procedures Performed in 2012-2013 (n=222)
Mechanical loosening of prosthetic joint
Other mechanical complication of prosthetic joint implant
Dislocation of prosthetic joint
Peri-prosthetic fracture around prosthetic joint
Infection and inflammatry reaction due to internal joint prosthesis
0 10 20 30 40 50
7.3
8.5
14.6
31.7
37.8
Top 5 TKA Revision ICD-9’s (%) Top 5 THA Revision ICD-9’s (%)
Sources: American Joint Replacement Registry. The American Joint Replacement Registry Annual Report 2011.
© QURE 2016
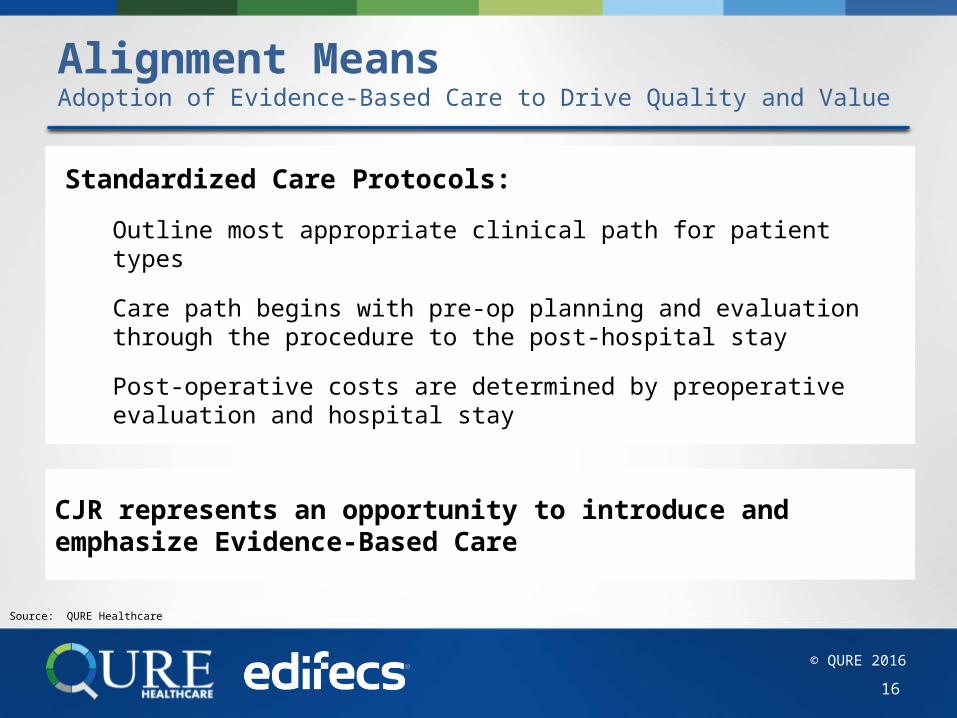
Alignment Means Adoption of Evidence-Based Care to Drive Quality and Value
Standardized Care Protocols: Outline most appropriate clinical path for patient typesCare path begins with pre-op planning and evaluation through the procedure to the post-hospital stayPost-operative costs are determined by preoperative evaluation and hospital stay
16
CJR represents an opportunity to introduce and emphasize Evidence-Based Care
Source: QURE Healthcare
© QURE 2016
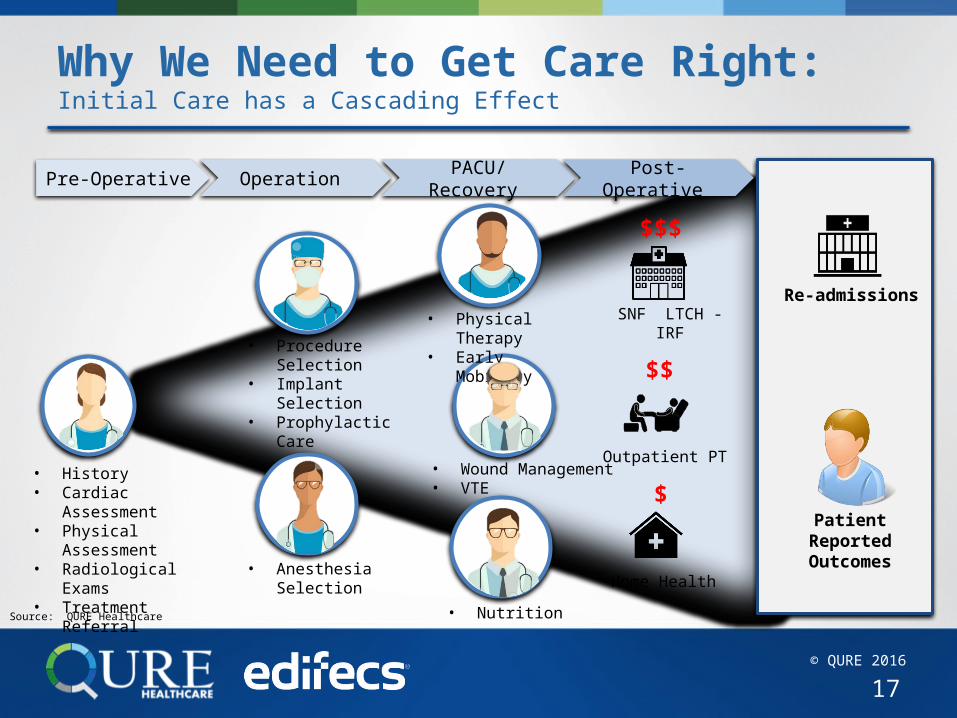
Why We Need to Get Care Right:Initial Care has a Cascading Effect
17
• History• Cardiac
Assessment• Physical
Assessment• Radiological Exams
• Treatment Referral
SNF LTCH - IRF
Outpatient PT
Home Health
$$$
$$
$
Re-admissions
Patient Reported Outcomes• Anesthesia
Selection
Pre-Operative Operation PACU/Recovery
Post-Operative
• Procedure Selection
• Implant Selection
• Prophylactic Care
• Wound Management
• VTE
• Physical Therapy
• Early Mobility
• NutritionSource: QURE Healthcare

© QURE 2016
WatchRecorded webinar
Demonstrating Who you Are in CJRQuestions? Contact us [email protected]
Join US
Upcoming Webinars
Download Presentation in Full

© QURE 2016
Too Much Variation: The Need to Standardize the History and Physical Examination
19
• Patient history includes onset and duration of symptoms, location and severity of pain, activity limitations (e.g., walking distance, use of assistive devices, and difficulty with stairs)
• Physical examination includes gait, knee range of motion, presence or absence of deformity of the knee, stability of the knee, neurologic status (sensory and motor function), vascular status (peripheral pulses), skin, height, and weight
Review of 224 TKR patients in 3 affiliated hospitals • Present illness documented in 54% of patients• Pain evaluation documented in 60% of patients• All components of the physical examination documented in 5% of patients
• Identifies medical problems that need to be corrected prior to the procedure• Pre-operative activity level and symptoms helps determine the severity of knee arthritis and
baseline functionality• Necessary to plan for the surgical procedure
2003
Consensus Guidance
Real-Life Practice
ClinicalImportance
Sources: American Joint Replacement Registry, Annual Report 2015 ; American Association of Hip and Knee Surgeons, Total Knee Replacement, Performance Measure Set, Jan. 2013SooHoo N, Tang E, Krenek L, et al. Variations in the quality of care delivered to patients undergoing total knee replacement at 3 affiliated hospitals. Orthopedics 34(5):356, 2011.; American Academy of Orthopaedic Surgeons. AAOS treatment guideline of osteoarthritis of the knee full guideline. 2008.
2013

![CJR – What Does it Mean to Me? · Comprehensive Care for Joint Replacement Payment Model (CJR) 42 CFR Part 510 [CMS-5516-P] ... Program Waivers . Skilled Nursing Facility CJR would](https://img.pdfslide.us/doc/110x75/5f315969adc7bd05fe00b2d0/cjr-a-what-does-it-mean-to-me-comprehensive-care-for-joint-replacement-payment.jpg)