Embed Size (px)
Citation preview
Demystifying Healthcare ValuationsMarch 2015

Presenter:Chip Measells, MBA, CVAwww.healthcarevaluations.netwww.wyattmatas.com
Contact Information:202.618.4713
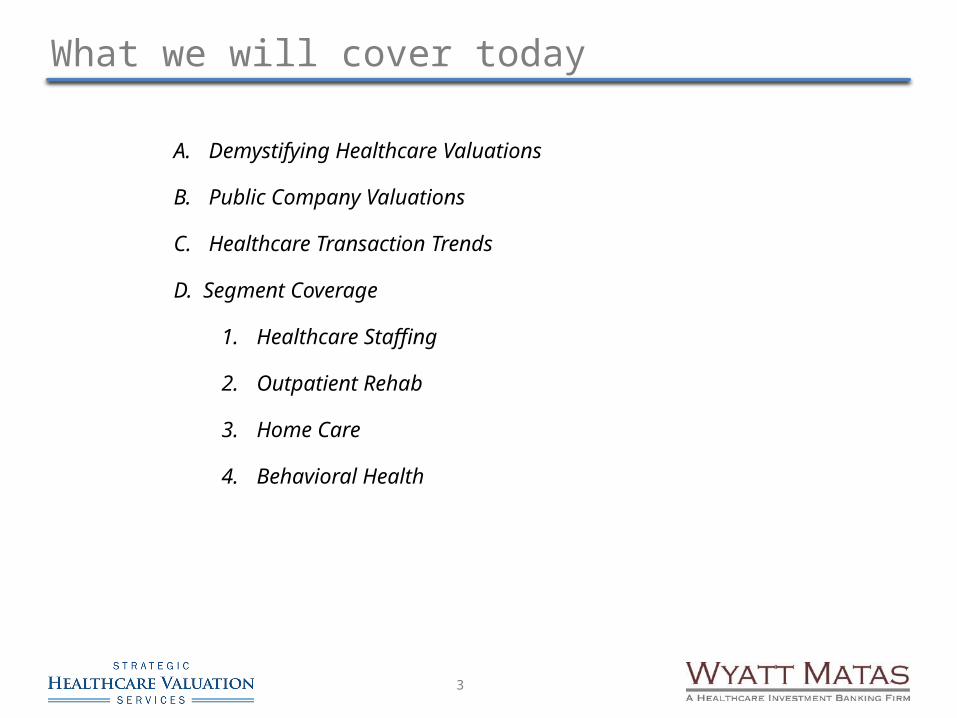
What we will cover today
3
A. Demystifying Healthcare Valuations
B. Public Company Valuations
C. Healthcare Transaction Trends
D. Segment Coverage
1. Healthcare Staffing
2. Outpatient Rehab
3. Home Care
4. Behavioral Health
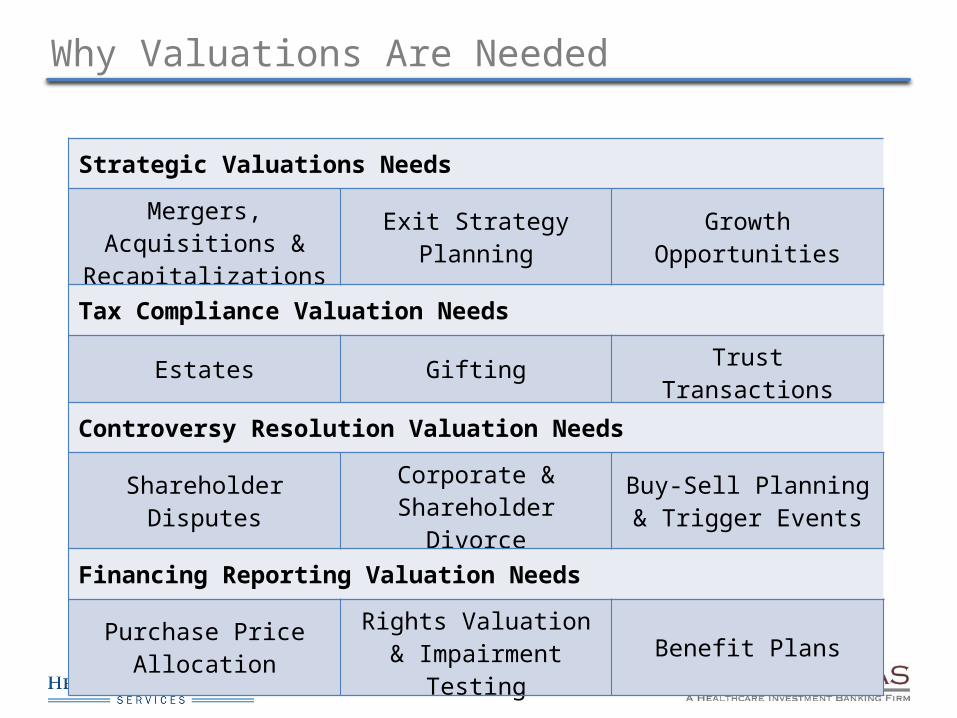
Why Valuations Are Needed
4
Strategic Valuations Needs
Mergers, Acquisitions & Recapitalizations Exit Strategy Planning Growth Opportunities
Tax Compliance Valuation Needs
Estates Gifting Trust Transactions
Controversy Resolution Valuation Needs
Shareholder Disputes Corporate & Shareholder Divorce
Buy-Sell Planning & Trigger Events
Financing Reporting Valuation Needs
Purchase Price Allocation Rights Valuation & Impairment Testing Benefit Plans
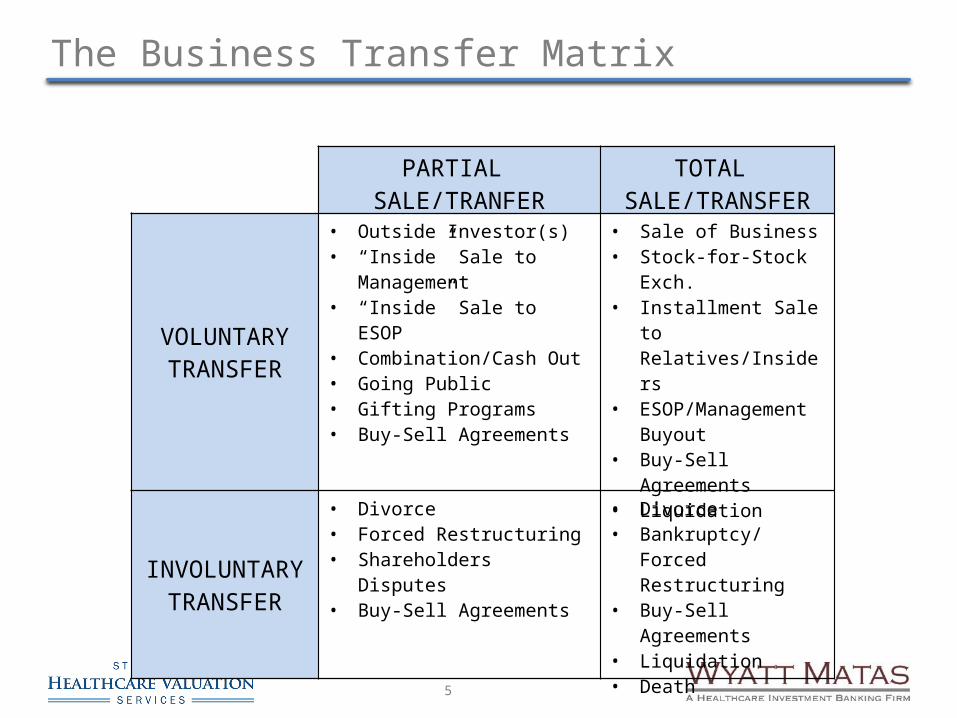
The Business Transfer Matrix
5
PARTIAL SALE/TRANFER
TOTAL SALE/TRANSFER
VOLUNTARY TRANSFER
• Outside Investor(s)• “Inside” Sale to Management• “Inside” Sale to ESOP• Combination/Cash Out• Going Public• Gifting Programs• Buy-Sell Agreements
• Sale of Business• Stock-for-Stock Exch.• Installment Sale to
Relatives/Insiders• ESOP/Management
Buyout• Buy-Sell Agreements• Liquidation
INVOLUNTARY TRANSFER
• Divorce• Forced Restructuring• Shareholders Disputes• Buy-Sell Agreements
• Divorce• Bankruptcy/Forced
Restructuring• Buy-Sell Agreements• Liquidation • Death
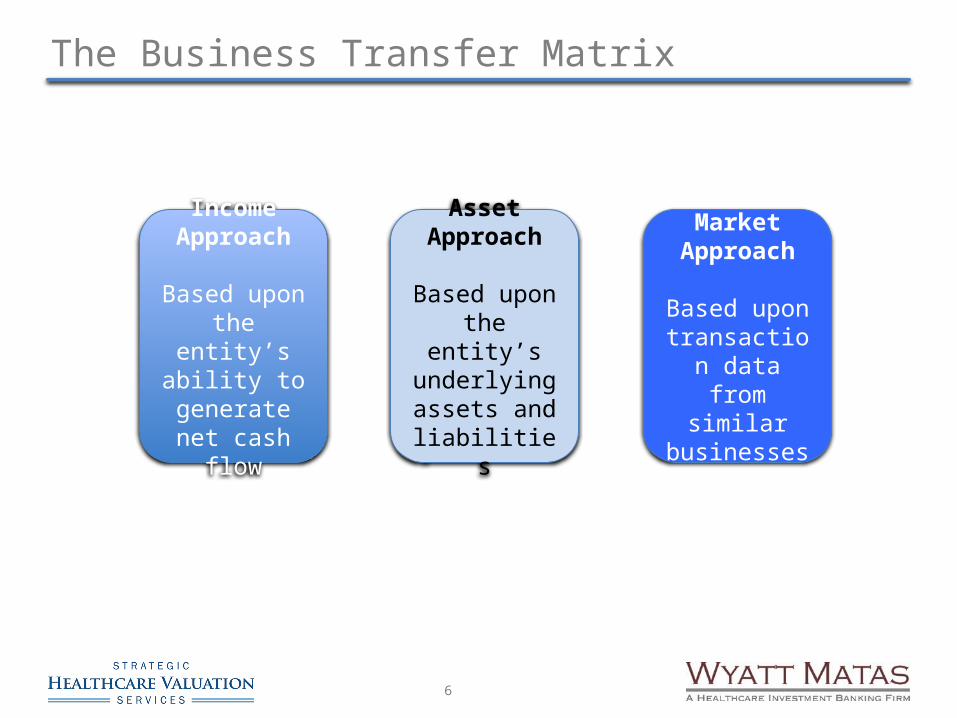
The Business Transfer Matrix
6
Market Approach
Based upon transaction data from
similar businesses
Asset Approach
Based upon the entity’s underlying assets and liabilities
Income Approach
Based upon the entity’s
ability to generate net
cash flow
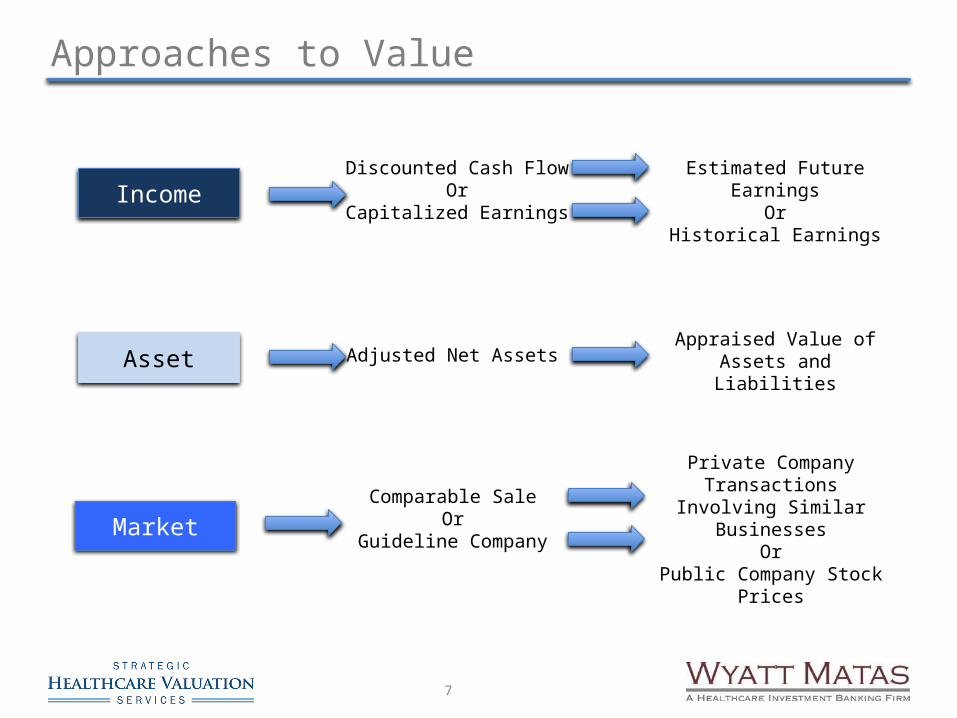
Approaches to Value
7
Income
Market
Asset
Discounted Cash FlowOr
Capitalized Earnings
Estimated Future EarningsOr
Historical Earnings
Comparable SaleOr
Guideline Company
Private Company Transactions Involving Similar
BusinessesOr
Public Company Stock Prices
Adjusted Net AssetsAppraised Value of Assets
and Liabilities
Market Approach
8
• The value of the company reflects the price at which comparable companies are purchased under similar circumstances.
• Requires that comparable transactions be available.• Guideline publicly-traded company method• Comparative transaction method
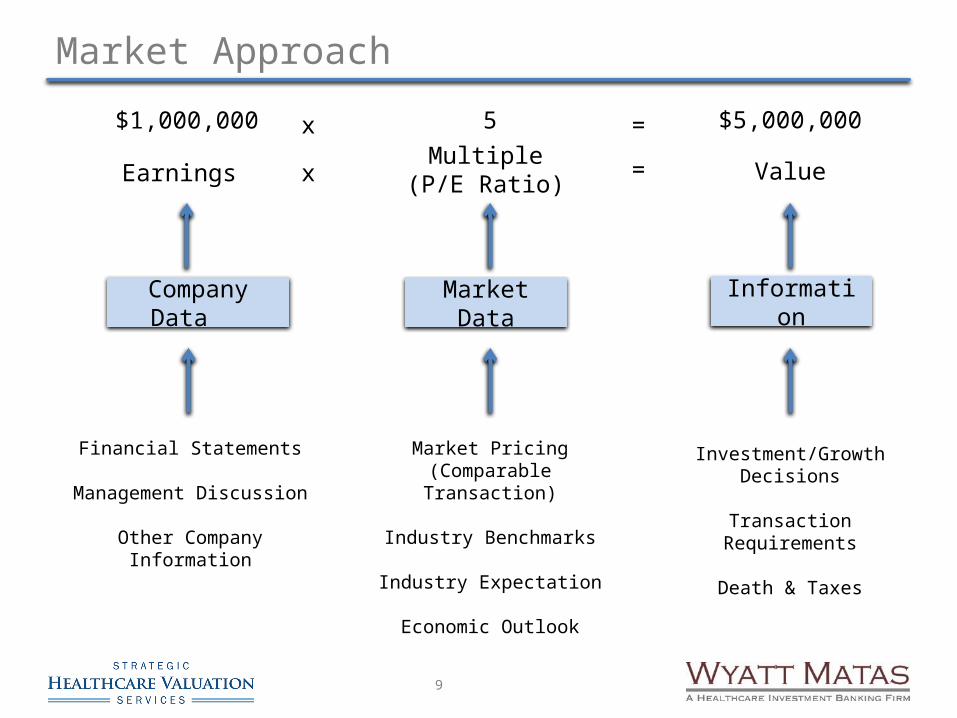
Market Approach
9
Earnings xMultiple
(P/E Ratio)= Value
Company Data InformationMarket Data
Financial Statements
Management Discussion
Other Company Information
Market Pricing(Comparable Transaction)
Industry Benchmarks
Industry Expectation
Economic Outlook
Investment/Growth Decisions
Transaction Requirements
Death & Taxes
$1,000,000 x 5 $5,000,000=
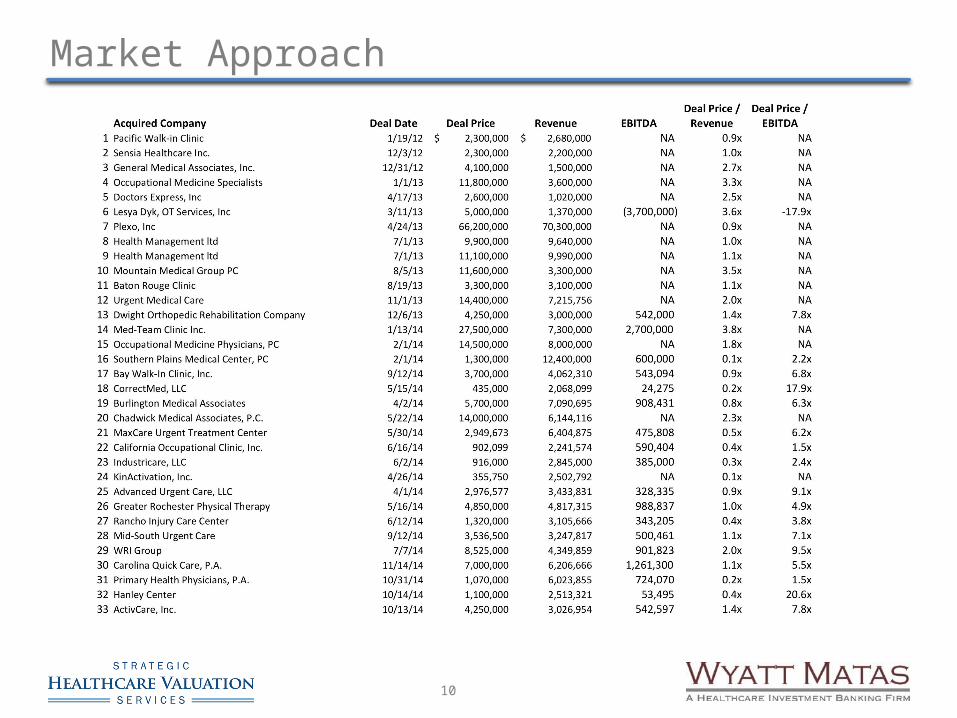
Market Approach
10
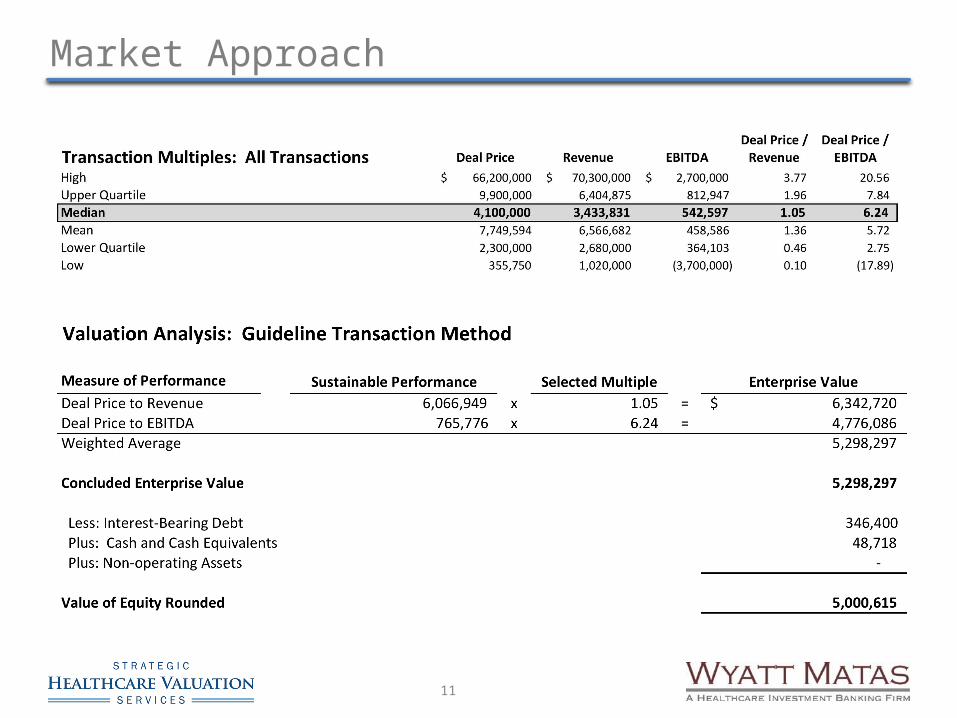
Market Approach
11
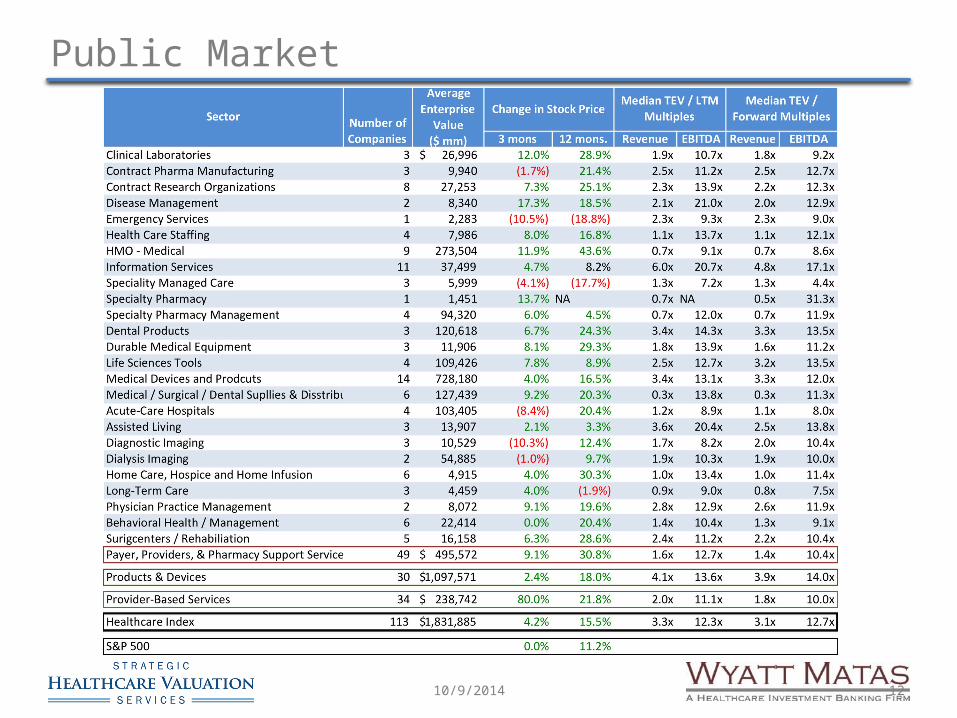
Public Market
1210/9/2014
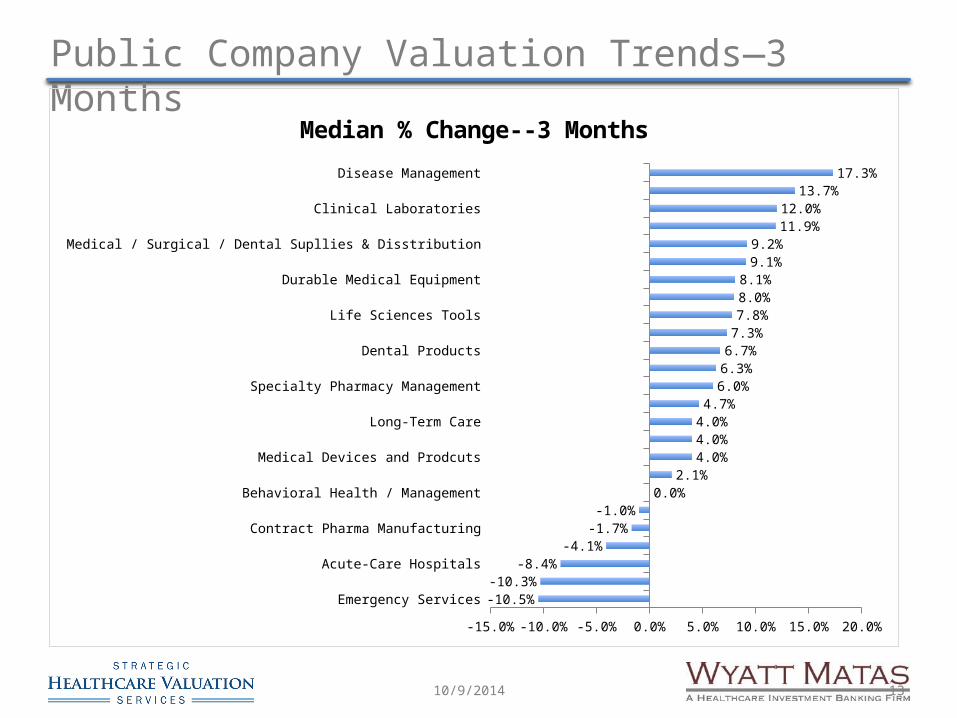
Public Company Valuation Trends—3 Months
1310/9/2014
Emergency ServicesDiagnostic Imaging
Acute-Care HospitalsSpeciality Managed Care
Contract Pharma ManufacturingDialysis Imaging
Behavioral Health / ManagementAssisted Living
Medical Devices and ProdcutsHome Care, Hospice and Home Infusion
Long-Term CareInformation Services
Specialty Pharmacy ManagementSurigcenters / Rehabiliation
Dental ProductsContract Research Organizations
Life Sciences ToolsHealth Care Staffing
Durable Medical EquipmentPhysician Practice Management
Medical / Surgical / Dental Supllies & DisstributionHMO - Medical
Clinical LaboratoriesSpecialty Pharmacy
Disease Management
-15.0% -10.0% -5.0% 0.0% 5.0% 10.0% 15.0% 20.0%
-10.5%-10.3%
-8.4%-4.1%
-1.7%-1.0%
0.0%2.1%
4.0%4.0%4.0%
4.7%6.0%6.3%
6.7%7.3%
7.8%8.0%8.1%
9.1%9.2%
11.9%12.0%
13.7%17.3%
Median % Change--3 Months
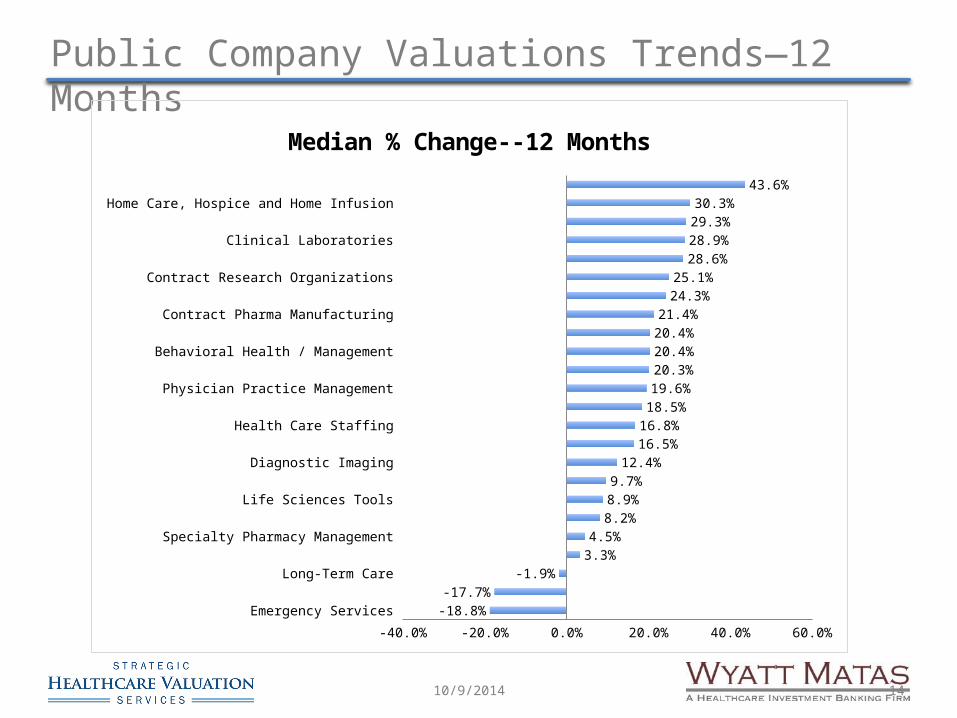
Public Company Valuations Trends—12 Months
1410/9/2014
Emergency ServicesSpeciality Managed Care
Long-Term CareAssisted Living
Specialty Pharmacy ManagementInformation Services
Life Sciences ToolsDialysis Imaging
Diagnostic ImagingMedical Devices and Prodcuts
Health Care StaffingDisease Management
Physician Practice ManagementMedical / Surgical / Dental Supllies & Disstribution
Behavioral Health / ManagementAcute-Care Hospitals
Contract Pharma ManufacturingDental Products
Contract Research OrganizationsSurigcenters / Rehabiliation
Clinical LaboratoriesDurable Medical Equipment
Home Care, Hospice and Home InfusionHMO - Medical
-30.0% -20.0% -10.0% 0.0% 10.0% 20.0% 30.0% 40.0% 50.0%-18.8%
-17.7%-1.9%
3.3%4.5%
8.2%8.9%9.7%
12.4%16.5%16.8%
18.5%19.6%20.3%20.4%20.4%21.4%
24.3%25.1%
28.6%28.9%29.3%30.3%
43.6%
Median % Change--12 Months
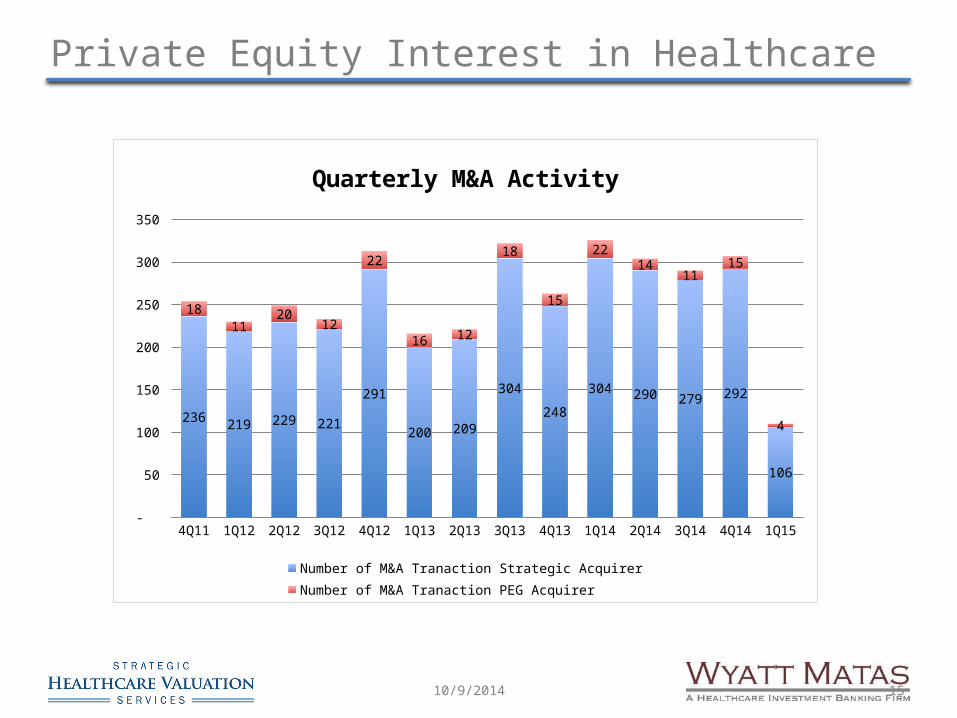
Private Equity Interest in Healthcare
1510/9/2014
4Q11 1Q12 2Q12 3Q12 4Q12 1Q13 2Q13 3Q13 4Q13 1Q14 2Q14 3Q14 4Q14 1Q15 -
50
100
150
200
250
300
350
236 219 229 221
291
200 209
304
248
304 290 279 292
106
18 11
20 12
22
16 12
18
15
22 14
11 15
4
Quarterly M&A Activity
Number of M&A Tranaction Strategic Acquirer Number of M&A Tranaction PEG Acquirer
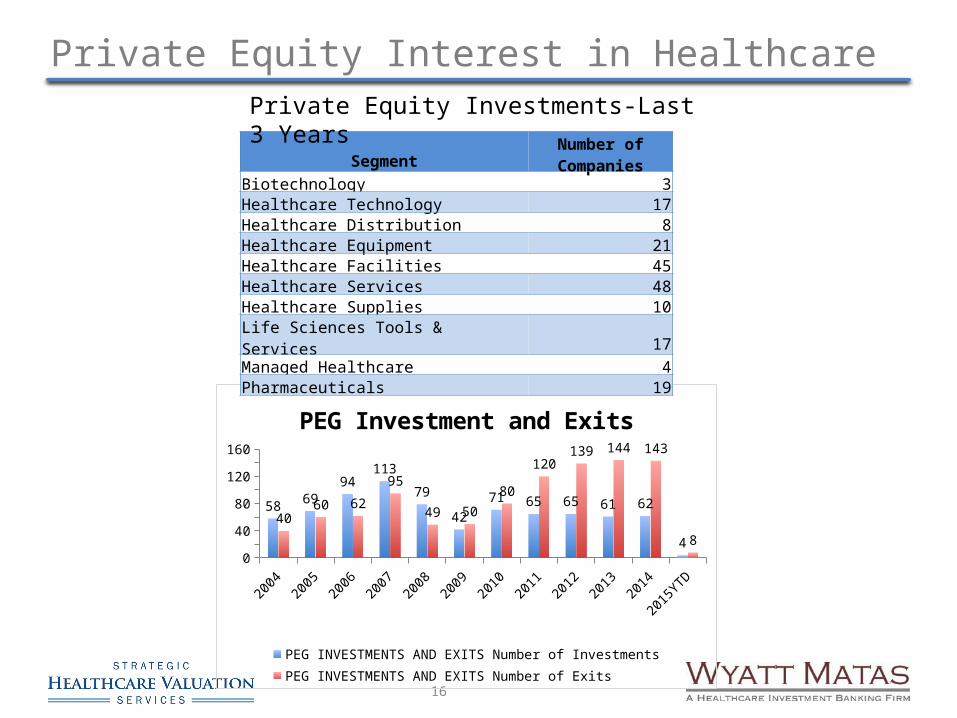
Private Equity Interest in Healthcare
16
20042005
20062007
20082009
20102011
20122013
2014
2015YTD
020406080
100120140160
5869
94113
79
42
71 65 65 61 62
4
4060 62
95
49 50
80
120139 144 143
8
PEG Investment and Exits
PEG INVESTMENTS AND EXITS Number of InvestmentsPEG INVESTMENTS AND EXITS Number of Exits
SegmentNumber of Companies
Biotechnology 3Healthcare Technology 17Healthcare Distribution 8Healthcare Equipment 21Healthcare Facilities 45Healthcare Services 48Healthcare Supplies 10Life Sciences Tools & Services 17Managed Healthcare 4Pharmaceuticals 19
Private Equity Investments-Last 3 Years
Sector Coverage
10/9/2014
Disclaimer: Because each segment we discuss is so broad and each has its own sub-segments, we use valuation ranges in discussing valuation
multiples. A professional business valuation should be conducted to determine the precise value of a business.
18
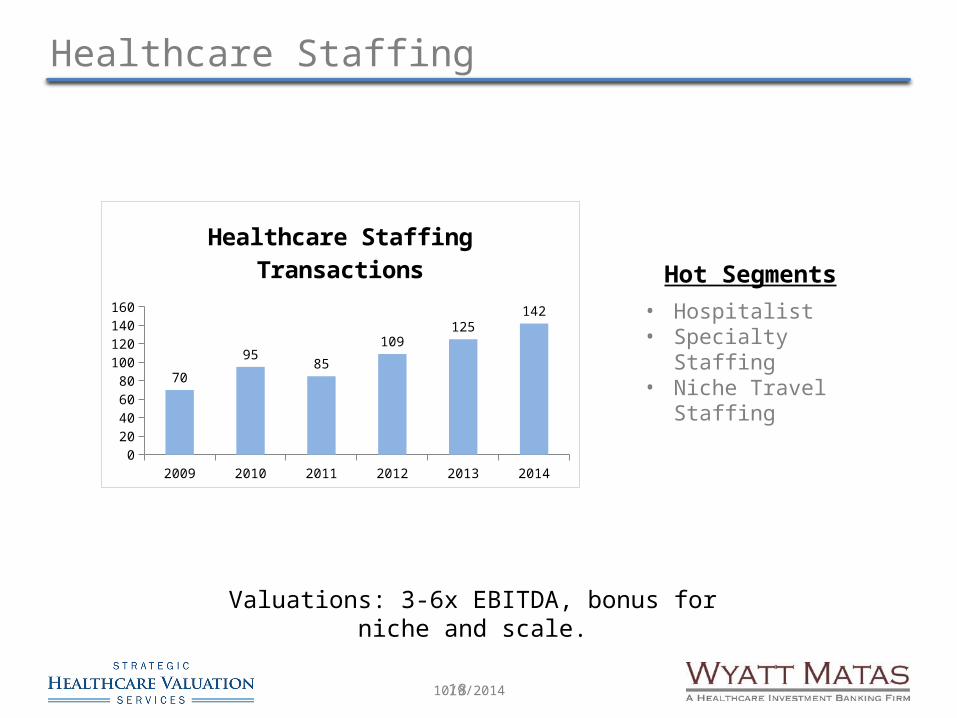
Healthcare Staffing
Valuations: 3-6x EBITDA, bonus for niche and scale.
• Hospitalist• Specialty Staffing• Niche Travel Staffing
Hot Segments
10/9/2014
2009 2010 2011 2012 2013 20140
20
40
60
80
100
120
140
160
70
9585
109125
142
Healthcare Staffing Transactions
19
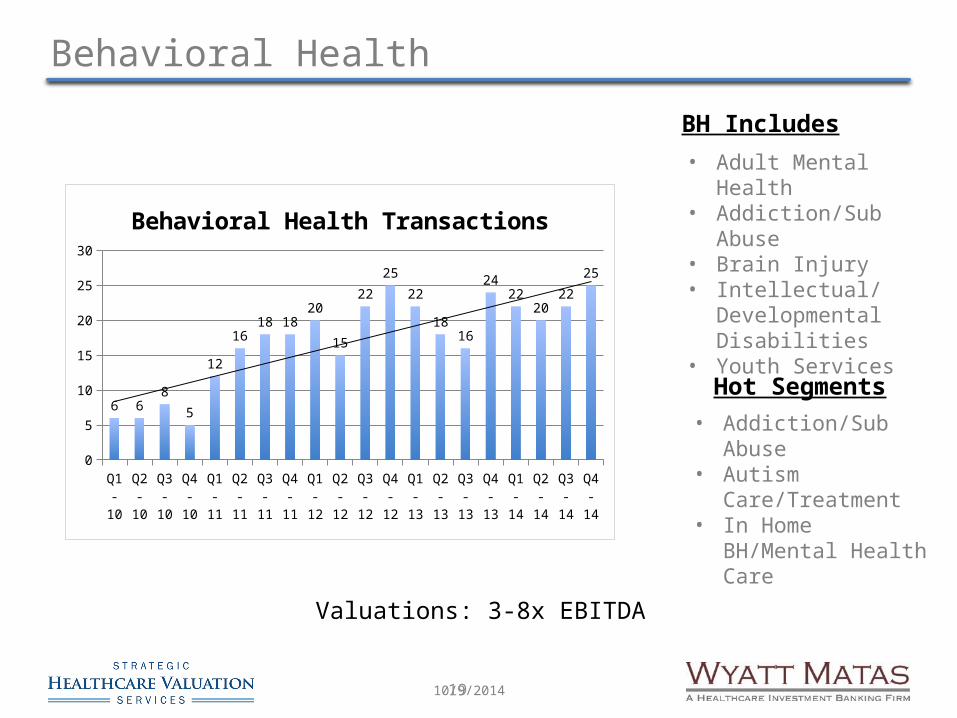
Behavioral Health
BH Includes• Adult Mental Health• Addiction/Sub Abuse• Brain Injury• Intellectual/
Developmental Disabilities
• Youth Services
• Addiction/Sub Abuse• Autism Care/Treatment• In Home BH/Mental
Health Care
Hot Segments
Valuations: 3-8x EBITDA
10/9/2014
Q1-10
Q2-10
Q3-10
Q4-10
Q1-11
Q2-11
Q3-11
Q4-11
Q1-12
Q2-12
Q3-12
Q4-12
Q1-13
Q2-13
Q3-13
Q4-13
Q1-14
Q2-14
Q3-14
Q4-14
0
5
10
15
20
25
30
6 68
5
12
1618 18
20
15
22
25
22
1816
2422
2022
25
Behavioral Health Transactions
20
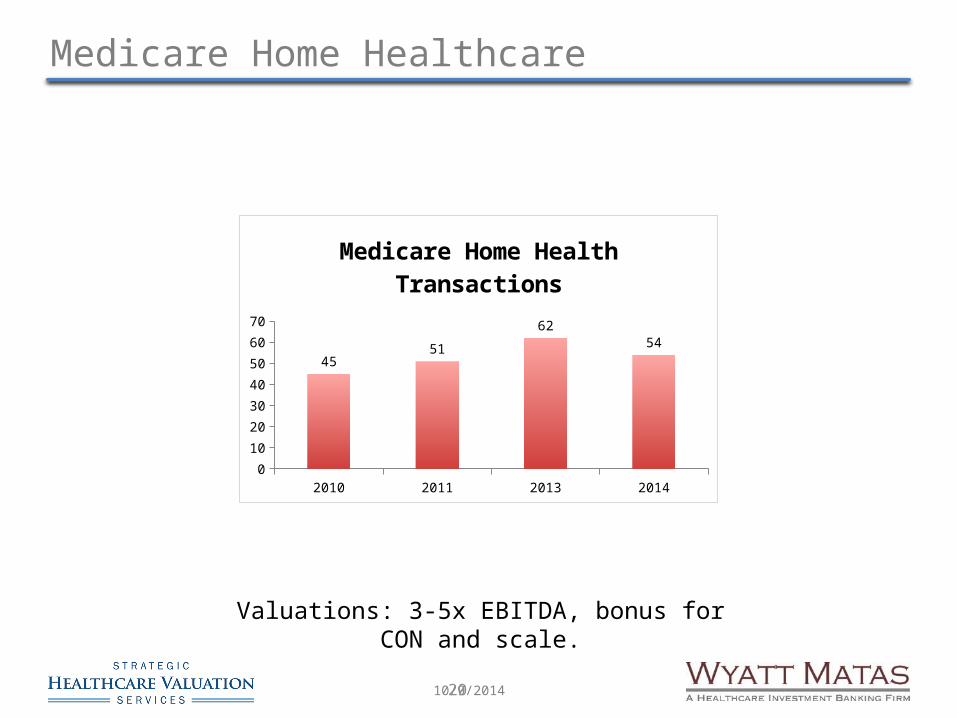
Medicare Home Healthcare
Valuations: 3-5x EBITDA, bonus for CON and scale.
10/9/2014
2010 2011 2013 20140
10
20
30
40
50
60
70
4551
62
54
Medicare Home Health Transactions
21
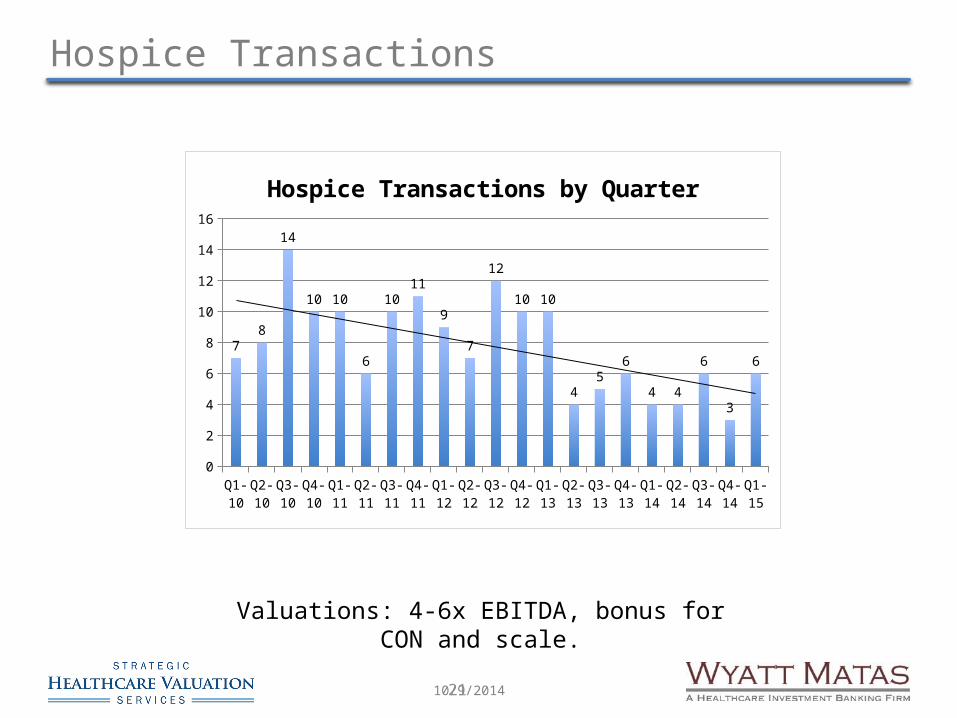
Hospice Transactions
Valuations: 4-6x EBITDA, bonus for CON and scale.
10/9/2014
Q1-10
Q2-10
Q3-10
Q4-10
Q1-11
Q2-11
Q3-11
Q4-11
Q1-12
Q2-12
Q3-12
Q4-12
Q1-13
Q2-13
Q3-13
Q4-13
Q1-14
Q2-14
Q3-14
Q4-14
Q1-15
0
2
4
6
8
10
12
14
16
78
14
10 10
6
1011
9
7
12
10 10
45
6
4 4
6
3
6
Hospice Transactions by Quarter
22
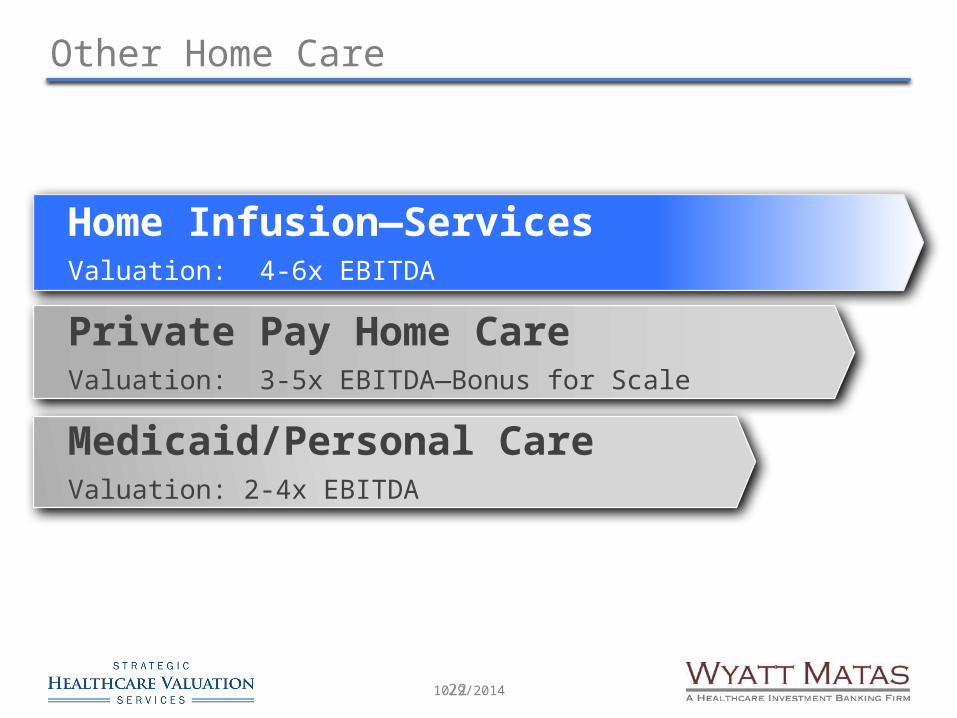
Other Home Care
Home Infusion—Services Valuation: 4-6x EBITDA
Private Pay Home CareValuation: 3-5x EBITDA—Bonus for Scale
Medicaid/Personal CareValuation: 2-4x EBITDA
10/9/2014
23
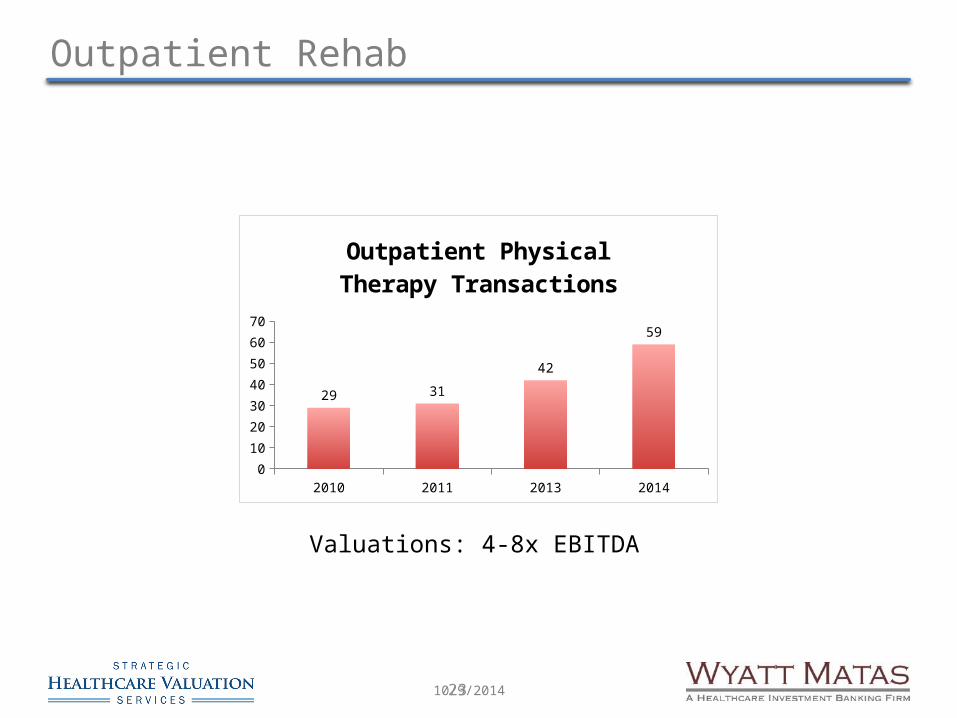
Outpatient Rehab
Valuations: 4-8x EBITDA
10/9/2014
2010 2011 2013 20140
10
20
30
40
50
60
70
29 31
42
59
Outpatient Physical Therapy Transac-tions
Presenter:Chip Measells, MBA, CVAwww.healthcarevaluations.netwww.wyattmatas.com
Contact Information:202.618.4713