Embed Size (px)
Citation preview
• !
Q.
CD
0
9 9
9 9 • terg
P 98 :0 I I I 1 9 5 9 9 9 9
q 9 9 9
9 9 99 9 9 9
0
9 9 9 9 9 99 9
5 9 9 84 9
Episode Price (adjusted annually by current rate of medical inflation)
CJR Episode Target Price (assumes 2% discount on Episode Price; % will vary based on hospital’s performance scores)
CJR Stop Loss/Stop Gain (% of Target Price)
Annual Number of Episodes(adjusted annually for current rate of increase)
Maximum Bonus Per Episode (CJR Stop Gain)
Maximum Penalty Per Episode (CJR Stop Loss)
ANNUAL OPPORTUNITY
ANNUAL THREAT
YEAR 1April-Dec. 2016
YEAR 22017
YEAR 32018
YEAR 42019
YEAR 52020
YEAR 1April-Dec. 2016
YEAR 22017
YEAR 32018
YEAR 42019
YEAR 52020
$27,464
$1,346
$0
$26,915
$477,736
$0
0/+5%
355
$29,991
$1,470
-$1,470
$29,392
$558,600
-$558,600
-5/+5%
380
$32,751
$3,210
-$3,210
$32,096
$1,303,260
-$1,303,260
-10/+10%
406
$35,765
$7,010
-$7,010
$35,050
$3,049,350
-$3,049,350
-20/+20%
435
$39,057
$7,655
-$7,655
$38,275
$3,559,575
-$3,559,575
-20/+20%
465
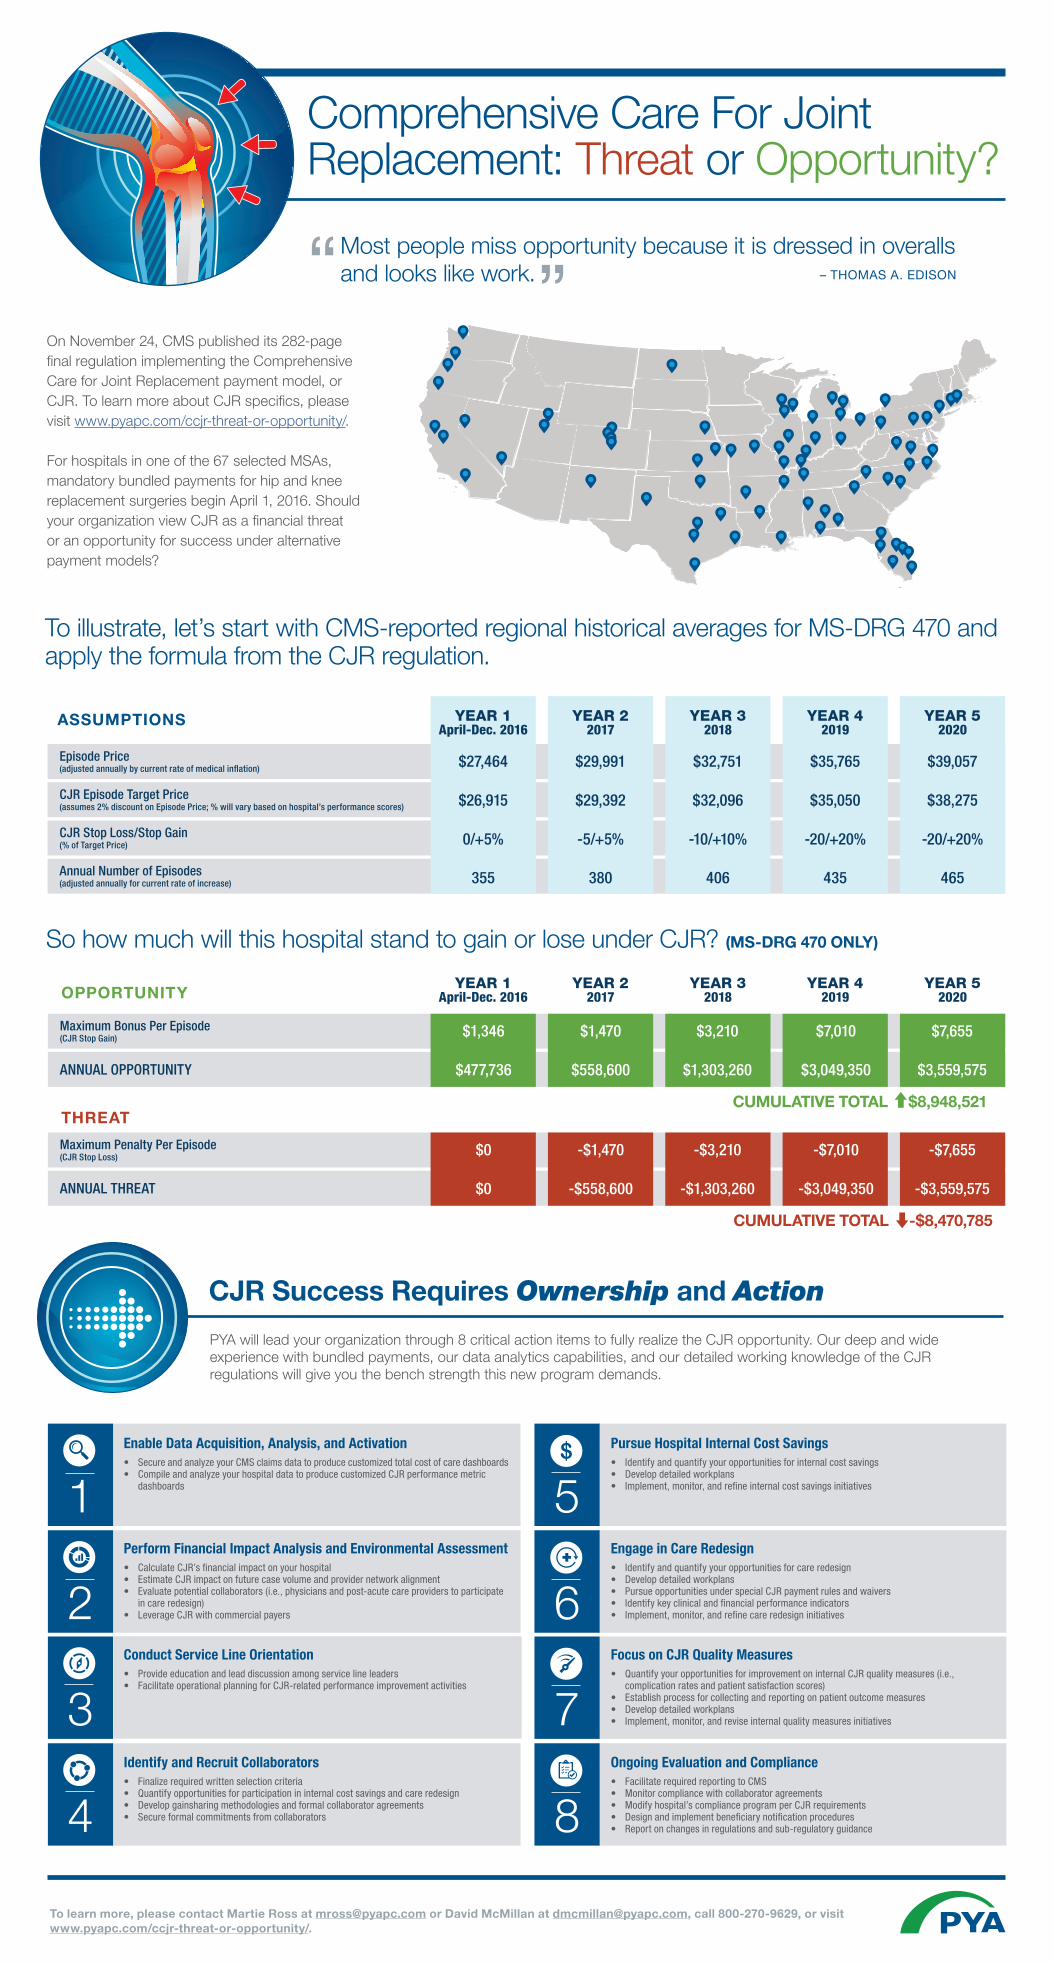
On November 24, CMS published its 282-page final regulation implementing the Comprehensive Care for Joint Replacement payment model, or CJR. To learn more about CJR specifics, please visit www.pyapc.com/ccjr-threat-or-opportunity/.
For hospitals in one of the 67 selected MSAs, mandatory bundled payments for hip and knee replacement surgeries begin April 1, 2016. Should your organization view CJR as a financial threat or an opportunity for success under alternative payment models?
Comprehensive Care For Joint Replacement: Threat or Opportunity?
“ ”Most people miss opportunity because it is dressed in overalls and looks like work. – THOMAS A. EDISON
Perform Financial Impact Analysis and Environmental Assessment• Calculate CJR’s financial impact on your hospital• Estimate CJR impact on future case volume and provider network alignment • Evaluate potential collaborators (i.e., physicians and post-acute care providers to participate
in care redesign) • Leverage CJR with commercial payers
PYA will lead your organization through 8 critical action items to fully realize the CJR opportunity. Our deep and wide experience with bundled payments, our data analytics capabilities, and our detailed working knowledge of the CJR regulations will give you the bench strength this new program demands.
To illustrate, let’s start with CMS-reported regional historical averages for MS-DRG 470 and apply the formula from the CJR regulation.
So how much will this hospital stand to gain or lose under CJR? (MS-DRG 470 ONLY)
To learn more, please contact Martie Ross at [email protected] or David McMillan at [email protected], call 800-270-9629, or visitwww.pyapc.com/ccjr-threat-or-opportunity/.
Enable Data Acquisition, Analysis, and Activation• Secure and analyze your CMS claims data to produce customized total cost of care dashboards • Compile and analyze your hospital data to produce customized CJR performance metric
dashboards
Conduct Service Line Orientation• Provide education and lead discussion among service line leaders • Facilitate operational planning for CJR-related performance improvement activities
Identify and Recruit Collaborators • Finalize required written selection criteria • Quantify opportunities for participation in internal cost savings and care redesign • Develop gainsharing methodologies and formal collaborator agreements • Secure formal commitments from collaborators
Pursue Hospital Internal Cost Savings• Identify and quantify your opportunities for internal cost savings • Develop detailed workplans • Implement, monitor, and refine internal cost savings initiatives
Engage in Care Redesign• Identify and quantify your opportunities for care redesign • Develop detailed workplans • Pursue opportunities under special CJR payment rules and waivers• Identify key clinical and financial performance indicators • Implement, monitor, and refine care redesign initiatives
Focus on CJR Quality Measures• Quantify your opportunities for improvement on internal CJR quality measures (i.e.,
complication rates and patient satisfaction scores)• Establish process for collecting and reporting on patient outcome measures• Develop detailed workplans • Implement, monitor, and revise internal quality measures initiatives
Ongoing Evaluation and Compliance• Facilitate required reporting to CMS• Monitor compliance with collaborator agreements • Modify hospital’s compliance program per CJR requirements• Design and implement beneficiary notification procedures• Report on changes in regulations and sub-regulatory guidance
1
2
3
4
5
6
7
8
ASSUMPTIONS
OPPORTUNITY
THREATCUMULATIVE TOTAL $8,948,521
CUMULATIVE TOTAL -$8,470,785
CJR Success Requires Ownership and Action

![CJR – What Does it Mean to Me? · Comprehensive Care for Joint Replacement Payment Model (CJR) 42 CFR Part 510 [CMS-5516-P] ... Program Waivers . Skilled Nursing Facility CJR would](https://img.pdfslide.us/doc/110x75/5f315969adc7bd05fe00b2d0/cjr-a-what-does-it-mean-to-me-comprehensive-care-for-joint-replacement-payment.jpg)