Embed Size (px)
Citation preview
Big Data Infrastructure for Translational Research
Christopher G. Wilson, Ph.D. Associate Professor Physiology and Pediatrics Center for Perinatal Biology
Translational Medicine, April 18th, 2015

Disclosures
The work reported here was supported, in part, by NIH grants:
1R01HL081622-01 (NHLBI) 1R03HD064830-01 (NICHD)


Outline
• Defining “Big Data” • Big data is of multiple modes/types • Scaling data acquisition to build Big Data sets
• Patient bed • Unit • Institution-wide
• Continuing challenges


What is “Big Data”?
• Big data is a blanket term for any collection of data sets so large and complex that it becomes difficult to process using the typical data management tools and data processing applications. • Big data usually includes data sets so large that commonly used software (like Microsoft Office) cannot be used to capture, curate, manage, and process the data quickly and efficiently. • Big data set sizes are a constantly moving target ranging from 100’s of gigabytes (109 bytes), to terabytes (1012 bytes) and even to petabytes (1015 bytes) of data in a single data set.

A feast of data!
• The world’s technological per-capita capacity to store information has roughly doubled every 40 months since the 1980s • Global Internet traffic has reached almost 1000 exabytes (1018 bytes) annually and continues to grow* • The challenge for both business and research science is coming up with the tools to extract usable information from this data
*Cisco systems estimate

Where does so much data come from?
Data sets grow to vast size because they are increasingly being gathered by: • Ubiquitous information-sensing mobile devices (phones, fitbits, jawbones, etc.) • Surveillance technologies (remote sensing devices like drones or traffic cameras) • Software logs from your internet activity (Hello—Facebook!) • Radio-frequency identification (RFID) tags • Wireless sensor networks (once again, the kind of thing your phone “wants” to attach to when you are out and about) • And scientific instruments, clinical monitors, patient samples…

Personal fitness trackers

Work-flow of “Big Data” analysis

Or…
• Obtain data • Scrub data • Explore data • Model the data • Interpret the data • Present the data

Data analytics is a team sport! • Project manager—responsible for setting clear project objectives and deliverables.
The project manager should be someone with more experience in data analysis and a more comprehensive background than the other team members.
• Statistician—should have a strong mathematics/statistics background and will be responsible for reporting and developing the statistics workflow for the project.
• Visualization specialist—responsible for the design/development of data visualization (figures/animation) for the project.
• Database specialist—develops ontology/meta-tags to represent the data and incorporate this information in the team's chosen database schema.
• Content Expert—has the strongest background in the focus area of the project (Physiologist, systems biologist, molecular biologist, biochemist, clinician, etc.) and is responsible for providing background material relevant to the project's focus.
• Web developer/integrator—responsible for web-content related to the project, including the final report formatting (for web/hardcopy display).
• Data analyst/programmer—the most junior member of the team will take on general responsibilities to assist the other team members. This is a learning opportunity for a team member who is new to data analysis and needs time to develop the skills necessary to fully participate in the workflow.
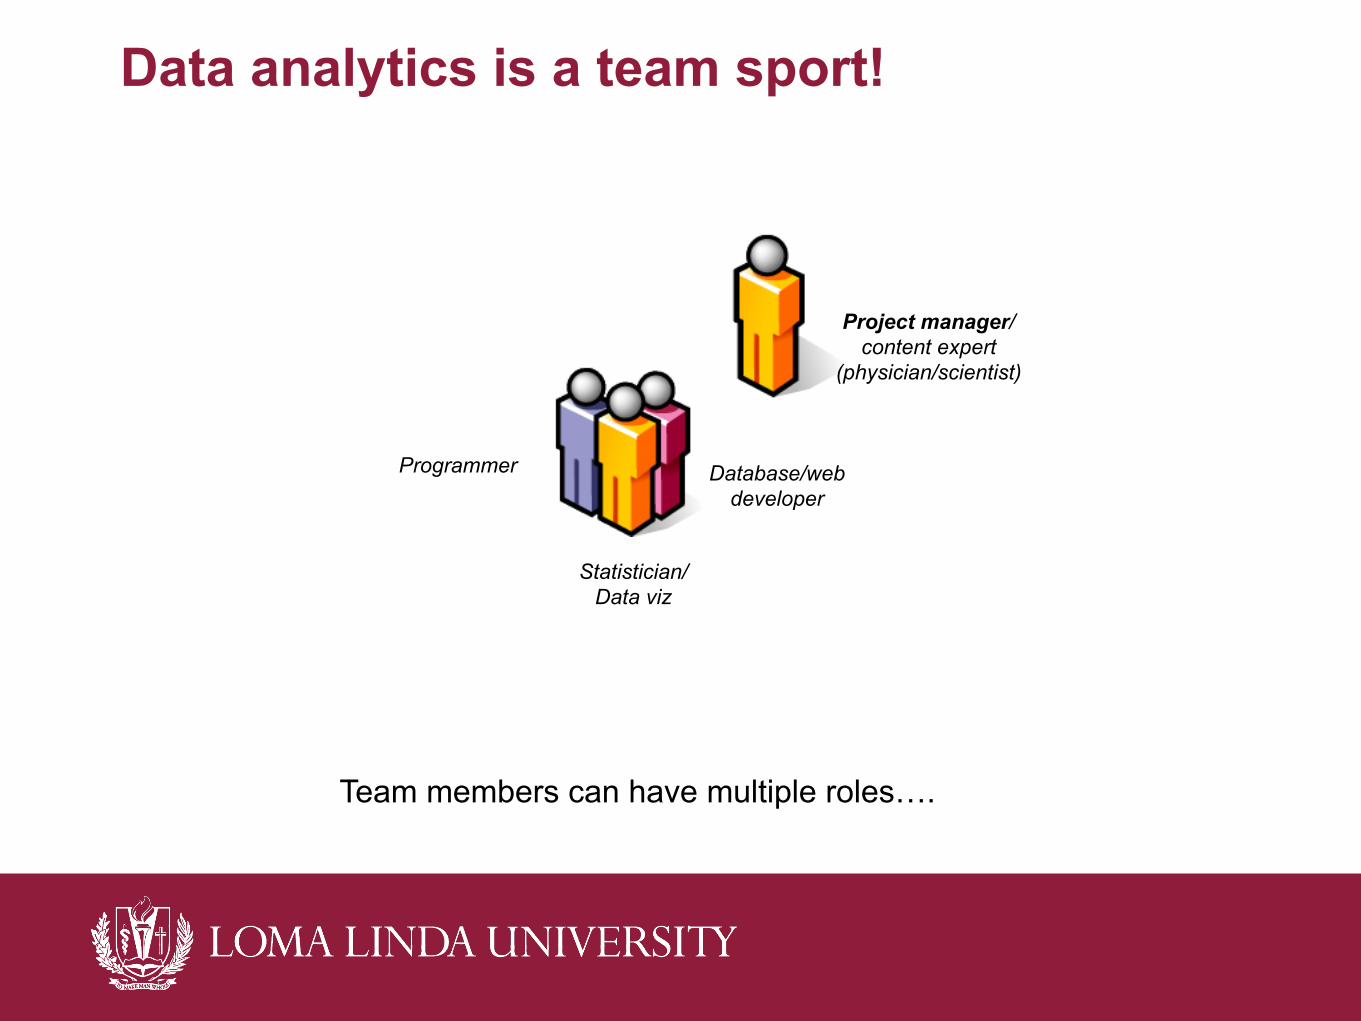
Data analytics is a team sport!
Project manager/content expert
(physician/scientist)
Database/web developer
Statistician/ Data viz
Programmer
Team members can have multiple roles….

What tools are typically used?
• 64 bit computing environment is typical (Big RAM and Big storage, massively parallel software running on clusters/cloud servers) • Data is acquired and stored in a database (SQL for some but NOSQL databases like Hadoop, MongoDB, CouchDB, Clusterpoint, etc. are “better”) • Data screening & cleaning using “scripting” languages (Perl or Python typically) and processing using tools like MapReduce • “Industrial strength” statistical packages (typically R, SAS, or SPSS) • Visualization (D3/IDL/MATLAB/Python/Plot.ly, etc.) • Metadata tagging (XML and variants)


How can we meet the challenge of Big Data collection/integration
in a translational setting?

What are the challenges for clinicians/researchers?
The amount of biomedical data that is increasingly available provides both opportunity and challenge for the translational investigator. • Molecular biology has provided tools to allow understanding of genomics and proteomics. • There is growing data on the connectomics of signaling pathways • Patient demographic data and other EHR/EMR metrics are a resource that is only now being widely deployed and interrogated. • Patient physiology (bedside monitors) can be used to provide fundamental information about patient health and adaptation to pathophysiologies. • Health Insurance Portability and Accountability Act of 1996 (HIPAA) is a necessary challenge for data handling.

Courtesy Michael De Georgia & J. Michael Schmidt

Big Data to Decisions!
» Technology challenges for “Data to Decisions” ~ Transforming data from multiple sources into meaningful information (evidence-context dependent) ~ Association of data from diverse heterogeneous, asynchronous sources ~ Merging/fusion of information for alerts and decision support ~ Human guided processing and analysis
Multi-source Analysis For Pattern Discovery Extract & synthesize information from diverse data.
SOURCE
SOURCE
SOURCE
Source-to-Evidence: Information Processing &
Extraction
Text Analytics
Image Analysis
Signal Processing
Data Association
Data Fusion: Alerting & Decision
Support
Combine Information
Weigh Evidence
Real time Alerting
User Interface: Display & Analysis
Visualization
Queries
Data Provenance
Sensitivity

Real-time Decision Support Providing useful information to the clinician
» Real-time decision support to clinicians at the point of care ~ Codify best practice protocols ~ Enable efficient treatment decisions ~ Reduce needless procedures ~ Optimize coordination among care givers ~ Reduce the probability of mistakes being made
» Key features that affect decision support ~ Methods to retrieve, merge, and present data and information ~ Algorithms to extract information from complex, heterogeneous data ~ Visualization/graphical feedback to better understand patient conditions
» Automated alerting for conditions of concern ~ Combining information across data streams ~ Accumulation of weak evidence from multiple sources ~ Enhanced retrieval and visualization of information

Challenges inherent in Big Data Analytics
• Capture • Curation • Storage • Search • Sharing • Transfer • Analysis • Visualization

Data is multi-modal Unified data set
Physiology waveforms
(ECG, EEG, SaO2, BP)
Radiology (X-Ray, MRI, CAT,
etc.)
EMR/EHR
“-omics” data

Bedside Patient Data Acquisition

Scaling to a hospital-wide data center
Ken Loparo Michael DeGeorgia Frank Jacono Farhad Kaffashi


CWRU IMEDSTM Proof of Concept Demonstration

Why is IMEDS™ Different? The Approach
~ “Bottom-up” development with clinicians and engineers working
side-by-side
~ Open source architecture design
~ Total integrated, “plug-and-play” system solution
~ Unbiased approach
~ Unified effort, rather than stove-piped, “one-off” solutions to small pieces of the problem
~ Non-profit nation-wide consortium
~ Builds on existing infrastructures
~ Leverages best available technology, regardless of source

Courtesy Michael De Georgia & J. Michael Schmidt

Challenges inherent in Big Data Analytics
• Capture • Curation • Storage • Search • Sharing • Transfer • Analysis • Visualization

Courtesy of Susanna-Assunta Sansone, PhD
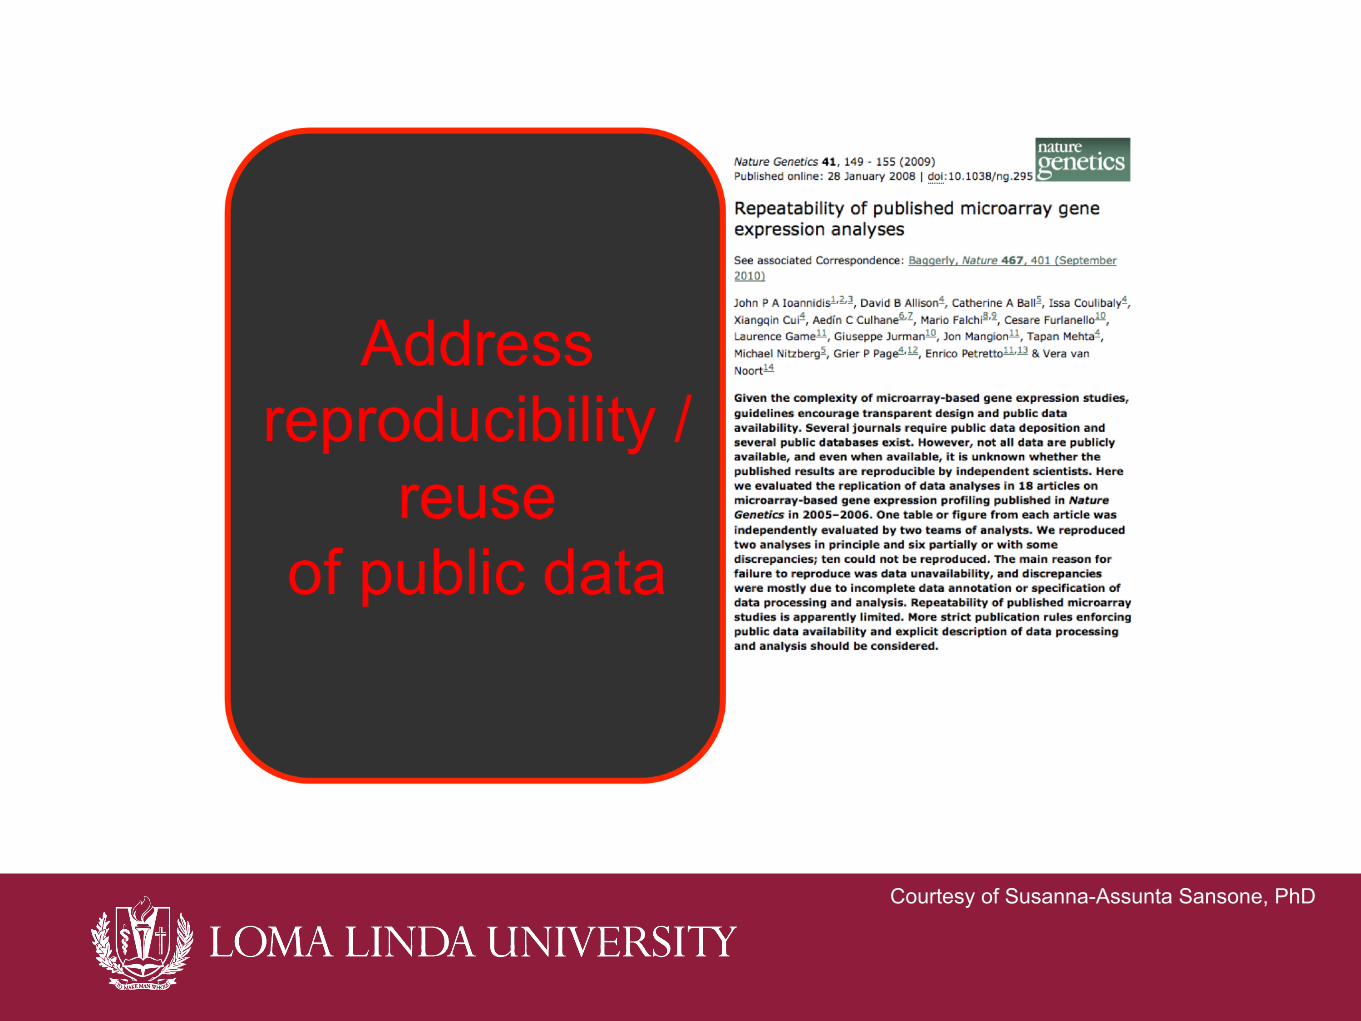
Courtesy of Susanna-Assunta Sansone, PhD

Courtesy of Susanna-Assunta Sansone, PhD

IPython interface
http://ipython.org
• Reproducible • Version controlled (git) • Interactive analysis

Challenges inherent in Big Data Analytics
• Capture • Curation • Storage • Search • Sharing • Transfer • Analysis • Visualization

Worldwide movement for FAIR data
Barend Mons and Susanna-Assunta Sansone
http://bd2k.nih.gov/workshops.html#ADDS

!"
Launched on May 27th, 2014
A new online-only publication for descriptions of scientifically valuable datasets in the life, environmental and biomedical sciences, but not limited to these
Credit for sharing your data
Focused on reuse and reproducibility
Peer reviewed, curated
Promoting Community Data Repositories
Open Access
Supported by:
Courtesy of Susanna-Assunta Sansone, PhD

Challenges inherent in Big Data Analytics
• Capture • Curation • Storage • Search • Sharing • Transfer • Analysis • Visualization

Data Processing
Decision Tree Analysis
Artificial Neural Network
Mechanistic Approaches
Graphical Approaches
Bayesian Network
Hierarchical Clustering
Probabilistic Approaches
Classical Statistical Inference
Bayesian Statistical Inference
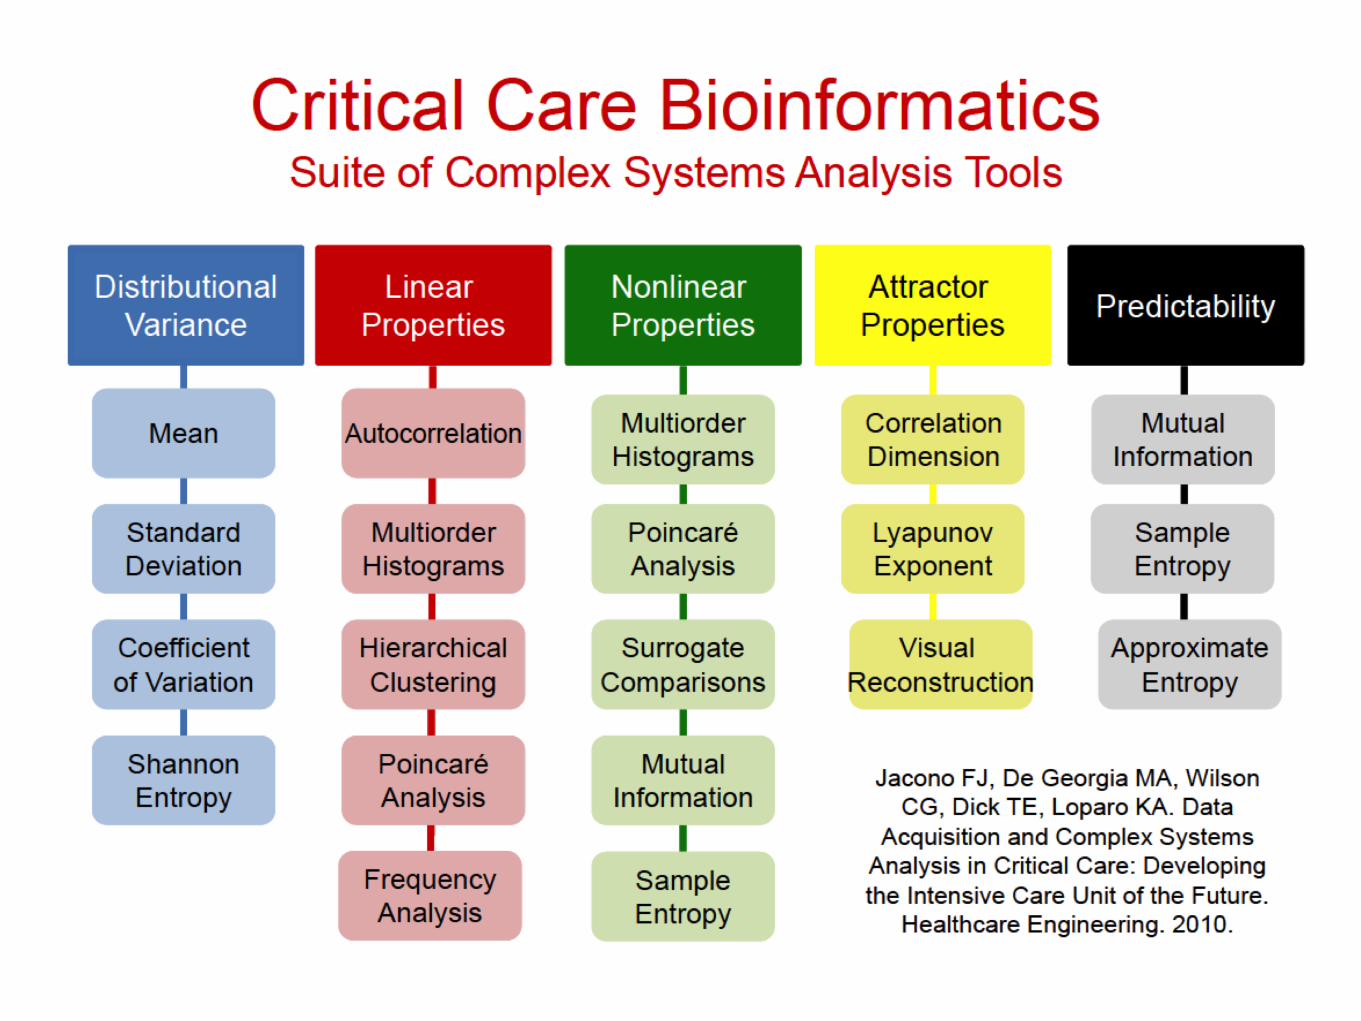
Complex Systems Analysis
Time Domain
Frequency Domain
Scale Invariant (Fractal) Analysis
Approximate Entropy
Integrated Patient
Database
Data Analysis Methods
Data Analysis Methods

Python as a data analytics environment

Advantages to using a Big Data approach
• Speed of data reduction and analysis • Visualization of complex data sets can be done relatively quickly • Capacity for storage and processing of vast data sets is inherent in the tool stack • Scalability of cloud/cluster storage • Potential for “Big Impact” on research and clinical care

Disadvantages to a Big Data approach
• Often not hypothesis driven (a fishing mission?) • Requires expensive computing technology depending upon data processing and storage needs • Requires significant programming skill to develop and use the tool stack • Typically requires “team based” data analysis and management (programmer, database manager, design/visualization person, etc.) • Just because you have lots of data, doesn’t mean you have an obvious or easy way to extract the information!

Summary
• We live in a data-rich era. • The data available to us is multi-modal and requires integration. • Data collection and integration can occur at many scales (bedside to institution) but the data must be converted into usable information. • Team-based science depends upon a wide range of data analytics skills. • Curation, reproducibility of and shared access to data is an ongoing challenge.

Where do you find your data analytics team members?

Syllabus Overview (10 week course)
Foundations 1: Using text editors, using the IPython notebook for data exploration, using version control software (git), using the class wiki. Foundations 2: Using IPython/NumPy/SciPy, importing and manipulating data with Pandas, data visualization in IPython. Analysis Methods: Basic signal theory overview, time-series data, plotting (lines, histograms, bars, etc.) dynamical systems analyses of data variability, information theory measures (entropy) of complexity, frequency domain/spectral measures (FFT, time-varying spectrum), wavelets. Handling Sequence data: Using R/Bioconductor, differences between mRNA-Seq, gene-array, proteomics, and deep-sequencing data, visualizing data from gene/RNA arrays. Data set storage and retrieval: Basics of relational databases, SQL vs. NOSQL, cloud storage/NAS/computing clusters, interfacing with Hadoop/MapReduce, metadata and ontology for biomedical/patient data (XML), using secure databases (REDCap). Data integrity and security: The Health Insurance Portability and Accountability Act (HIPAA) and what it means for data management, de-identifying patient data (handling PHI), data security best practices, making data available to the public—implications for data transparency and large-scale data mining.

Coalition Institutions

The coding Queen and her Court…
Abby Dobyns
Princesses of Python
Rhaya Johnson Regie Felix and Adaeze Anyanwu
And a Princeling….
Jamie Tillett

Acknowledgements
Loma Linda • Andy Hopper • Traci Marin • Charles Wang • Wilson Aruni • Valery Filippov CWRU • Michael De Georgia • Kenneth Loparo • Frank Jacono • Farhad Kaffashi My laboratory’s git repository:
UC Riverside • Thomas Girke
(Bioinformatics)
La Sierra University • Marvin Payne
CSU San Bernardino • Art Concepcion
(Bioinformatics)
UC Irvine • Alex Nicolau
(Comp Sci/Bioinf) https://github.com/drcgw/bass

Questions?!

Further reading
• Doing Data Science by Cathy O’Neil and Rachel Schutt • Data Analysis with Open-Source Tools by Philipp Janert • The Art of R Programming by Norman Matloff • R for Everyone by Jared P. Lander • Python for Data Analysis by Wes McKinney • Think Python by Allen B. Downey • Think Stats by Allen B. Downey • Think Complexity by Allen B. Downey • Every one of Edward Tufte’s books (The Visual Display of Quantitative Information, Visual Explanations, Envisioning Information, Beautiful Evidence)

Example: Patient physiology waveforms + EMR
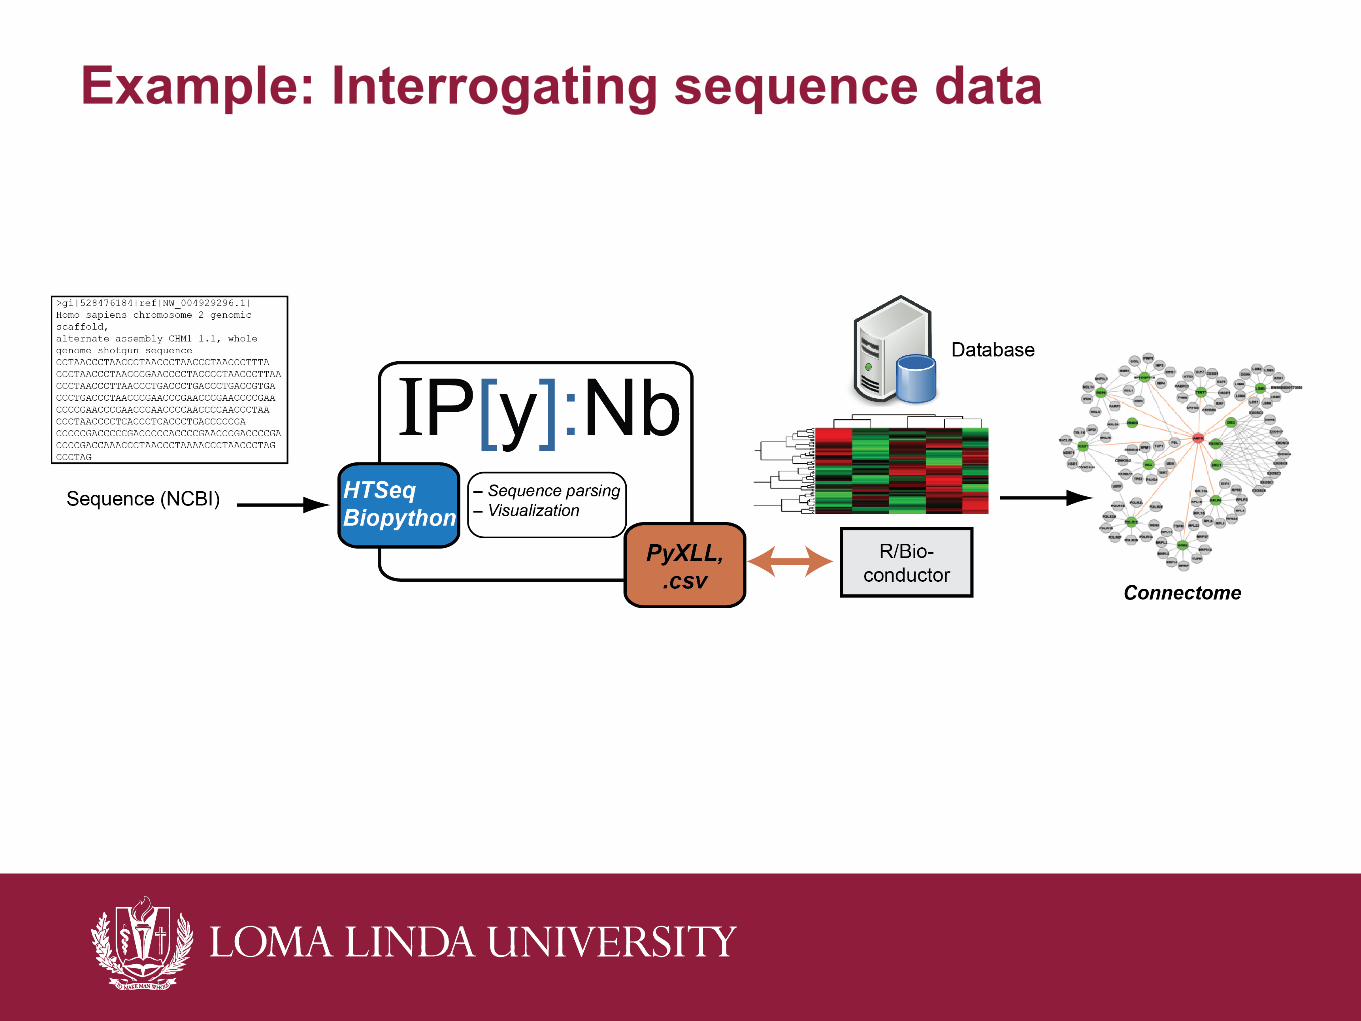
Example: Interrogating sequence data