Embed Size (px)
Citation preview
VITAMIN D MITIGATES DIABETIC AND OXIDATIVE STRESSES ON KIDNEY CELLS
Xinyi (Cindy) Chen
Research in Biology
North Carolina School of Science and Mathematics
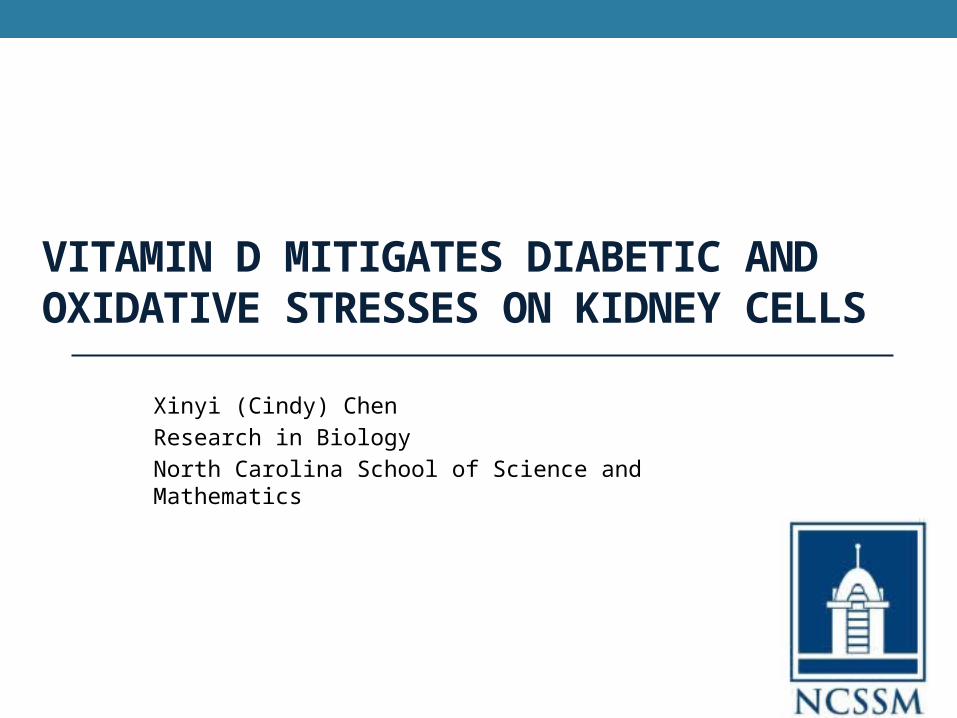
Background: Diabetes and P-glycoprotein
• Diabetes is now the seventh leading cause of death in the world.
• The elevated glucose levels due to diabetes yield a down regulation of P-glycoprotein, a membrane transporter that eliminates toxins from cells.
• P-glycoprotein plays a critical role in the absorption and elimination of drugs and toxins, so increasing the expression level of P-glycoprotein can delay or even prevent the onset of diabetes.
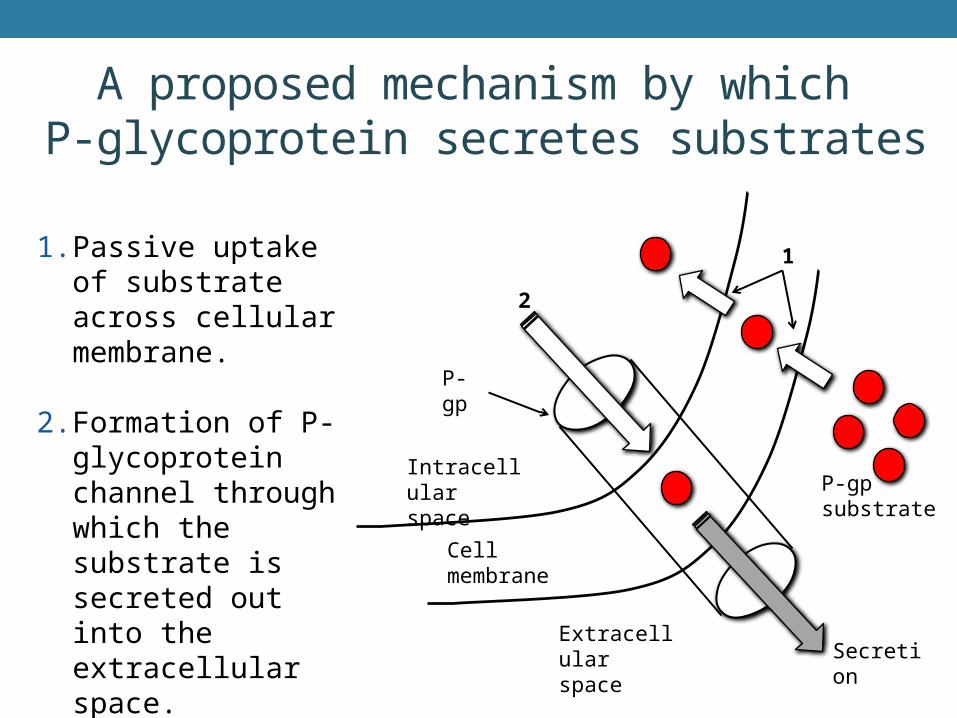
A proposed mechanism by which P-glycoprotein secretes substrates
2
P-gp substrate
1
P-gp
Cell membrane
Intracellular space
Extracellular space Secretion
1. Passive uptake of substrate across cellular membrane.
2. Formation of P-glycoprotein channel through which the substrate is secreted out into the extracellular space.
Background: Vitamin D
• The active form of vitamin D, calcitriol, has been shown to up regulate P-glycoprotein levels in the cell membrane.
• The effects of vitamin D on diabetes have not yet been tested on the kidney, an organ that can be damaged by high glucose levels.
• One of my goals was to determine if vitamin D can beneficially elevate P-glycoprotein expression levels to prevent diabetes by an in vitro study of canine kidney cells.
Background: Vitamin D and Hydrogen Peroxide
• Research has shown that reactive oxygen species (ROS) including hydrogen peroxide (H2O2) significantly reduce P-glycoprotein expression, but this reduction was later prevented by co-treatment with various antioxidants.
• Vitamin D can act as a membrane antioxidant, and this ability may be useful in counteracting the down regulation of P-glycoprotein expression induced by H2O2.
• Investigating this link between vitamin D and H2O2 can shed light on the mechanism that vitamin D takes to up regulate P-glycoprotein levels.
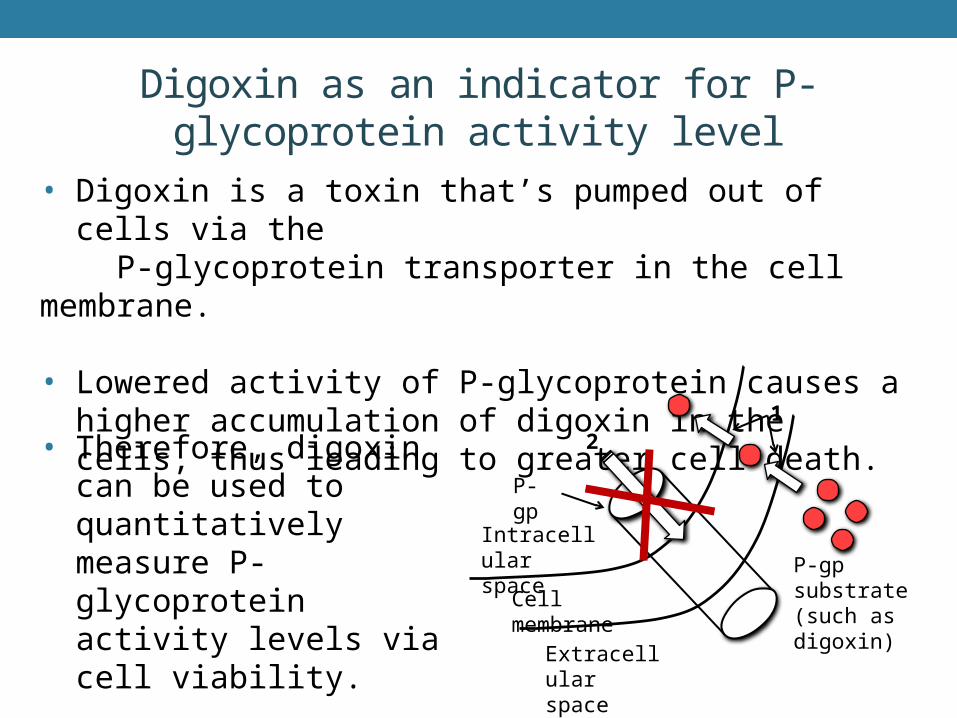
Digoxin as an indicator for P-glycoprotein activity level
• Digoxin is a toxin that’s pumped out of cells via the P-glycoprotein transporter in the cell membrane.
• Lowered activity of P-glycoprotein causes a higher accumulation of digoxin in the cells, thus leading to greater cell death.
2
P-gp substrate (such as digoxin)
1
P-gp
Cell membrane
Intracellular space
Extracellular space
• Therefore, digoxin can be used to quantitatively measure P-glycoprotein activity levels via cell viability.
Objectives
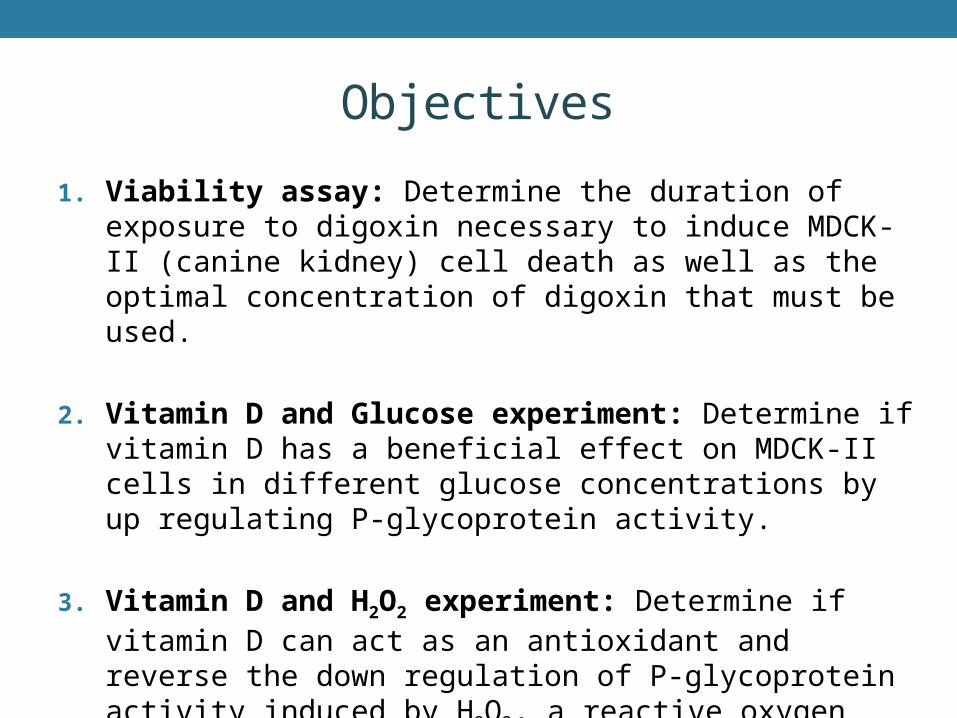
1. Viability assay: Determine the duration of exposure to digoxin necessary to induce MDCK-II (canine kidney) cell death as well as the optimal concentration of digoxin that must be used.
2. Vitamin D and Glucose experiment: Determine if vitamin D has a beneficial effect on MDCK-II cells in different glucose concentrations by up regulating P-glycoprotein activity.
3. Vitamin D and H2O2 experiment: Determine if vitamin D can act as an antioxidant and reverse the down regulation of P-glycoprotein activity induced by H2O2, a reactive oxygen species.
General Methods
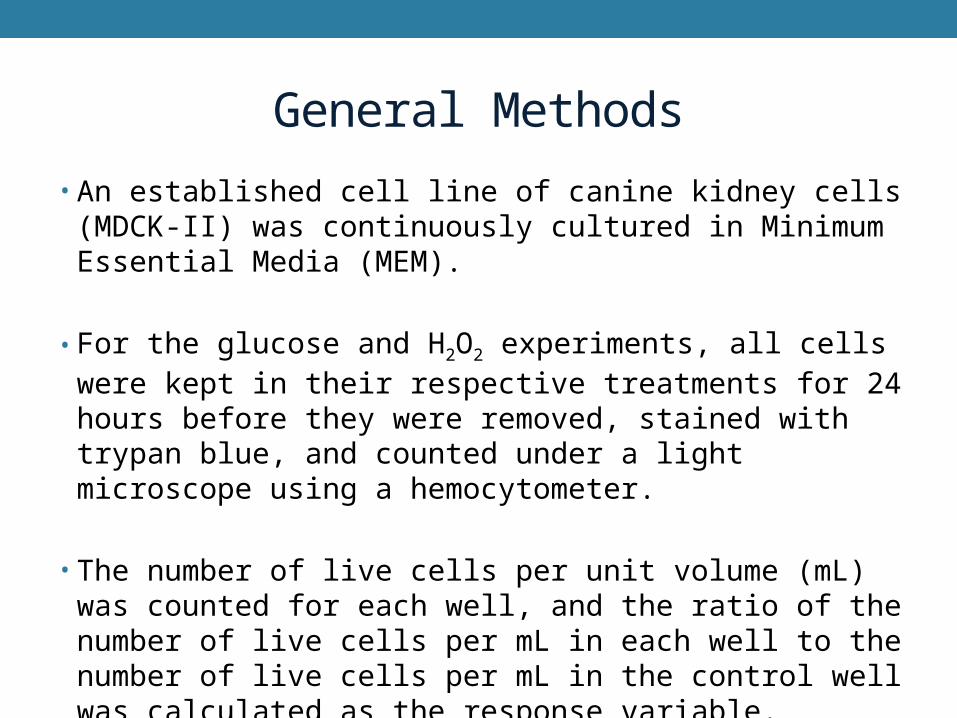
• An established cell line of canine kidney cells (MDCK-II) was continuously cultured in Minimum Essential Media (MEM).
• For the glucose and H2O2 experiments, all cells were kept in their respective treatments for 24 hours before they were removed, stained with trypan blue, and counted under a light microscope using a hemocytometer.
• The number of live cells per unit volume (mL) was counted for each well, and the ratio of the number of live cells per mL in each well to the number of live cells per mL in the control well was calculated as the response variable.
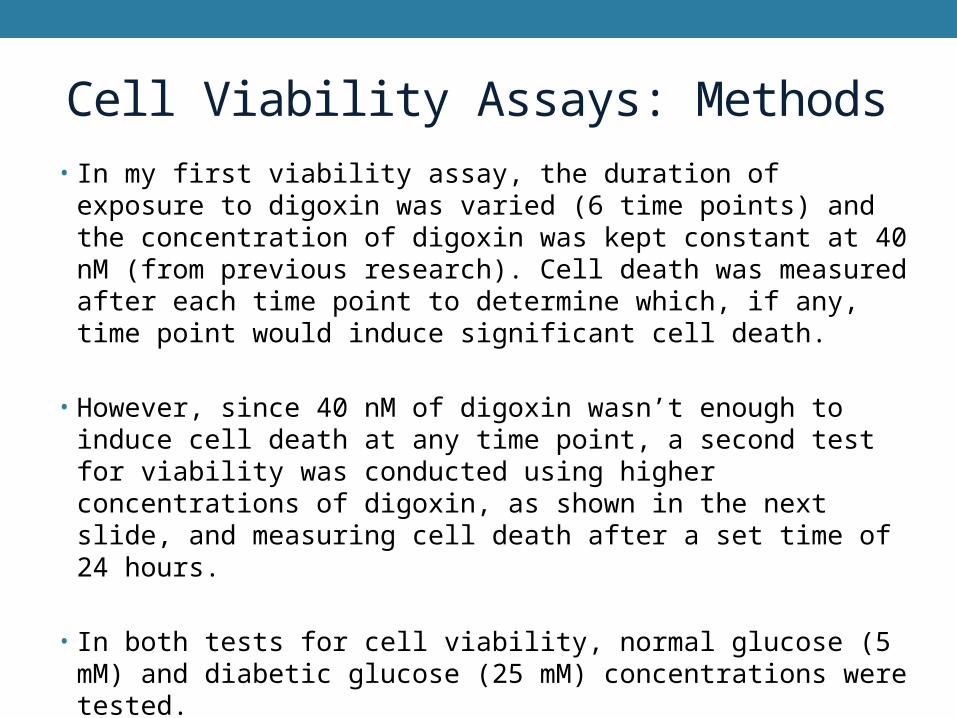
Cell Viability Assays: Methods• In my first viability assay, the duration of exposure to digoxin was
varied (6 time points) and the concentration of digoxin was kept constant at 40 nM (from previous research). Cell death was measured after each time point to determine which, if any, time point would induce significant cell death.
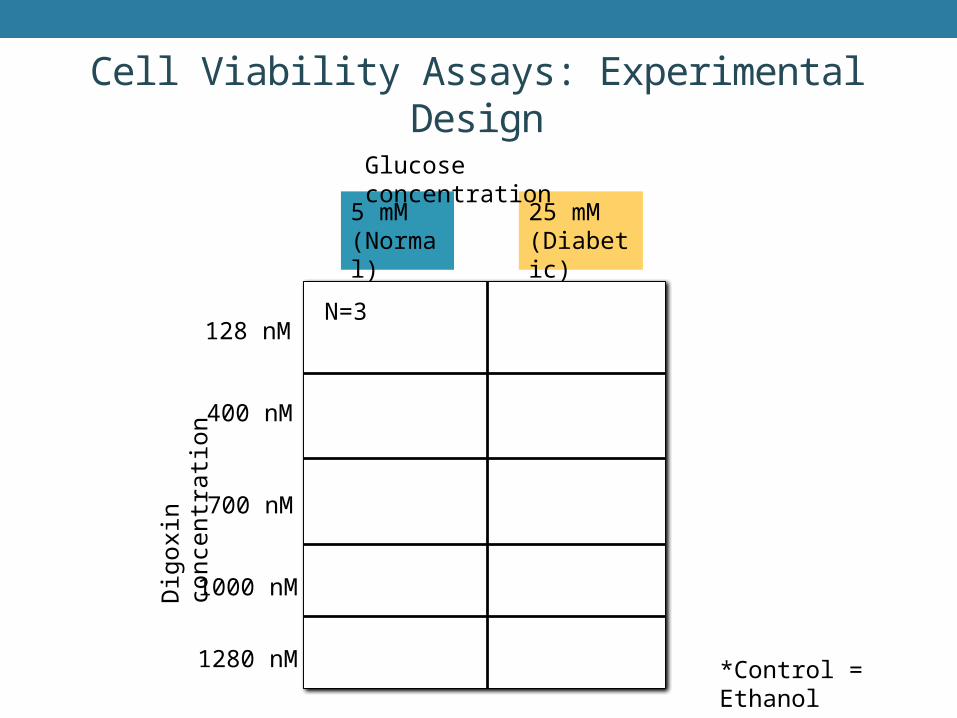
• However, since 40 nM of digoxin wasn’t enough to induce cell death at any time point, a second test for viability was conducted using higher concentrations of digoxin, as shown in the next slide, and measuring cell death after a set time of 24 hours.
• In both tests for cell viability, normal glucose (5 mM) and diabetic glucose (25 mM) concentrations were tested.
• Photos were taken and analyzed using Fiji software to indicate live cell density.
5 mM(Normal)
25 mM(Diabetic)
Glucose concentration
128 nM
Dig
oxin
con
cent
ratio
n
400 nM
700 nM
1000 nM
1280 nM
N=3
Cell Viability Assays: Experimental Design
*Control = Ethanol
Cell Viability Assays: Results
EtOH
700 nM 1000 nM
1280 nM
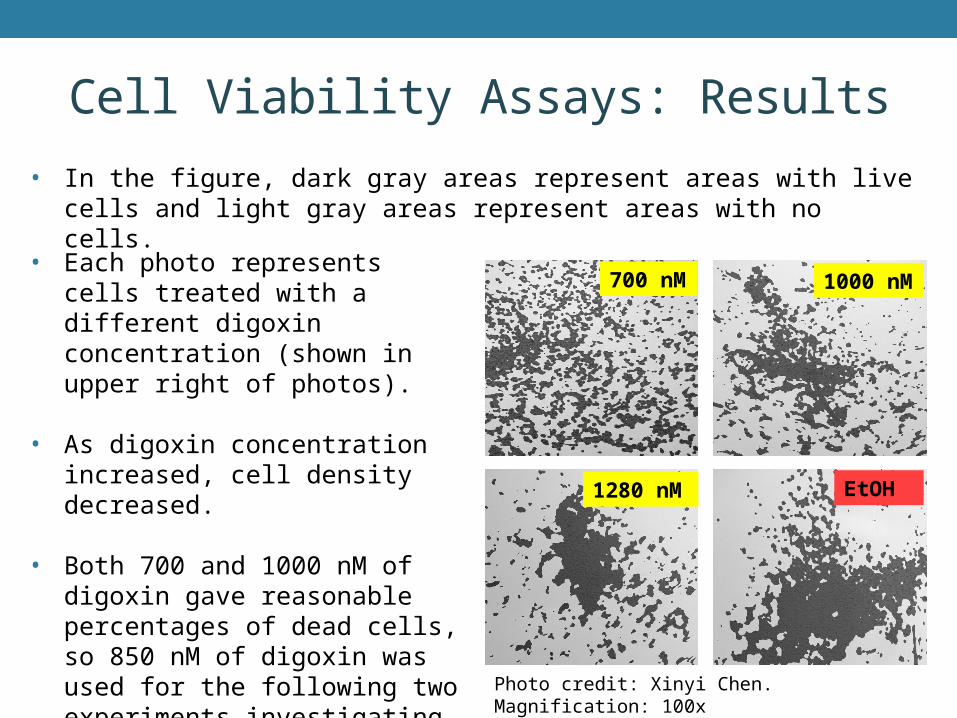
• Each photo represents cells treated with a different digoxin concentration (shown in upper right of photos).
• As digoxin concentration increased, cell density decreased.
• Both 700 and 1000 nM of digoxin gave reasonable percentages of dead cells, so 850 nM of digoxin was used for the following two experiments investigating glucose and H2O2.
• In the figure, dark gray areas represent areas with live cells and light gray areas represent areas with no cells.
Photo credit: Xinyi Chen. Magnification: 100x
Vitamin D and Glucose: Methods
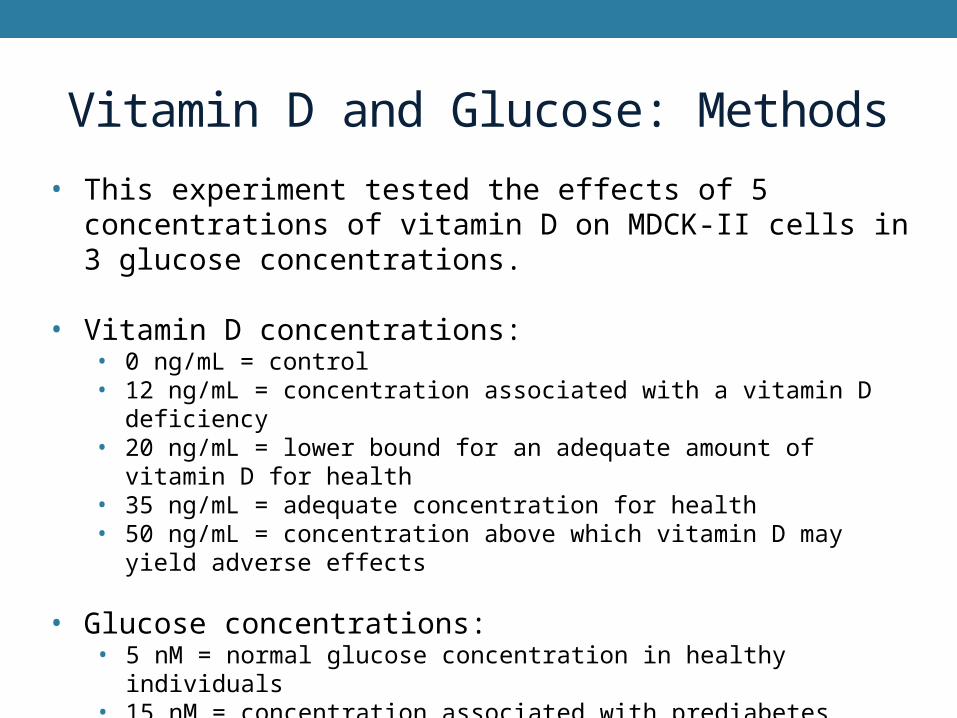
• This experiment tested the effects of 5 concentrations of vitamin D on MDCK-II cells in 3 glucose concentrations.
• Vitamin D concentrations:• 0 ng/mL = control• 12 ng/mL = concentration associated with a vitamin D deficiency• 20 ng/mL = lower bound for an adequate amount of vitamin D for health• 35 ng/mL = adequate concentration for health• 50 ng/mL = concentration above which vitamin D may yield adverse effects
• Glucose concentrations:• 5 nM = normal glucose concentration in healthy individuals• 15 nM = concentration associated with prediabetes• 25 nM = concentration associated with diabetes
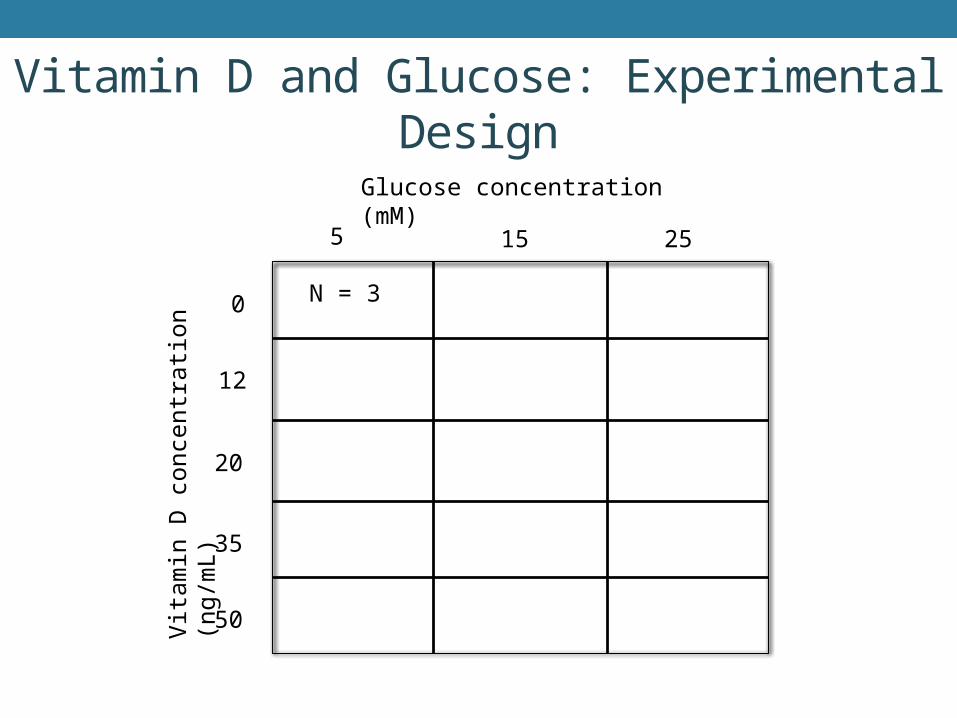
Vitamin D and Glucose: Experimental Design
N = 3
5 25
12
20
50
35
15
Vita
min
D c
once
ntra
tion
(ng/
mL)
Glucose concentration (mM)
0
Vitamin D and Glucose: Results
0 12 20 35 500
1
2
3
4
5 mM glucose15 mM glucose25 mM glucose
vitamin D concentration (ng/mL)
pro
po
rtio
n o
f li
ve
ce
lls
, re
lati
ve
to
co
ntr
ol
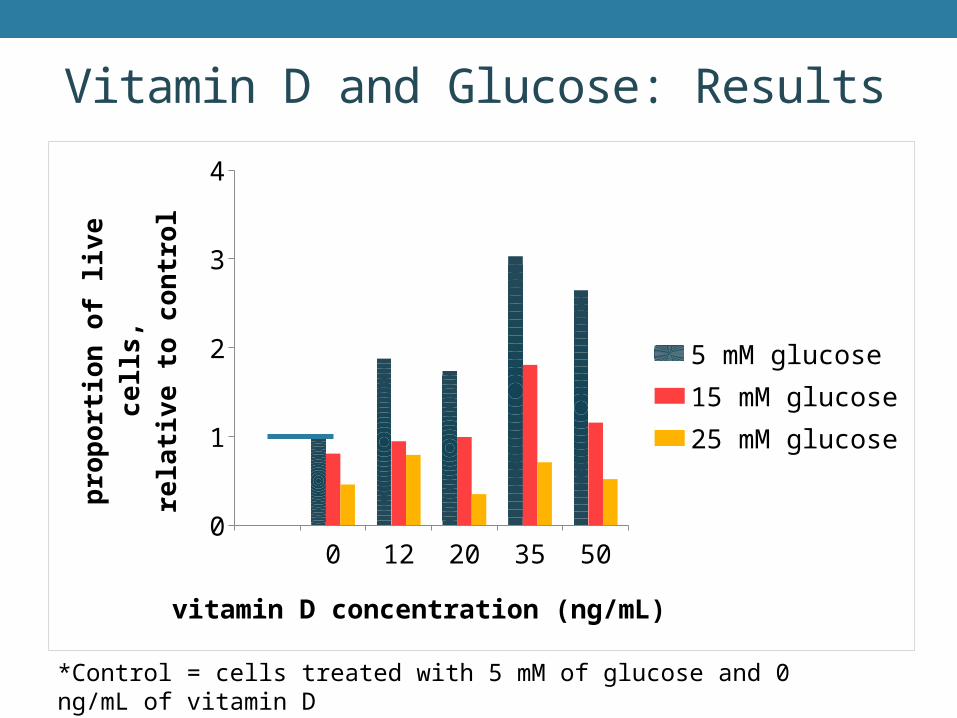
*Control = cells treated with 5 mM of glucose and 0 ng/mL of vitamin D
Vitamin D and Glucose: Results
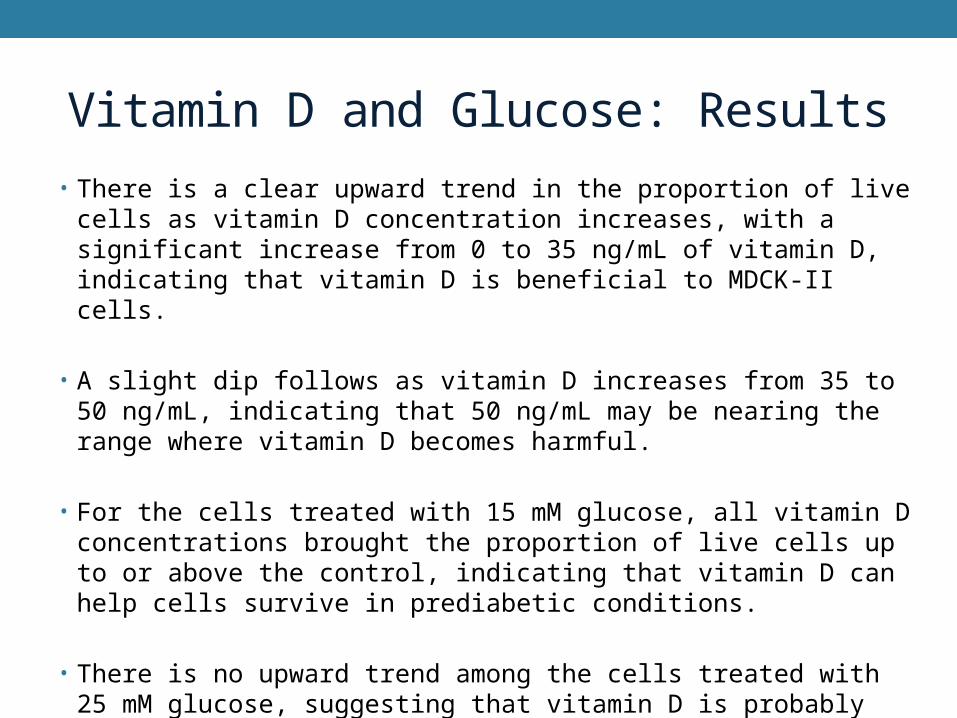
• There is a clear upward trend in the proportion of live cells as vitamin D concentration increases, with a significant increase from 0 to 35 ng/mL of vitamin D, indicating that vitamin D is beneficial to MDCK-II cells.
• A slight dip follows as vitamin D increases from 35 to 50 ng/mL, indicating that 50 ng/mL may be nearing the range where vitamin D becomes harmful.
• For the cells treated with 15 mM glucose, all vitamin D concentrations brought the proportion of live cells up to or above the control, indicating that vitamin D can help cells survive in prediabetic conditions.
• There is no upward trend among the cells treated with 25 mM glucose, suggesting that vitamin D is probably not an effective diabetes treatment when glucose levels are high but more so as a prevention strategy when glucose levels are lower.
Vitamin D and H2O2: Methods
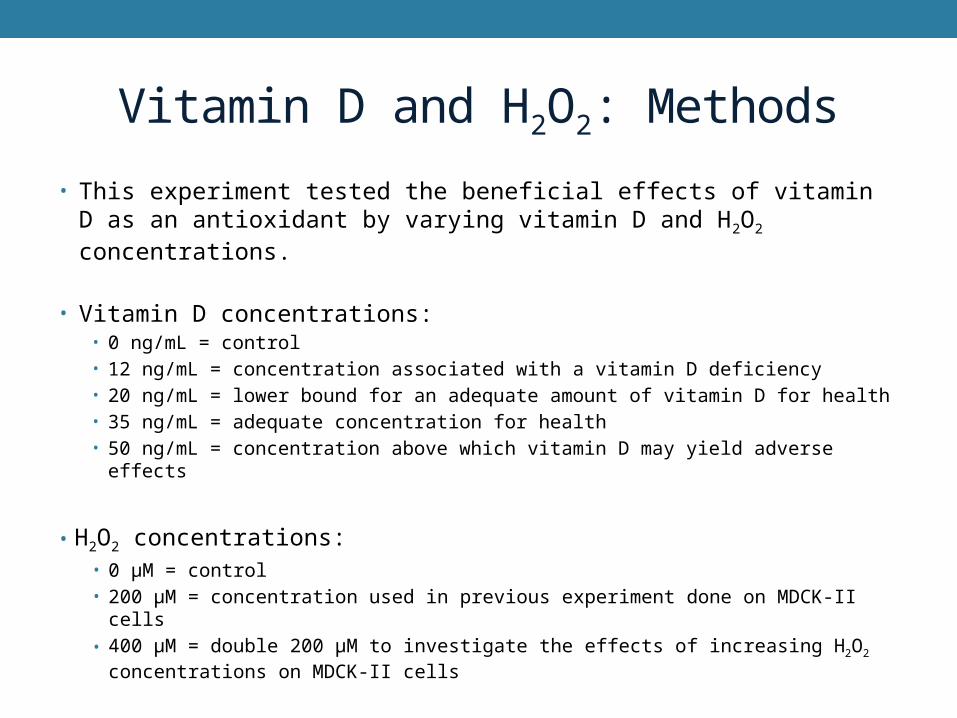
• This experiment tested the beneficial effects of vitamin D as an antioxidant by varying vitamin D and H2O2 concentrations.
• Vitamin D concentrations:• 0 ng/mL = control• 12 ng/mL = concentration associated with a vitamin D deficiency• 20 ng/mL = lower bound for an adequate amount of vitamin D for health• 35 ng/mL = adequate concentration for health• 50 ng/mL = concentration above which vitamin D may yield adverse effects
• H2O2 concentrations: • 0 μM = control• 200 μM = concentration used in previous experiment done on MDCK-II cells• 400 μM = double 200 μM to investigate the effects of increasing H2O2
concentrations on MDCK-II cells
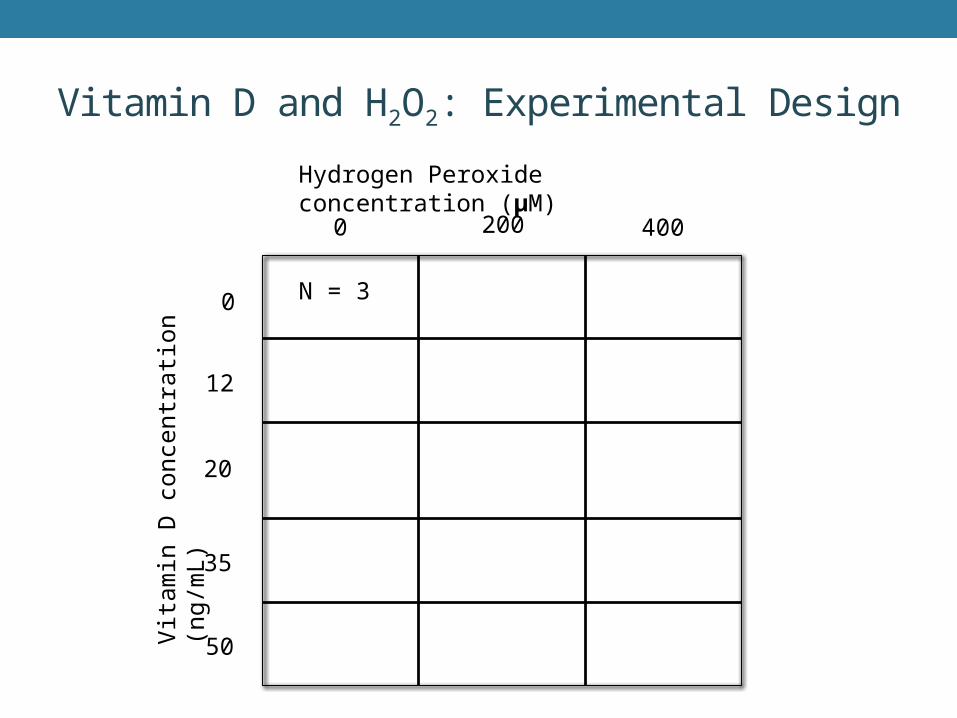
Vitamin D and H2O2: Experimental Design
N = 3
0
12
20
50
35
Vita
min
D c
once
ntra
tion
(ng/
mL)
Hydrogen Peroxide concentration (μM)
200 400
0
Vitamin D and H2O2: Results
0 12 20 35 500
1
2
3
4
5
0 μM H2O2200 μM H2O2400 μM H2O2
vitamin D concentration (ng/mL)
pro
po
rtio
n o
f li
ve
ce
lls
. re
lati
ve
to
co
ntr
ol
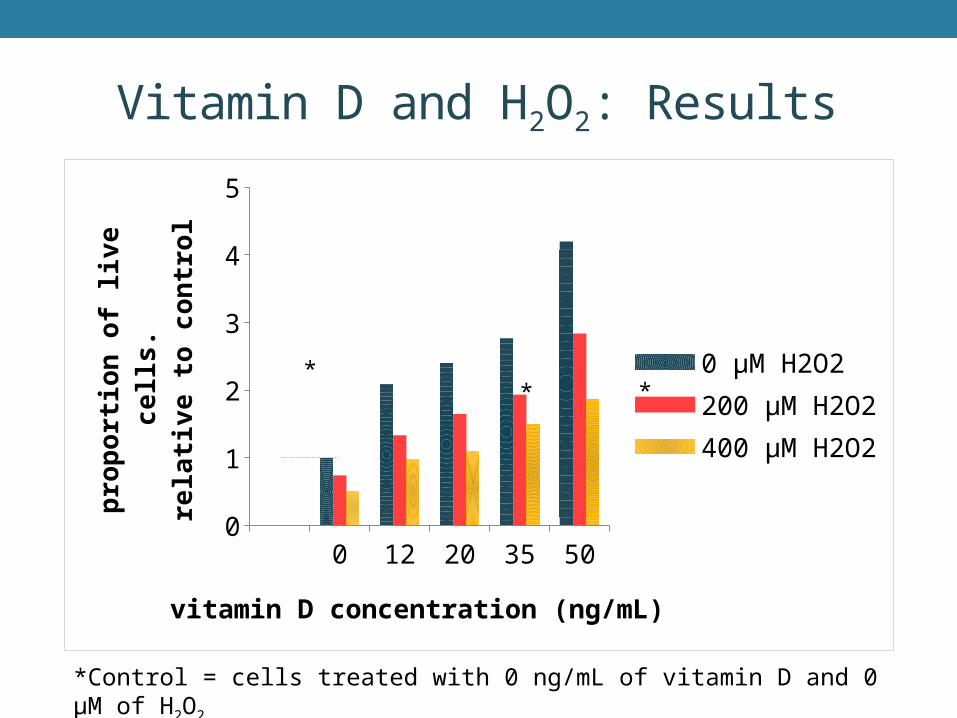
*Control = cells treated with 0 ng/mL of vitamin D and 0 μM of H2O2
** *
Vitamin D and H2O2: Results
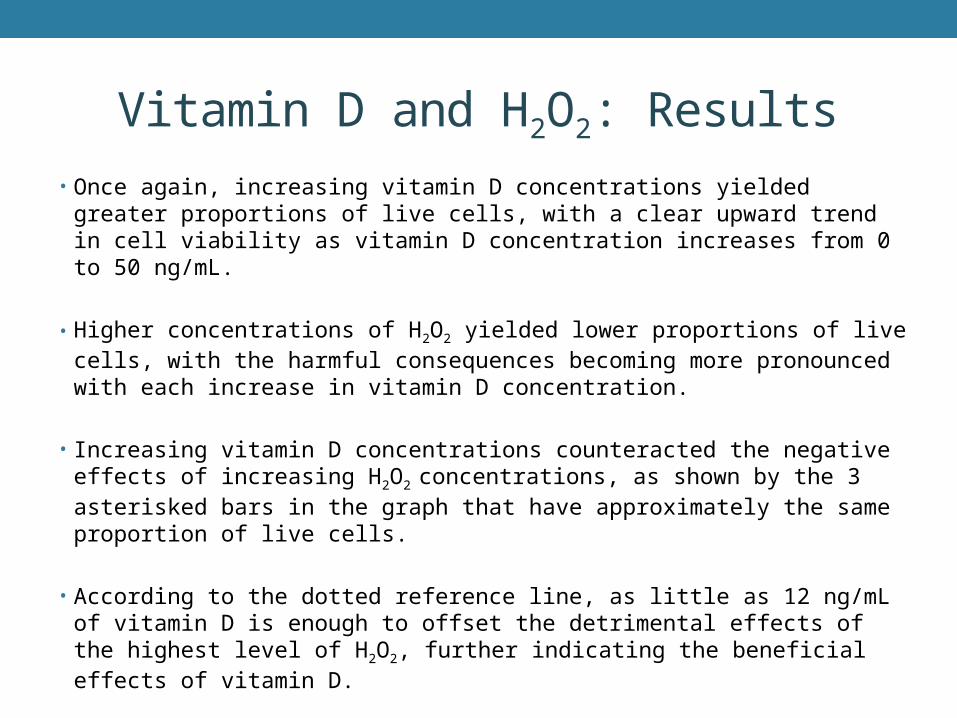
• Once again, increasing vitamin D concentrations yielded greater proportions of live cells, with a clear upward trend in cell viability as vitamin D concentration increases from 0 to 50 ng/mL.
• Higher concentrations of H2O2 yielded lower proportions of live cells, with the harmful consequences becoming more pronounced with each increase in vitamin D concentration.
• Increasing vitamin D concentrations counteracted the negative effects of increasing H2O2 concentrations, as shown by the 3 asterisked bars in the graph that have approximately the same proportion of live cells.
• According to the dotted reference line, as little as 12 ng/mL of vitamin D is enough to offset the detrimental effects of the highest level of H2O2, further indicating the beneficial effects of vitamin D.
Conclusions
2
P-gp substrate (such as digoxin)
1
P-gp
Cell membrane
Intracellular space
Extracellular space
Secretion
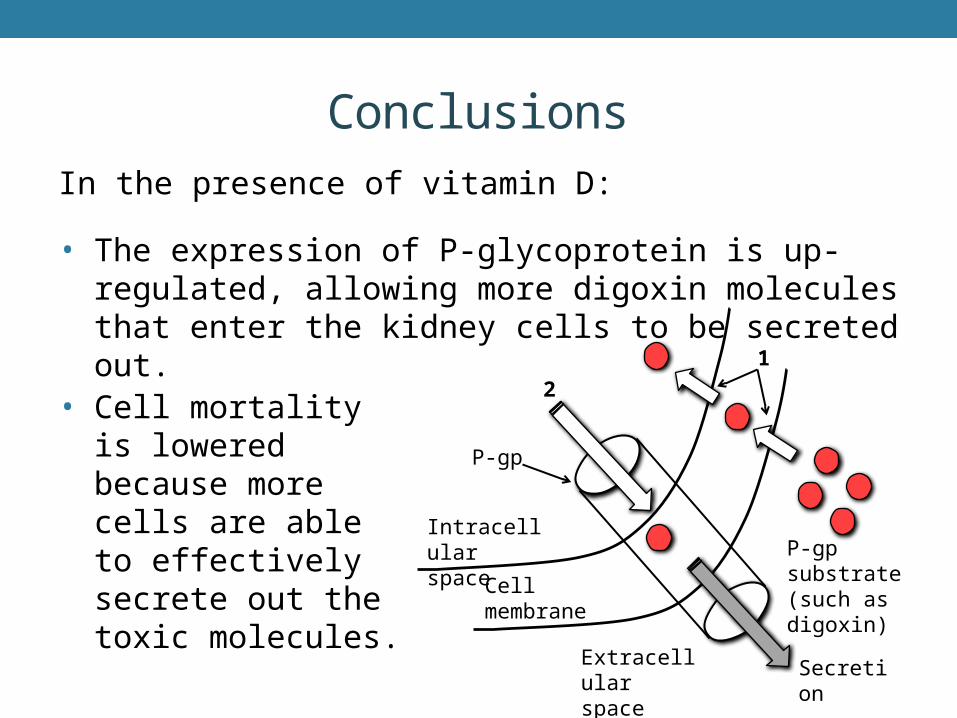
In the presence of vitamin D:
• The expression of P-glycoprotein is up-regulated, allowing more digoxin molecules that enter the kidney cells to be secreted out.
• Cell mortality is lowered because more cells are able to effectively secrete out the toxic molecules.
Conclusions
• Higher vitamin D concentrations generally yielded less cell death, thus implying increased expression of P-glycoprotein; however, there is an optimal concentration of approximately 35 ng/mL of vitamin D.
• Vitamin D had a more beneficial effect on cells treated with 5 mM and 15 mM glucose than with 25 mM glucose.
• Vitamin D, as an antioxidant, neutralizes the down regulating effects of H2O2, with increasing levels of vitamin D counteracting the negative effects of increasing H2O2 concentrations.
• Vitamin D can potentially be used as a supplement to delay or prevent the onset of diabetes by up-regulating P-glycoprotein expression through the same mechanism that H2O2, a ROS, takes to down regulate P-glycoprotein activity levels.
Future Work
• Measure the percentage of live or dead cells in each well rather than just counting the number of live cells in each well and dividing it by the number of live cells in the control well.
• Focus on a narrower range of vitamin D concentrations around 35 ng/mL in smaller gradations, since 35 ng/mL appears to be approximately the optimal concentration.
• Study the mechanisms of vitamin D at the expression and transcription levels using molecular biology techniques.
• Use human kidney cells, instead of canine kidney cells, to gain a more accurate picture of how vitamin D affects P-glycoprotein levels in humans.

Acknowledgments
• Dr. Amy Sheck, Dean of Science at NCSSM• Ms. Korah Wiley, Instructor of Biology at NCSSM• Dr. Floyd Bullard, Instructor of Mathematics at NCSSM• Research in Biology Class of 2014• Research in Biology Class of 2015• Glaxo endowment at NCSSM
Works Cited1. American Diabetes Association. Statistics About Diabetes. 2014. http
://www.diabetes.org/diabetes-basics/statistics/. Accessed 7/15/14.
2. Chow, E., M. Durk, C. Cummins, and K. Pang. 2011. 1α, 25-Dihydroxyvitamin D3 up-regulates P-glycoprotein via the vitamin D receptor and not farnesoid X receptor in both fxr(-/-) and fxr(+/+) mice and increased renal and brain efflux of digoxin in mice in vivo. The Journal of Pharmacology and Experimental Therapeutics 337: 846-859.
3. Matheny, C., M. Lamb, K. Brouwer, and G. Pollack. 2001. Pharmacokinetic and pharmacodynamic implications of P-glycoprotein modulation. Pharmacotherapy 21: 778-796.
4. Qiu, J., H. Gao, Y. Liang, H. Yu, and R. Zhou. 2008. Comparative proteomics analysis reveals role of heat shock protein 60 in digoxin-induced toxicity in human endothelial cells. Biochimica et Biophysica Acta 1784: 1857-1864.
5. Yeh, S., H. Pan, C. Lin, Y. Kao, Y. Chen, and C. Lin. 2012. Hyperglycemia induced down regulation of renal P-glycoprotein expression. European Journal of Pharmacology 690: 42-50.